
Characterization of a 3D optrode array for infrared neural ... · Characterization of a 3D optrode...
20
Characterization of a 3D optrode array for infrared neural stimulation T.V.F. Abaya, 1 M. Diwekar, 1 S. Blair, 1,2,* P. Tathireddy, 1 L. Rieth, 1 G.A. Clark, 2 and F. Solzbacher 1,2 1 Department of Electrical and Computer Engineering, University of Utah, Salt Lake City, Utah 84112, USA 2 Department of BioEngineering, University of Utah, Salt Lake City, Utah 84112, USA * [email protected] Abstract: This paper characterizes the Utah Slant Optrode Array (USOA) as a means to deliver infrared light deep into tissue. An undoped crystalline silicon (100) substrate was used to fabricate 10 × 10 arrays of optrodes with rows of varying lengths from 0.5 mm to 1.5 mm on a 400-μ m pitch. Light delivery from optical fibers and loss mechanisms through these Si optrodes were characterized, with the primary loss mechanisms being Fresnel reflec- tion, coupling, radiation losses from the tapered shank and total internal reflection in the tips. Transmission at the optrode tips with different optical fiber core diameters and light in-coupling interfaces was investigated. At λ = 1.55 μ m, the highest optrode transmittance of 34.7%, relative to the optical fiber output power, was obtained with a 50-μ m multi-mode fiber butt-coupled to the optrode through an intervening medium of index n = 1.66. Maximum power is directed into the optrodes when using fibers with core diameters of 200 μ m or less. In addition, the output power varied with the optrode length/taper such that longer and less tapered optrodes exhibited higher light transmission efficiency. Output beam profiles and potential impacts on physiological tests were also examined. Future work is expected to improve USOA efficiency to greater than 64%. © 2012 Optical Society of America OCIS codes: (170.3890) Medical optics instrumentation; (220.4610) Optical fabrication; (230.7380) Waveguides, channeled; (260.3060) Infrared. References and links 1. X. Navarro, T. B. Krueger, N. Lago, S. Micera, T. Stieglitz, and P. Dario, “A critical review of interfaces with the peripheral nervous system for the control of neuroprostheses and hybrid bionic systems,” J. Peripher. Nerv. Syst. 10, 229–258 (2005). 2. A. Branner, R. B. Stein, and R. A. Normann, “Selective stimulation of cat sciatic nerve using an array of varying- length microelectrodes,” J. Neurophysiol. 85, 1585–1594 (2001). 3. A. Branner, R. Stein, E. Fernandez, Y. Aoyagi, and R. Normann, “Long-term stimulation and recording with a penetrating microelectrode array in cat sciatic nerve,” IEEE T. Bio-Med. Eng. 51, 146–157 (2004). 4. R. A. Normann, B. R. Dowden, M. A. Frankel, A. M. Wilder, S. D. Hiatt, N. M. Ledbetter, D. A. Warren, and G. A. Clark, “Coordinated, multi-joint, fatigue-resistant feline stance produced with intrafascicular hind limb nerve stimulation,” J. Neural Eng. 9, 026019 (2012). 5. M. Frankel, B. Dowden, V. Mathews, R. Normann, G. Clark, and S. Meek, “Multiple-input single-output closed- loop isometric force control using asynchronous intrafascicular multi-electrode stimulation,” IEEE T. Neur. Sys. Reh. 19, 325–332 (2011). 6. P. Tathireddy, D. Rakwal, E. Bamberg, and F. Solzbacher, “Fabrication of 3-dimensional silicon microelectrode arrays using micro electro discharge machining for neural applications,” in Proceedings of the International Conference on Solid-State Sensors, Actuators and Microsystems (Transducers) (IEEE, 2009), pp. 1206–1209. (C) 2012 OSA 1 September 2012 / Vol. 3, No. 9 / BIOMEDICAL OPTICS EXPRESS 2200 #168581 - $15.00 USD Received 15 May 2012; revised 8 Aug 2012; accepted 10 Aug 2012; published 24 Aug 2012
Transcript of Characterization of a 3D optrode array for infrared neural ... · Characterization of a 3D optrode...
Characterization of a 3D optrode arrayfor infrared neural stimulation
T.V.F. Abaya,1 M. Diwekar,1 S.Blair, 1,2,* P. Tathireddy,1 L. Rieth,1
G.A. Clark, 2 and F. Solzbacher1,2
1Department of Electrical and Computer Engineering, University of Utah,Salt Lake City, Utah 84112, USA
2Department of BioEngineering, University of Utah, Salt Lake City, Utah 84112, USA* [email protected]
Abstract: Thispapercharacterizes the Utah Slant Optrode Array (USOA)as a means to deliver infrared light deep into tissue. An undoped crystallinesilicon (100) substrate was used to fabricate 10×10 arrays of optrodes withrows of varying lengths from 0.5 mm to 1.5 mm on a 400-µm pitch. Lightdelivery from optical fibers and loss mechanisms through these Si optrodeswere characterized, with the primary loss mechanisms being Fresnel reflec-tion, coupling, radiation losses from the tapered shank and total internalreflection in the tips. Transmission at the optrode tips with different opticalfiber core diameters and light in-coupling interfaces was investigated.At λ = 1.55µm, the highest optrode transmittance of 34.7%, relative tothe optical fiber output power, was obtained with a 50-µm multi-modefiber butt-coupled to the optrode through an intervening medium of indexn = 1.66. Maximum power is directed into the optrodes when using fiberswith core diameters of 200µm or less. In addition, the output power variedwith the optrode length/taper such that longer and less tapered optrodesexhibited higher light transmission efficiency. Output beam profiles andpotential impacts on physiological tests were also examined. Future work isexpected to improve USOA efficiency to greater than 64%.
© 2012 Optical Society of America
OCIS codes: (170.3890) Medical optics instrumentation; (220.4610) Optical fabrication;(230.7380) Waveguides, channeled; (260.3060) Infrared.
References and links1. X. Navarro, T. B. Krueger, N. Lago, S. Micera, T. Stieglitz, and P. Dario, “A critical review of interfaces with the
peripheral nervous system for the control of neuroprostheses and hybrid bionic systems,” J. Peripher. Nerv. Syst.10, 229–258 (2005).
2. A. Branner, R. B. Stein, and R. A. Normann, “Selective stimulation of cat sciatic nerve using an array of varying-length microelectrodes,” J. Neurophysiol.85, 1585–1594 (2001).
3. A. Branner, R. Stein, E. Fernandez, Y. Aoyagi, and R. Normann, “Long-term stimulation and recording with apenetrating microelectrode array in cat sciatic nerve,” IEEE T. Bio-Med. Eng.51, 146–157 (2004).
4. R. A. Normann, B. R. Dowden, M. A. Frankel, A. M. Wilder, S. D. Hiatt, N. M. Ledbetter, D. A. Warren, andG. A. Clark, “Coordinated, multi-joint, fatigue-resistant feline stance produced with intrafascicular hind limbnerve stimulation,” J. Neural Eng.9, 026019 (2012).
5. M. Frankel, B. Dowden, V. Mathews, R. Normann, G. Clark, and S. Meek, “Multiple-input single-output closed-loop isometric force control using asynchronous intrafascicular multi-electrode stimulation,” IEEE T. Neur. Sys.Reh.19, 325–332 (2011).
6. P. Tathireddy, D. Rakwal, E. Bamberg, and F. Solzbacher, “Fabrication of 3-dimensional silicon microelectrodearrays using micro electro discharge machining for neural applications,” inProceedings of the InternationalConference on Solid-State Sensors, Actuators and Microsystems (Transducers)(IEEE, 2009), pp. 1206–1209.
(C) 2012 OSA 1 September 2012 / Vol. 3, No. 9 / BIOMEDICAL OPTICS EXPRESS 2200#168581 - $15.00 USD Received 15 May 2012; revised 8 Aug 2012; accepted 10 Aug 2012; published 24 Aug 2012

7. R. Normann, D. McDonnall, G. Clark, R. Stein, and A. Branner, “Physiological activation of the hind limbmuscles of the anesthetized cat using the Utah Slanted Electrode Array,” inProceedings of IEEE InternationalJoint Conference on Neural Networks(IEEE, 2005), pp. 3103–3108.
8. J. A. McNulty, “Histology part 6: Neural tissue, http://zoomify.lumc.edu/histonew/neuro/neuromain.htm” .9. J. Wells, C. Kao, K. Mariappan, J. Albea, E. D. Jansen, P. Konrad, and A. Mahadevan-Jansen, “Optical stimula-
tion of neural tissue in vivo,” Opt. Lett.30, 504–506 (2005).10. J. Wells, C. Kao, P. Konrad, T. Milner, J. Kim, A. Mahadevan-Jansen, and E. D. Jansen, “Biophysical mechanisms
of transient optical stimulation of peripheral nerve,” Biophys. J.93, 2567–2580 (2007).11. M. G. Shapiro, K. Homma, S. Villarreal, C.-P. Richter, and F. Bezanilla, “Infrared light excites cells by changing
their electrical capacitance,” Nat. Commun.3, 736 (2012).12. J. Wells, P. Konrad, C. Kao, E. D. Jansen, and A. Mahadevan-Jansen, “Pulsed laser versus electrical energy for
peripheral nerve stimulation,” J. Neurosci. Methods163, 326–337 (2007).13. J. Wells, C. Kao, E. D. Jansen, P. Konrad, and A. Mahadevan-Jansen, “Application of infrared light for in vivo
neural stimulation,” J. Biomed. Opt.10, 064003 (2005).14. R. G. McCaughey, C. Chlebicki, and B. J. Wong, “Novel wavelengths for laser nerve stimulation,” Lasers Surg.
Med.42, 69–75 (2010).15. N. Fried, S. Rais-Bahrami, G. Lagoda, A.-Y. Chuang, L.-M. Su, and A. Burnett, “Identification and imaging of
the nerves responsible for erectile function in rat prostate, in vivo, using optical nerve stimulation and opticalcoherence tomography,” IEEE J. Sel. Topics in Quantum Electron.13, 1641–1645 (2007).
16. A. Izzo, J. Walsh, E. Jansen, M. Bendett, J. Webb, H. Ralph, and C.-P. Richter, “Optical parameter variability inlaser nerve stimulation: A study of pulse duration, repetition rate, and wavelength,” IEEE T. Bio-Med. Eng.54,1108–1114 (2007).
17. J. M. Cayce, R. M. Friedman, E. D. Jansen, A. Mahavaden-Jansen, and A. W. Roe, “Pulsed infrared light altersneural activity in rat somatosensory cortex in vivo,” Neuroimage57, 155–166 (2011).
18. J. Zhang, F. Laiwalla, J. A. Kim, H. Urabe, R. V. Wagenen, Y.-K. Song, B. W. Connors, F. Zhang, K. Deisseroth,and A. V. Nurmikko, “Integrated device for optical stimulation and spatiotemporal electrical recording of neuralactivity in light-sensitized brain tissue,” J. Neural Eng.6, 055007 (2009).
19. J. Wang, F. Wagner, D. A. Borton, J. Zhang, I. Ozden, R. D. Burwell, A. V. Nurmikko, R. van Wagenen, I. Diester,and K. Deisseroth, “Integrated device for combined optical neuromodulation and electrical recording for chronicin vivo applications,” J. Neural Eng.9, 016001 (2012).
20. S. Royer, B. V. Zemelman, M. Barbic, A. Losonczy, G. Buzski, and J. C. Magee, “Multi-array silicon probeswith integrated optical fibers: light-assisted perturbation and recording of local neural circuits in the behavinganimal.” Eur. J. Neurosci.31, 2279–2291 (2010).
21. A. V. Kravitz and A. C. Kreitzer, “Optogenetic manipulation of neural circuitry in vivo.” Curr. Opin. Neurobiol.21, 433–439 (2011).
22. A. V. Kravitz, B. S. Freeze, P. R. L. Parker, K. Kay, M. T. Thwin, K. Deisseroth, and A. C. Kreitzer, “Regulationof parkinsonian motor behaviours by optogenetic control of basal ganglia circuitry,” Nature466, 622–626 (2010).
23. V. Gradinaru, K. R. Thompson, F. Zhang, M. Mogri, K. Kay, M. B. Schneider, and K. Deisseroth, “Targeting andreadout strategies for fast optical neural control in vitro and in vivo.” J. Neurosci.27, 14231–14238 (2007).
24. A. N. Zorzos, E. S. Boyden, and C. G. Fonstad, “Multiwaveguide implantable probe for light delivery to sets ofdistributed brain targets,” Opt. Lett.35, 4133–4135 (2010).
25. T. V. F. Abaya, M. Diwekar, S. Blair, P. Tathireddy, L. Rieth, G. A. Clark, and F. Solzbacher, “Optical char-acterization of the Utah Slant OptrodeAarray for intrafascicular infrared neural stimulation,” Proc. SPIE8207,82075M (2012).
26. G. A. Clark, S. L. Schister, N. M. Ledbetter, D. J. Warren, F. Solzbacher, J. D. Wells, M. D. Keller, S. M. Blair,L. W. Rieth, and P. R. Tathireddy, “Selective, high-optrode-count, artifact-free stimulation with infrared light viaintrafascicular Utah Slanted Optrode Arrays,” Proc. SPIE8207, 82075I (2012).
27. R. Bhandari, S. Negi, L. Rieth, and F. Solzbacher, “Wafer-scale processed, low impedance, neural arrays withvarying length microelectrodes,” inInternational Solid-State Sensors, Actuators and Microsystems Conference(Transducers)(IEEE, 2009), pp. 1210–1213.
28. R. Bhandari, S. Negi, L. Rieth, and F. Solzbacher, “A wafer-scale etching technique for high aspect ratio im-plantable mems structures,” Sens. Actuators A162, 130–136 (2010).
29. M. Bass, C. DeCusatis, G. Li, V. Mahajan, J. Enoch, and E. Stryland,Handbook of Optics: Optical Properties ofMaterials, Nonlinear Optics, Quantum Optics(McGraw-Hill, 2009).
30. V. Tuchin,Handbook of Optical Biomedical Diagnostics(SPIE, 2002).31. D. Mynbaev and L. Scheiner,Fiber-Optic Communications Technology(Prentice Hall, 2001).32. Y.-F. Li and J. W. Y. Lit, “Transmission properties of a multimode optical-fiber taper,” J. Opt. Soc. Am. A2,
462–468 (1985).33. S. Tang, L. Wu, F. Li, T. Li, and R. T. Chen, “Compression-molded three-dimensional tapered optical polymeric
waveguides for optoelectronic packaging,” Proc. SPIE3005, 202–211 (1997).34. Z.-N. Lu, R. Bansal, and P. Cheo, “Radiation losses of tapered dielectric waveguides: a finite difference analysis
with ridge waveguide applications,” J. Lightwave Technol.12, 1373–1377 (1994).
(C) 2012 OSA 1 September 2012 / Vol. 3, No. 9 / BIOMEDICAL OPTICS EXPRESS 2201#168581 - $15.00 USD Received 15 May 2012; revised 8 Aug 2012; accepted 10 Aug 2012; published 24 Aug 2012
35. B. K. Garside, T. K. Lim, and J. P. Marton, “Ray trajectories in optical fiber tapered sections,” Appl. Opt.17,3670–3674 (1978).
36. R. Deri and E. Kapon, “Low-loss III-V semiconductor optical waveguides,” IEEE J. Quantum. Electron.27,626–640 (1991).
37. F. Bahloul, R. Attia, and D. Pagnoux, “Reduction of the overall coupling loss using nonuniform tapered mi-crostructured optical fiber,” inProceedings of International Conference on Transparent Optical Networks(IEEE,2010), pp. 1–4.
38. S.-C. Hung, E.-Z. Liang, and C.-F. Lin, “Silicon waveguide sidewall smoothing by KrF excimer laser reforma-tion,” J. Lightwave Technol.27, 887–892 (2009).
39. Q. Xia, P. F. Murphy, H. Gao, and S. Y. Chou, “Ultrafast and selective reduction of sidewall roughness in siliconwaveguides using self-perfection by liquefaction,” Nanotechnology20, 345302 (2009).
40. K. K. Lee, D. R. Lim, L. C. Kimerling, J. Shin, and F. Cerrina, “Fabrication of ultralow-loss Si/SiO2 waveguidesby roughness reduction,” Opt. Lett.26, 1888–1890 (2001).
41. D. Sparacin, S. Spector, and L. Kimerling, “Silicon waveguide sidewall smoothing by wet chemical oxidation,”J. Lightwave Technol.23, 2455–2461 (2005).
1. Introduction
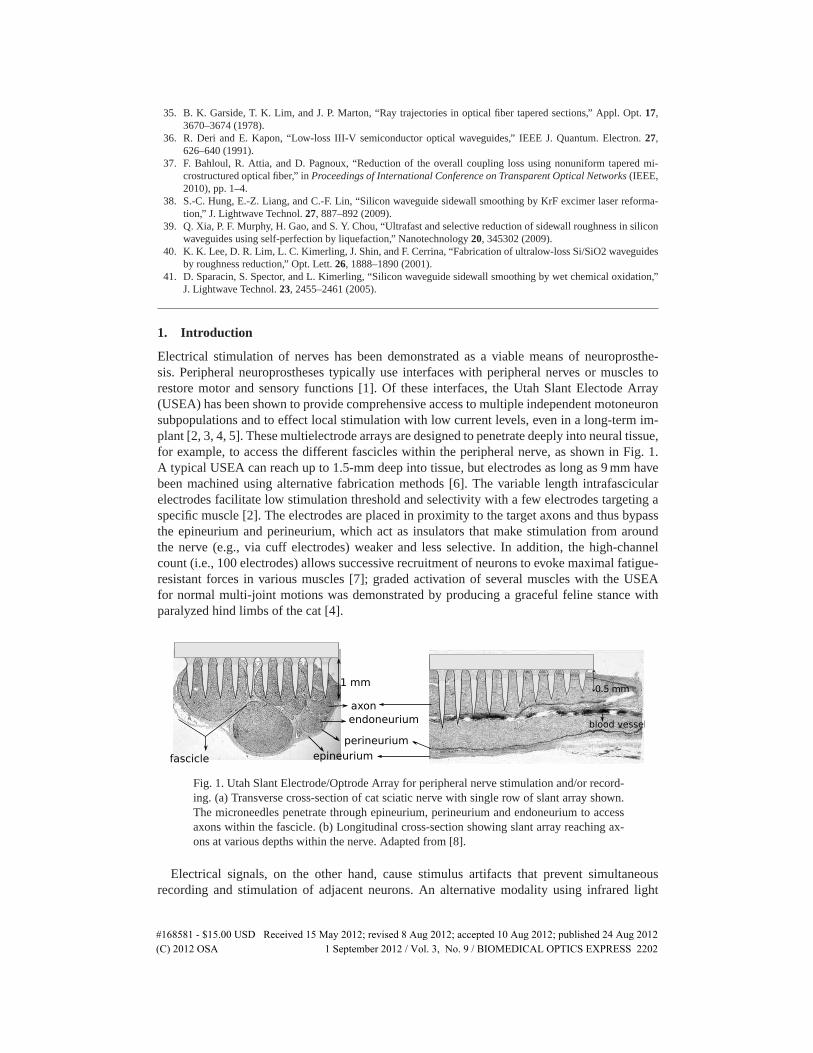
Electrical stimulation of nerves has been demonstrated as a viable means of neuroprosthe-sis. Peripheral neuroprostheses typically use interfaces with peripheral nerves or muscles torestore motor and sensory functions [1]. Of these interfaces, the Utah Slant Electode Array(USEA) has been shown to provide comprehensive access to multiple independent motoneuronsubpopulations and to effect local stimulation with low current levels, even in a long-term im-plant [2, 3, 4, 5]. These multielectrode arrays are designed to penetrate deeply into neural tissue,for example, to access the different fascicles within the peripheral nerve, as shown in Fig. 1.A typical USEA can reach up to 1.5-mm deep into tissue, but electrodes as long as 9 mm havebeen machined using alternative fabrication methods [6]. The variable length intrafascicularelectrodes facilitate low stimulation threshold and selectivity with a few electrodes targeting aspecific muscle [2]. The electrodes are placed in proximity to the target axons and thus bypassthe epineurium and perineurium, which act as insulators that make stimulation from aroundthe nerve (e.g., via cuff electrodes) weaker and less selective. In addition, the high-channelcount (i.e., 100 electrodes) allows successive recruitment of neurons to evoke maximal fatigue-resistant forces in various muscles [7]; graded activation of several muscles with the USEAfor normal multi-joint motions was demonstrated by producing a graceful feline stance withparalyzed hind limbs of the cat [4].
0.5 mm
perineurium
endoneurium
1 mm
axon
epineuriumfascicle
blood vessel
Fig. 1. Utah Slant Electrode/Optrode Array for peripheral nerve stimulation and/or record-ing. (a) Transverse cross-section of cat sciatic nerve with single row of slant array shown.The microneedles penetrate through epineurium, perineurium and endoneurium to accessaxons within the fascicle. (b) Longitudinal cross-section showing slant array reaching ax-ons at various depths within the nerve. Adapted from [8].
Electrical signals, on the other hand, cause stimulus artifacts that prevent simultaneousrecording and stimulation of adjacent neurons. An alternative modality using infrared light
(C) 2012 OSA 1 September 2012 / Vol. 3, No. 9 / BIOMEDICAL OPTICS EXPRESS 2202#168581 - $15.00 USD Received 15 May 2012; revised 8 Aug 2012; accepted 10 Aug 2012; published 24 Aug 2012
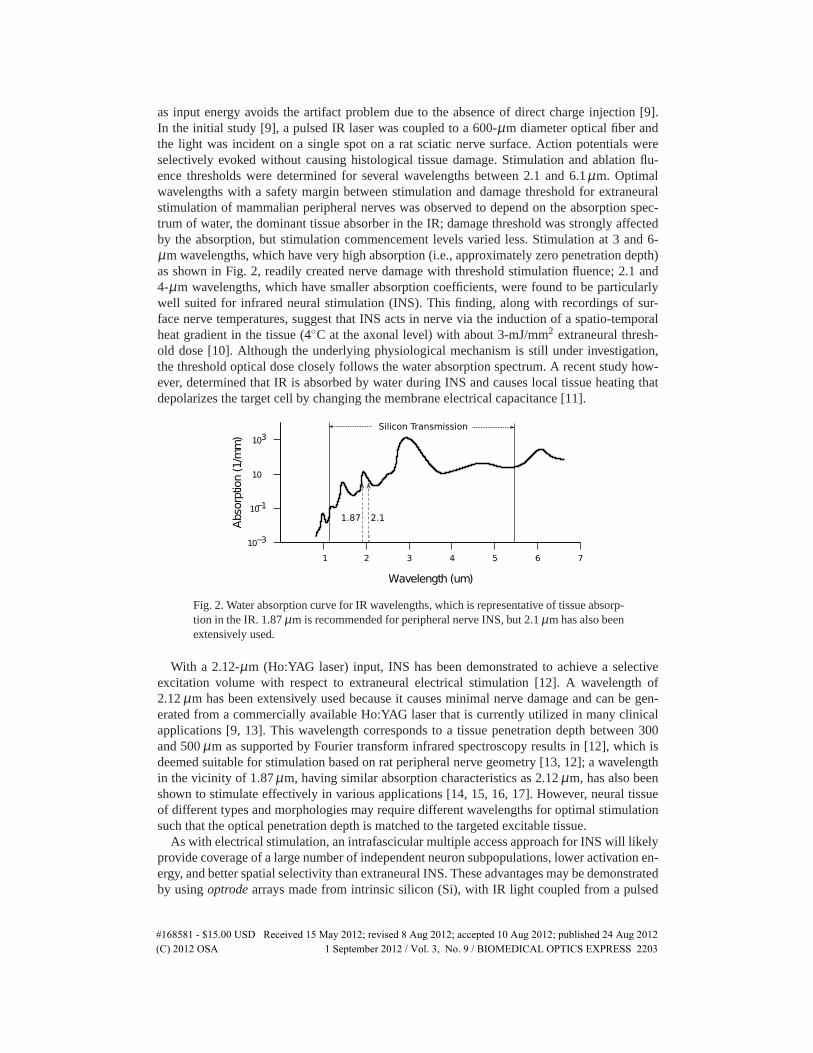
as input energy avoids the artifact problem due to the absence of direct charge injection [9].In the initial study [9], a pulsed IR laser was coupled to a 600-µm diameter optical fiber andthe light was incident on a single spot on a rat sciatic nerve surface. Action potentials wereselectively evoked without causing histological tissue damage. Stimulation and ablation flu-ence thresholds were determined for several wavelengths between 2.1 and 6.1µm. Optimalwavelengths with a safety margin between stimulation and damage threshold for extraneuralstimulation of mammalian peripheral nerves was observed to depend on the absorption spec-trum of water, the dominant tissue absorber in the IR; damage threshold was strongly affectedby the absorption, but stimulation commencement levels varied less. Stimulation at 3 and 6-µm wavelengths, which have very high absorption (i.e., approximately zero penetration depth)as shown in Fig. 2, readily created nerve damage with threshold stimulation fluence; 2.1 and4-µm wavelengths, which have smaller absorption coefficients, were found to be particularlywell suited for infrared neural stimulation (INS). This finding, along with recordings of sur-face nerve temperatures, suggest that INS acts in nerve via the induction of a spatio-temporalheat gradient in the tissue (4C at the axonal level) with about 3-mJ/mm2 extraneural thresh-old dose [10]. Although the underlying physiological mechanism is still under investigation,the threshold optical dose closely follows the water absorption spectrum. A recent study how-ever, determined that IR is absorbed by water during INS and causes local tissue heating thatdepolarizes the target cell by changing the membrane electrical capacitance [11].
Wavelength (um)
Absorption(1/m
m)
1 2 3 4 5 6 7
10−3
10−1
10
103
Silicon Transmission
1.87 2.1
Fig. 2. Water absorption curve for IR wavelengths, which is representative of tissue absorp-tion in the IR. 1.87µm is recommended for peripheral nerve INS, but 2.1µm has also beenextensively used.
With a 2.12-µm (Ho:YAG laser) input, INS has been demonstrated to achieve a selectiveexcitation volume with respect to extraneural electrical stimulation [12]. A wavelength of2.12µm has been extensively used because it causes minimal nerve damage and can be gen-erated from a commercially available Ho:YAG laser that is currently utilized in many clinicalapplications [9, 13]. This wavelength corresponds to a tissue penetration depth between 300and 500µm as supported by Fourier transform infrared spectroscopy results in [12], which isdeemed suitable for stimulation based on rat peripheral nerve geometry [13, 12]; a wavelengthin the vicinity of 1.87µm, having similar absorption characteristics as 2.12µm, has also beenshown to stimulate effectively in various applications [14, 15, 16, 17]. However, neural tissueof different types and morphologies may require different wavelengths for optimal stimulationsuch that the optical penetration depth is matched to the targeted excitable tissue.
As with electrical stimulation, an intrafascicular multiple access approach for INS will likelyprovide coverage of a large number of independent neuron subpopulations, lower activation en-ergy, and better spatial selectivity than extraneural INS. These advantages may be demonstratedby usingoptrodearrays made from intrinsic silicon (Si), with IR light coupled from a pulsed
(C) 2012 OSA 1 September 2012 / Vol. 3, No. 9 / BIOMEDICAL OPTICS EXPRESS 2203#168581 - $15.00 USD Received 15 May 2012; revised 8 Aug 2012; accepted 10 Aug 2012; published 24 Aug 2012
or continuous wave (CW) laser source operating at wavelengths from 1.1 to 5.5µm, as indi-cated in Fig. 2. Ultimately, INS with an optrode array is expected to yield a greater separationbetween stimulation and damage thresholds and permit a wider range of wavelengths to effecta neural response - light does not need to travel through the connective tissues within the nervein order to reach the axons, potentially allowing wavelengths with high absorption to be used.
Other penetrating probes for optical stimulation have been used in the field of optogenetics,where visible light is delivered to excite genetically targeted neurons expressing light-sensitivechannels (e.g., ChR2). Tapered optical fibers serving as tissue-penetrating optical probes havebeen utilized [18, 19, 20, 21, 22]. A single optrode made of a 50-µm multi-mode fiber was in-serted in mouse brain slices to trigger localized epileptiform events in a single cortical site [18].Simultaneous delivery of visible light to multiple neuronal sites have been achieved by arrang-ing tapered single-mode optical fibers in a 2D array of optrodes [20]; etched fibers were gluedto commercially available planar silicon probes, which are an alternative to tungsten electrodesutilized in previous studies [23]. Experiments with ChR2-transfected rat hippocampus demon-strated multiple local stimulation via these 2D arrays. A more sophisticated microfabricated 2Dmultiwaveguide probe was introduced as an alternative to crude arrays of tapered fibers [24].The probe targets points along its axis (i.e., stimulation of sites along the depth rather thanthe lateral direction) using parallel independent single-mode rectangular waveguides of siliconoxynitride core and oxide cladding that converge into a probe structure. Each waveguide endsat a particular target depth with a corner aluminum mirror to perform side-firing; transmissionefficiency ranged from 23 to 33% as determined from bench testing.
We have recently developed a micromachined 3D optrode array for infrared neural stimula-tion. This array covers a wide area of neuronal stimulation sites and reaches targets at varyingdepths, thereby facilitating high-channel-count optical stimulation. Preliminary optical [25] andintrafascicularphysiological [26] testing results have been reported. In this paper, we performdetailed characterization of this early-generation Utah Slant Optrode Array (USOA) neural in-terface. The USOA is designed after the USEA architecture, which has been adapted for numer-ous physiological requirements, such as nerve dimensions and axon depth, through variation inelectrode length and spacing. Note that the same design can be adapted to other transparentsubstrates for both INS and optogenetic applications.
2. The Utah Slant Optrode Array
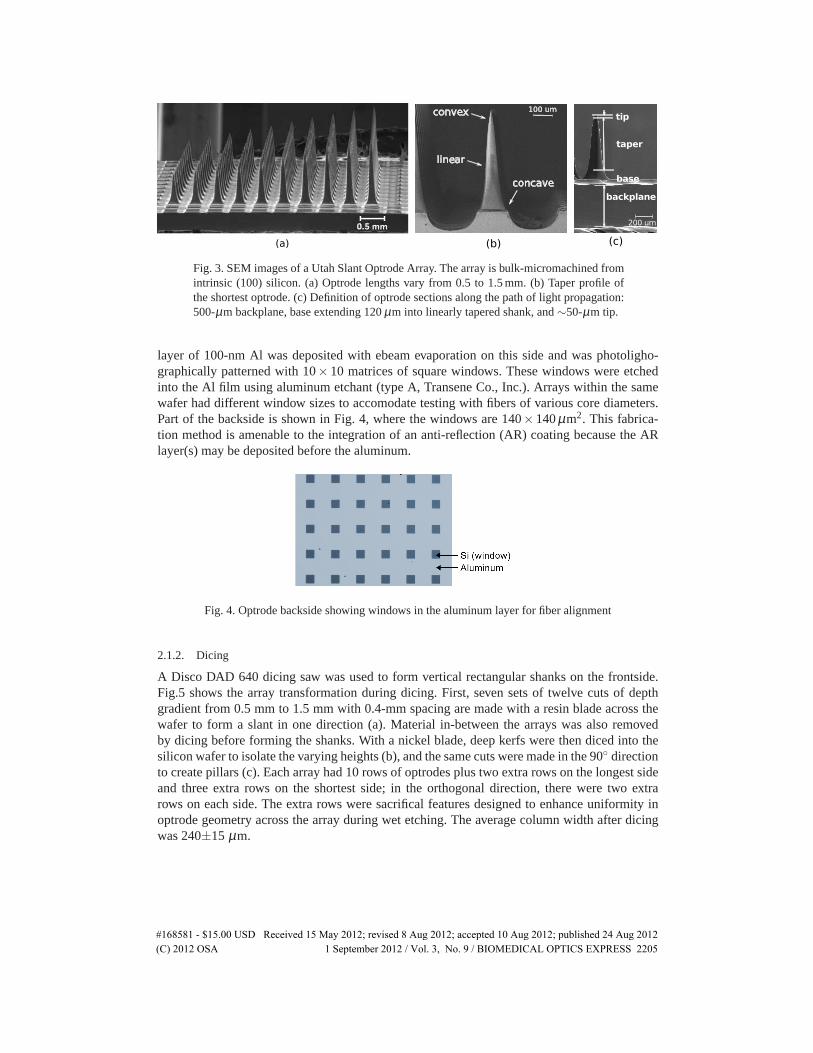
The USOA in this paper consists of a 10×10 array of microneedles with lengths varying inone direction from 0.5 mm to 1.5 mm on a 400-µm pitch. Each optrode tapers to a point from abase width of about 180µm. Fig. 3 is an SEM image of the USOA. Light input to the USOA isprovided via optical fibers butt-coupled to the array backside where optrode bases are located.The optrodes act as waveguides and light emitted from the optrode tips stimulates axons inclose proximity via local tissue heating.
2.1. Fabrication
Fabrication of the USOA takes advantage of the extensive development of the Utah Slant Elec-trode Array (USEA) [27]. The arrays are bulk-micromachined from an undoped (ρ > 20Ω· cm)c-Si (100) wafer with 2-mm thickness and 76.2±0.3-mm diameter. This substrate is able totransmit IR at wavelengthλ > 1.1µm with negligible absorption losses. One wafer yields 495×5-mm2 arrays.
2.1.1. Backside processing
The optical fibers for light input are butt-coupled to a polished side of the Si wafer to minimizeany scattering losses. In order to facilitate fiber alignment with the optrode bases, a uniform
(C) 2012 OSA 1 September 2012 / Vol. 3, No. 9 / BIOMEDICAL OPTICS EXPRESS 2204#168581 - $15.00 USD Received 15 May 2012; revised 8 Aug 2012; accepted 10 Aug 2012; published 24 Aug 2012
100 um
(a) (b) (c)
200 um
tip
taper
base
backplane
linear
convex
concave
Fig. 3. SEM images of a Utah Slant Optrode Array. The array is bulk-micromachined fromintrinsic (100) silicon. (a) Optrode lengths vary from 0.5 to 1.5 mm. (b) Taper profile ofthe shortest optrode. (c) Definition of optrode sections along the path of light propagation:500-µm backplane, base extending 120µm into linearly tapered shank, and∼50-µm tip.
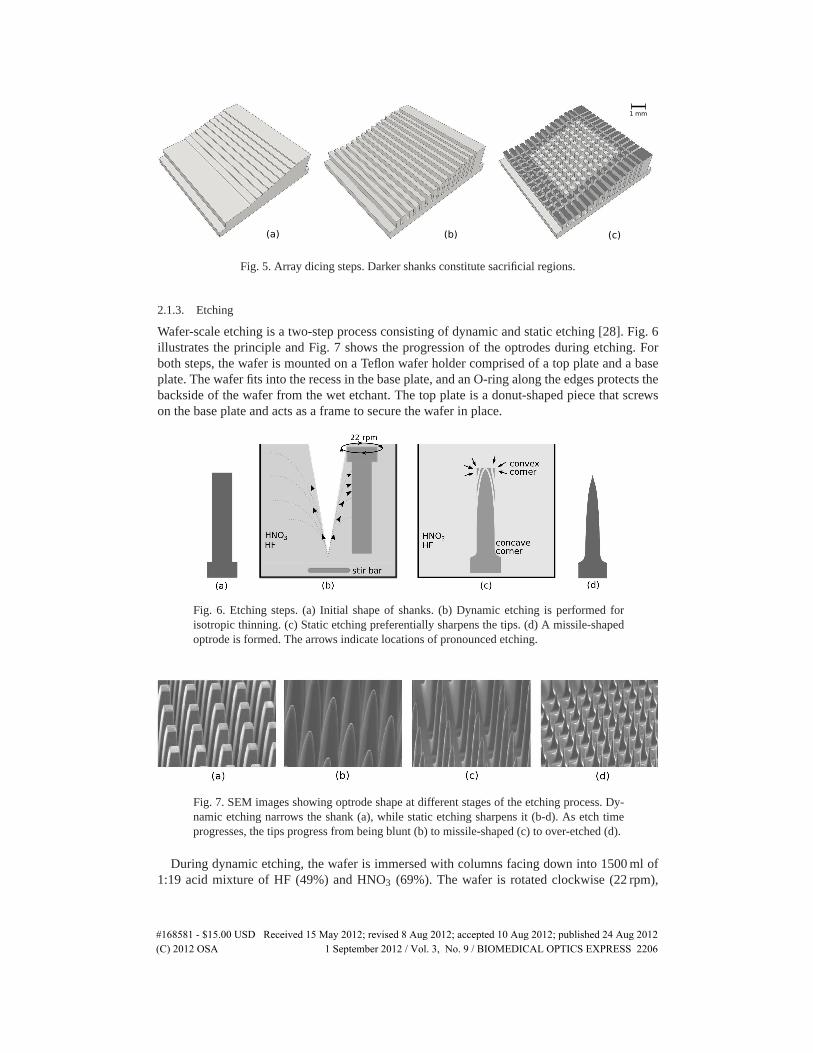
layer of 100-nm Al was deposited with ebeam evaporation on this side and was photoligho-graphically patterned with 10×10 matrices of square windows. These windows were etchedinto the Al film using aluminum etchant (type A, Transene Co., Inc.). Arrays within the samewafer had different window sizes to accomodate testing with fibers of various core diameters.Part of the backside is shown in Fig. 4, where the windows are 140×140µm2. This fabrica-tion method is amenable to the integration of an anti-reflection (AR) coating because the ARlayer(s) may be deposited before the aluminum.
Fig. 4. Optrode backside showing windows in the aluminum layer for fiber alignment
2.1.2. Dicing
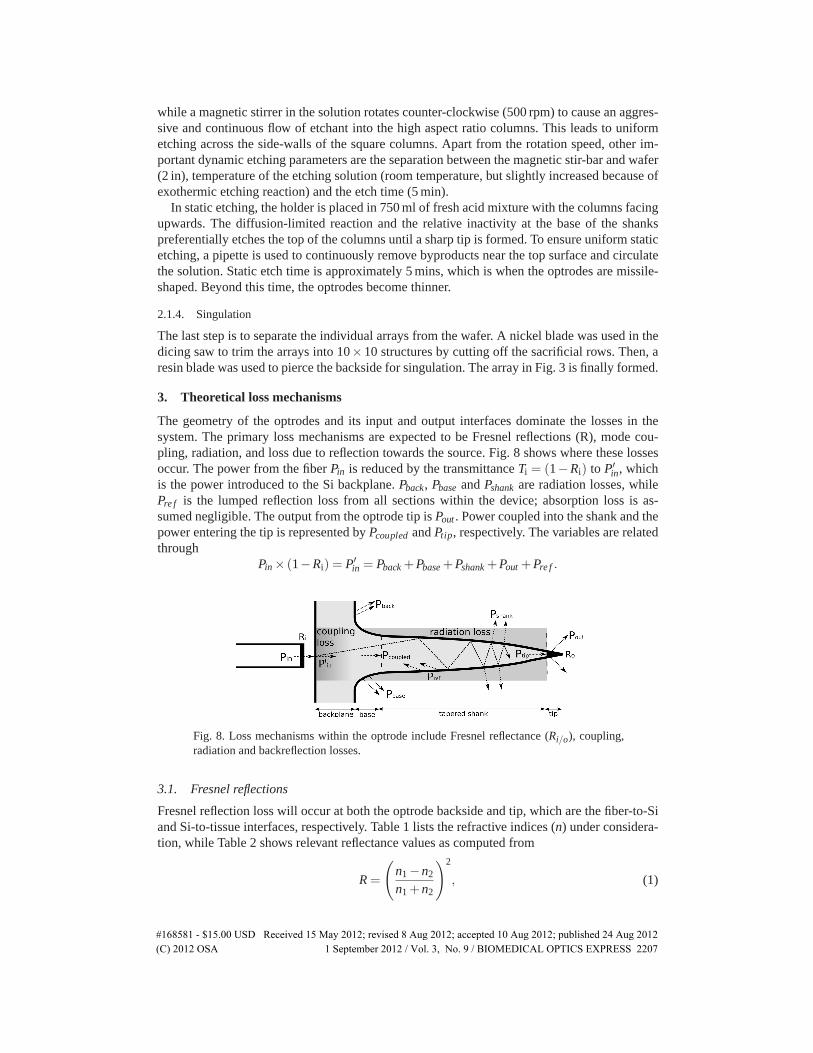
A Disco DAD 640 dicing saw was used to form vertical rectangular shanks on the frontside.Fig.5 shows the array transformation during dicing. First, seven sets of twelve cuts of depthgradient from 0.5 mm to 1.5 mm with 0.4-mm spacing are made with a resin blade across thewafer to form a slant in one direction (a). Material in-between the arrays was also removedby dicing before forming the shanks. With a nickel blade, deep kerfs were then diced into thesilicon wafer to isolate the varying heights (b), and the same cuts were made in the 90 directionto create pillars (c). Each array had 10 rows of optrodes plus two extra rows on the longest sideand three extra rows on the shortest side; in the orthogonal direction, there were two extrarows on each side. The extra rows were sacrifical features designed to enhance uniformity inoptrode geometry across the array during wet etching. The average column width after dicingwas 240±15µm.
(C) 2012 OSA 1 September 2012 / Vol. 3, No. 9 / BIOMEDICAL OPTICS EXPRESS 2205#168581 - $15.00 USD Received 15 May 2012; revised 8 Aug 2012; accepted 10 Aug 2012; published 24 Aug 2012
1mm
(a) (b) (c)(c)(b)(a)
Fig. 5. Array dicing steps. Darker shanks constitute sacrificial regions.
2.1.3. Etching
Wafer-scale etching is a two-step process consisting of dynamic and static etching [28]. Fig. 6illustrates the principle and Fig. 7 shows the progression of the optrodes during etching. Forboth steps, the wafer is mounted on a Teflon wafer holder comprised of a top plate and a baseplate. The wafer fits into the recess in the base plate, and an O-ring along the edges protects thebackside of the wafer from the wet etchant. The top plate is a donut-shaped piece that screwson the base plate and acts as a frame to secure the wafer in place.
Fig. 6. Etching steps. (a) Initial shape of shanks. (b) Dynamic etching is performed forisotropicthinning. (c) Static etching preferentially sharpens the tips. (d) A missile-shapedoptrode is formed. The arrows indicate locations of pronounced etching.
Fig. 7. SEM images showing optrode shape at different stages of the etching process. Dy-namicetching narrows the shank (a), while static etching sharpens it (b-d). As etch timeprogresses, the tips progress from being blunt (b) to missile-shaped (c) to over-etched (d).
During dynamic etching, the wafer is immersed with columns facing down into 1500 ml of1:19 acid mixture of HF (49%) and HNO3 (69%). The wafer is rotated clockwise (22 rpm),
(C) 2012 OSA 1 September 2012 / Vol. 3, No. 9 / BIOMEDICAL OPTICS EXPRESS 2206#168581 - $15.00 USD Received 15 May 2012; revised 8 Aug 2012; accepted 10 Aug 2012; published 24 Aug 2012
while a magnetic stirrer in the solution rotates counter-clockwise (500 rpm) to cause an aggres-sive and continuous flow of etchant into the high aspect ratio columns. This leads to uniformetching across the side-walls of the square columns. Apart from the rotation speed, other im-portant dynamic etching parameters are the separation between the magnetic stir-bar and wafer(2 in), temperature of the etching solution (room temperature, but slightly increased because ofexothermic etching reaction) and the etch time (5 min).
In static etching, the holder is placed in 750 ml of fresh acid mixture with the columns facingupwards. The diffusion-limited reaction and the relative inactivity at the base of the shankspreferentially etches the top of the columns until a sharp tip is formed. To ensure uniform staticetching, a pipette is used to continuously remove byproducts near the top surface and circulatethe solution. Static etch time is approximately 5 mins, which is when the optrodes are missile-shaped. Beyond this time, the optrodes become thinner.
2.1.4. Singulation
The last step is to separate the individual arrays from the wafer. A nickel blade was used in thedicing saw to trim the arrays into 10×10 structures by cutting off the sacrificial rows. Then, aresin blade was used to pierce the backside for singulation. The array in Fig. 3 is finally formed.
3. Theoretical loss mechanisms
The geometry of the optrodes and its input and output interfaces dominate the losses in thesystem. The primary loss mechanisms are expected to be Fresnel reflections (R), mode cou-pling, radiation, and loss due to reflection towards the source. Fig. 8 shows where these lossesoccur. The power from the fiberPin is reduced by the transmittanceTi = (1−Ri) to P′
in, whichis the power introduced to the Si backplane.Pback, PbaseandPshankare radiation losses, whilePre f is the lumped reflection loss from all sections within the device; absorption loss is as-sumed negligible. The output from the optrode tip isPout. Power coupled into the shank and thepower entering the tip is represented byPcoupledandPtip, respectively. The variables are relatedthrough
Pin × (1−Ri) = P′in = Pback+Pbase+Pshank+Pout +Pre f .
Ro
Riradiation loss
Fig. 8. Loss mechanisms within the optrode include Fresnel reflectance (Ri/o), coupling,radiation and backreflection losses.
3.1. Fresnel reflections
Fresnel reflection loss will occur at both the optrode backside and tip, which are the fiber-to-Siand Si-to-tissue interfaces, respectively. Table 1 lists the refractive indices (n) under considera-tion, while Table 2 shows relevant reflectance values as computed from
R=
(
n1−n2
n1 +n2
)2
, (1)
(C) 2012 OSA 1 September 2012 / Vol. 3, No. 9 / BIOMEDICAL OPTICS EXPRESS 2207#168581 - $15.00 USD Received 15 May 2012; revised 8 Aug 2012; accepted 10 Aug 2012; published 24 Aug 2012
for a single interface, wheren1 andn2 arethe refractive indices of the materials on either sideof the interface. For double interfaces, as in the gap between the fiber and Si backside, thisequation is applied twice, using the relation
Reff = 1− (1−R1)(1−R2) = R1 +R2−R1R2.
Note that interference effects were not considered.
Table 1. Refractive indices at 1.55µm
Material n ReferenceAir 1.00Silicon 3.48 [29]Fused Silica (Fiber) 1.44 [29]Tissue 1.36 [30]
Table 2. Reflectance at interfacesInterface Reflectance (R) Transmittance (1-R)Fiber-Air-Si 0.329 0.671Fiber-1.44-Si 0.172 0.828Fiber-1.66-Si 0.130 0.870Si-Tissue 0.192 0.808Si-Air 0.306 0.694
A fiber in contact with bare silicon leaves an air gap junction, which has an overall Fresnelreflectanceloss of 32.9%. This gap can effectively be eliminated by using index matching fluid(n= 1.44), with index that matches that of the fiber; nevertheless, the remaining single-interfacedrops reflectance to 17.2%, leaving a theoretical maximum of 82.8% that can be transmitted totissue. Using a higher refractive index fluid in the gap, such asn = 1.66, further reduces thereflectance loss to∼13%. In principle, an anti-reflection (AR) coating could be designed tominimize reflection loss at the input interface, but fiber index matching fluid would still be usedto fill-in the air gap.
3.2. Mode coupling
Due to its high refractive index, the Si optrode is highly multi-moded. Losses in the couplingbetween two multi-mode waveguides are described in most textbooks on fiber optics [31], andare geometrical in nature. Extrinsic losses are due to alignment, including lateral displacementand end separation.
The intrinsic losses are due to mismatches in the core cross-sectional area (A) and numericalaperture (NA) between the fiber and optrode. The coupling efficiency (η) resulting from theselosses may be quantified as
ηA =AO
AF(2)
and
ηNA =
(
NAO
NAF
)2
, (3)
(C) 2012 OSA 1 September 2012 / Vol. 3, No. 9 / BIOMEDICAL OPTICS EXPRESS 2208#168581 - $15.00 USD Received 15 May 2012; revised 8 Aug 2012; accepted 10 Aug 2012; published 24 Aug 2012
where the subscriptsO andF signify the optrode and fiber waveguides, respectively. The effec-tive numerical aperture of a tapered waveguide (for meridional rays) is given by
NA =dmin
dmaxcosθ
√
n21−n2
2, (4)
wheredmax anddmin are the diameters of the larger and smaller ends of the taper,n1 andn2
are the core and cladding indices, andθ is the angle of the taper slope with respect to thepropagation direction [32].
Although the use of lensed fibers or external lenses may increase coupling efficiency, ourstudies were performed by direct fiber to optrode coupling for simplicity. Given the large re-fractive index contrast of the optrodes and the relatively small coupling fiber NA, we don’texpect NA mismatch to be a significant source of loss.
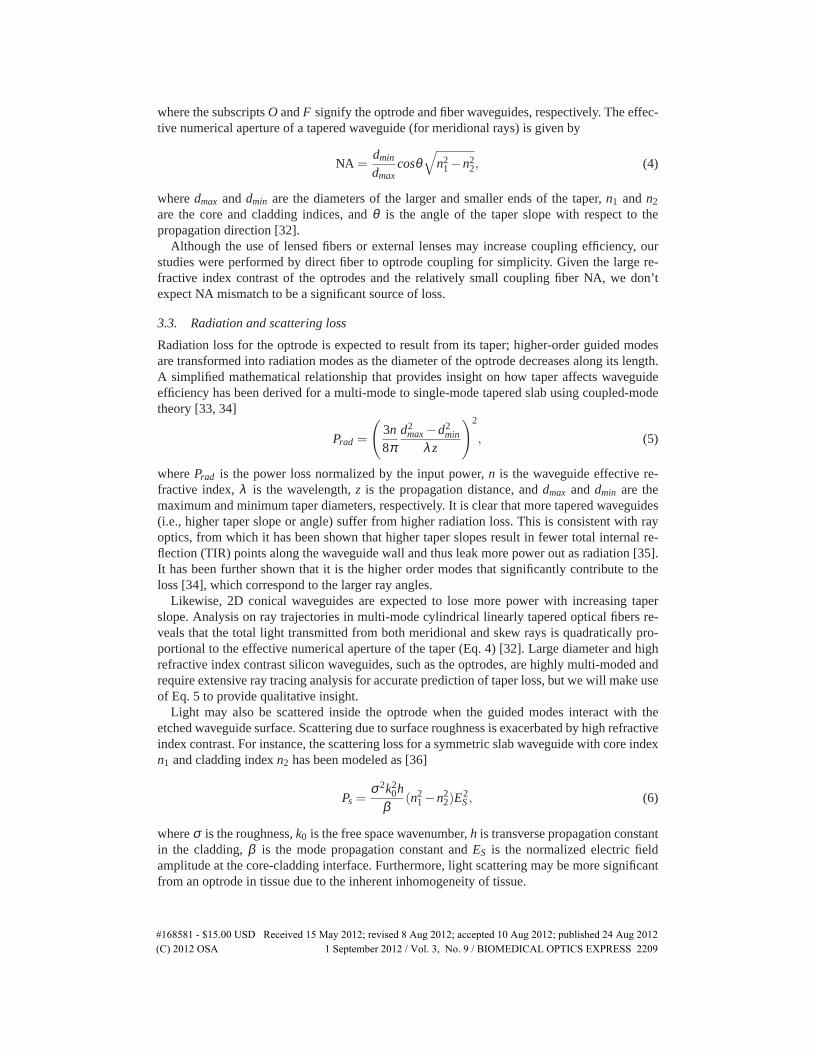
3.3. Radiation and scattering loss
Radiation loss for the optrode is expected to result from its taper; higher-order guided modesare transformed into radiation modes as the diameter of the optrode decreases along its length.A simplified mathematical relationship that provides insight on how taper affects waveguideefficiency has been derived for a multi-mode to single-mode tapered slab using coupled-modetheory [33, 34]
Prad =
(
3n8π
d2max−d2
min
λz
)2
, (5)
wherePrad is the power loss normalized by the input power,n is the waveguide effective re-fractive index,λ is the wavelength,z is the propagation distance, anddmax anddmin are themaximum and minimum taper diameters, respectively. It is clear that more tapered waveguides(i.e., higher taper slope or angle) suffer from higher radiation loss. This is consistent with rayoptics, from which it has been shown that higher taper slopes result in fewer total internal re-flection (TIR) points along the waveguide wall and thus leak more power out as radiation [35].It has been further shown that it is the higher order modes that significantly contribute to theloss [34], which correspond to the larger ray angles.
Likewise, 2D conical waveguides are expected to lose more power with increasing taperslope. Analysis on ray trajectories in multi-mode cylindrical linearly tapered optical fibers re-veals that the total light transmitted from both meridional and skew rays is quadratically pro-portional to the effective numerical aperture of the taper (Eq. 4) [32]. Large diameter and highrefractive index contrast silicon waveguides, such as the optrodes, are highly multi-moded andrequire extensive ray tracing analysis for accurate prediction of taper loss, but we will make useof Eq. 5 to provide qualitative insight.
Light may also be scattered inside the optrode when the guided modes interact with theetched waveguide surface. Scattering due to surface roughness is exacerbated by high refractiveindex contrast. For instance, the scattering loss for a symmetric slab waveguide with core indexn1 and cladding indexn2 has been modeled as [36]
Ps =σ2k2
0h
β(n2
1−n22)E
2S, (6)
whereσ is the roughness,k0 is the free space wavenumber,h is transverse propagation constantin the cladding,β is the mode propagation constant andES is the normalized electric fieldamplitude at the core-cladding interface. Furthermore, light scattering may be more significantfrom an optrode in tissue due to the inherent inhomogeneity of tissue.
(C) 2012 OSA 1 September 2012 / Vol. 3, No. 9 / BIOMEDICAL OPTICS EXPRESS 2209#168581 - $15.00 USD Received 15 May 2012; revised 8 Aug 2012; accepted 10 Aug 2012; published 24 Aug 2012
4. Characterization results and discussion
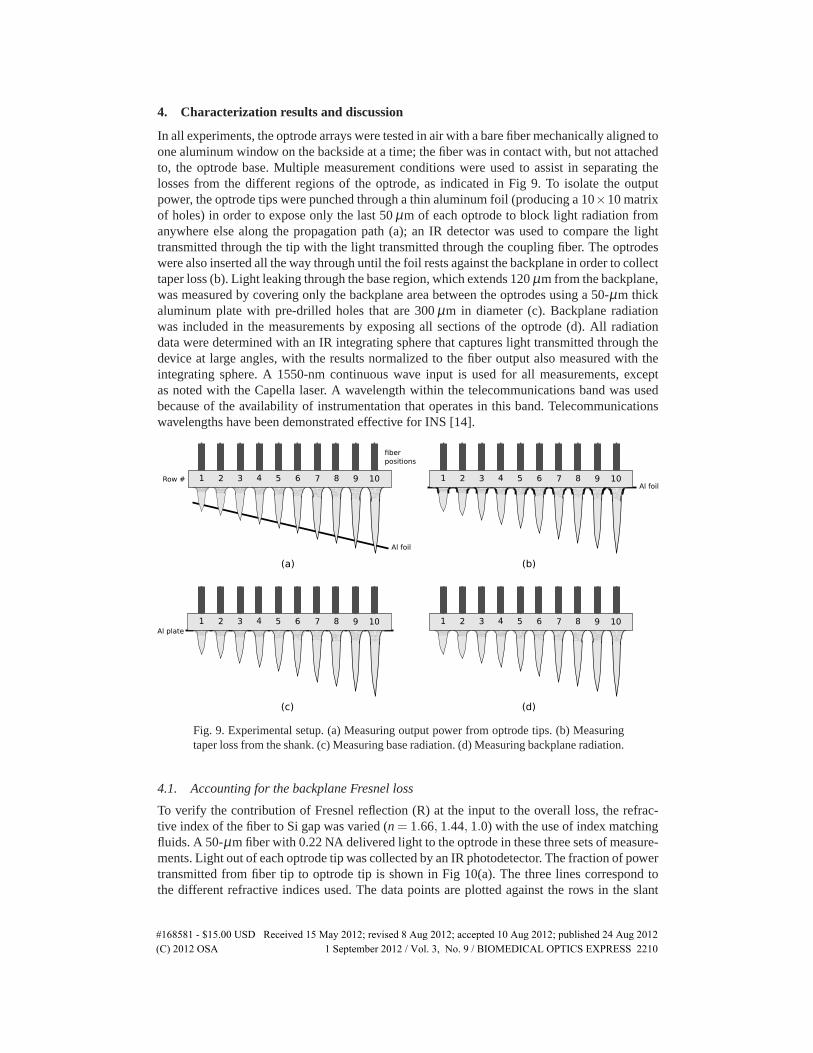
In all experiments, the optrode arrays were tested in air with a bare fiber mechanically aligned toone aluminum window on the backside at a time; the fiber was in contact with, but not attachedto, the optrode base. Multiple measurement conditions were used to assist in separating thelosses from the different regions of the optrode, as indicated in Fig 9. To isolate the outputpower, the optrode tips were punched through a thin aluminum foil (producing a 10×10 matrixof holes) in order to expose only the last 50µm of each optrode to block light radiation fromanywhere else along the propagation path (a); an IR detector was used to compare the lighttransmitted through the tip with the light transmitted through the coupling fiber. The optrodeswere also inserted all the way through until the foil rests against the backplane in order to collecttaper loss (b). Light leaking through the base region, which extends 120µm from the backplane,was measured by covering only the backplane area between the optrodes using a 50-µm thickaluminum plate with pre-drilled holes that are 300µm in diameter (c). Backplane radiationwas included in the measurements by exposing all sections of the optrode (d). All radiationdata were determined with an IR integrating sphere that captures light transmitted through thedevice at large angles, with the results normalized to the fiber output also measured with theintegrating sphere. A 1550-nm continuous wave input is used for all measurements, exceptas noted with the Capella laser. A wavelength within the telecommunications band was usedbecause of the availability of instrumentation that operates in this band. Telecommunicationswavelengths have been demonstrated effective for INS [14].
1 2 3 4 5 6 7 8 9 10Row #
fiber
positions
Al foil
1 2 3 4 5 6 7 8 9 10Al foil
(a) (b)
1 2 3 4 5 6 7 8 9 10Al plate
1 2 3 4 5 6 7 8 9 10
(c) (d)
Fig. 9. Experimental setup. (a) Measuring output power from optrode tips. (b) Measuringtaperloss from the shank. (c) Measuring base radiation. (d) Measuring backplane radiation.
4.1. Accounting for the backplane Fresnel loss
To verify the contribution of Fresnel reflection (R) at the input to the overall loss, the refrac-tive index of the fiber to Si gap was varied (n= 1.66,1.44,1.0) with the use of index matchingfluids. A 50-µm fiber with 0.22 NA delivered light to the optrode in these three sets of measure-ments. Light out of each optrode tip was collected by an IR photodetector. The fraction of powertransmitted from fiber tip to optrode tip is shown in Fig 10(a). The three lines correspond tothe different refractive indices used. The data points are plotted against the rows in the slant
(C) 2012 OSA 1 September 2012 / Vol. 3, No. 9 / BIOMEDICAL OPTICS EXPRESS 2210#168581 - $15.00 USD Received 15 May 2012; revised 8 Aug 2012; accepted 10 Aug 2012; published 24 Aug 2012
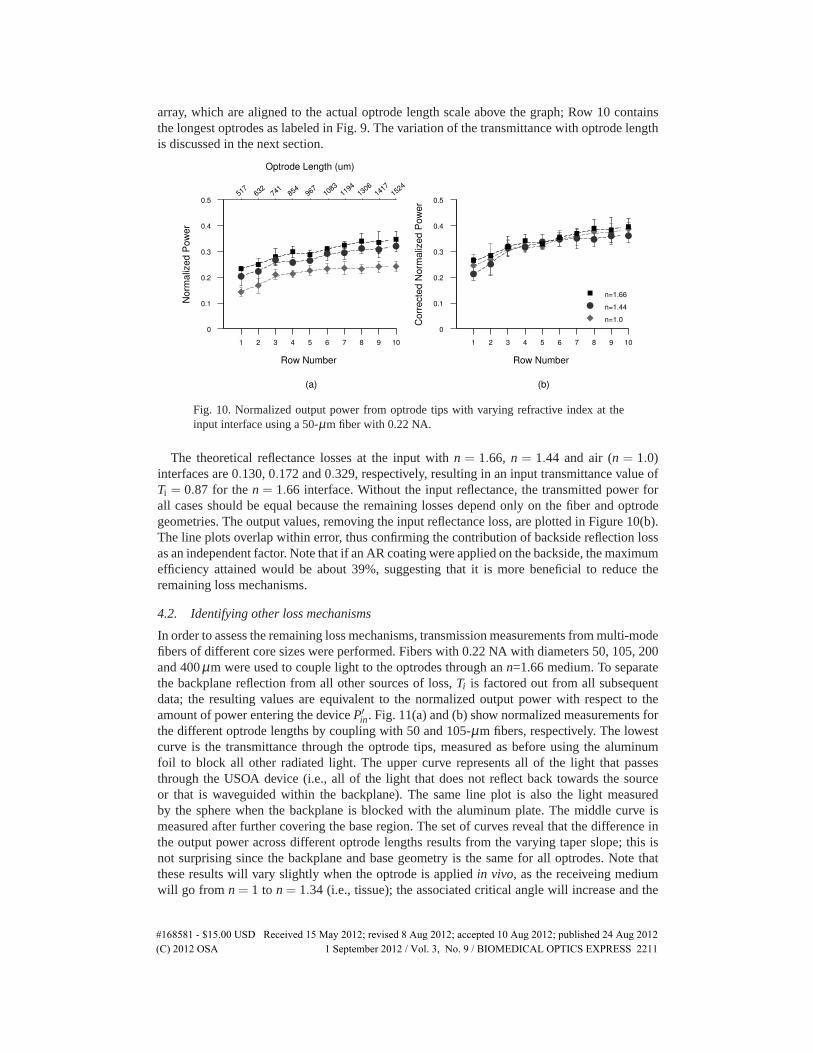
array, which are aligned to the actual optrode length scale above the graph; Row 10 containsthelongest optrodes as labeled in Fig. 9. The variation of the transmittance with optrode lengthis discussed in the next section.
Row Number
(a)
Norm
alizedPower
1 2 3 4 5 6 7 8 9 10
Optrode Length (um)
517
632
741
854
967
1083
1194
1306
1417
1524
0
0.1
0.2
0.3
0.4
0.5
Row Number
(b)
CorrectedNorm
alizedPower
1 2 3 4 5 6 7 8 9 10
0
0.1
0.2
0.3
0.4
0.5
n=1.66
n=1.44
n=1.0
Fig. 10. Normalized output power from optrode tips with varying refractive index at theinput interface using a 50-µm fiber with 0.22 NA.
The theoretical reflectance losses at the input withn = 1.66, n = 1.44 and air (n= 1.0)interfaces are 0.130, 0.172 and 0.329, respectively, resulting in an input transmittance value ofTi = 0.87 for then = 1.66 interface. Without the input reflectance, the transmitted power forall cases should be equal because the remaining losses depend only on the fiber and optrodegeometries. The output values, removing the input reflectance loss, are plotted in Figure 10(b).The line plots overlap within error, thus confirming the contribution of backside reflection lossas an independent factor. Note that if an AR coating were applied on the backside, the maximumefficiency attained would be about 39%, suggesting that it is more beneficial to reduce theremaining loss mechanisms.
4.2. Identifying other loss mechanisms
In order to assess the remaining loss mechanisms, transmission measurements from multi-modefibers of different core sizes were performed. Fibers with 0.22 NA with diameters 50, 105, 200and 400µm were used to couple light to the optrodes through ann=1.66 medium. To separatethe backplane reflection from all other sources of loss,Ti is factored out from all subsequentdata; the resulting values are equivalent to the normalized output power with respect to theamount of power entering the deviceP′
in. Fig. 11(a) and (b) show normalized measurements forthe different optrode lengths by coupling with 50 and 105-µm fibers, respectively. The lowestcurve is the transmittance through the optrode tips, measured as before using the aluminumfoil to block all other radiated light. The upper curve represents all of the light that passesthrough the USOA device (i.e., all of the light that does not reflect back towards the sourceor that is waveguided within the backplane). The same line plot is also the light measuredby the sphere when the backplane is blocked with the aluminum plate. The middle curve ismeasured after further covering the base region. The set of curves reveal that the difference inthe output power across different optrode lengths results from the varying taper slope; this isnot surprising since the backplane and base geometry is the same for all optrodes. Note thatthese results will vary slightly when the optrode is appliedin vivo, as the receiveing mediumwill go from n = 1 to n = 1.34 (i.e., tissue); the associated critical angle will increase and the
(C) 2012 OSA 1 September 2012 / Vol. 3, No. 9 / BIOMEDICAL OPTICS EXPRESS 2211#168581 - $15.00 USD Received 15 May 2012; revised 8 Aug 2012; accepted 10 Aug 2012; published 24 Aug 2012
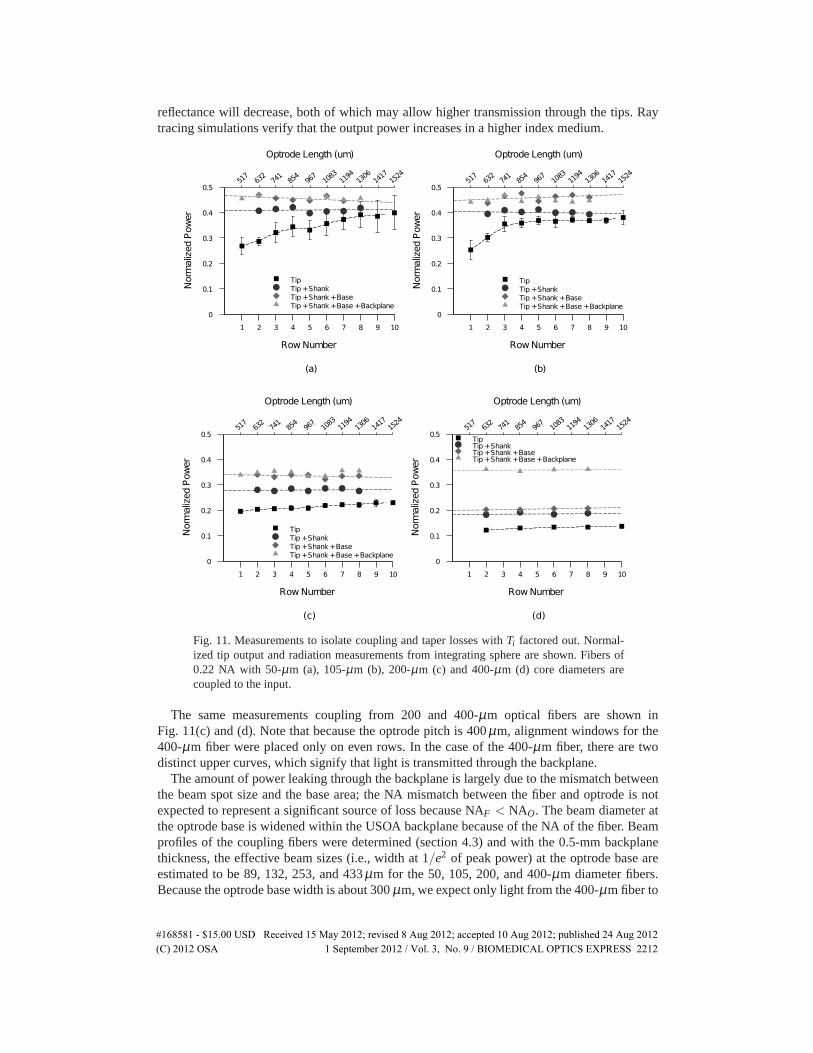
reflectance will decrease, both of which may allow higher transmission through the tips. Raytracingsimulations verify that the output power increases in a higher index medium.
RowNumber
(a)
Norm
alizedPower
1 2 3 4 5 6 7 8 9 10
0
0.1
0.2
0.3
0.4
0.5
Optrode Length (um)
517
632
741
854
967
1083
1194
1306
1417
1524
RowNumber
(b)
Norm
alizedPower
1 2 3 4 5 6 7 8 9 10
0
0.1
0.2
0.3
0.4
0.5
Optrode Length (um)
517
632
741
854
967
1083
1194
1306
1417
1524
Tip
Tip+Shank
Tip+Shank+Base
Tip+Shank+Base +Backplane
Tip
Tip+Shank
Tip+Shank+Base
Tip+Shank+Base +Backplane
RowNumber
(a)
Norm
alizedPower
1 2 3 4 5 6 7 8 9 10
0
0.1
0.2
0.3
0.4
0.5
Optrode Length (um)
517
632
741
854
967
1083
1194
1306
1417
1524
RowNumber
(b)
Norm
alizedPower
1 2 3 4 5 6 7 8 9 10
0
0.1
0.2
0.3
0.4
0.5
Optrode Length (um)
517
632
741
854
967
1083
1194
1306
1417
1524
Tip
Tip+Shank
Tip+Shank+Base
Tip+Shank+Base +Backplane
TipTip+ShankTip+Shank+BaseTip+Shank+Base +Backplane
(c) (d)
Fig. 11. Measurements to isolate coupling and taper losses withTi factored out. Normal-ized tip output and radiation measurements from integrating sphere are shown. Fibers of0.22 NA with 50-µm (a), 105-µm (b), 200-µm (c) and 400-µm (d) core diameters arecoupled to the input.
The same measurements coupling from 200 and 400-µm optical fibers are shown inFig. 11(c) and (d). Note that because the optrode pitch is 400µm, alignment windows for the400-µm fiber were placed only on even rows. In the case of the 400-µm fiber, there are twodistinct upper curves, which signify that light is transmitted through the backplane.
The amount of power leaking through the backplane is largely due to the mismatch betweenthe beam spot size and the base area; the NA mismatch between the fiber and optrode is notexpected to represent a significant source of loss because NAF < NAO. The beam diameter atthe optrode base is widened within the USOA backplane because of the NA of the fiber. Beamprofiles of the coupling fibers were determined (section 4.3) and with the 0.5-mm backplanethickness, the effective beam sizes (i.e., width at 1/e2 of peak power) at the optrode base areestimated to be 89, 132, 253, and 433µm for the 50, 105, 200, and 400-µm diameter fibers.Because the optrode base width is about 300µm, we expect only light from the 400-µm fiber to
(C) 2012 OSA 1 September 2012 / Vol. 3, No. 9 / BIOMEDICAL OPTICS EXPRESS 2212#168581 - $15.00 USD Received 15 May 2012; revised 8 Aug 2012; accepted 10 Aug 2012; published 24 Aug 2012

transmit through the backplane. The backplane radiation, which is derived from the differencebetweenthe Tip+Shank+Base+BackplaneandTip+Shank+Basecurves of Fig. 11, supportsthis hypothesis as negligible backplane radiation is observed for fibers smaller than 400µm.From the area mismatch (Eq. 2), 52% of the beam power from the 400-µm fiber will not becoupled into the base. Only 17% of the power falling outside the base region is measured asradiation, where 35% is expected otherwise. With the concaved backplane surface between theoptrodes and the beam size larger than the pitch, rays outside of the base are likely to strike acurvature, undergo TIR and further backreflect towards the source.
Next, the loss due to base radiation is taken from the the difference of theTip+Shank+BaseandTip+Shank, which is about 5% except for a 400-µm fiber. For the 400-µm fiber however,upon considering that only 48% of the power is coupled into the base according to previoustheoretical analysis, the fractional base radiation loss with respect to the power entering thebase is close to 5% as well. The base, like the shank and tip regions, is tapered. Fig. 3 shows thechange in the optrode taper from a highly concave shape at the base to convex near the tip; fromthe effective aperture area above the base up to just below the tip, the optrode tapers linearly.These tapered regions reduce the overall transmission due to radiation and reflection losses.Radiation losses result from rays that don’t satisfy TIR conditions, while rays that propagateat steep angles with respect to the optical axis can reflect back towards the source. The base isexpected to act as a bottleneck for transmission since highly concave tapered waveguides havebeen found to exhibit higher propagation loss based on numerical studies [37]; in the case ofthe optrodes, the small input beams and the short base section prevents the huge loss. In theory,the 50 and 100-µm fibers should not incur base radiation as the optrode width into the shankis still larger than the beam size. However, even a few microns input misalignment will causethe small measured radiation. For bigger fibers with rays striking the base, the number of TIRreflections is decreased as propagation continues in the shank. A collimated input beam may bedirected into the optrode shank in order to reduce the losses.
Shank loss depends on optrode length. Shanks inherently have different taper shapes andangle because optrodes of different lengths essentially have the same base shape and taper toabout the same diameter at the tip. Shorter optrodes then result in a larger taper angle withrespect to the propagation direction. This consequence is discernible in Fig. 3. Transmissionthrough the shank, which is reduced primarily due to radiation loss, can be quantified andcompared with theory. The steeper taper of the shorter optrodes causes more power loss, asbriefly discussed in section 3.3. This is supported by the difference between theTip+ShankandTip curves of Fig. 11, which estimates the fraction ofP′
in is radiated out of the optrodeshanks. Results with larger input fibers exhibit greater loss and less variation with optrodelength because most of the rays that have been directed into the shank have smaller angles withrespect to the optical axis.
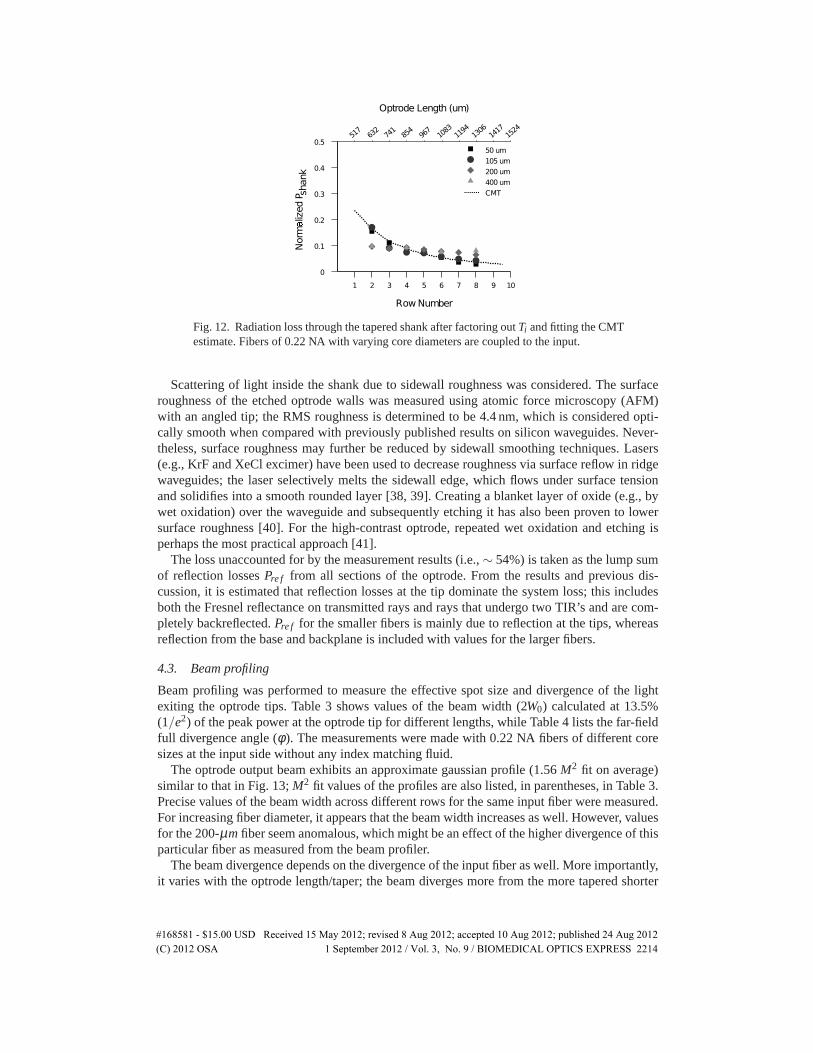
In order to compare the results with the simple coupled mode theory (CMT) approximationin Eq. 5, which is normalized to the power entering the taper (i.e.,Pcoupled), the CMT equationis fitted to the measured data with a single normalization factor. In this way, the loss trend isreadily apparent. The matched data are plotted in Fig. 12. CMT predicts the change in radia-tion loss with varying taper slope for the smaller coupling fibers. Note that the CMT estimateis derived for a multi-mode to single-mode slab and accurate for low index contrast waveg-uide, whereas optrodes are highly multi-moded high index contrast 3D waveguides. Thus, withthe data-fitting, the results presented in Fig. 12 reflect the slope to which the radiation is af-fected by the taper rather than the comparison between actual and theoretical radiation loss;although 3D waveguides are typically approximated as slabs, CMT underestimates the loss inmultimode-to-multimode waveguides [34] and has its limitations when applied to high indexcontrast interfaces.
(C) 2012 OSA 1 September 2012 / Vol. 3, No. 9 / BIOMEDICAL OPTICS EXPRESS 2213#168581 - $15.00 USD Received 15 May 2012; revised 8 Aug 2012; accepted 10 Aug 2012; published 24 Aug 2012
RowNumberNorm
lizedP shank1 2 3 4 5 6 7 8 9 10
0
0.1
0.2
0.3
0.4
0.5
Optrode Length (um)
517
632
741
854
967
1083
1194
1306
1417
1524
50 um
105 um
200 um
400 um
CMT
Fig. 12. Radiation loss through the tapered shank after factoring outTi andfitting the CMTestimate. Fibers of 0.22 NA with varying core diameters are coupled to the input.
Scattering of light inside the shank due to sidewall roughness was considered. The surfaceroughness of the etched optrode walls was measured using atomic force microscopy (AFM)with an angled tip; the RMS roughness is determined to be 4.4 nm, which is considered opti-cally smooth when compared with previously published results on silicon waveguides. Never-theless, surface roughness may further be reduced by sidewall smoothing techniques. Lasers(e.g., KrF and XeCl excimer) have been used to decrease roughness via surface reflow in ridgewaveguides; the laser selectively melts the sidewall edge, which flows under surface tensionand solidifies into a smooth rounded layer [38, 39]. Creating a blanket layer of oxide (e.g., bywet oxidation) over the waveguide and subsequently etching it has also been proven to lowersurface roughness [40]. For the high-contrast optrode, repeated wet oxidation and etching isperhaps the most practical approach [41].
The loss unaccounted for by the measurement results (i.e.,∼ 54%) is taken as the lump sumof reflection lossesPre f from all sections of the optrode. From the results and previous dis-cussion, it is estimated that reflection losses at the tip dominate the system loss; this includesboth the Fresnel reflectance on transmitted rays and rays that undergo two TIR’s and are com-pletely backreflected.Pre f for the smaller fibers is mainly due to reflection at the tips, whereasreflection from the base and backplane is included with values for the larger fibers.
4.3. Beam profiling
Beam profiling was performed to measure the effective spot size and divergence of the lightexiting the optrode tips. Table 3 shows values of the beam width (2W0) calculated at 13.5%(1/e2) of the peak power at the optrode tip for different lengths, while Table 4 lists the far-fieldfull divergence angle (φ ). The measurements were made with 0.22 NA fibers of different coresizes at the input side without any index matching fluid.
The optrode output beam exhibits an approximate gaussian profile (1.56M2 fit on average)similar to that in Fig. 13;M2 fit values of the profiles are also listed, in parentheses, in Table 3.Precise values of the beam width across different rows for the same input fiber were measured.For increasing fiber diameter, it appears that the beam width increases as well. However, valuesfor the 200-µmfiber seem anomalous, which might be an effect of the higher divergence of thisparticular fiber as measured from the beam profiler.
The beam divergence depends on the divergence of the input fiber as well. More importantly,it varies with the optrode length/taper; the beam diverges more from the more tapered shorter
(C) 2012 OSA 1 September 2012 / Vol. 3, No. 9 / BIOMEDICAL OPTICS EXPRESS 2214#168581 - $15.00 USD Received 15 May 2012; revised 8 Aug 2012; accepted 10 Aug 2012; published 24 Aug 2012
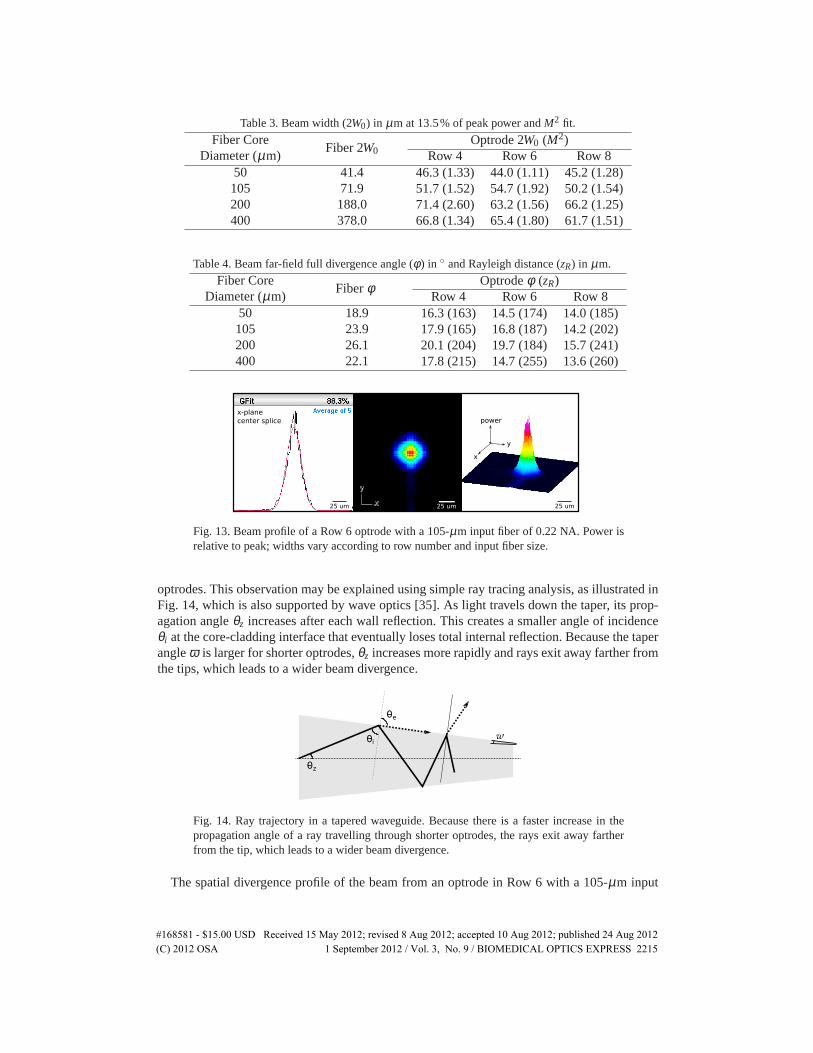
Table 3. Beam width (2W0) in µm at 13.5% of peak power andM2 fit.
Fiber CoreDiameter(µm)
Fiber 2W0Optrode 2W0 (M2)
Row 4 Row 6 Row 850 41.4 46.3(1.33) 44.0 (1.11) 45.2 (1.28)105 71.9 51.7 (1.52) 54.7 (1.92) 50.2 (1.54)200 188.0 71.4 (2.60) 63.2 (1.56) 66.2 (1.25)400 378.0 66.8 (1.34) 65.4 (1.80) 61.7 (1.51)
Table 4. Beam far-field full divergence angle (φ ) in and Rayleigh distance (zR) in µm.
Fiber CoreDiameter(µm)
Fiberφ Optrodeφ (zR)Row 4 Row 6 Row 8
50 18.9 16.3(163) 14.5 (174) 14.0 (185)105 23.9 17.9 (165) 16.8 (187) 14.2 (202)200 26.1 20.1 (204) 19.7 (184) 15.7 (241)400 22.1 17.8 (215) 14.7 (255) 13.6 (260)
x
y
powerx-plane
center splice
x
y
25 um 25 um 25 um
Fig. 13. Beam profile of a Row 6 optrode with a 105-µm input fiber of 0.22 NA. Power isrelative to peak; widths vary according to row number and input fiber size.
optrodes. This observation may be explained using simple ray tracing analysis, as illustrated inFig. 14, which is also supported by wave optics [35]. As light travels down the taper, its prop-agation angleθz increases after each wall reflection. This creates a smaller angle of incidenceθi at the core-cladding interface that eventually loses total internal reflection. Because the taperangleω is larger for shorter optrodes,θz increases more rapidly and rays exit away farther fromthe tips, which leads to a wider beam divergence.
0z
0
0e
iw
Fig. 14. Ray trajectory in a tapered waveguide. Because there is a faster increase in thepropagation angle of a ray travelling through shorter optrodes, the rays exit away fartherfrom the tip, which leads to a wider beam divergence.
The spatial divergence profile of the beam from an optrode in Row 6 with a 105-µm input
(C) 2012 OSA 1 September 2012 / Vol. 3, No. 9 / BIOMEDICAL OPTICS EXPRESS 2215#168581 - $15.00 USD Received 15 May 2012; revised 8 Aug 2012; accepted 10 Aug 2012; published 24 Aug 2012
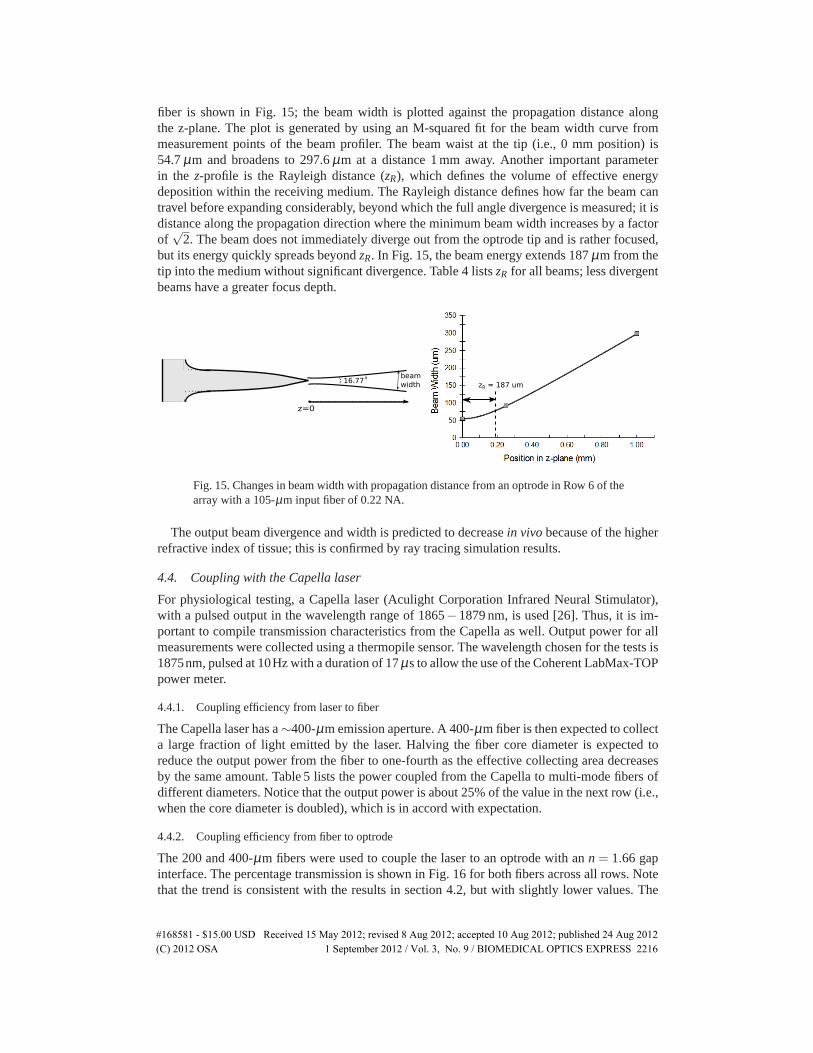
fiber is shown in Fig. 15; the beam width is plotted against the propagation distance alongthe z-plane. The plot is generated by using an M-squared fit for the beam width curve frommeasurement points of the beam profiler. The beam waist at the tip (i.e., 0 mm position) is54.7µm and broadens to 297.6µm at a distance 1 mm away. Another important parameterin the z-profile is the Rayleigh distance (zR), which defines the volume of effective energydeposition within the receiving medium. The Rayleigh distance defines how far the beam cantravel before expanding considerably, beyond which the full angle divergence is measured; it isdistance along the propagation direction where the minimum beam width increases by a factorof
√2. The beam does not immediately diverge out from the optrode tip and is rather focused,
but its energy quickly spreads beyondzR. In Fig. 15, the beam energy extends 187µm from thetip into the medium without significant divergence. Table 4 listszR for all beams; less divergentbeams have a greater focus depth.
z=0
16.77o beam
width zR = 187 um
Fig. 15. Changes in beam width with propagation distance from an optrode in Row 6 of thearraywith a 105-µm input fiber of 0.22 NA.
The output beam divergence and width is predicted to decreasein vivobecause of the higherrefractive index of tissue; this is confirmed by ray tracing simulation results.
4.4. Coupling with the Capella laser
For physiological testing, a Capella laser (Aculight Corporation Infrared Neural Stimulator),with a pulsed output in the wavelength range of 1865−1879 nm, is used [26]. Thus, it is im-portant to compile transmission characteristics from the Capella as well. Output power for allmeasurements were collected using a thermopile sensor. The wavelength chosen for the tests is1875nm, pulsed at 10Hz with a duration of 17µs to allow the use of the Coherent LabMax-TOPpower meter.
4.4.1. Coupling efficiency from laser to fiber
The Capella laser has a∼400-µm emission aperture. A 400-µm fiber is then expected to collecta large fraction of light emitted by the laser. Halving the fiber core diameter is expected toreduce the output power from the fiber to one-fourth as the effective collecting area decreasesby the same amount. Table 5 lists the power coupled from the Capella to multi-mode fibers ofdifferent diameters. Notice that the output power is about 25% of the value in the next row (i.e.,when the core diameter is doubled), which is in accord with expectation.
4.4.2. Coupling efficiency from fiber to optrode
The 200 and 400-µm fibers were used to couple the laser to an optrode with ann = 1.66 gapinterface. The percentage transmission is shown in Fig. 16 for both fibers across all rows. Notethat the trend is consistent with the results in section 4.2, but with slightly lower values. The
(C) 2012 OSA 1 September 2012 / Vol. 3, No. 9 / BIOMEDICAL OPTICS EXPRESS 2216#168581 - $15.00 USD Received 15 May 2012; revised 8 Aug 2012; accepted 10 Aug 2012; published 24 Aug 2012
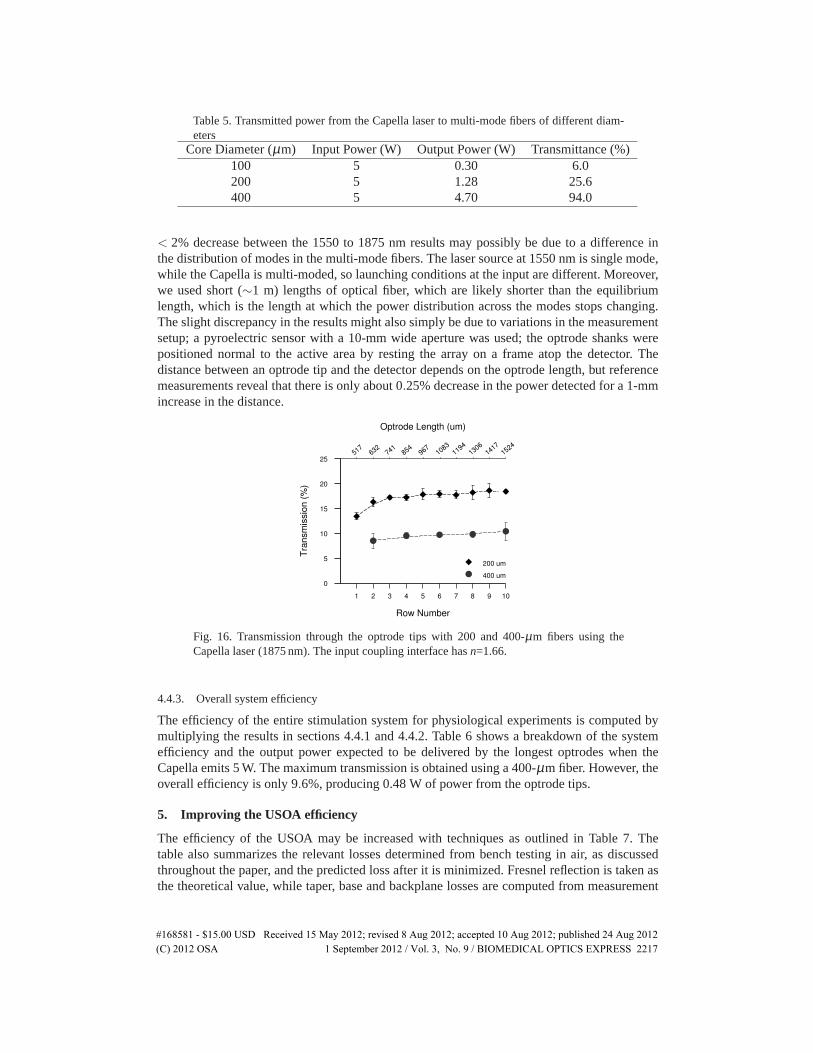
Table 5. Transmitted power from the Capella laser to multi-mode fibers of different diam-eters
Core Diameter (µm) Input Power (W) Output Power (W) Transmittance (%)100 5 0.30 6.0200 5 1.28 25.6400 5 4.70 94.0
< 2% decrease between the 1550 to 1875 nm results may possibly be due to a difference inthe distribution of modes in the multi-mode fibers. The laser source at 1550 nm is single mode,while the Capella is multi-moded, so launching conditions at the input are different. Moreover,we used short (∼1 m) lengths of optical fiber, which are likely shorter than the equilibriumlength, which is the length at which the power distribution across the modes stops changing.The slight discrepancy in the results might also simply be due to variations in the measurementsetup; a pyroelectric sensor with a 10-mm wide aperture was used; the optrode shanks werepositioned normal to the active area by resting the array on a frame atop the detector. Thedistance between an optrode tip and the detector depends on the optrode length, but referencemeasurements reveal that there is only about 0.25% decrease in the power detected for a 1-mmincrease in the distance.
Row Number
Transmission(%
)
1 2 3 4 5 6 7 8 9 10
Optrode Length (um)
517
632
741
854
967
1083
1194
1306
1417
1524
0
5
10
15
20
25
200 um
400 um
Fig. 16. Transmission through the optrode tips with 200 and 400-µm fibers using theCapella laser (1875 nm). The input coupling interface hasn=1.66.
4.4.3. Overall system efficiency
The efficiency of the entire stimulation system for physiological experiments is computed bymultiplying the results in sections 4.4.1 and 4.4.2. Table 6 shows a breakdown of the systemefficiency and the output power expected to be delivered by the longest optrodes when theCapella emits 5 W. The maximum transmission is obtained using a 400-µm fiber. However, theoverall efficiency is only 9.6%, producing 0.48 W of power from the optrode tips.
5. Improving the USOA efficiency
The efficiency of the USOA may be increased with techniques as outlined in Table 7. Thetable also summarizes the relevant losses determined from bench testing in air, as discussedthroughout the paper, and the predicted loss after it is minimized. Fresnel reflection is taken asthe theoretical value, while taper, base and backplane losses are computed from measurement
(C) 2012 OSA 1 September 2012 / Vol. 3, No. 9 / BIOMEDICAL OPTICS EXPRESS 2217#168581 - $15.00 USD Received 15 May 2012; revised 8 Aug 2012; accepted 10 Aug 2012; published 24 Aug 2012
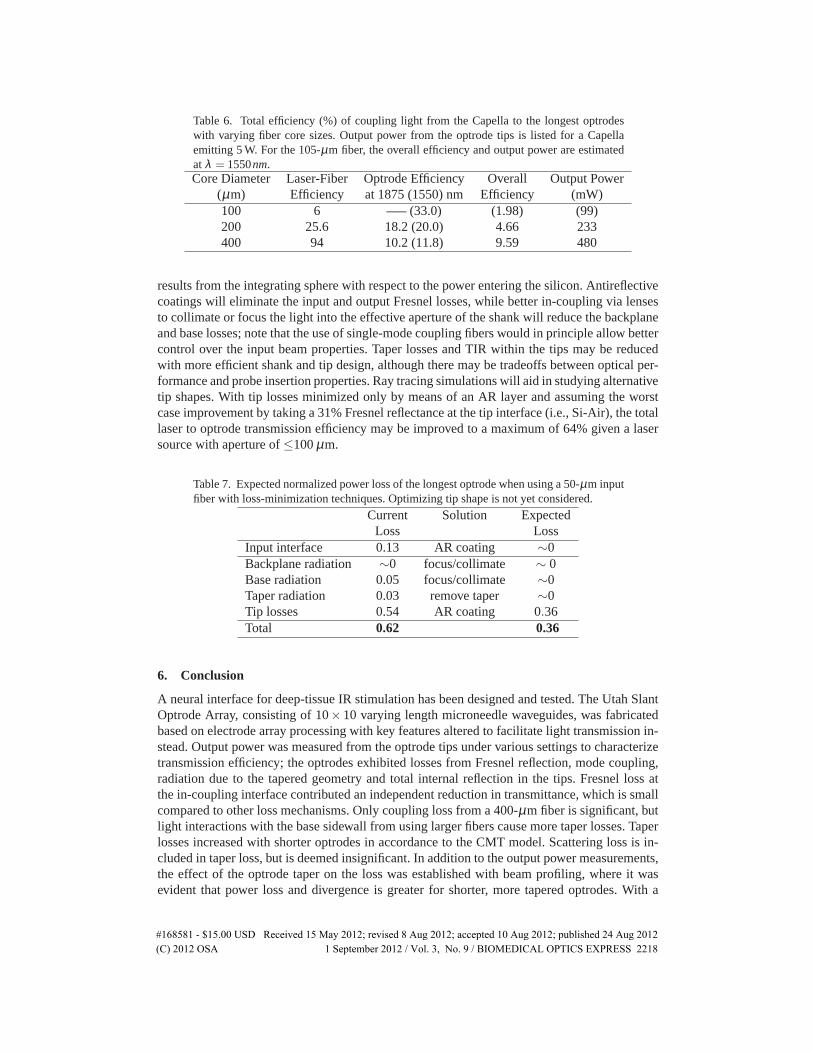
Table 6. Total efficiency (%) of coupling light from the Capella to the longest optrodeswith varying fiber core sizes. Output power from the optrode tips is listed for a Capellaemitting 5 W. For the 105-µm fiber, the overall efficiency and output power are estimatedat λ = 1550nm.Core Diameter Laser-Fiber Optrode Efficiency Overall Output Power
(µm) Efficiency at 1875 (1550) nm Efficiency (mW)100 6 —– (33.0) (1.98) (99)200 25.6 18.2 (20.0) 4.66 233400 94 10.2 (11.8) 9.59 480
results from the integrating sphere with respect to the power entering the silicon. Antireflectivecoatingswill eliminate the input and output Fresnel losses, while better in-coupling via lensesto collimate or focus the light into the effective aperture of the shank will reduce the backplaneand base losses; note that the use of single-mode coupling fibers would in principle allow bettercontrol over the input beam properties. Taper losses and TIR within the tips may be reducedwith more efficient shank and tip design, although there may be tradeoffs between optical per-formance and probe insertion properties. Ray tracing simulations will aid in studying alternativetip shapes. With tip losses minimized only by means of an AR layer and assuming the worstcase improvement by taking a 31% Fresnel reflectance at the tip interface (i.e., Si-Air), the totallaser to optrode transmission efficiency may be improved to a maximum of 64% given a lasersource with aperture of≤100µm.
Table 7. Expected normalized power loss of the longest optrode when using a 50-µm inputfiber with loss-minimization techniques. Optimizing tip shape is not yet considered.
Current Solution ExpectedLoss Loss
Input interface 0.13 AR coating ∼0Backplane radiation ∼0 focus/collimate ∼ 0Base radiation 0.05 focus/collimate ∼0Taper radiation 0.03 remove taper ∼0Tip losses 0.54 AR coating 0.36Total 0.62 0.36
6. Conclusion
A neural interface for deep-tissue IR stimulation has been designed and tested. The Utah SlantOptrode Array, consisting of 10×10 varying length microneedle waveguides, was fabricatedbased on electrode array processing with key features altered to facilitate light transmission in-stead. Output power was measured from the optrode tips under various settings to characterizetransmission efficiency; the optrodes exhibited losses from Fresnel reflection, mode coupling,radiation due to the tapered geometry and total internal reflection in the tips. Fresnel loss atthe in-coupling interface contributed an independent reduction in transmittance, which is smallcompared to other loss mechanisms. Only coupling loss from a 400-µm fiber is significant, butlight interactions with the base sidewall from using larger fibers cause more taper losses. Taperlosses increased with shorter optrodes in accordance to the CMT model. Scattering loss is in-cluded in taper loss, but is deemed insignificant. In addition to the output power measurements,the effect of the optrode taper on the loss was established with beam profiling, where it wasevident that power loss and divergence is greater for shorter, more tapered optrodes. With a
(C) 2012 OSA 1 September 2012 / Vol. 3, No. 9 / BIOMEDICAL OPTICS EXPRESS 2218#168581 - $15.00 USD Received 15 May 2012; revised 8 Aug 2012; accepted 10 Aug 2012; published 24 Aug 2012

100-µm fiber delivering 1550-nm light to the optrode, the beam width at the tip is about 55µmand diverges in the far-field at a full angle of 17. The majority of the system loss for smallerinput fibers is attributed to tip losses, which includes both Fresnel and total internal reflection.
Similar tests were performed with more direct relevance to physiological studies using theCapella laser. The coupling losses from the laser to fibers of smaller than 400-µm diameterdominate the overall system loss, overcoming the gain in fiber to optrode coupling efficiencyoffered by the smaller diameter fibers. A maximum system efficiency of only about 10% isobtained with the 400-µm fiber. Greater system efficiencies can be obtained using light sourceswith effective emission apertures smaller than 400µm.
Improvements such as AR coating, focusing/collimating the input beams and removing thetaper will increase the efficiency of the optrode array to a maximum of 64%. Taking into accountthe actual (i.e., higher) reflectance loss inside the tips and redesigning the tip shape will yieldeven higher efficiency values.
Acknowledgements
This work was funded by the University of Utah Research Foundation. We also acknowledgesupport by Lockheed Martin Aculight.
(C) 2012 OSA 1 September 2012 / Vol. 3, No. 9 / BIOMEDICAL OPTICS EXPRESS 2219#168581 - $15.00 USD Received 15 May 2012; revised 8 Aug 2012; accepted 10 Aug 2012; published 24 Aug 2012

![[Array, Array, Array, Array, Array, Array, Array, Array, Array, Array, Array, Array]](https://static.fdocuments.in/doc/165x107/56816460550346895dd63b8b/array-array-array-array-array-array-array-array-array-array-array.jpg)