Characterization and Model Prediction of CBR...
17
International Journal of Scientific Engineering and Applied Science (IJSEAS) – Volume-2, Issue-6,June 2016 ISSN: 2395-3470 www.ijseas.com 193 Characterization and Model Prediction of CBR Parameters of Stabilized Ebidang Residual Soils, Akwa Ibom State, Nigeria. Essien Udo, Charles Kennedy Department of Civil Engineering, University of Uyo, Nigeria Abstract: Quarry dust and cement stabilization of Ebidang residual soils were essentially designed to improve the engineering properties and to ascertain structural behaviour on engineering applications. The major goal of treating a residual soil is to increase the shear strength and loading capacity. The laboratory stabilization experiments involved four different soil samples from four distinct borrow pits. Quarry dust content varied from 10% to70% and complemented by residual soil which content varied from 90% to 30% respectively. CBR results obtained ranged from 55% to 107%.Conversely cement content utilized ranged from 2% to 10% and the residual soil content varied from 98% to 90% respectively. The CBR values obtained ranged from 56% to 127%. From the results cement stabilization tends to generate optimal values of CBR as compared to quarry dust stabilization. The contribution of hydrated calcium silicates [CR 2 RSHx.CR 3 RSR 2 RHR X R] and calcium aluminates [CR 2 RAHR X R.CR 4 RAHR X R] in cement tend to increase the bonding between particulate structures resulting in plasticity reduction hence gaining in strength propagation. Finally multiple non-regressed models were developed to aid prediction and optimization of CBR parameters of Ebidang residual soils at various levels of physical and chemical stabilizations. Keywords: Quarry Dust, Cement, Residual Soil, Stabilization. I Introduction The soil investigation was carried out along Ikot Ebidang, Onna in Akwa Ibom State, Nigeria. The exercise was for the proposed Ebidang-Ebekpo road; a seven kilometres stretch for the purpose of designing appropriate pavement system to aid transportation and economical movement of goods and services. The investigation was aimed at studying the geotechnical properties of the soil in order to provide appropriate data for the design processes and recommend acceptable fill materials during the construction activity. The topography of Ebidang area is basically undulating and covered by granitic residual soils. Residual soils are heterogeneous due to variable weathering of the jointed rock mass P 1 P[Thurairajah, et.al. 1992]. During high peaked rainfall water logs and muddy pools are found along certain portions of the route location. The soils are unique in formation, pleasing in appearance and deceptive in engineering applications. Stabilization is an improvement process designed to achieve a relatively higher shearing resistance, loading capacity, stability and settlement in soils applied for engineering purposes. Quarry dust as a stabilizer will provide sufficient fines to fill the voids thus giving a compact and high load bearing capacity. In all practical cases, the primary ingredient necessary for stabilizing soils is calcium [% of cement]. In addition to plasticity reduction, Portland cement, by its inherent nature of producing strength, developing hydration products, provides improved strength and durability. Therefore the effectiveness of stabilization is based on the number of positions of exchangeable ions – mineralogical composition which is related to liquid limit and the amount of liberated calcium ions from cement [% of cement, % of compaction and curing time] which influences the durability [bonding effect]. II Materials Selected 2.1 Ebidang Residual Soil
Transcript of Characterization and Model Prediction of CBR...

International Journal of Scientific Engineering and Applied Science (IJSEAS) – Volume-2, Issue-6,June 2016 ISSN: 2395-3470
www.ijseas.com
193
Characterization and Model Prediction of CBR Parameters of Stabilized Ebidang Residual Soils, Akwa Ibom State, Nigeria.
Essien Udo, Charles Kennedy
Department of Civil Engineering, University of Uyo, Nigeria
Abstract: Quarry dust and cement stabilization of Ebidang residual soils were essentially designed to improve the engineering properties and to ascertain structural behaviour on engineering applications. The major goal of treating a residual soil is to increase the shear strength and loading capacity. The laboratory stabilization experiments involved four different soil samples from four distinct borrow pits. Quarry dust content varied from 10% to70% and complemented by residual soil which content varied from 90% to 30% respectively. CBR results obtained ranged from 55% to 107%.Conversely cement content utilized ranged from 2% to 10% and the residual soil content varied from 98% to 90% respectively. The CBR values obtained ranged from 56% to 127%. From the results cement stabilization tends to generate optimal values of CBR as compared to quarry dust stabilization. The contribution of hydrated calcium silicates [CR2RSHx.CR3RSR2RHRXR] and calcium aluminates [CR2RAHRXR.CR4RAHRXR] in cement tend to increase the bonding between particulate structures resulting in plasticity reduction hence gaining in strength propagation. Finally multiple non-regressed models were developed to aid prediction and optimization of CBR parameters of Ebidang residual soils at various levels of physical and chemical stabilizations.
Keywords: Quarry Dust, Cement, Residual Soil, Stabilization. I Introduction
The soil investigation was carried out along Ikot Ebidang, Onna in Akwa Ibom State, Nigeria. The exercise was for the proposed Ebidang-Ebekpo road; a seven kilometres stretch for the purpose of designing appropriate pavement system to aid transportation and economical movement of goods and services. The investigation was aimed at studying the geotechnical properties of the soil in order to provide appropriate data for the design processes and recommend acceptable fill materials during the construction activity. The topography of Ebidang area is basically undulating and covered by granitic residual soils. Residual soils are heterogeneous due to variable weathering of the jointed rock mass P
1P[Thurairajah, et.al. 1992]. During high peaked rainfall water logs and muddy pools are found
along certain portions of the route location. The soils are unique in formation, pleasing in appearance and deceptive in engineering applications. Stabilization is an improvement process designed to achieve a relatively higher shearing resistance, loading capacity, stability and settlement in soils applied for engineering purposes. Quarry dust as a stabilizer will provide sufficient fines to fill the voids thus giving a compact and high load bearing capacity. In all practical cases, the primary ingredient necessary for stabilizing soils is calcium [% of cement]. In addition to plasticity reduction, Portland cement, by its inherent nature of producing strength, developing hydration products, provides improved strength and durability. Therefore the effectiveness of stabilization is based on the number of positions of exchangeable ions – mineralogical composition which is related to liquid limit and the amount of liberated calcium ions from cement [% of cement, % of compaction and curing time] which influences the durability [bonding effect].
II Materials Selected
2.1 Ebidang Residual Soil

International Journal of Scientific Engineering and Applied Science (IJSEAS) – Volume-2, Issue-6,June 2016 ISSN: 2395-3470
www.ijseas.com
194
Samples of residual soils selected for this research were dug with shovels from four dist inct borrow-pits along the proposed road at ki lometres 1+500, 2+750, 4+250 and 6+750 respectively. The soil samples were disturbed and at depths varying from 3.0 meters to 5.0 meters of the profi le. The samples were excavated bearing in mind the variabil i ty of residual soil in i ts natural composit ion. Hence the soil samples were excavated both vert ically and lateral ly and thoroughly blended. The samples were conveyed in four, 50kg nylon bags, carefully tagged for identif icat ion purpose and transported to the Mothercat Limited, Materials Testing Laboratory at Uyo. The samples and locations are as i temized below:
Sample Identification Location 1 km 1+500 Ebidang-Ebekpo Road 2 km 2+750 Ebidang-Ebekpo Road 3 km 4+250 Ebidang-Ebekpo Road 4 km 6+750 Ebidang-Ebekpo Road 2.2 Quarry Dust
The quarry dust used in this experiment came from the l imestone quarry factory in Akamkpa, Cross River State. This is the by-product or sediments derived from the crushing of l imestone. This soil modifying agent has a high percentage of fines, and its application as stabil izer wil l increase the bonding characterist ics of the composite material thereby increasing the shearing resistance of the residual soil .
2 .3 Ordinary Portland Cement
Soils most suitable for cement stabilization are mixtures of sand and gravel of good grade, and with less than 10% fines passing 75mm sieve and with coefficient of uniformity of not less than 5. Any type of cement can be used to stabilize soil, but the most commonly used is the ordinary Portland cement. The presence of organic and sulphate materials inside the soil is generally believed to prevent the cement from hardening. The curing time [time of reactions provided by cation exchange and flocculation processes] plays a vital role in the development of efficient cement-stabilization P
2P[Stavridakis, 2006]. The lower strength and durability of clay soils stabilized by cement,
after soaking in water (environmental condition of wetting) are attributed to the higher water absorbing capacity of the active clay fraction. Cement which is mixed with soil is hydrated, turning into the well-known hydrated compounds if water content is enough. The main hydration products are silicates and calcium hydrate aluminates and hydrated lime which deposits form a separate crystal solid phase. When the pore water of the soil encounters with cement, hydration of the cement occurs rapidly and the major hydration (primary cementations) produces hydrated calcium si licate (C R2 RSHx, C R4 RAHx) and hydrated l ime Ca(OH) R2 R P
3P[Bergado,
et .al .1996].Therefore the effectiveness of stabilization is based on the time (curing-soaking time) of reactions provided by cat-ion exchange and flocculation processes.
III Preparation and Testing of Samples
3.1 Gradation Test The samples were air-dried for three weeks. The next step was to sieve through 20mm diameter sieve and any particle retained was broken with rubber hammer or thrown away. With the aid of a riffle box the quantity of material needed or five hundred grams each of the soil samples were extracted and

International Journal of Scientific Engineering and Applied Science (IJSEAS) – Volume-2, Issue-6,June 2016 ISSN: 2395-3470
www.ijseas.com
195
poured into sieve no.200 or 0.075mm diameter sieve and thoroughly washed to remove all clayey materials finer than the 0.075mm diameter. The particles retained were oven-dried, weighed and mechanically sieved in a shaker.
3.2 Liquid Limit Test The air-dried samples were quantified through a sample divider – the riffle box – and sieved through 425μm test sieve. 50g of material passing through this sieve was used for the liquid limit test. The sample was put in a flat glass plate, moisturized and thoroughly mixed with a spatula to a thick homogeneous paste. The paste was preserved in air-tight polythene sack for 24 hours to allow water permeate the entire sample, devoid of moisture evaporation. It was then put back into the glass plate and properly mixed for 15 minutes. Finally the paste was then put into the Casagrande liquid limit apparatus, grooved to V-shape as per specification, to determine the number of blows that will be required to bring the two parts into contact. The range of blows varied from 10-15, 15-20, 21-30, and 31-40 and for various moisture contents.
3.3 Plastic Limit Test
Sixty grams of samples passing the 425μm test sieve was moisturized and thoroughly mixed in the glass plate until it becomes homogeneous and plastic, enough to be shaped into a ball. The ball was then rolled between the palms of the hand, until the heat of hands dried the sample sufficiently for slight cracks to appear on its surface. It was then rolled continuously forward and backward in between the finger and glass plate until the pressure was sufficient to reduce the diameter of the thread to about 3mm. The procedure was repeated until the thread sheared (crumbled) both longitudinally and transversely. This test determines the lowest moisture content at which the soil is plastic.
3.4 Plain Mechanical Compaction The Modified Proctor compaction tests were conducted for each of the samples. The air-dried material was divided into five equal parts through a riffle box and weighed to 6000g each. Each sample was poured into the mixing plate. A particular percentage of distilled water was poured into each plate and thoroughly mixed with a trowel. An interval of about sixty minutes was allowed for the moisture to fully permeate the soil sample. The sample was thereafter divided into five equal parts, weighed and each was poured into the compaction mould, in five layers and compacted at 61 blows each using a 4.5kg rammer falling over a height of 450mm above the top of the mould. The blows were evenly distributed over the surface of each layer. The collar of the mould was then removed and the compacted sample weighed while the corresponding moisture content was noted. The procedure was repeated with different moisture contents until the weight of compacted sample was noted to be decreasing. With the optimum moisture content obtained from the Modified Proctor test, samples were prepared in the CBR mould and values for the plain mechanical compaction were read for both top and bottom at various depths of penetration. This test was conducted to determine the mass of dry soil per cubic meter and the soil was compacted in a specified manner over a range of moisture contents. 3 .5 Quarry Dust Stabilization Tests
Different percentages of quarry dust varying from 10%, 20%, 30%, 40%. 50%, 60% and 70% were added to air-dried samples 1, 2, 3 and 4. Each of the test samples was thoroughly blended with a trowel, divided into five parts with the aid of a r iffle box, moisturized and weighed. Thereafter the Modified Proctor compaction test was carried out to determine the OMC and MDD. Liquid l imit and plastic l imit tests were conducted on each of the samples. Based on the OMC and MDD results ,
International Journal of Scientific Engineering and Applied Science (IJSEAS) – Volume-2, Issue-6,June 2016 ISSN: 2395-3470
www.ijseas.com
196
CBR tests were then conducted on each specimen following five equal layers of compaction with 4.5kg rammer at 61 blows each fal l ing over 450mm height to the top of the mould. Equally the quarry dust content was varied from 10% to 70% corresponding to the OMC and MDD derived from the compacted tests .
3.6 Ordinary Portland Cement Stabil ization Tests.
The cement proport ions used varied from 2%, 4%, 6%, 8% to 10% by weight of the air-dried residual soil samples. The four soil samples 1, 2, 3 and 4 were deployed for the experiment. Correspondingly each sample of the residual soil varied from 98%, 96%, 94%, 92% to 90% of the cement proport ions. The mixture was thoroughly blended and a 6000g of each was divided into five equal parts and subjected to the Modified Proctor compaction tests . Liquid l imit and plast ic l imit tests were similarly conducted. With the optimum moisture content (OMC) and maximum dry density (MDD) values obtained, three CBR specimens were prepared at each cement content. One specimen was inserted into the CBR machine and penetration reading carried out to establish a base l ine. The remaining two specimens were wax cured for 6 days. The specimens were then soaked for 24 hours by complete immersion in water and al lowed to drain for 15 minutes.
3.7 California Bearing Ratio Tests
The CBR test [as it is commonly known] involves the determination of the load-deformation curve of the soil in the laboratory using the standard CBR testing equipment. It was originally developed by the California Division of Highways prior to World War 11 and was used in the design of some highway pavements. This test has now been modified and is standardized under the AASHTO designation of [T193]. With the OMC and MDD results, three specimens each were prepared for the CBR test. One specimen was tested immediately while the remaining two were wax cured for six days and thereafter soaked for 24 hours and allowed to drain for 15 minutes. After testing in CBR machine, the average of the two readings was adopted.
V Presentation of Test Results
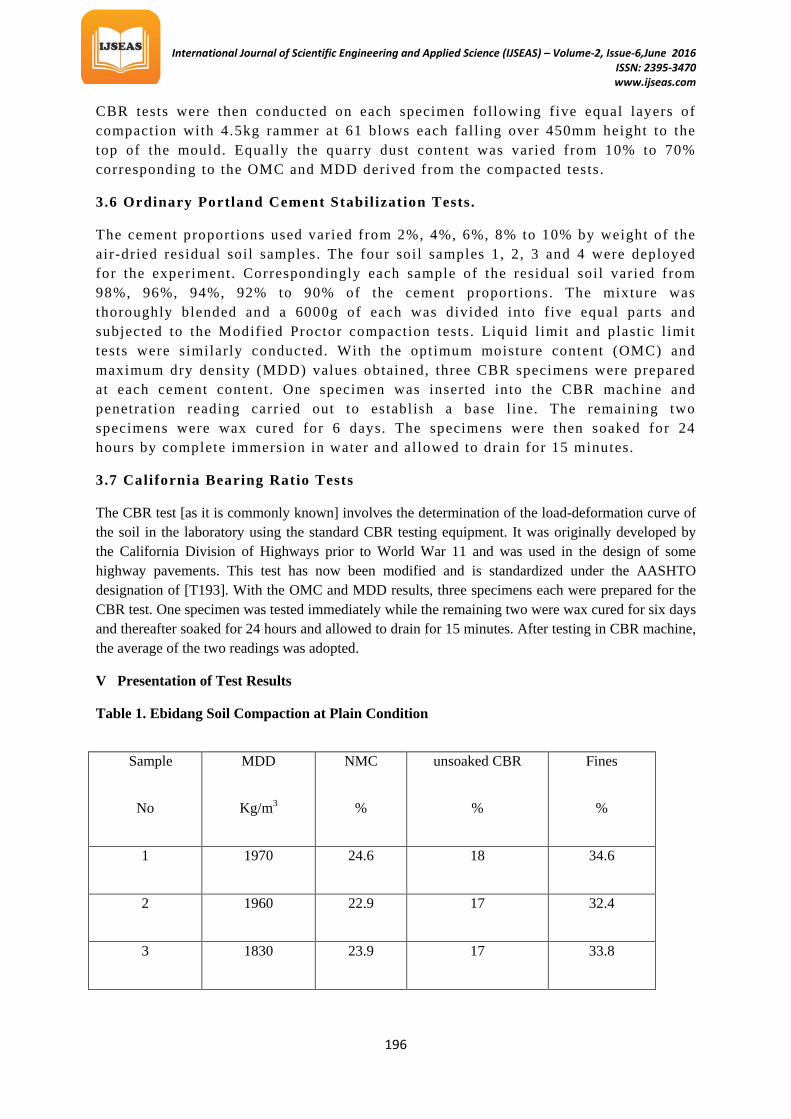
Table 1. Ebidang Soil Compaction at Plain Condition
Sample
No
MDD
Kg/mP
3
NMC
%
unsoaked CBR
%
Fines
%
1 1970 24.6 18 34.6
2 1960 22.9 17 32.4
3 1830 23.9 17 33.8

International Journal of Scientific Engineering and Applied Science (IJSEAS) – Volume-2, Issue-6,June 2016 ISSN: 2395-3470
www.ijseas.com
197
4 1820 24.1 16 34.4
Table 2: Ebidang Residual Soil and Quarry Dust Stabilization Sample No. 1
Quarry dust
Content
MDD
OMC CBR LL PL PI % passing
Sieve 200
Classification
% Kg/mP
3 % Unsoaked
%
AASHTO USCS
0
1970
16.5
18
34
22
12
34
A- 2 -6
SC
10
1980
22.4
55
31
21
10
26
A- 2 - 5
SM
20
2010
22
61
29
20
9
24
A- 2 -5
SM
30
2020
21
98
29
19
10
25
A- 2 -4
SM
40
2030
25
140
28
19
9
23
A- 2 – 4
SM
50
1910
16
151
21
15
8
30
A- 1 – b
SM
60
1950
15
64
19
NIL
NIL
19
A -1 - b
SM
70
1830
15.3
43
17
NIL
NIL
15
A – 1 - b
SM
International Journal of Scientific Engineering and Applied Science (IJSEAS) – Volume-2, Issue-6,June 2016 ISSN: 2395-3470
www.ijseas.com
198
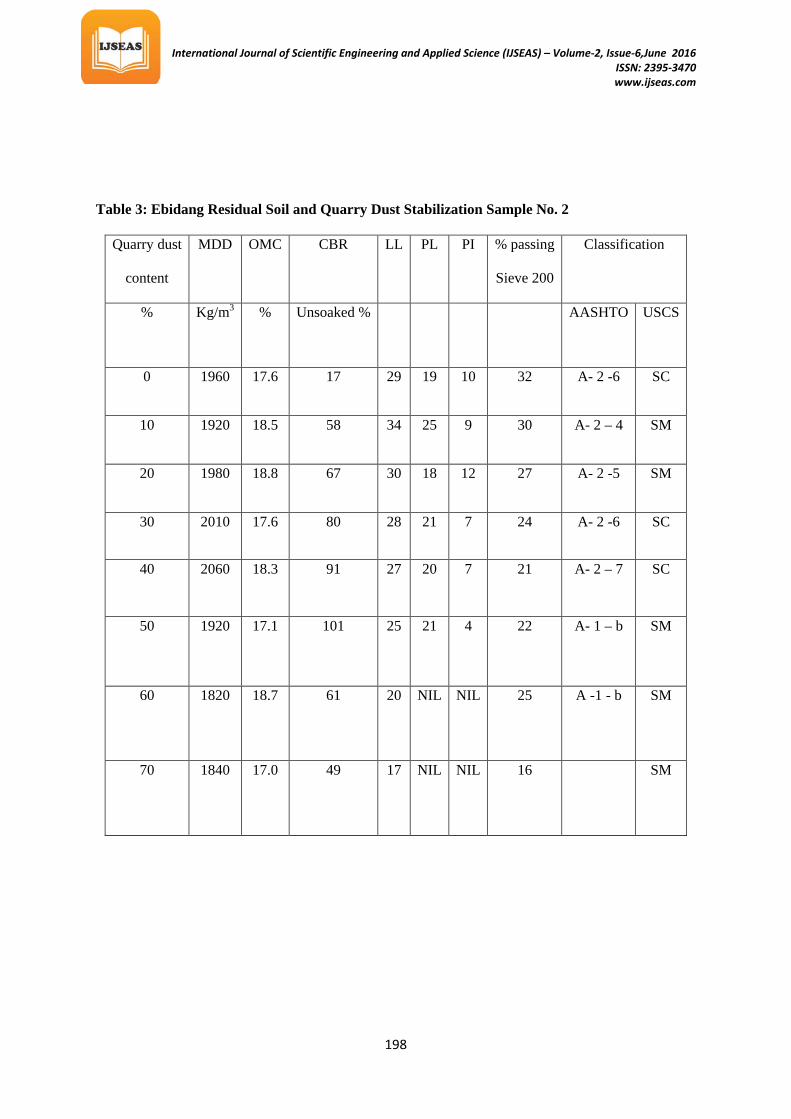
Table 3: Ebidang Residual Soil and Quarry Dust Stabilization Sample No. 2
Quarry dust
content
MDD
OMC CBR LL PL PI % passing
Sieve 200
Classification
% Kg/mP
3 % Unsoaked % AASHTO USCS
0 1960 17.6 17 29 19 10 32 A- 2 -6 SC
10 1920 18.5 58 34 25 9 30 A- 2 – 4 SM
20 1980 18.8 67 30 18 12 27 A- 2 -5 SM
30 2010 17.6 80 28 21 7 24 A- 2 -6 SC
40 2060 18.3 91 27 20 7 21 A- 2 – 7 SC
50 1920 17.1 101 25 21 4 22 A- 1 – b SM
60 1820 18.7 61 20 NIL NIL 25 A -1 - b SM
70 1840 17.0 49 17 NIL NIL 16 SM

International Journal of Scientific Engineering and Applied Science (IJSEAS) – Volume-2, Issue-6,June 2016 ISSN: 2395-3470
www.ijseas.com
199
Table 4: Ebidang Residual Soil and Quarry Dust Stabilization Sample No. 3
Table 5: Ebidang Residual Soil and Quarry Dust Stabilization Sample No. 4
Quarry dust
content
MDD
OMC CBR LL PL PI % passing
Sieve 200
Classification
% g/mP
3 % Unsoaked
%
AASHTO USCS
0 1830 23.9 32 35 24 11 31 A- 2 -6 SC
10 2010 21.6 56 28 18 10 30 A- 2 – 6 SC
20 1940 18.2 65 26 17 9 29 A- 2 -4 SM
30 2050 17.8 81 30 18 12 26 A- 2 -4 SM
40 2110 18.6 98 26 22 4 24 A- 2 – 4 SM
50 1950 16.0 75 28 23 4 22 A- 1 – b SM
60 1900 9.7 68 19 NIL NIL 18 A -1 - b SM
70 1930 11.8 83 17 NIL NIL 18 A – 1 - b SM
Quarry dust
content
MDD
OMC CBR LL PL PI % passing
Sieve 200
Classification
% Kg/mP
3 % Unsoaked % AASHTO USCS

International Journal of Scientific Engineering and Applied Science (IJSEAS) – Volume-2, Issue-6,June 2016 ISSN: 2395-3470
www.ijseas.com
200
Table 6: Ebidang Residual Soil and Cement Stabilization Sample No. 1
0 1820 24.8 16 34 20 14 23 A- 2 -6 SC
10 1980 20.6 57 27 15 12 25 A- 2 – 6 SC
20 1930 18.4 68 23 15 8 27 A- 2 -4 SM
30 2050 17.6 80 28 20 8 23 A- 2 -4 SM
40 2120 16.6 95 18 10 8 25 A- 1 – b SM
50 1950 15.6 107 17 10 7 25 A- 1 – b SM
60 1880 14.7 88 14 NIL NIL 16 A -1 - b SM
70 1910 8.3 72 18 NIL NIL 16 A – 1 - b SM
Cement
content
MDD
OMC soaked CBR LL PL PI % passing
Sieve 200
Classification
% Kg/mP
3 % % AASHTO USCS
0 1970 24.6 18 33 17 16 34 A- 2 - 4 SM
2 1980 22.2 56 28 20 8 39 A- 2 - 4 SM
4 1990 19.2 69 28 21 7 40 A- 2 - 4 SM
6 2030 17.8 81 27 22 5 41 A- 2 - 4 SM
8 2040 13.1 90 23 19 4 43 A- 2 – 4 SM

International Journal of Scientific Engineering and Applied Science (IJSEAS) – Volume-2, Issue-6,June 2016 ISSN: 2395-3470
www.ijseas.com
201
Table 7: Ebidang Residual Soil and Cement Stabilization Sample No.2
Table 8: Ebidang Residual Soil and Cement Stabilization Sample No.3
10 2050 12.1 111 18 NIL NIL 43 A- 2 - 4 SM
Cement
content
MDD
OMC soaked CBR LL PL PI % passing
Sieve 200
Classification
% Kg/mP
3 % % AASHTO USCS
0 1960 17.6 34 28 24 4 34 A- 2 - 4 SM
2 2030 16.4 61 23 16 9 33 A- 2 - 4 SM
4 2120 15.1 80 22 16 6 33 A- 2 - 4 SM
6 2030 14.8 83 21 15 6 31 A- 2 - 4 SM
8 2060 13.2 91 18 12 6 30 A – 2 - 4 SM
10 2060 11.4 101 16 NIL NIL 27 A – 2 - 4 SM
Cement
content
MDD
OMC soaked CBR LL PL PI % passing
Sieve 200
Classification
% Kg/mP
3 % % AASHTO USCS
0 1830 23.9 32 30 22 10 24 A- 2 - 4 SM

International Journal of Scientific Engineering and Applied Science (IJSEAS) – Volume-2, Issue-6,June 2016 ISSN: 2395-3470
www.ijseas.com
202
Table 9: Ebidang Residual Soil and Cement Stabilization Sample No.4
V Discussion of Test Results
Table 1 presents the result of Ebidang residual soil compaction devoid of any modifier. From the results the MDD varies from 1820kg/mP
3 Pto 1970kg/mP
3P within the four locations. The NMC fluctuates
2 2110 20.2 76 29 20 9 27 A- 2 - 4 SM
4 2050 18.8 78 28 20 8 30 A- 2 - 4 SM
6 2040 16.3 83 27 20 7 32 A- 2 - 4 SM
8 2050 15.7 95 27 22 5 30 A- 2 – 4 SM
10 2050 15.2 113 18 NIL NIL 32 A- 2 - 4 SM
Cement
content
MDD
OMC soaked
CBR
LL PL PI % passing
Sieve 200
Classification
% Kg/mP
3 % % AASHTO USCS
0 1820 24.1 18 28 20 8 35 A- 2 - 4 SM
2 2130 14.2 76 30 20 12 26 A- 2 - 4 SM
4 2050 13.9 86 28 20 8 27 A- 2 - 4 SM
6 2060 12.5 116 29 21 8 30 A- 2 - 4 SM
8 2060 14.8 127 26 21 5 30 A- 2 – 4 SM
10 2340 13.2 124 18 NIL NIL 33 A- 2 - 4 SM
International Journal of Scientific Engineering and Applied Science (IJSEAS) – Volume-2, Issue-6,June 2016 ISSN: 2395-3470
www.ijseas.com
203
from 22.9% to 24.6%. The CBR varies from 16% to 18% while the fines content fluctuates between 32.4% and 34.6%.
Tables 2 to 5 present the results of quarry dust stabilized Ebidang residual soils from the four distinct borrow pits. The classification method adopted utilizes both the grading size distribution system as well as the plasticity-limit based systems. The grading or grain-size distribution classification emphasizes the certainty of behaviour. The plasticity index classification provides a soil profile over depth with the probability of belonging to different soil types which more realistically and continuously reflect the in-situ soil characterization which involves the variability of soil type. From all the samples and with the deployment of 10% quarry dust and 90% residual soil content, the resultant MDD and CBR values are 1980kg/m P
3P,1920kg/m P
3P,2010kg/m P
3P,1980kg/m P
3 Pand 55%,58%,56%,57% respectively. With an
increase in quarry dust content to 30% and residual soil content to 70%, the resultant MDD and CBR values are 2020kg/m P
3P, P
P2010kg/m P
3P, P
P2050kg/m P
3P,2050kg/m P
3P and 98%, 80%, 81%, 80%
respectively.
Tables 6 to 9 present the results of Ebidang residual soil and cement stabilization. From the results it is observed that with a 2% cement content and 98% residual soil, the MDD and CBR values generated from the four samples are 1980kg/mP
3P, 2030kg/mP
3P, 2110kg/mP
3P, 2130kg/mP
3P and P
P 56%, 61%, 76%, 76%
respectively. A further increase in cement content to 4% revealed MDD and CBR values as 1990kg/mP
3P, 2120kg/mP
3P, 2050kg/mP
3P, 2050kg/mP
3P and 69%, 80%, 78%, 86% respectively. In a nutshell
increase in cement content from 2% to 8% appreciates both the MDD and CBR values. However above 8% the samples are observed to be devoid of plasticity hence less useful in engineering applications.
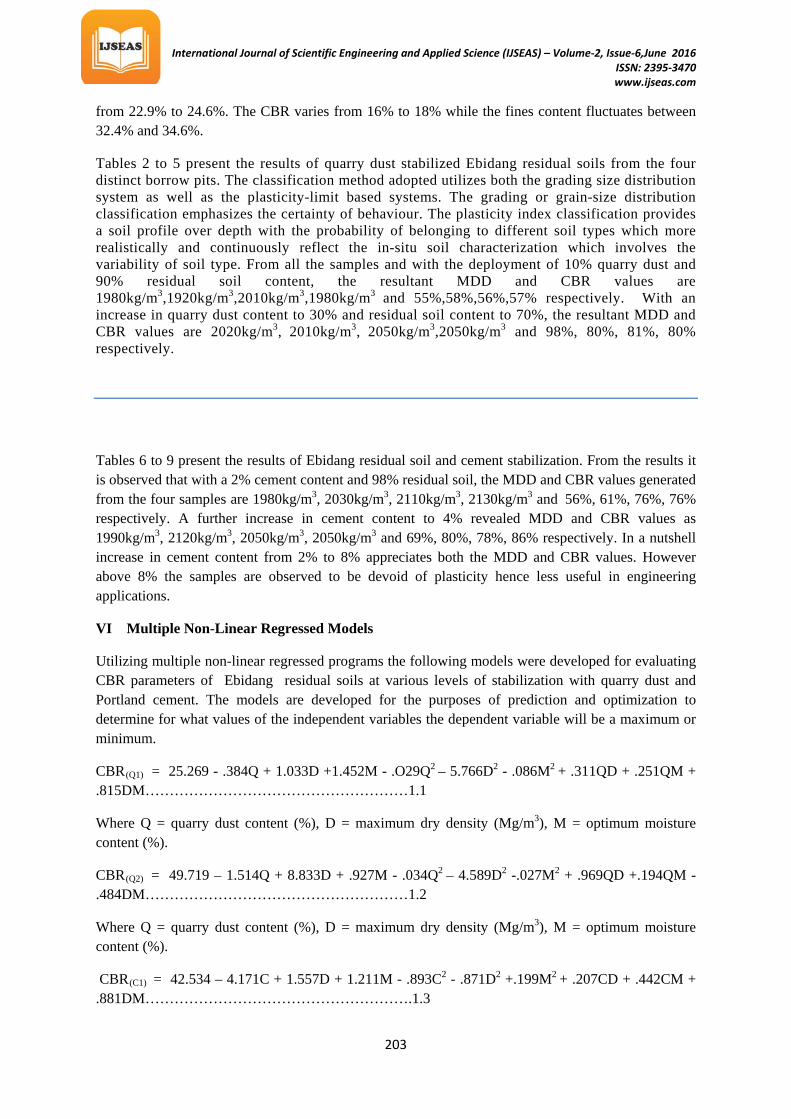
VI Multiple Non-Linear Regressed Models
Utilizing multiple non-linear regressed programs the following models were developed for evaluating CBR parameters of Ebidang residual soils at various levels of stabilization with quarry dust and Portland cement. The models are developed for the purposes of prediction and optimization to determine for what values of the independent variables the dependent variable will be a maximum or minimum.
CBRR(Q1) R = 25.269 - .384Q + 1.033D +1.452M - .O29QP
2 P– 5.766DP
2P - .086MP
2 P+ .311QD + .251QM +
.815DM………………………………………………1.1
Where Q = quarry dust content (%), D = maximum dry density (Mg/mP
3P), M = optimum moisture
content (%).
CBRR(Q2) R= 49.719 – 1.514Q + 8.833D + .927M - .034QP
2 P– 4.589DP
2P -.027M P
2P + .969QD +.194QM -
.484DM………………………………………………1.2
Where Q = quarry dust content (%), D = maximum dry density (Mg/mP
3P), M = optimum moisture
content (%).
CBRR(C1) R= 42.534 – 4.171C + 1.557D + 1.211M - .893CP
2P - .871DP
2P +.199MP
2 P+ .207CD + .442CM +
.881DM……………………………………………….1.3
International Journal of Scientific Engineering and Applied Science (IJSEAS) – Volume-2, Issue-6,June 2016 ISSN: 2395-3470
www.ijseas.com
204
Where C = cement content (%), D = maximum dry density (Mg/mP
3P), M = optimum moisture content
(%).
CBRR(C2) R= 75.451 – 2.375C + 3.431D + .446M - .181CP
2 P–1.661DP
2 P+.011MP
2P +.952CD + .271CM +
.224DM……………………………………………….1.4
Where C = cement content (%), D = maximum dry density (Mg/mP
3P), M = optimum moisture content
(%).
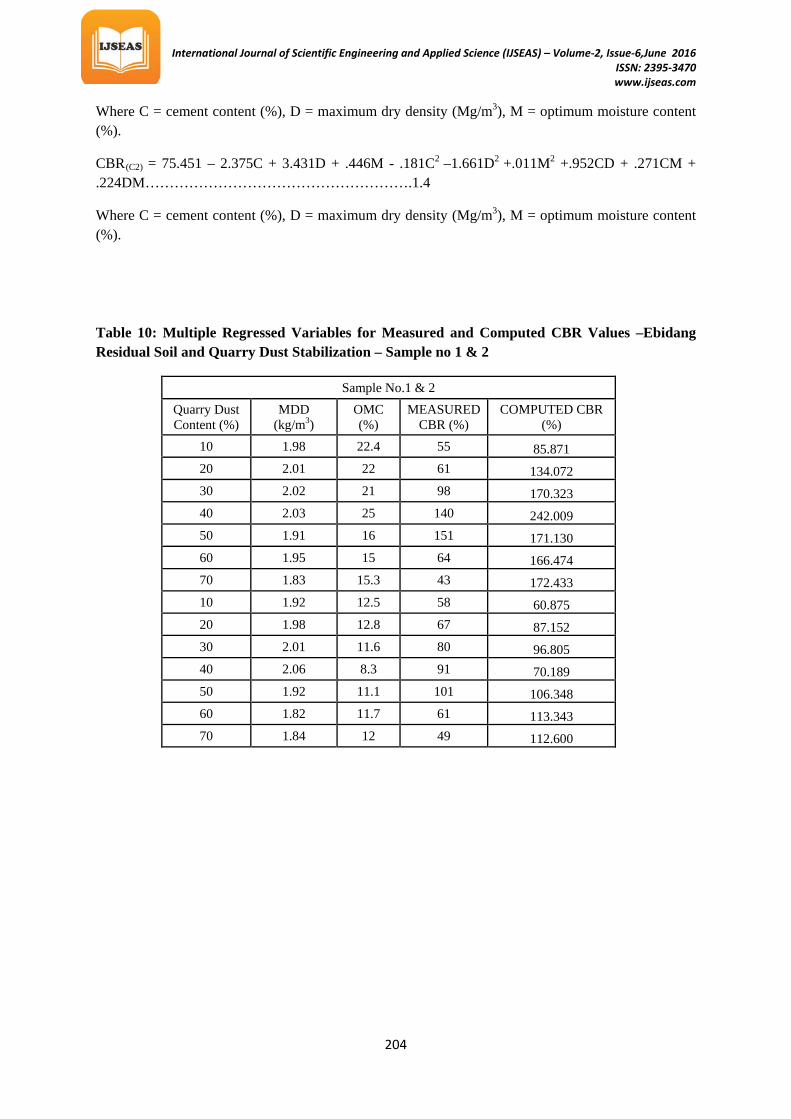
Table 10: Multiple Regressed Variables for Measured and Computed CBR Values –Ebidang Residual Soil and Quarry Dust Stabilization – Sample no 1 & 2
Sample No.1 & 2 Quarry Dust Content (%)
MDD (kg/mP
3P)
OMC (%)
MEASURED CBR (%)
COMPUTED CBR (%)
10 1.98 22.4 55 85.871 20 2.01 22 61 134.072 30 2.02 21 98 170.323 40 2.03 25 140 242.009 50 1.91 16 151 171.130 60 1.95 15 64 166.474 70 1.83 15.3 43 172.433 10 1.92 12.5 58 60.875 20 1.98 12.8 67 87.152 30 2.01 11.6 80 96.805 40 2.06 8.3 91 70.189 50 1.92 11.1 101 106.348 60 1.82 11.7 61 113.343 70 1.84 12 49 112.600
International Journal of Scientific Engineering and Applied Science (IJSEAS) – Volume-2, Issue-6,June 2016 ISSN: 2395-3470
www.ijseas.com
205
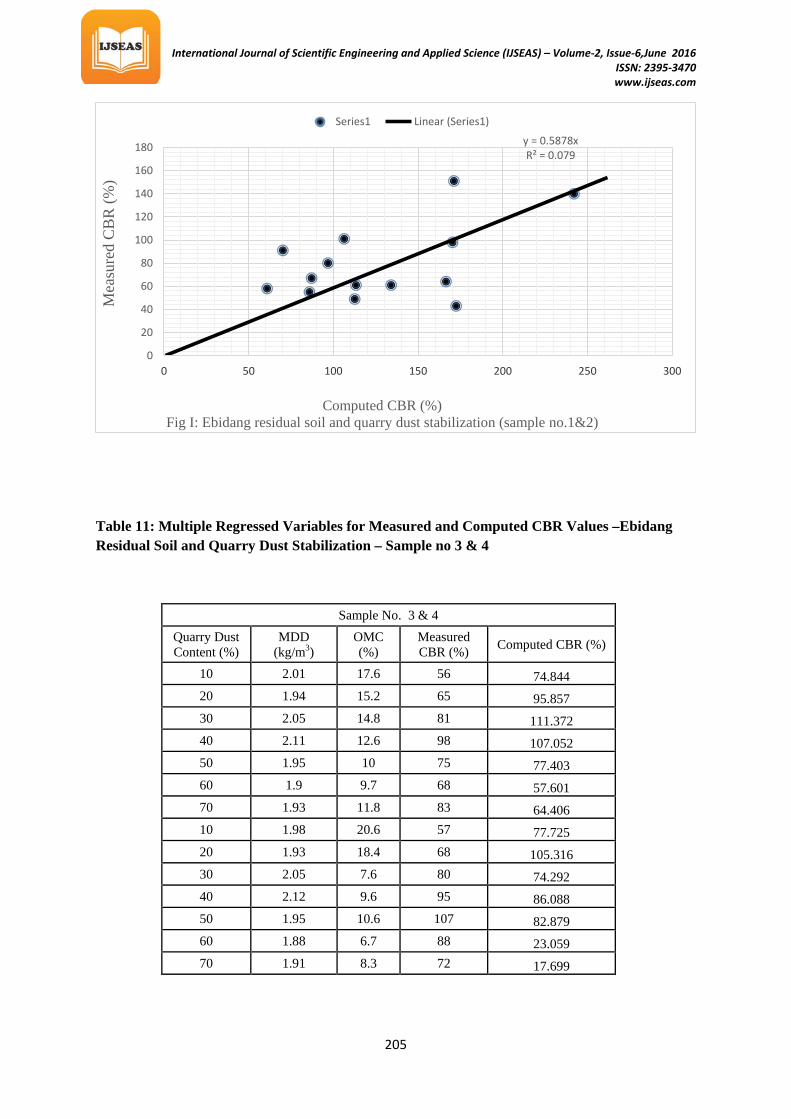
Table 11: Multiple Regressed Variables for Measured and Computed CBR Values –Ebidang Residual Soil and Quarry Dust Stabilization – Sample no 3 & 4
Sample No. 3 & 4 Quarry Dust Content (%)
MDD (kg/mP
3P)
OMC (%)
Measured CBR (%) Computed CBR (%)
10 2.01 17.6 56 74.844 20 1.94 15.2 65 95.857 30 2.05 14.8 81 111.372 40 2.11 12.6 98 107.052 50 1.95 10 75 77.403 60 1.9 9.7 68 57.601 70 1.93 11.8 83 64.406 10 1.98 20.6 57 77.725 20 1.93 18.4 68 105.316 30 2.05 7.6 80 74.292 40 2.12 9.6 95 86.088 50 1.95 10.6 107 82.879 60 1.88 6.7 88 23.059 70 1.91 8.3 72 17.699
y = 0.5878x R² = 0.079
0
20
40
60
80
100
120
140
160
180
0 50 100 150 200 250 300
Mea
sure
d C
BR
(%)
Computed CBR (%) Fig I: Ebidang residual soil and quarry dust stabilization (sample no.1&2)
Series1 Linear (Series1)

International Journal of Scientific Engineering and Applied Science (IJSEAS) – Volume-2, Issue-6,June 2016 ISSN: 2395-3470
www.ijseas.com
206
Table 12: Multiple Regressed Variables for Measured and Computed CBR Values –Ebidang Residual Soil and cement Stabilization – Sample no 1 & 2
Sample No.1 & 2 Cement
Content (%) MDD
(kg/mP
3P)
OMC (%)
Measured CBR (%) Computed CBR (%)
2 1.98 10.2 56 90.974 4 1.99 12.2 69 100.211 6 2.03 12.8 81 92.395 8 2.04 13.1 90 74.824
10 2.05 14.1 111 59.725 2 2.03 13.4 61 118.802 4 2.12 13.1 80 110.346 6 2.03 12.8 83 92.395 8 2.06 11.2 91 53.392
10 2.06 11.4 101 26.044
y = 0.5888x + 20 R² = 0.4315
0
20
40
60
80
100
120
0 20 40 60 80 100 120 140 160
Mea
sure
d C
BR
(%)
Computed CBR (%) Fig.II: Ebidang residual soil and quarry dust stabilization (sample no.3&4)
Series1 Linear (Series1)

International Journal of Scientific Engineering and Applied Science (IJSEAS) – Volume-2, Issue-6,June 2016 ISSN: 2395-3470
www.ijseas.com
207
Table 13: Multiple Regressed Variables for Measured and Computed CBR Values –Ebidang Residual Soil and Cement Stabilization – Sample no 3 & 4
Sample No.3 & 4 Cement
Content (%) MDD
(kg/mP
3P)
OMC (%)
Measured CBR (%) Computed CBR (%)
2 2.11 12.2 76 93.296 4 2.05 14.8 78 102.764 6 2.04 11.3 83 96.406 8 2.05 15.7 95 111.494
10 2.05 15.2 113 110.663 2 2.13 14.2 76 96.828 4 2.05 13.9 86 100.690 6 2.06 12.5 116 99.858
8 2.06 14.8 127 108.501 10 2.34 13.2 124 105.306
y = -0.2342x + 120 R² = 0.4002
0
20
40
60
80
100
120
140
0 20 40 60 80 100 120 140 160
Mea
sure
d C
BR
(%)
Computed CBR (%) Fig.III: Ebidang residual soil and cement stabilization
(sample no.1&2)
Series1 Linear (Series1)

International Journal of Scientific Engineering and Applied Science (IJSEAS) – Volume-2, Issue-6,June 2016 ISSN: 2395-3470
www.ijseas.com
208
VII Conclusions
Data derived from the multiple non-linear regressed models are presented on Tables 10 to 13 showing the input variables and the resulting measured and computed CBR values. Specifically Tables 10 and 11 present the measured and computed CBR values resulting from residual soil and quarry dust stabilization. Tables 12 and 13 present the measured and computed CBR values resulting from residual soil and cement stabilization. The measured and computed values varied from 55% to 151% and 85% to 171% respectively for sample from location 1. Sample from location 2 varied from 56% to 107% and 74% to 82% respectively. Sample from locations 3 revealed measured and computed CBR values ranging from 56% to 91% and 90% to 118% and sample from location 4 revealed measured and computed CBR values as 76% to 127% and 93% to 108% respectively.
Generally it is observed that when quarry dust content exceeds 50% the CBR value decreases. Similarly when cement content exceeds 8% the sample is devoid of plasticity hence less useful in engineering applications..
The model 1.1 revealed that a quarry dust content of 30% and 70% residual soil stabilization will generate measured and computed CBR values of 98% and 170% respectively. These values are above the recommended minimum of 80% specified by the code P
4P[FMW&H 1997] for both sub base and
base course applications. Model 1.2 with similar quarry dust and residual soil contents generates measured and computed CBR values of 81% and 111% a bit lower values compared to model 1.1. Model 1.3 values though acceptable could further be optimized by subjecting the input variables to
y = -0.2342x + 120 R² = 0.4002
0
20
40
60
80
100
120
140
0 20 40 60 80 100 120 140 160
Mea
sure
d C
BR
(%)
Computed CBR (%) Fig.IV: Ebidang residual soil and cement stabilization
(sample no.3&4)
Series1 Linear (Series1)

International Journal of Scientific Engineering and Applied Science (IJSEAS) – Volume-2, Issue-6,June 2016 ISSN: 2395-3470
www.ijseas.com
209
some basic iteration. Model 1.4 generates measured and computed CBR values of 83% and 96% respectively. The models 1.1, 1.2, 1.3 and 1.4 are considered satisfactory for this research.
The accuracy and reliability of the models 1.1 to 1.4 were checked by comparing the measured and computed CBR values and computing the correlation coefficients. Figures I to IV present cross plots of these measured and computed values. The correlation coefficients at 95% confidence interval are .079, .4315, .4002 and .4002. These values are statistically significant and suggest compatibility of both measured and computed values.
Acknowledgement
The author would like to acknowledge the contribution of Esudo Engineering Ventures for the support rendered in the course of this research.
References
[1] Thurairajah, A., Silver, S. and Loganathan, N. [1992] “Strength Correlation Factor for Residual Soil. J. Geotechnique Engrg., Vol.118, issue 4, pp 593-610
[2] Stavridakis, E. I. [2006] “Effect of Curing Time and Bentonite Content on the Quantitative Evaluation of Engineering Behaviour Of Cement Treated Clayey Mixtures Under Soaked Conditions.
[3] Bergado, [1996] Soil Compaction and Soil Stabilization by Admixtures. Proc. of Seminar on Ground Improvement Application to Indonesian Soft Soil, Indonesia, Jakarta 23-26.
[4] Federal Ministry of Works & Housing, General Specifications (Roads and Bridges), vol. 11, 1997.


![Prediction of CBR Value from Index Properties of different ...web.uettaxila.edu.pk/techJournal/2017/No2/3-Prediction of CBR Value... · CBR value with Index properties of soils [v].](https://static.fdocuments.in/doc/165x107/5a710abb7f8b9a9d538c8b0f/prediction-of-cbr-value-from-index-properties-of-different-webuettaxilaedupktechjournal2017no23-prediction.jpg)