CHARACTERIZATION AND EVALUATION OF COCOA (Theobroma cacao … · CHARACTERIZATION AND EVALUATION OF...
17
329 CHARACTERIZATION AND EVALUATION OF COCOA (eobroma cacao L.) POD HUSK AS A RENEWABLE ENERGY SOURCE CARACTERIZACIÓN Y EVALUACIÓN DE LA CÁSCARA DE MAZORCA DE CACAO (eobroma cacao L.) COMO FUENTE DE ENERGÍA RENOVABLE J. Daniel Martínez-Ángel 1 , R. AmandaVillamizar-Gallardo 2 , O. Orlando Ortíz-Rodríguez 3* 1 Universidad Pontificia Bolivariana, Grupo de Investigaciones Ambientales, Instituto de Energía, Materiales y Medio Ambiente. Circular 1 N°70-01, Bloque 11, piso 2. Medellín, Colombia. ([email protected]). 2 Universidad de Pamplona, Departamento de Microbiología. Km 1 Bucaramanga, Campus universitario. Pamplona, Norte de Santander. Colombia. ([email protected]). 3 Universidad de Pamplona, Departamento de Ingeniería Industrial, Km 1 Bucaramanga, Campus universitario, Pamplona, Norte de Santander. Colombia. ([email protected]). ABSTRACT In Colombia, the cocoa pod husk (CPH) is expected to reach 2 100 000 t year -1 in 2021 which is usually burned or left over for decomposing outdoors at the plantations without any environmental control. erefore, this study evaluated the energetic potential of CPH obtained after the initial processing of this fruit (eobroma cacao L.). ree biological materials were analyzed: clone CCN-51 (CPH 1 ), clone ICS- 39 (CPH 2 ) and a hybrid (CPH 3 ), which present high yield and number of fruits per tree. e samples were examined by using different characterization techniques for raw biomass and ashes; in addition to the ultimate, proximate and heating value analyses, different fouling indexes were determined in order to estimate the phenomena of solids formation inside the reactor when combustion or gasification is used as a thermochemical valorization process. e Colombian CPHs contain relatively homogeneous levels of C, H and O, but very heterogeneous ash contents (1.4 to 12.9 wt %). e three studied samples showed high content of K 2 O in ashes (67 to 74 wt %). e higher heating value (HHV) ranged from 15 395 to 16 670 kJ kg -1 . Furthermore, the fouling index and the fusibility analysis suggest the appearance of agglomeration and sintering phenomena when CPH is used as a fuel. e gasification is proposed as the process with major possibilities for the energetic use of CPH. CPH 1 sample seems to allow a more stable and flexible operation, as compared to CPH 2 and CPH 3 . Keywords: Biomass, cocoa pod husk, gasification, crop residues, renewable energy systems, eobroma cacao L. * Author for correspondence v Autor responsable. Received: September, 2014. Approved: February, 2015. Published as ARTICLE in Agrociencia 49: 329-345. 2015. RESUMEN En Colombia, se espera que la cantidad de cáscara de mazorca de cacao (CMC), que usualmente se quema o se deja para descomponer al aire libre en las plantaciones sin ningún con- trol ambiental, llegue a 2 100 000 t año –1 en 2021. Por ende, este estudio evaluó el potencial energético de la CMC que se obtiene después del procesamiento inicial de este fruto (e- obroma cacao L.). Tres materiales biológicos se analizaron: el clon CCN-51 (CMC 1 ), el clon ICS-39 (CMC 2 ) y un híbri- do (CMC 3 ), que presentan altos rendimientos y número de frutos por árbol. Las muestras se examinaron con diferentes técnicas de caracterización para biomasa cruda y cenizas; ade- más de los análisis definitivo, aproximado y de valor calórico, se determinaron índices distintos de fouling (densidad de se- dimentos) para estimar los fenómenos de formación de sóli- dos dentro del reactor cuando se usa combustión o gasifica- ción como proceso de valorización termoquímica. Las CMC colombianas contienen niveles relativamente homogéneos de C, H y O, pero contenidos muy heterogéneos de cenizas (de 1.4 a 12.9 wt %). Las tres muestras estudiadas mostraron un contenido alto de K 2 O en las cenizas (67 a 74 wt %). El valor calórico más alto (VCA) osciló de 15 395 a 16 670 kJ kg -1 . Además, el índice de fouling y el análisis de fusibilidad sugie- ren la aparición de fenómenos de aglomeración y sinterizado cuando se usa CMC como combustible. La gasificación se propone como el proceso con mayor posibilidad para el uso energético de CMC. La muestra CMC 1 parece permitir una operación más estable y flexible, en comparación con CMC 2 y CMC 3 . Palabras clave: Biomasa, cáscara de mazorca de cacao, gasifica- ción, residuos de cultivos, sistemas de energía renovable, e- obroma cacao L.
Transcript of CHARACTERIZATION AND EVALUATION OF COCOA (Theobroma cacao … · CHARACTERIZATION AND EVALUATION OF...
329
CHARACTERIZATION AND EVALUATION OF COCOA (Theobroma cacao L.) POD HUSK AS A RENEWABLE ENERGY SOURCE
CARACTERIZACIÓN Y EVALUACIÓN DE LA CÁSCARA DE MAZORCA DE CACAO(Theobroma cacao L.) COMO FUENTE DE ENERGÍA RENOVABLE
J. Daniel Martínez-Ángel1, R. AmandaVillamizar-Gallardo2, O. Orlando Ortíz-Rodríguez3*
1Universidad Pontificia Bolivariana, Grupo de Investigaciones Ambientales, Instituto de Energía, Materiales y Medio Ambiente. Circular 1 N°70-01, Bloque 11, piso 2. Medellín, Colombia. ([email protected]). 2Universidad de Pamplona, Departamento de Microbiología. Km 1 Bucaramanga, Campus universitario. Pamplona, Norte de Santander. Colombia. ([email protected]). 3Universidad de Pamplona, Departamento de Ingeniería Industrial, Km 1 Bucaramanga, Campus universitario, Pamplona, Norte de Santander. Colombia. ([email protected]).
AbstrAct
In Colombia, the cocoa pod husk (CPH) is expected to reach 2 100 000 t year-1 in 2021 which is usually burned or left over for decomposing outdoors at the plantations without any environmental control. Therefore, this study evaluated the energetic potential of CPH obtained after the initial processing of this fruit (Theobroma cacao L.). Three biological materials were analyzed: clone CCN-51 (CPH1), clone ICS-39 (CPH2) and a hybrid (CPH3), which present high yield and number of fruits per tree. The samples were examined by using different characterization techniques for raw biomass and ashes; in addition to the ultimate, proximate and heating value analyses, different fouling indexes were determined in order to estimate the phenomena of solids formation inside the reactor when combustion or gasification is used as a thermochemical valorization process. The Colombian CPHs contain relatively homogeneous levels of C, H and O, but very heterogeneous ash contents (1.4 to 12.9 wt %). The three studied samples showed high content of K2O in ashes (67 to 74 wt %). The higher heating value (HHV) ranged from 15 395 to 16 670 kJ kg-1. Furthermore, the fouling index and the fusibility analysis suggest the appearance of agglomeration and sintering phenomena when CPH is used as a fuel. The gasification is proposed as the process with major possibilities for the energetic use of CPH. CPH1 sample seems to allow a more stable and flexible operation, as compared to CPH2 and CPH3.
Keywords: Biomass, cocoa pod husk, gasification, crop residues, renewable energy systems, Theobroma cacao L. * Author for correspondence v Autor responsable.Received: September, 2014. Approved: February, 2015.Published as ARTICLE in Agrociencia 49: 329-345. 2015.
resumen
En Colombia, se espera que la cantidad de cáscara de mazorca de cacao (CMC), que usualmente se quema o se deja para descomponer al aire libre en las plantaciones sin ningún con-trol ambiental, llegue a 2 100 000 t año–1 en 2021. Por ende, este estudio evaluó el potencial energético de la CMC que se obtiene después del procesamiento inicial de este fruto (The-obroma cacao L.). Tres materiales biológicos se analizaron: el clon CCN-51 (CMC1), el clon ICS-39 (CMC2) y un híbri-do (CMC3), que presentan altos rendimientos y número de frutos por árbol. Las muestras se examinaron con diferentes técnicas de caracterización para biomasa cruda y cenizas; ade-más de los análisis definitivo, aproximado y de valor calórico, se determinaron índices distintos de fouling (densidad de se-dimentos) para estimar los fenómenos de formación de sóli-dos dentro del reactor cuando se usa combustión o gasifica-ción como proceso de valorización termoquímica. Las CMC colombianas contienen niveles relativamente homogéneos de C, H y O, pero contenidos muy heterogéneos de cenizas (de 1.4 a 12.9 wt %). Las tres muestras estudiadas mostraron un contenido alto de K2O en las cenizas (67 a 74 wt %). El valor calórico más alto (VCA) osciló de 15 395 a 16 670 kJ kg-1. Además, el índice de fouling y el análisis de fusibilidad sugie-ren la aparición de fenómenos de aglomeración y sinterizado cuando se usa CMC como combustible. La gasificación se propone como el proceso con mayor posibilidad para el uso energético de CMC. La muestra CMC1 parece permitir una operación más estable y flexible, en comparación con CMC2 y CMC3.
Palabras clave: Biomasa, cáscara de mazorca de cacao, gasifica-ción, residuos de cultivos, sistemas de energía renovable, The-obroma cacao L.
AGROCIENCIA, 1 de abril - 15 de mayo, 2015
VOLUMEN 49, NÚMERO 3330
IntroductIon
Cocoa (Theobroma cacao L.) is a very popular fruit because all kinds of chocolates and confectionaries derived from chocolate
are made from its beans. It is a tropical crop which grows under wet conditions in Central and South America (Efraim et al., 2010). Currently, Colombia is the fifth worldwide producer and the third one in Latin America. According to the Colombian Federation of Cocoa Growers (Fedecacao, 2012), the planted area with this crop was 158 000 ha in 2012, yielding 50 000 t. Colombia has 660 000 ha available for planting grain. As part of The Ten Years Cocoa Growing Development Plan 2012-2021, the government’s goal is to produce 246 000 t in 2021, requiring an investment of US $ 1100 million in the next 10 years.
The cocoa pod husk (CPH) is the residue obtained after extracting the cocoa pulp, represents 52 to 70 % of the fruit’s wet weight, and heating values range between 17 and 22 MJ kg-1 (Syamsiro et al., 2012). On ash free basis, CPH is made up of 35, 30 and 10 wt %, of lignin, cellulose and hemicellulose; the remaining percentage corresponds to extracts. Ash (Si, K, P, Mg, Ca, Al, Mn, Fe, Na) account for 10 to 15 wt %, and it is the inorganic fraction of the biomass (Titiloye et al., 2013).
CPH is used as fertilizer, either composted or directly applied to the soil. However, these practices might have negative impacts due to the likely transfer of pathogens (Hanada et al., 2009; Bailey et al., 2013). Other applications are as animal feed or as precursor in the preparation of potassium salts (Bonvehí and Coll, 1999), as biosorbent in the elimination of zinc (II) (Njoku, 2014), or as adsorbent in the elimination of methylene blue from aqueous solutions (Pua et al., 2013). Besides, it is used for the production of catalyzers (Ofori-Boateng and Lee, 2013) and pectins (Siew-Yin and Wee-Sim, 2013; Vriesmann and Petkowicz, 2013). The energetic applications of CPH are limited to its use as solid fuel instead of fire wood. Pellets obtained from crushed and pressed CPH have heating values and ash content similar to other types of biomass (Syamsiro et al., 2012).
In Colombia, CPH would reach 2 100 000 t year-1 in 2021. CPH is burned or decomposed at the outdoor plantations without any environmental control (Ortiz et al., 2014). Biomasses obtained from
IntroduccIón
El cacao (Theobroma cacao L.) es un fruto muy popular porque todos los tipos de chocolates y dulces derivados del chocolate se elaboran
con sus semillas. Es un cultivo tropical que crece bajo condiciones húmedas en Centroamérica y Sudamé-rica (Efraim et al., 2010). Colombia es el productor número cinco en el mundo y el tercero en Latino-américa. Según la Federación Nacional de Cacaoteros (Fedecacao, 2012), el área plantada fue 158 000 ha en 2012, produciendo 50 000 t. Colombia tiene 660 000 ha disponibles para plantar granos. Como parte del Plan de Desarrollo del Cultivo de Cacao a Diez Años 2012-2021, la meta del gobierno es producir 246 000 t en 2021, y requiere una inversión de US $ 1100 millo-nes en los próximos 10 años.
La cáscara de mazorca de cacao (CMC) es el resi-duo obtenido después de extraer la pulpa del cacao, es 52 a 70 % del peso húmedo del fruto, y su valor ca-lórico va de 17 a 22 MJ kg-1 (Syamsiro et al., 2012). Con base en cenizas libres, las CMC contienen 35, 30 y 10 wt % de lignina, celulosa y hemicelulosa; el porcentaje restante corresponde a extractos. La ceniza (Si, K, P, Mg, Ca, Al, Mn, Fe, Na) representa 10 a 15 wt %, y es la fracción inorgánica de la biomasa (Titiloye et al., 2013).
La CMC se usa como fertilizante, ya sea en com-posta o aplicada directamente al suelo. Pero estas prácticas pueden tener impactos negativos debido a la probable transferencia de patógenos (Hanada et al., 2009; Bailey et al., 2013). Otras aplicaciones son como comida para animales o como precursor para preparar sales de potasio (Bonvehí y Coll, 1999), como biosorbente en la eliminación del zinc (II) (Njoku, 2014), o como un adsorbente en la elimina-ción del azul metileno de soluciones acuosas (Pua et al., 2013). Además se usa para producir catalizadores (Ofori-Boateng y Lee, 2013) y pectinas (Siew-Yin y Wee-Sim, 2013; Vriesmann y Petkowicz, 2013). Las aplicaciones energéticas de la CMC están limitadas a su uso como combustible sólido para reemplazar leña. Pellets obtenidas de CMC molida y presionada tienen valores calóricos y contenido de ceniza simila-res a otros tipos de biomasa (Syamsiro et al., 2012).
En Colombia, la CMC llegaría a 2 100 000 t-1 en 2012. La CMC se quema o se descompone al aire libre en plantaciones, sin ningún control ambiental (Ortiz et al., 2014). Las biomasas obtenidas de desechos
331MARTÍNEZ-ÁNGEL et al.
CHARACTERIZATION AND EVALUATION OF COCOA (Theobroma cacao L.) POD HUSK AS A RENEWABLE ENERGY SOURCE
agricultural wastes do not threaten food supply and, therefore, they do not generate social controversy. Likewise, the CPH use as a fuel may constitute an important contribution to: 1) the conservation of nonrenewable or fossil resources, 2) the climate change neutrality in response to the principle of prevention, 3) the development of independent energy sources, 4) the generation of employment and income in rural areas, 5) the reduction of fire and soil erosion risks, and 6) the increase of biodiversity for abandoned agricultural areas of the country (Koh and Ghazoul, 2008; Escobar et al., 2009; Houghton et al., 2009). Therefore, the objective of, the goal underlying this research was to know the most feasible thermochemical treatment for the energetic valorization of CPH.
mAterIAls And methods
Sampling
Three CPH biomasses were sampled in the Department of Santander (the first cocoa grower region in Colombia): clone CCN-51, clone ICS-39 and a hybrid, labeled as CPH1, CPH2 and CPH3 hereafter. Both clones show yields of cocoa higher than 1500 kg ha-1 year-1, partly due to their resistance to pests and diseases; whereas, the hybrid one yields between 1000 and 1200 kg ha-1 year-1, and stands out because it covers approximately 70 % of the planted area in Santander.
Characterization methods
Biomass residues from agricultural industry contains important amounts of alkali and chlorine (Jenkins et al., 1998), which are considered as precursors of technical problems when this material is used in combustion or gasification processes. For example, fouling, corrosion or particle agglomeration on the inner surfaces of the reactor may constitute significant problems. Although each type of biomass involves particular challenges, the main limitation for the introduction of these agricultural biomasses into energy markets are operational issues resulting from biomass composition.
The CPH samples were smashed and dried in a muffle (Vulcan TS), and then calcined in a crucible at 550 °C for 12 h to obtain a representative ash sample for its characterization. Based on the standard UNE EN 5104, the ultimate analysis was performed by using the Thermo flash 1112 equipment. Moisture, ash and volatile material determination (proximate analysis) were conducted according to standards ISO-589-1981, ISO-
agrícolas no amenazan el suministro de alimentos y, por lo tanto, no generan controversia social. Ade-más, el uso de CMC como combustible puede ser una contribución importante a: 1) la conservación de recursos fósiles no renovables, 2) la neutralidad en el cambio climático en respuesta al principio de pre-vención, 3) el desarrollo de fuentes de energía inde-pendientes, 4) la generación de empleos y ganancias en áreas rurales, 5) la reducción de riesgos de fuego y erosión del suelo, y 6) el aumento de la biodiversidad para áreas agrícolas abandonadas en el país (Koh y Ghazoul, 2008; Escobar et al., 2009; Houghton et al., 2009). Por lo tanto, el objetivo de esta investiga-ción fue conocer el tratamiento termoquímico más viable para la valorización energética de CMC.
mAterIAles y métodos
Muestreo
Muestras de tres biomasas de CMC se tomaron en el Depar-tamento de Santander (la primera región productora de cacao en Colombia): el clon CCN-51, el clon ICS-39 y un híbrido, etiquetadas como CMC1, CMC2 y CMC3 de aquí en adelante. Ambos clones tienen rendimientos de cacao mayores de 1500 kg ha–1 año–1, en parte por su resistencia a plagas y enfermedades; mientras que el híbrido produce 1000 a 1200 kg ha–1 año–1, y destaca por cubrir cerca del 70 % del área plantada en Santander.
Métodos de caracterización
Los residuos de biomasas de la industria agrícola contienen cantidades altas de alcalinos y cloro (Jenkins et al., 1998), consi-derados precursores de problemas técnicos cuando este material se usa en procesos de combustión o gasificación. Por ejemplo, el fouling (densidad de sedimentos), la corrosión o la aglomera-ción de partículas en las superficies internas del reactor pueden ser problemas significativos. Aunque cada tipo de biomasa tiene desafíos particulares, la principal limitación para introducir estas biomasas agrícolas en mercados energéticos son situaciones ope-rativas debido a la composición de la biomasa.
Las muestras de CMC se trituraron, se secaron en un horno (Vulcan TS) y se calcinaron en un crisol a 550 °C por 12 h para obtener una muestra representativa de ceniza para su caracteri-zación. Con base en el estándar UNE EN 5104, el análisis de-finitivo se realizó con el equipo Thermo flash 1112. Además, la humedad, cenizas y material volátil (análisis aproximado) se de-terminaron de acuerdo con los estándares ISO-589-1981, ISO-1171-1976 e ISO-5623-1974. El valor calórico se analizó con
AGROCIENCIA, 1 de abril - 15 de mayo, 2015
VOLUMEN 49, NÚMERO 3332
1171-1976 and ISO-5623-1974. The heating value analysis was carried out with a calorimetric pump (IKA C-200), following the procedure established in standard UNE 164001 EX.
The ionic chromatography analysis was performed by using a Metrohn ionic chromatograph equipped with a Metrosep A supp 5 column. This technique allowed separating, for determination, F, Cl, N and S in the CPH samples, to tackle possible emissions of these compounds and the application of corrective measures during the industrial process. Determination of chemical composition of CPH ashes consisted in fusing them with 6 g of lithium tetraborate (Spectromelt A1000) at 1,200 °C for 11 min in a fusion device (PERL X3-Philipps). This melted material was formed into a glass pearl and then analyzed in an X-ray fluorescence spectrometer (FRX-SRS 3000 Bruker). This procedure allowed measuring the contents of SiO2, Al2O3, Fe2O3, CaO, MgO, Na2O, K2O, BaO, Cl, CuO, MnO, NiO, P2O5, SO3, SrO and ZnO, as well as ignition losses. The analysis of ash fusibility in reducing atmosphere allowed determining the shrinking, the initial deformation, the hemisphere and the fluid temperatures according to standard CEN/TS 15370 (UNE 32109) using a SYLAB AF 2000 equipment. The method consisted in heating the ashes under normalized conditions, inside a graduated cylinder, while recording the temperatures at which important structural changes take place: 1) the shrinking temperature (the one at which the first signals of shrinking can be observed in the ash sample); 2) the deformation temperature (first signals of deformation of the vertex or vertexes of tube); 3) the hemispherical temperature (at which the cone’s profile has fused down to a hemispherical lump such that the height becomes half the width of the base); and 4) the fluid temperature (when the ash mass has melted and taken a flat layer form). Ultimate, proximate and heating value analyses as well as the ionic chromatography and the fusibility analyses were conducted by the analytical service of the Instituto de Carboquimica (Spain) which meet with the analytical standards given in the respective norm.
Based on ash chemical composition, it was determined three fouling indexes (alkalinity, alkali/silica and acid/base ratios), which gave a general idea of the susceptibility of CPH to promote fouling problems during its energetic valorization via combustion or gasification processes. Although different indexes provide qualitative information about the fouling tendencies of a fuel (Salour et al., 1993; Gulyurtlu et al., 2008), it is worth to note that they only give a preliminary idea of what might happen, since actual behavior depends on the specific features of the process. The alkali/silica ratio (RA/Si) compares fouling to erosion. When this ratio is larger than 2, there is considerable fouling and precautions must be taken. If it is smaller than 0.2, erosion (due to silica) might be dominant compared to fouling. The
una bomba calorimétrica (IKA C-200), según el procedimiento del estándar UNE 164001 EX.
El análisis de cromatografía iónica se realizó usando un cro-matógrafo iónico Metrohn con una columna Metrosep A supp. Esta técnica permitió separar F, Cl, N y S, para su determinación, en las muestras de CMC, para abordar las posible emisiones de estos compuestos y la aplicación de medidas correctivas durante el proceso industrial. La composición química de las cenizas de CMC se determinó al fusionarlas con 6 g de tetraborato de litio (Spectromelt A1000) a 1200 °C por 11 min en un aparato de fusión (PERL X3 – Philipps). Este material fundido se formó en una perla de vidrio y se analizó en un espectrómetro fluorescente de rayos X (FRX-SRS 3000 Bruker). Este procedimiento per-mitió medir los contenidos de SiO2, Al2O3, Fe2O3, CaO, MgO, Na2O, K2O, BaO, Cl, CuO, MnO, NiO, P2O5, SO3, SrO y ZnO, así como las pérdidas por ignición. El análisis de la fusibili-dad de las cenizas en una atmósfera de reducción permitió deter-minar la contracción, la deformación inicial, el hemisferio y las temperaturas del fluido con base en el estándar CEN/TS 15370 (UNE 32109), usando un equipo SYLAB AF 2000. El método consistió en calentar las cenizas bajo condiciones normales, den-tro de un cilindro graduado, y se registraron las temperaturas en las que ocurrieron cambios estructurales importantes: 1) la tem-peratura de reducción (a la cual las primeras señales de reducción se pueden observar en la muestra de ceniza); 2) la temperatura de deformación (primeras señales de deformación del (los) vértices del tubo); 3) la temperatura hemisférica (a la cual el perfil del cono se ha fundido hasta un bulto hemisférico tal que la altura se vuelve la mitad de lo ancho de la base); y 4) la temperatura fluida (cuando la masa de la ceniza se ha fundido y ha tomado una forma de capa plana). Los análisis definitivo, aproximado y de valor calórico, así como los análisis de cromatografía iónica y fusibilidad, fueron realizados por el servicio analítico del Insti-tuto de Carboquímica (España) que cumple con los estándares analíticos establecidos en la norma respectiva.
Con base en la composición química de la ceniza, tres índi-ces de fouling se determinaron (alcalinidad, alcalinos/sílice y tasas ácido/base), que dieron una idea general de la susceptibilidad de la CMC de promover problemas de fouling durante su valoriza-ción vía procesos de combustión o gasificación o ambos. Aunque índices distintos dan información cualitativa sobre las tendencias de fouling de un combustible (Salour et al., 1993; Gulyurtlu et al., 2008), se debe notar que sólo dan una idea preliminar de lo que podría ocurrir, ya que el comportamiento real depende de las características específicas del proceso. La tasa de alcalinos/sílice (RA/Si) compara el fouling con la erosión; si esta tasa es mayor de 2, hay fouling considerable y se debe tomar precauciones. Si es menor de 0.2, la erosión (debido a la sílice) puede ser dominante comparada con el fouling. El índice de alcalinidad (IA) revela la
333MARTÍNEZ-ÁNGEL et al.
CHARACTERIZATION AND EVALUATION OF COCOA (Theobroma cacao L.) POD HUSK AS A RENEWABLE ENERGY SOURCE
alkalinity index (IA) reveals the tendency to form agglomerates. Values higher than 0.17 kg GJ-1, lead to probabilities of fouling, whereas values higher than 0.34 kg GJ-1, suggest a certainty of fouling. The acid/base ratio (RB/A) estimates the probability of ash melting. The higher RB/A the greater the probability of molten ashes. However, this index should be cautiously interpreted because, as biomass does not follow the same tendency as coal, this indicator seems not to have the same meaning for biomass (Teixeira et al., 2012). A better estimation of ash fusibility is provided by the ash fusibility test in reducing atmosphere, which is detailed next.
Based on a stoichiometric equilibrium model developed and explained by Martínez et al., (2014), it was studied the syngas composition (CO, CO2, H2, CH4, H2O, N2, COS, H2S and SO2) of each of the CPH samples and hence its lower heating value (LHV), when they are submitted to a gasification process with air. The results must be understood as the highest possible concentrations that syngas could achieve. This information allows defining research and development perspectives in the experimental study of CPH gasification aiming its energy utilization.
results And dIscussIon
Proximate, ultimate and heating value analyses
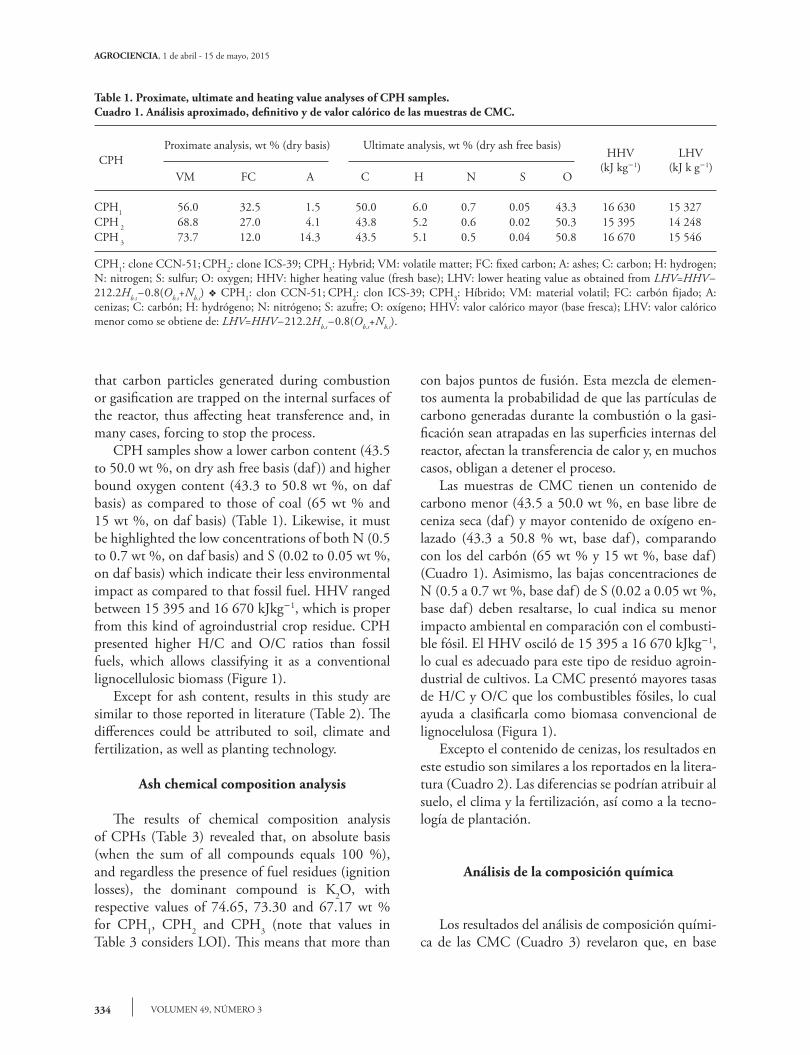
Colombian CPH exhibited a remarkable variety of volatile material (light hydrocarbons and tars in the form of gases), fixed carbon (which burns slowly in the solid state) and ash (inert residue left behind after combustion of the volatile and fixed carbon fractions) contents (Table 1). A first glance, the representative CPH materials showed significant ash content differences: CPH1 contains 1.5 wt % (weight), but CPH2 and CPH3 contain 4.1 and 14.3 wt %(on dry basis).
These values play an important role in the energetic utilization of biomass, since they determine many technical problems in thermochemical conversion processes. For example, from the standpoint of combustion and gasification, minerals found in the ashes are likely to enhance corrosion, slagging and fouling phenomena in the internal walls and edges of the reactor which causes significant losses and reduces the process efficiency (Jenkins et al., 1998). The alkaline compounds in agricultural biomasses, especially Na and K, are likely to combine with Cl forming a series of low melting point compounds. This mixture of elements increases the probability
tendencia de formar aglomerados. Los valores mayores a 0.17 kg GJ-1 llevan a probabilidades de fouling, mientras que los valores mayores a 0.34 kg GJ-1 sugieren la certeza de fouling. La tasa de ácido/base (RB/A) estima la probabilidad de la fusión de la ceni-za. Entre más alta la RB/A, mayor es la probabilidad de cenizas fundidas. Pero este índice debe interpretarse con cautela porque, como la biomasa no sigue la misma tendencia que el carbón, este indicador parece no tener el mismo significado para biomasa (Teixeira et al., 2012). Una mejor estimación de la fusibilidad de la ceniza es dada por la prueba de fusibilidad en atmósfera de reducción, la cual se detalla a continuación.
Con base en un modelo de equilibrio estequiométrico desa-rrollado y explicado por Martínez et al. (2014), se estudió la com-posición de syngas (gas de síntesis) (CO, CO2, H2, CH4, H2O, N2, COS, H2S y SO2) de cada una de las muestras de CMC y así su valor calórico menor (VCM), cuando se someten a un proce-so de gasificación con aire. Los resultados deben comprenderse como las mayores concentraciones posibles que el syngas podría lograr. Esta información permite definir las perspectivas de inves-tigación y desarrollo en el estudio experimental de la gasificación de CMC para dirigir su utilización energética.
resultAdos y dIscusIón
Análisis aproximado, definitivo y de valor calórico
La CMC colombiana exhibió una variedad no-table de material volátil (hidrocarburos ligeros y al-quitranes en forma de gases), carbono fijo (se quema lentamente en estado sólido) y cenizas (residuos iner-tes que permanecen después de la combustión de las fracciones volátil y de carbono fijo) (Cuadro 1). De primera vista, los materiales CMC representativos mostraron diferencias significativas en el contenido de ceniza: CMC1 con 1.5 wt % (peso), pero CMC2 y CMC3 con 4.1 y 14.3 wt % (base seca).
Estos valores tienen una función importante en la utilización energética de la biomasa, ya que deter-minan muchos problemas técnicos en los procesos de conversión termoquímica. Por ejemplo, desde el punto de vista de la combustión y la gasificación, los minerales en las cenizas probablemente aumentan los fenómenos de corrosión, desechos y fouling en las pa-redes internas y bordes del reactor, causando pérdidas significativas y reduciendo la eficiencia del proceso (Jenkins et al., 1998). Los compuestos alcalinos en biomasas agrícolas, especialmente Na y K, se pueden combinar con Cl formando una serie de compuestos
AGROCIENCIA, 1 de abril - 15 de mayo, 2015
VOLUMEN 49, NÚMERO 3334
that carbon particles generated during combustion or gasification are trapped on the internal surfaces of the reactor, thus affecting heat transference and, in many cases, forcing to stop the process.
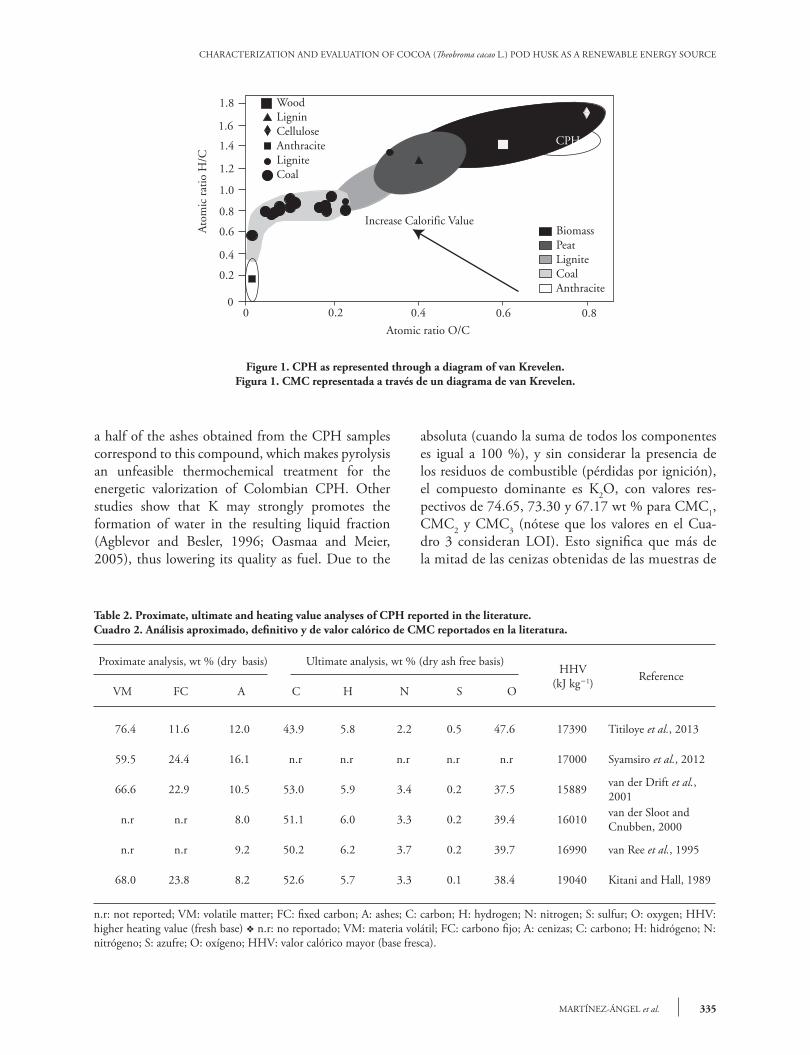
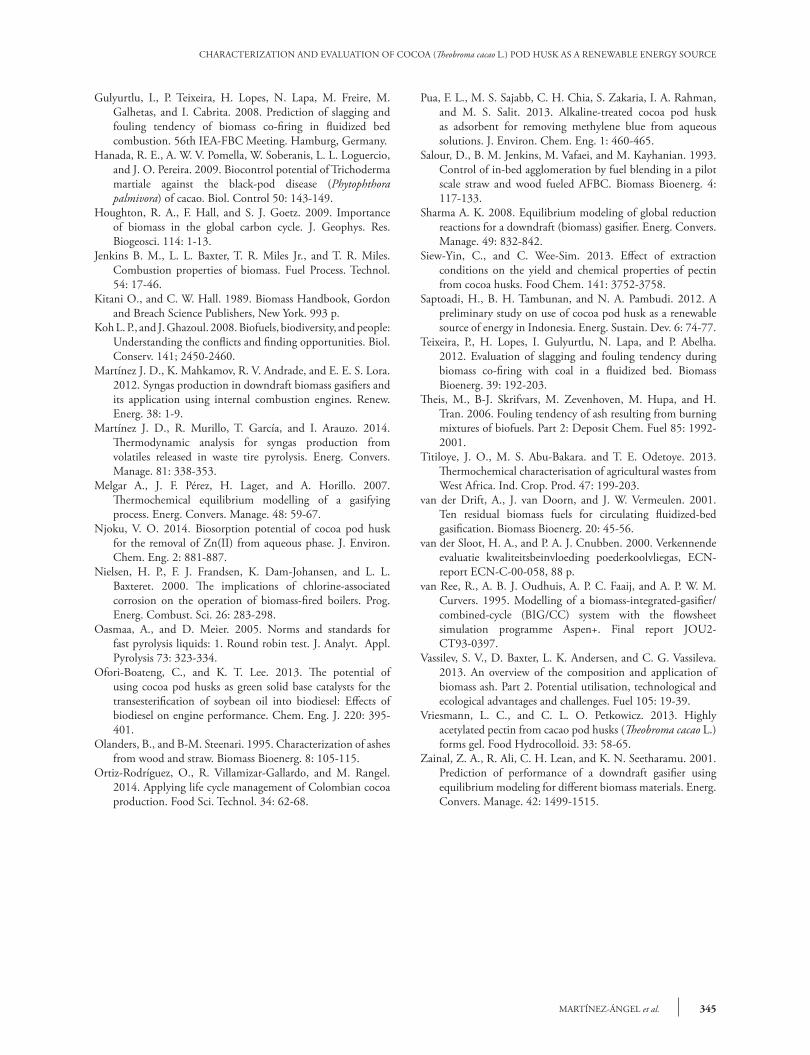
CPH samples show a lower carbon content (43.5 to 50.0 wt %, on dry ash free basis (daf )) and higher bound oxygen content (43.3 to 50.8 wt %, on daf basis) as compared to those of coal (65 wt % and 15 wt %, on daf basis) (Table 1). Likewise, it must be highlighted the low concentrations of both N (0.5 to 0.7 wt %, on daf basis) and S (0.02 to 0.05 wt %, on daf basis) which indicate their less environmental impact as compared to that fossil fuel. HHV ranged between 15 395 and 16 670 kJkg-1, which is proper from this kind of agroindustrial crop residue. CPH presented higher H/C and O/C ratios than fossil fuels, which allows classifying it as a conventional lignocellulosic biomass (Figure 1). Except for ash content, results in this study are similar to those reported in literature (Table 2). The differences could be attributed to soil, climate and fertilization, as well as planting technology.
Ash chemical composition analysis
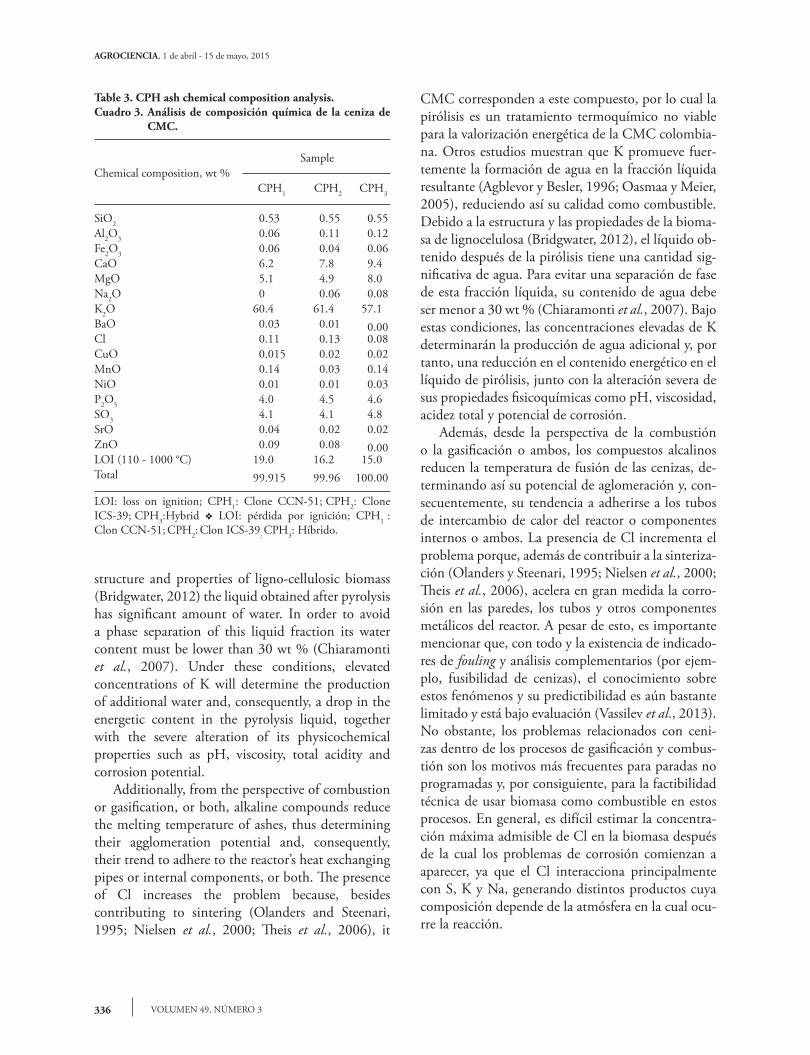
The results of chemical composition analysis of CPHs (Table 3) revealed that, on absolute basis (when the sum of all compounds equals 100 %), and regardless the presence of fuel residues (ignition losses), the dominant compound is K2O, with respective values of 74.65, 73.30 and 67.17 wt % for CPH1, CPH2 and CPH3 (note that values in Table 3 considers LOI). This means that more than
Table 1. Proximate, ultimate and heating value analyses of CPH samples.Cuadro 1. Análisis aproximado, definitivo y de valor calórico de las muestras de CMC.
CPHProximate analysis, wt % (dry basis) Ultimate analysis, wt % (dry ash free basis)
HHV(kJ kg-1)
LHV(kJ k g-1)
VM FC A C H N S O
CPH1 56.0 32.5 1.5 50.0 6.0 0.7 0.05 43.3 16 630 15 327CPH 2 68.8 27.0 4.1 43.8 5.2 0.6 0.02 50.3 15 395 14 248CPH 3 73.7 12.0 14.3 43.5 5.1 0.5 0.04 50.8 16 670 15 546
CPH1: clone CCN-51; CPH2: clone ICS-39; CPH3: Hybrid; VM: volatile matter; FC: fixed carbon; A: ashes; C: carbon; H: hydrogen; N: nitrogen; S: sulfur; O: oxygen; HHV: higher heating value (fresh base); LHV: lower heating value as obtained from LHV=HHV-212.2Hb.s-0.8(Ob.s+Nb.s) v CPH1: clon CCN-51; CPH2: clon ICS-39; CPH3: Híbrido; VM: material volatil; FC: carbón fijado; A: cenizas; C: carbón; H: hydrógeno; N: nitrógeno; S: azufre; O: oxígeno; HHV: valor calórico mayor (base fresca); LHV: valor calórico menor como se obtiene de: LHV=HHV-212.2Hb.s-0.8(Ob.s+Nb.s).
con bajos puntos de fusión. Esta mezcla de elemen-tos aumenta la probabilidad de que las partículas de carbono generadas durante la combustión o la gasi-ficación sean atrapadas en las superficies internas del reactor, afectan la transferencia de calor y, en muchos casos, obligan a detener el proceso.
Las muestras de CMC tienen un contenido de carbono menor (43.5 a 50.0 wt %, en base libre de ceniza seca (daf ) y mayor contenido de oxígeno en-lazado (43.3 a 50.8 % wt, base daf ), comparando con los del carbón (65 wt % y 15 wt %, base daf ) (Cuadro 1). Asimismo, las bajas concentraciones de N (0.5 a 0.7 wt %, base daf ) de S (0.02 a 0.05 wt %, base daf ) deben resaltarse, lo cual indica su menor impacto ambiental en comparación con el combusti-ble fósil. El HHV osciló de 15 395 a 16 670 kJkg-1, lo cual es adecuado para este tipo de residuo agroin-dustrial de cultivos. La CMC presentó mayores tasas de H/C y O/C que los combustibles fósiles, lo cual ayuda a clasificarla como biomasa convencional de lignocelulosa (Figura 1). Excepto el contenido de cenizas, los resultados en este estudio son similares a los reportados en la litera-tura (Cuadro 2). Las diferencias se podrían atribuir al suelo, el clima y la fertilización, así como a la tecno-logía de plantación.
Análisis de la composición química
Los resultados del análisis de composición quími-ca de las CMC (Cuadro 3) revelaron que, en base
335MARTÍNEZ-ÁNGEL et al.
CHARACTERIZATION AND EVALUATION OF COCOA (Theobroma cacao L.) POD HUSK AS A RENEWABLE ENERGY SOURCE
Figure 1. CPH as represented through a diagram of van Krevelen.Figura 1. CMC representada a través de un diagrama de van Krevelen.
Table 2. Proximate, ultimate and heating value analyses of CPH reported in the literature.Cuadro 2. Análisis aproximado, definitivo y de valor calórico de CMC reportados en la literatura.
Proximate analysis, wt % (dry basis) Ultimate analysis, wt % (dry ash free basis)HHV
(kJ kg-1) Reference VM FC A C H N S O
76.4 11.6 12.0 43.9 5.8 2.2 0.5 47.6 17390 Titiloye et al., 2013
59.5 24.4 16.1 n.r n.r n.r n.r n.r 17000 Syamsiro et al., 2012
66.6 22.9 10.5 53.0 5.9 3.4 0.2 37.5 15889 van der Drift et al., 2001
n.r n.r 8.0 51.1 6.0 3.3 0.2 39.4 16010 van der Sloot and Cnubben, 2000
n.r n.r 9.2 50.2 6.2 3.7 0.2 39.7 16990 van Ree et al., 1995
68.0 23.8 8.2 52.6 5.7 3.3 0.1 38.4 19040 Kitani and Hall, 1989
n.r: not reported; VM: volatile matter; FC: fixed carbon; A: ashes; C: carbon; H: hydrogen; N: nitrogen; S: sulfur; O: oxygen; HHV: higher heating value (fresh base) v n.r: no reportado; VM: materia volátil; FC: carbono fijo; A: cenizas; C: carbono; H: hidrógeno; N: nitrógeno; S: azufre; O: oxígeno; HHV: valor calórico mayor (base fresca).
1.4
1.2
1.8
1.6
0
Ato
mic
rat
io H
/C
WoodLigninCelluloseAnthraciteLigniteCoal
BiomassPeatLigniteCoalAnthracite
1.0
0.8
0.6
0.4
0.2
0 0.80.60.40.2
Increase Calorific Value
CPH
Atomic ratio O/C
a half of the ashes obtained from the CPH samples correspond to this compound, which makes pyrolysis an unfeasible thermochemical treatment for the energetic valorization of Colombian CPH. Other studies show that K may strongly promotes the formation of water in the resulting liquid fraction (Agblevor and Besler, 1996; Oasmaa and Meier, 2005), thus lowering its quality as fuel. Due to the
absoluta (cuando la suma de todos los componentes es igual a 100 %), y sin considerar la presencia de los residuos de combustible (pérdidas por ignición), el compuesto dominante es K2O, con valores res-pectivos de 74.65, 73.30 y 67.17 wt % para CMC1, CMC2 y CMC3 (nótese que los valores en el Cua-dro 3 consideran LOI). Esto significa que más de la mitad de las cenizas obtenidas de las muestras de
AGROCIENCIA, 1 de abril - 15 de mayo, 2015
VOLUMEN 49, NÚMERO 3336
structure and properties of ligno-cellulosic biomass (Bridgwater, 2012) the liquid obtained after pyrolysis has significant amount of water. In order to avoid a phase separation of this liquid fraction its water content must be lower than 30 wt % (Chiaramonti et al., 2007). Under these conditions, elevated concentrations of K will determine the production of additional water and, consequently, a drop in the energetic content in the pyrolysis liquid, together with the severe alteration of its physicochemical properties such as pH, viscosity, total acidity and corrosion potential.
Additionally, from the perspective of combustion or gasification, or both, alkaline compounds reduce the melting temperature of ashes, thus determining their agglomeration potential and, consequently, their trend to adhere to the reactor’s heat exchanging pipes or internal components, or both. The presence of Cl increases the problem because, besides contributing to sintering (Olanders and Steenari, 1995; Nielsen et al., 2000; Theis et al., 2006), it
Table 3. CPH ash chemical composition analysis.Cuadro 3. Análisis de composición química de la ceniza de
CMC.
Chemical composition, wt %Sample
CPH1 CPH2 CPH3
SiO2 0.53 0.55 0.55Al2O3 0.06 0.11 0.12Fe2O3 0.06 0.04 0.06CaO 6.2 7.8 9.4MgO 5.1 4.9 8.0Na2O 0 0.06 0.08K2O 60.4 61.4 57.1BaO 0.03 0.01 0.00Cl 0.11 0.13 0.08CuO 0.015 0.02 0.02MnO 0.14 0.03 0.14NiO 0.01 0.01 0.03P2O5 4.0 4.5 4.6SO3 4.1 4.1 4.8SrO 0.04 0.02 0.02ZnO 0.09 0.08 0.00LOI (110 - 1000 °C) 19.0 16.2 15.0Total 99.915 99.96 100.00
LOI: loss on ignition; CPH1: Clone CCN-51; CPH2: Clone ICS-39; CPH3:Hybrid v LOI: pérdida por ignición; CPH1 : Clon CCN-51; CPH2: Clon ICS-39; CPH3: Híbrido.
CMC corresponden a este compuesto, por lo cual la pirólisis es un tratamiento termoquímico no viable para la valorización energética de la CMC colombia-na. Otros estudios muestran que K promueve fuer-temente la formación de agua en la fracción líquida resultante (Agblevor y Besler, 1996; Oasmaa y Meier, 2005), reduciendo así su calidad como combustible. Debido a la estructura y las propiedades de la bioma-sa de lignocelulosa (Bridgwater, 2012), el líquido ob-tenido después de la pirólisis tiene una cantidad sig-nificativa de agua. Para evitar una separación de fase de esta fracción líquida, su contenido de agua debe ser menor a 30 wt % (Chiaramonti et al., 2007). Bajo estas condiciones, las concentraciones elevadas de K determinarán la producción de agua adicional y, por tanto, una reducción en el contenido energético en el líquido de pirólisis, junto con la alteración severa de sus propiedades fisicoquímicas como pH, viscosidad, acidez total y potencial de corrosión.
Además, desde la perspectiva de la combustión o la gasificación o ambos, los compuestos alcalinos reducen la temperatura de fusión de las cenizas, de-terminando así su potencial de aglomeración y, con-secuentemente, su tendencia a adherirse a los tubos de intercambio de calor del reactor o componentes internos o ambos. La presencia de Cl incrementa el problema porque, además de contribuir a la sinteriza-ción (Olanders y Steenari, 1995; Nielsen et al., 2000; Theis et al., 2006), acelera en gran medida la corro-sión en las paredes, los tubos y otros componentes metálicos del reactor. A pesar de esto, es importante mencionar que, con todo y la existencia de indicado-res de fouling y análisis complementarios (por ejem-plo, fusibilidad de cenizas), el conocimiento sobre estos fenómenos y su predictibilidad es aún bastante limitado y está bajo evaluación (Vassilev et al., 2013). No obstante, los problemas relacionados con ceni-zas dentro de los procesos de gasificación y combus-tión son los motivos más frecuentes para paradas no programadas y, por consiguiente, para la factibilidad técnica de usar biomasa como combustible en estos procesos. En general, es difícil estimar la concentra-ción máxima admisible de Cl en la biomasa después de la cual los problemas de corrosión comienzan a aparecer, ya que el Cl interacciona principalmente con S, K y Na, generando distintos productos cuya composición depende de la atmósfera en la cual ocu-rre la reacción.
337MARTÍNEZ-ÁNGEL et al.
CHARACTERIZATION AND EVALUATION OF COCOA (Theobroma cacao L.) POD HUSK AS A RENEWABLE ENERGY SOURCE
greatly accelerates corrosion in the reactor’s metallic walls, pipes and other components. Although, it is important to remark that, despite the existence of fouling indicators and complementary analyses (e.g., ash fusibility), the knowledge about these phenomena and their predictability is still quite limited and is under evaluation (Vassilev et al., 2013). However, problems related to ashes within gasification and combustion processes are the most frequent reasons for non-programmed halts and, consequently, for the technical feasibility of these processes using biomass as fuel. Generally, it is difficult to estimate the maximum admissible concentration of Cl in biomass after which corrosion problems start to appear, since Cl mainly interacts with S, K and Na, generating different products whose composition depend on the atmosphere where the reaction takes place.
Fouling index results
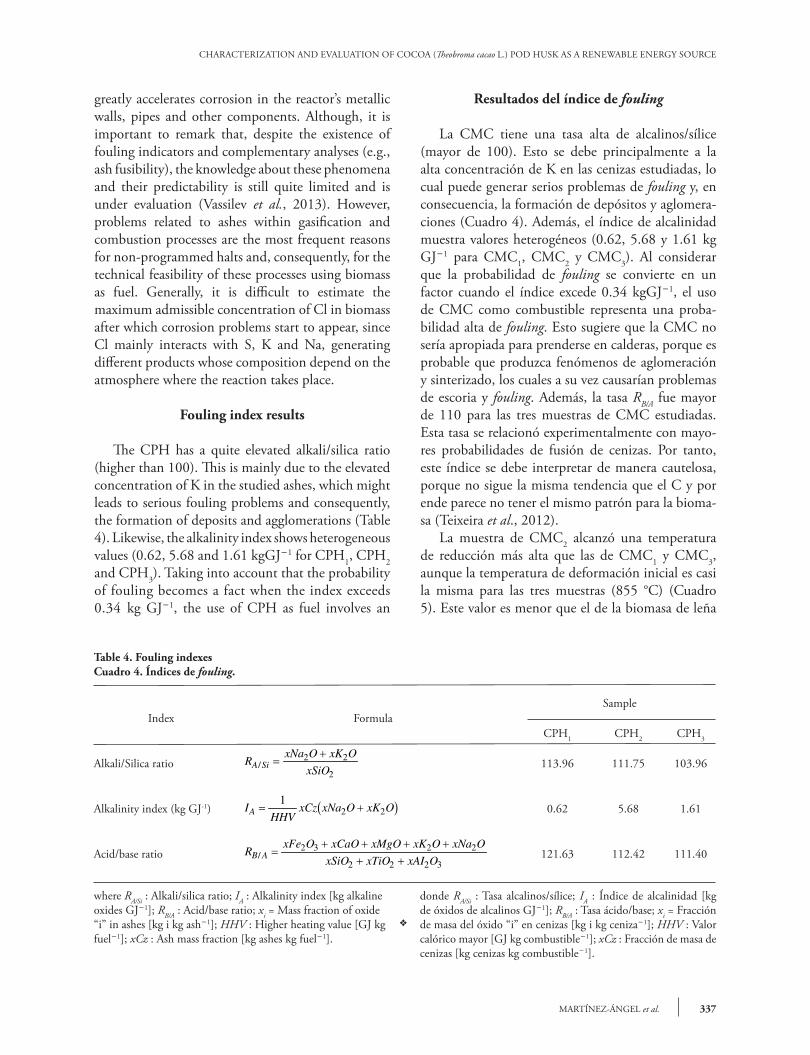
The CPH has a quite elevated alkali/silica ratio (higher than 100). This is mainly due to the elevated concentration of K in the studied ashes, which might leads to serious fouling problems and consequently, the formation of deposits and agglomerations (Table 4). Likewise, the alkalinity index shows heterogeneous values (0.62, 5.68 and 1.61 kgGJ-1 for CPH1, CPH2 and CPH3). Taking into account that the probability of fouling becomes a fact when the index exceeds 0.34 kg GJ-1, the use of CPH as fuel involves an
Resultados del índice de fouling
La CMC tiene una tasa alta de alcalinos/sílice (mayor de 100). Esto se debe principalmente a la alta concentración de K en las cenizas estudiadas, lo cual puede generar serios problemas de fouling y, en consecuencia, la formación de depósitos y aglomera-ciones (Cuadro 4). Además, el índice de alcalinidad muestra valores heterogéneos (0.62, 5.68 y 1.61 kg GJ-1 para CMC1, CMC2 y CMC3). Al considerar que la probabilidad de fouling se convierte en un factor cuando el índice excede 0.34 kgGJ-1, el uso de CMC como combustible representa una proba-bilidad alta de fouling. Esto sugiere que la CMC no sería apropiada para prenderse en calderas, porque es probable que produzca fenómenos de aglomeración y sinterizado, los cuales a su vez causarían problemas de escoria y fouling. Además, la tasa RB/A fue mayor de 110 para las tres muestras de CMC estudiadas. Esta tasa se relacionó experimentalmente con mayo-res probabilidades de fusión de cenizas. Por tanto, este índice se debe interpretar de manera cautelosa, porque no sigue la misma tendencia que el C y por ende parece no tener el mismo patrón para la bioma-sa (Teixeira et al., 2012).
La muestra de CMC2 alcanzó una temperatura de reducción más alta que las de CMC1 y CMC3, aunque la temperatura de deformación inicial es casi la misma para las tres muestras (855 °C) (Cuadro 5). Este valor es menor que el de la biomasa de leña
Table 4. Fouling indexesCuadro 4. Índices de fouling.
Index FormulaSample
CPH1 CPH2 CPH3
Alkali/Silica ratio 113.96 111.75 103.96
Alkalinity index (kg GJ-1) 0.62 5.68 1.61
Acid/base ratio 121.63 112.42 111.40
where RA/Si : Alkali/silica ratio; IA : Alkalinity index [kg alkaline oxides GJ-1]; RB/A : Acid/base ratio; xi = Mass fraction of oxide “i” in ashes [kg i kg ash-1]; HHV : Higher heating value [GJ kg fuel-1]; xCz : Ash mass fraction [kg ashes kg fuel-1].
RxNa O xK O
xSiOA Si/ =+2 2
2
IHHV
xCz xNa O xK OA = +1
2 2b g
RxFe O xCaO xMgO xK O xNa O
xSiO xTiO xAI OB A/ =+ + + +
+ +2 3 2 2
2 2 2 3
donde RA/Si : Tasa alcalinos/sílice; IA : Índice de alcalinidad [kg de óxidos de alcalinos GJ-1]; RB/A : Tasa ácido/base; xi = Fracción de masa del óxido “i” en cenizas [kg i kg ceniza-1]; HHV : Valor calórico mayor [GJ kg combustible-1]; xCz : Fracción de masa de cenizas [kg cenizas kg combustible-1].
v
AGROCIENCIA, 1 de abril - 15 de mayo, 2015
VOLUMEN 49, NÚMERO 3338
elevated probability of fouling. This suggests that CPH would not be appropriate to be fired in boilers, because it is likely to produce agglomeration and sintering phenomena, which in turn, would cause slagging and fouling problems. Besides, the ratio RB/A was higher than 110 for the three studied CPH samples. This ratio was experimentally found associated to higher probabilities of ash melting. Therefore, this index should be cautiously interpreted, since it does not follow the same tendency as C and so, it seems not to have the same pattern for biomass (Teixeira et al., 2012).
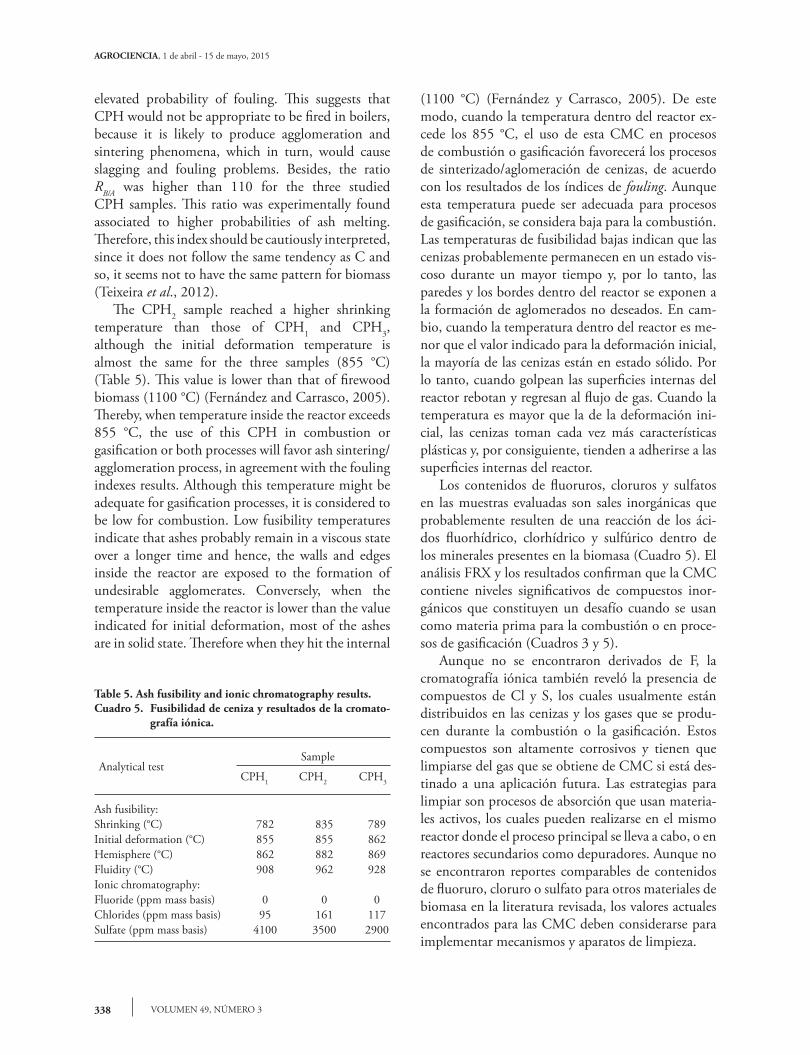
The CPH2 sample reached a higher shrinking temperature than those of CPH1 and CPH3, although the initial deformation temperature is almost the same for the three samples (855 °C) (Table 5). This value is lower than that of firewood biomass (1100 °C) (Fernández and Carrasco, 2005). Thereby, when temperature inside the reactor exceeds 855 °C, the use of this CPH in combustion or gasification or both processes will favor ash sintering/agglomeration process, in agreement with the fouling indexes results. Although this temperature might be adequate for gasification processes, it is considered to be low for combustion. Low fusibility temperatures indicate that ashes probably remain in a viscous state over a longer time and hence, the walls and edges inside the reactor are exposed to the formation of undesirable agglomerates. Conversely, when the temperature inside the reactor is lower than the value indicated for initial deformation, most of the ashes are in solid state. Therefore when they hit the internal
Table 5. Ash fusibility and ionic chromatography results.Cuadro 5. Fusibilidad de ceniza y resultados de la cromato-
grafía iónica.
Analytical testSample
CPH1 CPH2 CPH3
Ash fusibility:Shrinking (°C) 782 835 789Initial deformation (°C) 855 855 862Hemisphere (°C) 862 882 869Fluidity (°C) 908 962 928Ionic chromatography:Fluoride (ppm mass basis) 0 0 0Chlorides (ppm mass basis) 95 161 117Sulfate (ppm mass basis) 4100 3500 2900
(1100 °C) (Fernández y Carrasco, 2005). De este modo, cuando la temperatura dentro del reactor ex-cede los 855 °C, el uso de esta CMC en procesos de combustión o gasificación favorecerá los procesos de sinterizado/aglomeración de cenizas, de acuerdo con los resultados de los índices de fouling. Aunque esta temperatura puede ser adecuada para procesos de gasificación, se considera baja para la combustión. Las temperaturas de fusibilidad bajas indican que las cenizas probablemente permanecen en un estado vis-coso durante un mayor tiempo y, por lo tanto, las paredes y los bordes dentro del reactor se exponen a la formación de aglomerados no deseados. En cam-bio, cuando la temperatura dentro del reactor es me-nor que el valor indicado para la deformación inicial, la mayoría de las cenizas están en estado sólido. Por lo tanto, cuando golpean las superficies internas del reactor rebotan y regresan al flujo de gas. Cuando la temperatura es mayor que la de la deformación ini-cial, las cenizas toman cada vez más características plásticas y, por consiguiente, tienden a adherirse a las superficies internas del reactor.
Los contenidos de fluoruros, cloruros y sulfatos en las muestras evaluadas son sales inorgánicas que probablemente resulten de una reacción de los áci-dos fluorhídrico, clorhídrico y sulfúrico dentro de los minerales presentes en la biomasa (Cuadro 5). El análisis FRX y los resultados confirman que la CMC contiene niveles significativos de compuestos inor-gánicos que constituyen un desafío cuando se usan como materia prima para la combustión o en proce-sos de gasificación (Cuadros 3 y 5).
Aunque no se encontraron derivados de F, la cromatografía iónica también reveló la presencia de compuestos de Cl y S, los cuales usualmente están distribuidos en las cenizas y los gases que se produ-cen durante la combustión o la gasificación. Estos compuestos son altamente corrosivos y tienen que limpiarse del gas que se obtiene de CMC si está des-tinado a una aplicación futura. Las estrategias para limpiar son procesos de absorción que usan materia-les activos, los cuales pueden realizarse en el mismo reactor donde el proceso principal se lleva a cabo, o en reactores secundarios como depuradores. Aunque no se encontraron reportes comparables de contenidos de fluoruro, cloruro o sulfato para otros materiales de biomasa en la literatura revisada, los valores actuales encontrados para las CMC deben considerarse para implementar mecanismos y aparatos de limpieza.
339MARTÍNEZ-ÁNGEL et al.
CHARACTERIZATION AND EVALUATION OF COCOA (Theobroma cacao L.) POD HUSK AS A RENEWABLE ENERGY SOURCE
surfaces of the reactor they bounce and return to the gas flow. When the temperature exceeds that of initial deformation, ashes take increasingly plastic characteristics, and as consequence, they tend to adhere into the internal surfaces of the reactor.
The contents of fluorides, chlorides and sulfates in the evaluated samples are inorganic salts probably resulting from a reaction of fluorhydric, chlorhydric and sulfuric acids within the minerals that are present in the biomass (Table 5). The FRX analysis and the results confirm that CPH contains significant levels of inorganic compounds which constitute a challenge when it is used as feedstock for combustion or in the gasification processes (Table 3 and 5).
Although no F derivatives were found, the ionic chromatography also revealed the presence of Cl and S compounds, which are usually distributed among the ashes and gases produced during combustion or gasification. These compounds are highly corrosive and they have to be cleaned from the gas obtained from CPHs if it is intended for a future application. Typical cleaning strategies are absorption processes making use of active materials, which can be done in the same reactor where the major process is carried out, or in secondary reactors such as scrubbers. Although no comparable fluoride, chloride or sulfate content reports for other biomass materials were found in the literature reviewed, the current values obtained for CPHs should be taken into consideration for the implementation of cleaning mechanisms and devices.
Given that gasification was identified as the most feasible thermochemical treatment for the energetic valorization of CPHs, in the following section the composition of the resulting gas (syngas) is estimated and discussed when these biomasses are gasified with air by using, for example a downdraft gasifier. The main advantage from this type of reactor are the low tar concentrations in syngas and high efficiency, main reasons why it is widely used for small scale distributed generation systems, making use of an alternative internal combustion engine (Martínez et al., 2012).
The syngas composition from the gasification process was estimated through a stoichiometric equilibrium model explained by Martínez et al., (2014). This model assumes that all gases behave like ideal gases and all reactions took place at 1 atm. Similarly, it is worth to point out that possible
Dado que la gasificación está identificada como el tratamiento termoquímico más factible para la va-lorización energética de las CMC, en la sección si-guiente se estima la composición del gas resultante (syngas) y se discute cuando estas biomasas se gasifi-can con aire al usar, por ejemplo, en un gasificador de corriente hacia abajo. La ventaja principal de este tipo de reactor es las concentraciones bajas de alqui-trán en syngas y la alta eficiencia, razones principales por las que se usa ampliamente para sistemas de ge-neración distribuida de pequeña escala, usando un motor de combustión interna alternativo (Martínez et al., 2012).
La composición syngas del proceso de gasificación se estimó a través de un modelo de equilibrio este-quiométrico explicado por Martínez et al. (2014). Este modelo asume que todos los gases se comportan como gases ideales y todas las reacciones ocurren a 1 atm. De manera similar, es importante mencionar que se descuidó la posible formación de alquitrán y carbono sólido. La temperatura de reacción fue el resultado de que el balance energético asumió con-diciones adiabáticas. Entre todos los modelos dispo-nibles para determinar la composición syngas, este es razonablemente preciso en relación con la composi-ción real (Gautam et al., 2010). Este tipo de modelo se considera una herramienta útil de ingeniería para evaluar el efecto de la composición del combustible en la composición del gas de la gasificación (Melgar et al., 2007). De hecho, estos modelos se usan de ma-nera amplia y con éxito para predecir la composición química de syngas obtenido en gasificadores de cama fijos corriente abajo, usando distintas biomasas como combustible (Zainal et al., 2001; Altafini et al., 2003; Sharma, 2008).
La reacción general de los procesos de gasificación considerados por el modelo se muestra en la ecuación (1). La composición de los productos de reacción se calculó a partir del balance de masa de cada elemento y de las reacciones en las ecuaciones (2 a 5). CCvHHvOOvNNvSSv+x1(O2+3.76N2)+x2(H2O)®nCOCO+nCO2
CO2+ nH2H2+nCH4
CH4+nN2N2
+nH2OH2O+ nH2SH2S+ nCOSCOS+ nSO2SO2 (1)
Reacción homogénea de cambio a vapor de agua: CO+H2O®CO2+H2 (2)
AGROCIENCIA, 1 de abril - 15 de mayo, 2015
VOLUMEN 49, NÚMERO 3340
tar and solid carbon formation was neglected. The reaction temperature was the result of the energy balance assuming adiabatic conditions. Among all available models to determine syngas composition this one is reasonably precise with respect to the real composition (Gautam et al., 2010). This type of model is considered to be a useful as engineering tool for evaluating the effect of fuel composition on gasification gas composition (Melgar et al., 2007). In fact, these models have been broadly and satisfactorily used to predict the chemical composition of syngas obtained in downdraft fixed bed gasifiers using different biomasses as fuel (Zainal et al., 2001; Altafini et al., 2003; Sharma, 2008).
The overall reaction of the gasification process considered by the model is shown in equation (1). The composition of the reaction products were calculated from the mass balance of each element and from the reactions in equations (2 to 5).
CCvHHvOOvNNvSSv+x1(O2+3.76N2)+x2(H2O)®nCOCO+nCO2
CO2+ nH2H2+nCH4
CH4+nN2N2
+nH2OH2O+ nH2SH2S+ nCOSCOS+ nSO2SO2 (1)
Homogeneous water gas-shift reaction:
CO+H2O®CO2+H2 (2)
Heterogeneous methane production reaction (methane reaction):
C+2H2®CH4 (3)
Sulfur-related reactions:
CO+H2S«COS+H2 (4)
COS+2CO2«3CO+SO2 (5)
The results obtained through the gasification model for the three studied CPH samples, as a function of the equivalence ratio (ER), is considered to exert the most significant effect on the gasification process (Figure 2). It is calculated as the ratio between the current air/fuel ratio used during the process (fa) and the stoichiometric air/fuel ratio (fs) (equation 6), expressed as a function of the ultimate analysis of the gasified fuel, in Nm3 per kg (equation 7). The ER defines the proportion between burned and gasified fuel. The lower limit of the ER is given
Reacción heterogénea de producción de metano (reacción de metano): C+2H2®CH4 (3)
Reacciones relacionadas con azufre: CO+H2S«COS+H2 (4)
COS+2CO2«3CO+SO2 (5)
Los resultados obtenidos a través del modelo de gasificación para las tres muestras de CMC estudia-das, como función de la tasa de equivalencia (TE), se consideran que ejercen el efecto más significativo sobre el proceso de gasificación (Figura 2). Se calcula como la tasa entre la corriente de aire y el combusti-ble utilizado durante el proceso (fa) y la tasa entre el aire estequiométrico y el combustible (fs) (ecuación 6), expresada como una función del análisis definiti-vo del combustible gasificado, en Nm3 por kg (ecua-ción 7). La TE define la proporción entre el combus-tible quemado y gasificado. El límite menor de la TE está dado por la cantidad mínima de aire requerida para quemar el combustible y producir suficiente calor para mantener las distintas reacciones endotér-micas involucradas en la gasificación (Gómez-Barea y Leckner, 2010). El límite menor de la TE está de-terminado por la cantidad mínima de aire que se re-quiere para quemar una fracción del combustible, y así liberar suficiente calor para suportar las reacciones endotérmicas involucradas en la gasificación. El lí-mite mayor está determinado por la combinación de la temperatura del reactor (para evitar el punto de fusión de la ceniza), el valor calórico del gas y el con-tenido de alquitrán en el gas productor (Behainne y Martínez, 2014). Los procesos de gasificación usual-mente se realizan usando TE entre 0.2 y 0.4 (Martí-nez et al., 2012). Por lo tanto, en un proceso real uti-lizando aire como agente gasificador, el valor calórico menor de syngas se encuentra entre 4 -6 MJNm-3.
fs=0.0889 (C+375S)+0.265H - 0.033O (6) ER d
sf
f (7)
Las concentraciones de syngas (CO, CO2, H2, CH4, H2O, N2, COS, H2S y SO2) dependieron
341MARTÍNEZ-ÁNGEL et al.
CHARACTERIZATION AND EVALUATION OF COCOA (Theobroma cacao L.) POD HUSK AS A RENEWABLE ENERGY SOURCE
36
32
1216202428
48
00.2 0.3 0.70.60.50.4
Equivalence ratio10.90.8
H2,
CO
, CH
4, C
O2,
H2O
, (V
ol. %
) 8070
20
30
4050
60
100
H2
CO2
CO
H2O
CH4
N2
36
32
1216202428
48
00.2 0.3 0.70.60.50.4
Equivalence ratio10.90.8
H2,
CO
, CH
4, C
O2,
H2O
, (V
ol. %
) 8070
20
30
4050
60
100
H2
CO2
CO
H2O
CH4
N2
36
32
1216202428
48
00.2 0.3 0.70.60.50.4
Equivalence ratio10.90.8
H2,
CO
, CH
4, C
O2,
H2O
, (V
ol. %
) 8070
20
30
4050
60
100
H2
CO2
CO
H2O
CH4
N2
109
45678
23
00.2 0.3 0.70.60.50.4
Equivalence ratio10.90.8C
OS,
SO
2 (pp
mv)
2018
810121416
6
2
COSSO
2
H2S
1
420
N2 (
vol %
)N
2 (vo
l %)
N2 (
vol %
)H
2S (
ppm
v)
109
45678
23
00.2 0.3 0.70.60.50.4
Factor de aire10.90.8
CO
S, S
O2 (
ppm
v)
2018
81012
1416
6
COSSO
2
H2S
1420
H2S
(pp
mv)
54
22334
11
00.2 0.3 0.70.60.50.4 10.90.8
CO
S, S
O2 (
ppm
v)
2018
81012
1416
6
COSSO
2
H2S
420
H2S
(pp
mv)
Equivalence ratio
10000
9000
40005000600070008000
20003000
00.2 0.3 0.70.60.50.4
Equivalence ratio0.90.8
22002000
10001200140016001800
800
LHV (kJ/Nm3)T (°C)
1000
600400
0
Tem
pera
ture
(°C
)
LH
V (
kJ/N
m3 )
200
10000
9000
40005000600070008000
20003000
00.2 0.3 0.70.60.50.4
Equivalence ratio0.90.8
22002000
10001200140016001800
800
LHV (kJ/Nm3)T (°C)
1000
600400
0
Tem
pera
ture
(°C
)
LH
V (
kJ/N
m3 )
200
10000
9000
40005000600070008000
20003000
00.2 0.3 0.70.60.50.4
Equivalence ratio0.90.8
22002000
10001200140016001800
800
LHV (kJ/Nm3)T (°C)
1000
600400
0
Tem
pera
ture
(°C
)
LH
V (
kJ/N
m3 )
200
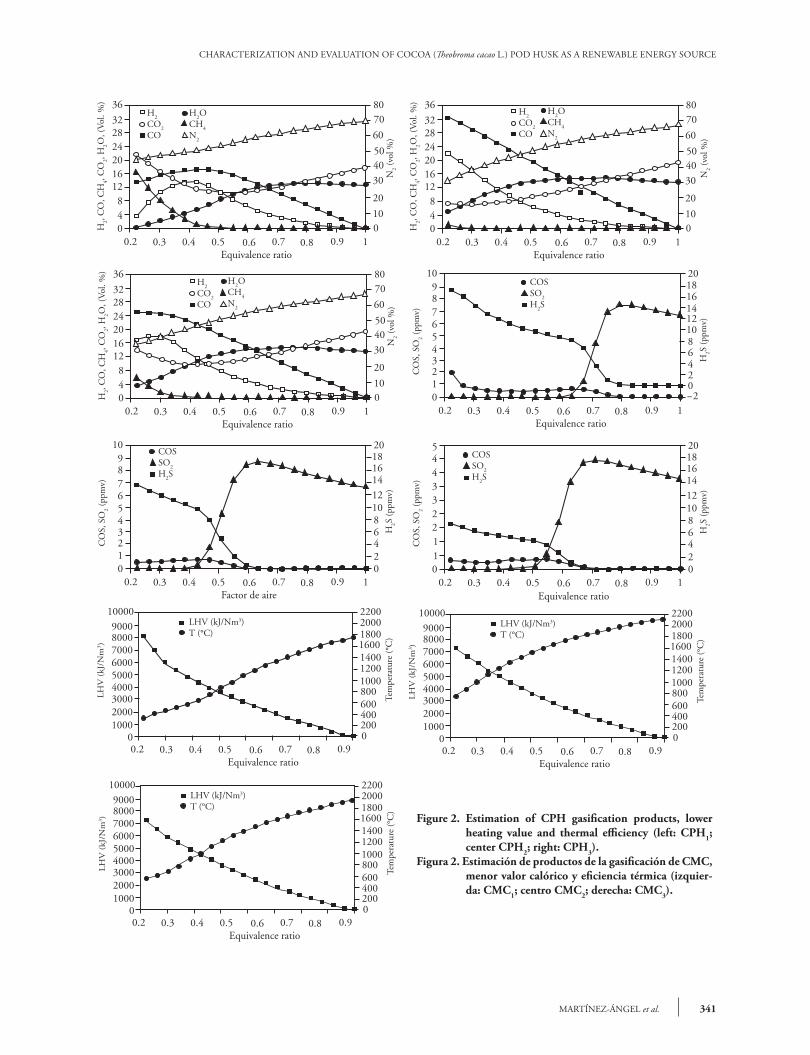
Figure 2. Estimation of CPH gasification products, lower heating value and thermal efficiency (left: CPH1; center CPH2; right: CPH3).
Figura 2. Estimación de productos de la gasificación de CMC, menor valor calórico y eficiencia térmica (izquier-da: CMC1; centro CMC2; derecha: CMC3).
AGROCIENCIA, 1 de abril - 15 de mayo, 2015
VOLUMEN 49, NÚMERO 3342
by the minimum amount of air needed to burn the fuel and to produce enough heat to keep the different endothermic reactions involved in gasification (Gómez-Barea and Leckner, 2010). The lower limit of ER is determined by the minimum quantity of air required to burn a fraction of the fuel, and thus to release enough heat to support the endothermic reactions involved in gasification. The upper limit is determined by combining the reactor temperature (in order to avoid the ash melting point), the gas heating value and the tar content in the producer gas (Behainne and Martínez, 2014). Gasification processes are usually conducted using ER between 0.2 and 0.4 (Martínez et al., 2012). Thus, in a real process using air as gasifying agent, the lower heating value of syngas is between 4-6 MJNm-3.
fs=0.0889 (C+375S)+0.265H - 0.033O (6) ER d
sf
f (7)
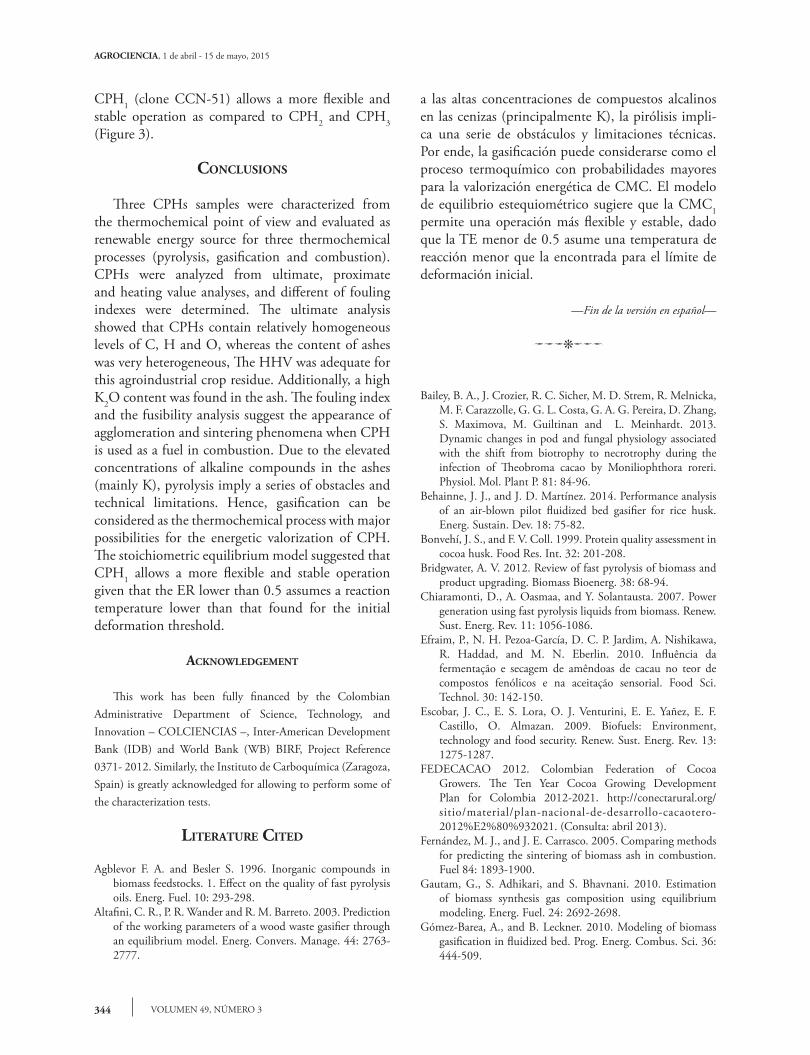
Syngas concentrations (CO, CO2, H2, CH4, H2O, N2, COS, H2S and SO2) strongly depended on the CPH type and the ER, as expected (Figure 2). For instance, the maximum H2 concentration is achieved with CPH2 (22 vol. % at 0.22 of ER), followed by CPH3 (17 vol. % at 0.29 of ER) and CPH1 (13 vol. % at 0.43 of ER). Regarding to CO, the higher concentration follows the same trend found for H2: CPH2 showed the highest concentration (32 vol.% at 0.22 of ER), followed by CPH3 (25 vol.% at 0.22 of ER) and CPH1 (17 vol. % at 0.42 of ER). Conversely to results found to H2 and CO, CPH3 led to higher CH4 concentrations respect to those found for CPH2 and CPH1, in the ER range commonly used in air gasification (between 0.2 and 0.4). This observation is related to the higher reaction temperature achieved (Martínez et al., 2014) for this type of CPH. In spite of these facts, the resulting heating value does not show notable variations (Figure 3). CPH gasification using only air leads to the same heating value (between 4500 and 6000 kJNm-3) at ERs between 0.3 and 0.4.
The only difference is observable for CPH1 which leads to a higher heating value (8000 kJNm-3) when the ER is around 0.2. However, this operation point (0.2 of ER) results to be inappropriate taking into account the lower reaction temperature achieved for
fuertemente del tipo de CMC y la TE, como se espe-raba (Figura 2). Por ejemplo, la máxima concentra-ción de H2 se logra con la CMC2 (22 vol. % a 0.22 de TE), seguida por CMC3 (17 vol. % a 0.29 de TE) y CMC1 (13 vol. % a 0.43 de TE). Respecto a CO, la concentración mayor sigue la misma tendencia encontrada para H2: CMC2 mostró la concentración más alta (32 vol. % a 0.22 de TE), seguida de CMC3 (25 vol. % a 0.22 de TE) y CPH1 (17 vol. % a 0.42 de TE). A diferencia de los resultados encontrados para H2 y CO, CMC3 llevó a concentraciones ma-yores de CH4 respecto a las encontradas para CMC2 y CMC1, en el rango de TE comúnmente utilizado en la gasificación por aire (entre 0.2 y 0.4). Esta ob-servación se relaciona con la mayor temperatura de reacción lograda (Martínez et al., 2014) para este tipo de CMC. A pesar de estos hechos, el valor calórico resultante no muestra variaciones notables (Figura 3). La gasificación de CMC usando sólo aire lleva al mismo valor calórico (entre 4500 y 6000 kJNm-3) a TE entre 0.3 y 0.4.
La única diferencia se observa para CMC1 lo cual lleva a un valor calórico mayor (8000 kjNm-3 cuan-do el TE es cercano a 0.2. Sin embargo, este punto de operación (0.2 de TE) resulta inapropiado al tomar en cuenta la termperatura de reacción menor lograda para este CMC. Esto sugiere que, a pesar del tipo de CMC, la calidad del gas en términos de valor ca-lórico permanecerá sin cambio para ET entre 0.3 y 0.4. Esto tiene un efecto positivo sobre la posibilidad de usar este gas en motores de combustión interna, ya que puede obtenerse de distintos tipos de CMC. No obstante, al examinar las temperaturas durante el proceso, se pueden observar diferencias importantes. En el caso de CMC1, si la TE es mayor de 0.5 la temperatura excede el límite inicial de deformación (855 °C), aumentando así la fusibilidad de la ceniza. Respecto a CMC2 y CMC3, las respectivas tempera-turas límite son 0.26 y 0.34. Estos resultados defi-nen el límite superior de la TE para los materiales de CMC evaluados (Figura 3).
Vale la pena señalar que los resultados de estas simulaciones deben entenderse como las máximas concentraciones posibles en syngas. Además, dado que la temperatura resultante se obtiene del balan-ce energético adiabático, eso sólo proporciona una idea general del proceso. A pesar de estos hechos, la temperatura de deformación de ceniza inicial, que es bastante baja (855 °C), supone algunas limitaciones
343MARTÍNEZ-ÁNGEL et al.
CHARACTERIZATION AND EVALUATION OF COCOA (Theobroma cacao L.) POD HUSK AS A RENEWABLE ENERGY SOURCE
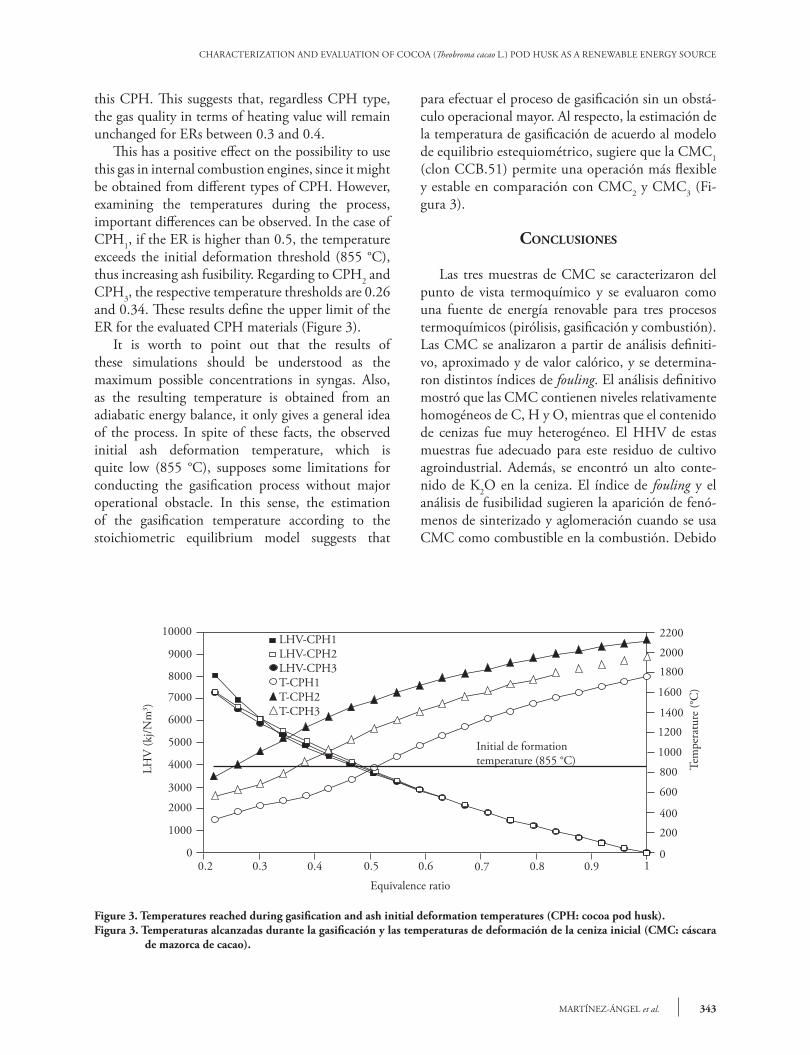
this CPH. This suggests that, regardless CPH type, the gas quality in terms of heating value will remain unchanged for ERs between 0.3 and 0.4.
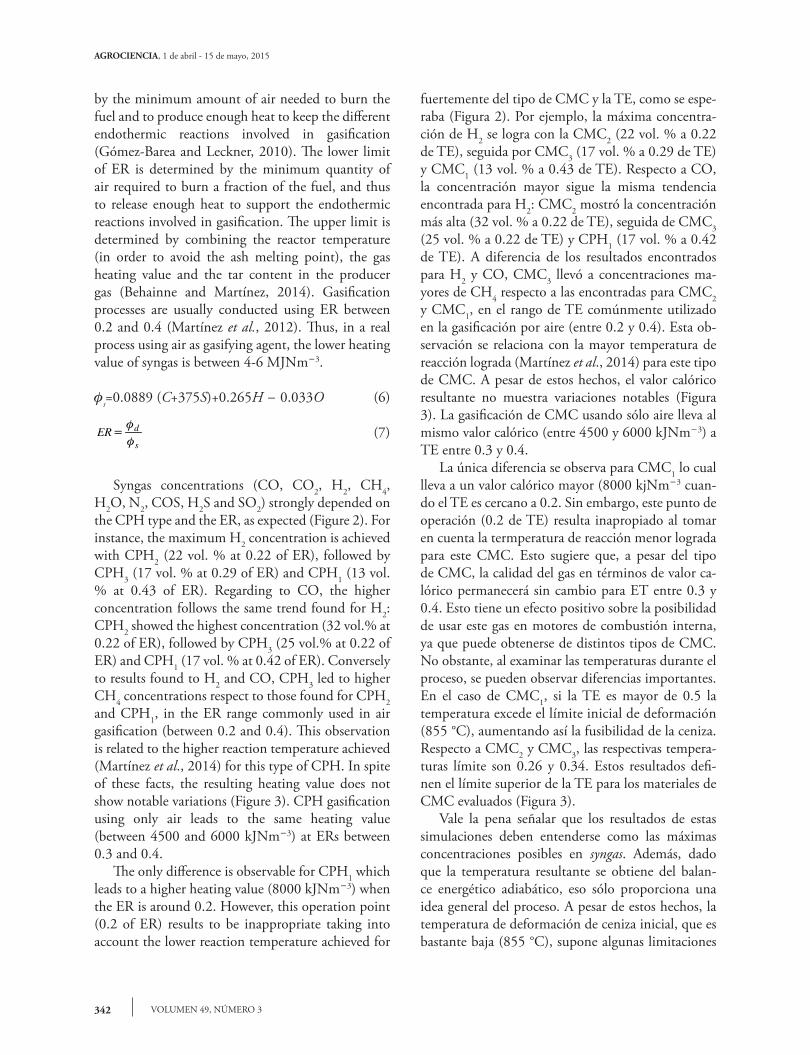
This has a positive effect on the possibility to use this gas in internal combustion engines, since it might be obtained from different types of CPH. However, examining the temperatures during the process, important differences can be observed. In the case of CPH1, if the ER is higher than 0.5, the temperature exceeds the initial deformation threshold (855 °C), thus increasing ash fusibility. Regarding to CPH2 and CPH3, the respective temperature thresholds are 0.26 and 0.34. These results define the upper limit of the ER for the evaluated CPH materials (Figure 3).
It is worth to point out that the results of these simulations should be understood as the maximum possible concentrations in syngas. Also, as the resulting temperature is obtained from an adiabatic energy balance, it only gives a general idea of the process. In spite of these facts, the observed initial ash deformation temperature, which is quite low (855 °C), supposes some limitations for conducting the gasification process without major operational obstacle. In this sense, the estimation of the gasification temperature according to the stoichiometric equilibrium model suggests that
para efectuar el proceso de gasificación sin un obstá-culo operacional mayor. Al respecto, la estimación de la temperatura de gasificación de acuerdo al modelo de equilibrio estequiométrico, sugiere que la CMC1 (clon CCB.51) permite una operación más flexible y estable en comparación con CMC2 y CMC3 (Fi-gura 3).
conclusIones
Las tres muestras de CMC se caracterizaron del punto de vista termoquímico y se evaluaron como una fuente de energía renovable para tres procesos termoquímicos (pirólisis, gasificación y combustión). Las CMC se analizaron a partir de análisis definiti-vo, aproximado y de valor calórico, y se determina-ron distintos índices de fouling. El análisis definitivo mostró que las CMC contienen niveles relativamente homogéneos de C, H y O, mientras que el contenido de cenizas fue muy heterogéneo. El HHV de estas muestras fue adecuado para este residuo de cultivo agroindustrial. Además, se encontró un alto conte-nido de K2O en la ceniza. El índice de fouling y el análisis de fusibilidad sugieren la aparición de fenó-menos de sinterizado y aglomeración cuando se usa CMC como combustible en la combustión. Debido
Figure 3. Temperatures reached during gasification and ash initial deformation temperatures (CPH: cocoa pod husk).Figura 3. Temperaturas alcanzadas durante la gasificación y las temperaturas de deformación de la ceniza inicial (CMC: cáscara
de mazorca de cacao).
LHV (
kJ/Nm
3 )
10000
9000
8000
7000
6000
2000
3000
4000
5000
0
1000
0.2 0.90.80.70.60.50.40.3 1
2200
2000
1800
1600
1400
600
800
1000
1200
0
200
400
LHV-CPH1LHV-CPH2LHV-CPH3T-CPH1T-CPH2T-CPH3
LHV
(kj/N
m3 )
Tem
pera
ture
(°C
)
Equivalence ratio
Initial de formationtemperature (855 °C)
AGROCIENCIA, 1 de abril - 15 de mayo, 2015
VOLUMEN 49, NÚMERO 3344
CPH1 (clone CCN-51) allows a more flexible and stable operation as compared to CPH2 and CPH3 (Figure 3).
conclusIons
Three CPHs samples were characterized from the thermochemical point of view and evaluated as renewable energy source for three thermochemical processes (pyrolysis, gasification and combustion). CPHs were analyzed from ultimate, proximate and heating value analyses, and different of fouling indexes were determined. The ultimate analysis showed that CPHs contain relatively homogeneous levels of C, H and O, whereas the content of ashes was very heterogeneous, The HHV was adequate for this agroindustrial crop residue. Additionally, a high K2O content was found in the ash. The fouling index and the fusibility analysis suggest the appearance of agglomeration and sintering phenomena when CPH is used as a fuel in combustion. Due to the elevated concentrations of alkaline compounds in the ashes (mainly K), pyrolysis imply a series of obstacles and technical limitations. Hence, gasification can be considered as the thermochemical process with major possibilities for the energetic valorization of CPH. The stoichiometric equilibrium model suggested that CPH1 allows a more flexible and stable operation given that the ER lower than 0.5 assumes a reaction temperature lower than that found for the initial deformation threshold.
Acknowledgement
This work has been fully financed by the Colombian Administrative Department of Science, Technology, and Innovation – COLCIENCIAS –, Inter-American Development Bank (IDB) and World Bank (WB) BIRF, Project Reference 0371- 2012. Similarly, the Instituto de Carboquímica (Zaragoza, Spain) is greatly acknowledged for allowing to perform some of the characterization tests.
lIterAture cIted
Agblevor F. A. and Besler S. 1996. Inorganic compounds in biomass feedstocks. 1. Effect on the quality of fast pyrolysis oils. Energ. Fuel. 10: 293-298.
Altafini, C. R., P. R. Wander and R. M. Barreto. 2003. Prediction of the working parameters of a wood waste gasifier through an equilibrium model. Energ. Convers. Manage. 44: 2763-2777.
a las altas concentraciones de compuestos alcalinos en las cenizas (principalmente K), la pirólisis impli-ca una serie de obstáculos y limitaciones técnicas. Por ende, la gasificación puede considerarse como el proceso termoquímico con probabilidades mayores para la valorización energética de CMC. El modelo de equilibrio estequiométrico sugiere que la CMC1 permite una operación más flexible y estable, dado que la TE menor de 0.5 asume una temperatura de reacción menor que la encontrada para el límite de deformación inicial.
—Fin de la versión en español—
pppvPPP
Bailey, B. A., J. Crozier, R. C. Sicher, M. D. Strem, R. Melnicka, M. F. Carazzolle, G. G. L. Costa, G. A. G. Pereira, D. Zhang, S. Maximova, M. Guiltinan and L. Meinhardt. 2013. Dynamic changes in pod and fungal physiology associated with the shift from biotrophy to necrotrophy during the infection of Theobroma cacao by Moniliophthora roreri. Physiol. Mol. Plant P. 81: 84-96.
Behainne, J. J., and J. D. Martínez. 2014. Performance analysis of an air-blown pilot fluidized bed gasifier for rice husk. Energ. Sustain. Dev. 18: 75-82.
Bonvehí, J. S., and F. V. Coll. 1999. Protein quality assessment in cocoa husk. Food Res. Int. 32: 201-208.
Bridgwater, A. V. 2012. Review of fast pyrolysis of biomass and product upgrading. Biomass Bioenerg. 38: 68-94.
Chiaramonti, D., A. Oasmaa, and Y. Solantausta. 2007. Power generation using fast pyrolysis liquids from biomass. Renew. Sust. Energ. Rev. 11: 1056-1086.
Efraim, P., N. H. Pezoa-García, D. C. P. Jardim, A. Nishikawa, R. Haddad, and M. N. Eberlin. 2010. Influência da fermentação e secagem de amêndoas de cacau no teor de compostos fenólicos e na aceitação sensorial. Food Sci. Technol. 30: 142-150.
Escobar, J. C., E. S. Lora, O. J. Venturini, E. E. Yañez, E. F. Castillo, O. Almazan. 2009. Biofuels: Environment, technology and food security. Renew. Sust. Energ. Rev. 13: 1275-1287.
FEDECACAO 2012. Colombian Federation of Cocoa Growers. The Ten Year Cocoa Growing Development Plan for Colombia 2012-2021. http://conectarural.org/sitio/material/plan-nacional-de-desarrollo-cacaotero-2012%E2%80%932021. (Consulta: abril 2013).
Fernández, M. J., and J. E. Carrasco. 2005. Comparing methods for predicting the sintering of biomass ash in combustion. Fuel 84: 1893-1900.
Gautam, G., S. Adhikari, and S. Bhavnani. 2010. Estimation of biomass synthesis gas composition using equilibrium modeling. Energ. Fuel. 24: 2692-2698.
Gómez-Barea, A., and B. Leckner. 2010. Modeling of biomass gasification in fluidized bed. Prog. Energ. Combus. Sci. 36: 444-509.
345MARTÍNEZ-ÁNGEL et al.
CHARACTERIZATION AND EVALUATION OF COCOA (Theobroma cacao L.) POD HUSK AS A RENEWABLE ENERGY SOURCE
Gulyurtlu, I., P. Teixeira, H. Lopes, N. Lapa, M. Freire, M. Galhetas, and I. Cabrita. 2008. Prediction of slagging and fouling tendency of biomass co-firing in fluidized bed combustion. 56th IEA-FBC Meeting. Hamburg, Germany.
Hanada, R. E., A. W. V. Pomella, W. Soberanis, L. L. Loguercio, and J. O. Pereira. 2009. Biocontrol potential of Trichoderma martiale against the black-pod disease (Phytophthora palmivora) of cacao. Biol. Control 50: 143-149.
Houghton, R. A., F. Hall, and S. J. Goetz. 2009. Importance of biomass in the global carbon cycle. J. Geophys. Res. Biogeosci. 114: 1-13.
Jenkins B. M., L. L. Baxter, T. R. Miles Jr., and T. R. Miles. Combustion properties of biomass. Fuel Process. Technol. 54: 17-46.
Kitani O., and C. W. Hall. 1989. Biomass Handbook, Gordon and Breach Science Publishers, New York. 993 p.
Koh L. P., and J. Ghazoul. 2008. Biofuels, biodiversity, and people: Understanding the conflicts and finding opportunities. Biol. Conserv. 141; 2450-2460.
Martínez J. D., K. Mahkamov, R. V. Andrade, and E. E. S. Lora. 2012. Syngas production in downdraft biomass gasifiers and its application using internal combustion engines. Renew. Energ. 38: 1-9.
Martínez J. D., R. Murillo, T. García, and I. Arauzo. 2014. Thermodynamic analysis for syngas production from volatiles released in waste tire pyrolysis. Energ. Convers. Manage. 81: 338-353.
Melgar A., J. F. Pérez, H. Laget, and A. Horillo. 2007. Thermochemical equilibrium modelling of a gasifying process. Energ. Convers. Manage. 48: 59-67.
Njoku, V. O. 2014. Biosorption potential of cocoa pod husk for the removal of Zn(II) from aqueous phase. J. Environ. Chem. Eng. 2: 881-887.
Nielsen, H. P., F. J. Frandsen, K. Dam-Johansen, and L. L. Baxteret. 2000. The implications of chlorine-associated corrosion on the operation of biomass-fired boilers. Prog. Energ. Combust. Sci. 26: 283-298.
Oasmaa, A., and D. Meier. 2005. Norms and standards for fast pyrolysis liquids: 1. Round robin test. J. Analyt. Appl. Pyrolysis 73: 323-334.
Ofori-Boateng, C., and K. T. Lee. 2013. The potential of using cocoa pod husks as green solid base catalysts for the transesterification of soybean oil into biodiesel: Effects of biodiesel on engine performance. Chem. Eng. J. 220: 395-401.
Olanders, B., and B-M. Steenari. 1995. Characterization of ashes from wood and straw. Biomass Bioenerg. 8: 105-115.
Ortiz-Rodríguez, O., R. Villamizar-Gallardo, and M. Rangel. 2014. Applying life cycle management of Colombian cocoa production. Food Sci. Technol. 34: 62-68.
Pua, F. L., M. S. Sajabb, C. H. Chia, S. Zakaria, I. A. Rahman, and M. S. Salit. 2013. Alkaline-treated cocoa pod husk as adsorbent for removing methylene blue from aqueous solutions. J. Environ. Chem. Eng. 1: 460-465.
Salour, D., B. M. Jenkins, M. Vafaei, and M. Kayhanian. 1993. Control of in-bed agglomeration by fuel blending in a pilot scale straw and wood fueled AFBC. Biomass Bioenerg. 4: 117-133.
Sharma A. K. 2008. Equilibrium modeling of global reduction reactions for a downdraft (biomass) gasifier. Energ. Convers. Manage. 49: 832-842.
Siew-Yin, C., and C. Wee-Sim. 2013. Effect of extraction conditions on the yield and chemical properties of pectin from cocoa husks. Food Chem. 141: 3752-3758.
Saptoadi, H., B. H. Tambunan, and N. A. Pambudi. 2012. A preliminary study on use of cocoa pod husk as a renewable source of energy in Indonesia. Energ. Sustain. Dev. 6: 74-77.
Teixeira, P., H. Lopes, I. Gulyurtlu, N. Lapa, and P. Abelha. 2012. Evaluation of slagging and fouling tendency during biomass co-firing with coal in a fluidized bed. Biomass Bioenerg. 39: 192-203.
Theis, M., B-J. Skrifvars, M. Zevenhoven, M. Hupa, and H. Tran. 2006. Fouling tendency of ash resulting from burning mixtures of biofuels. Part 2: Deposit Chem. Fuel 85: 1992-2001.
Titiloye, J. O., M. S. Abu-Bakara. and T. E. Odetoye. 2013. Thermochemical characterisation of agricultural wastes from West Africa. Ind. Crop. Prod. 47: 199-203.
van der Drift, A., J. van Doorn, and J. W. Vermeulen. 2001. Ten residual biomass fuels for circulating fluidized-bed gasification. Biomass Bioenerg. 20: 45-56.
van der Sloot, H. A., and P. A. J. Cnubben. 2000. Verkennende evaluatie kwaliteitsbeinvloeding poederkoolvliegas, ECN-report ECN-C-00-058, 88 p.
van Ree, R., A. B. J. Oudhuis, A. P. C. Faaij, and A. P. W. M. Curvers. 1995. Modelling of a biomass-integrated-gasifier/combined-cycle (BIG/CC) system with the flowsheet simulation programme Aspen+. Final report JOU2-CT93-0397.
Vassilev, S. V., D. Baxter, L. K. Andersen, and C. G. Vassileva. 2013. An overview of the composition and application of biomass ash. Part 2. Potential utilisation, technological and ecological advantages and challenges. Fuel 105: 19-39.
Vriesmann, L. C., and C. L. O. Petkowicz. 2013. Highly acetylated pectin from cacao pod husks (Theobroma cacao L.) forms gel. Food Hydrocolloid. 33: 58-65.
Zainal, Z. A., R. Ali, C. H. Lean, and K. N. Seetharamu. 2001. Prediction of performance of a downdraft gasifier using equilibrium modeling for different biomass materials. Energ. Convers. Manage. 42: 1499-1515.