![LocalandSystemicCardiovascularEffectsfromMonochromatic ...downloads.hindawi.com/journals/ecam/2012/583016.pdf · 3School of Nursing and Management in ... [22]. Phototherapy has been](https://static.fdocuments.in/doc/165x107/5b8180f97f8b9ae47b8c72cd/localandsystemiccardiovasculareffectsfrommonochromatic-3school-of-nursing.jpg)
Characterization and classification of soils of Kabe...
14
International Scholars Journals African Journal of Soil Science ISSN 2375-088X Vol. 3 (7), pp. 134-146, July, 2015. Available online at www.internationalscholarsjournals.org © International Scholars Journals Full Length Research Paper Characterization and classification of soils of Kabe Subwatershed in South Wollo Zone, Northeastern Ethiopia Alem Hagos Hailu 1 , Kibebew Kibret 2 and Heluf Gebrekidan 3 1 Department of Soil and Water Resources Management, Wollo University, Dessie, Ethiopia. 2, 3 School of Natural Resource Management and Environmental Sciences, Haramaya University, Haramaya, Ethiopia. Accepted 20 July, 2015 A study was undertaken in Kabe subwatershed of Amhara region, Ethiopia, to investigate the site, morphological and selected physico-chemical characteristics, and classification of soils. Four soil pedons at representative sites were duly described and soil samples from identifiable horizons were taken for laboratory analysis. The data obtained showed that the soils varied from shallow to very deep, poorly to well drained, very dark gray to yellowish brown in color (dry), weak fine granular to strong coarse angular blocky structure and loose to firm (moist) consistence. The values of the determined soil physical characteristics revealed that sand, silt, clay, bulk density, particle density, total porosity, field capacity, permanent wilting point and available water content ranged from 30 to 68%, 11 to 28%, 16 to 49%, 1.03 to 1.53 g cm -3 , 2.52 to 2.91 g cm -3 , 46.13 to 59.45%, 20.90 to 41.98%, 10.53 to 26.81% and 103.70 to 200.10 mm m -1 . Moreover, the soils were slightly acidic throughout (pH 6.11 to 6.45), very low to low in OM (0.27 to 2.08%) and total N (0.01 to 0.09%), low to very high av. P (2.35 to 42.49%), high in exchangeable Ca (10.54 to 19.77 cmol(+) kg -1 ) and Mg (3.96 to 8.04 cmol(+) kg -1 ), medium in monovalent cations (Na and K), medium to very high CEC (23.40 to 40.80% cmol(+) kg -1 ) and PBS (59.30 to 83.20%). In addition, high status of micronutrients was obtained. Following the survey and soil analytical results, four main reference soil groups were identified in the study area and classified according to FAO/WRB (2006) as Haplic Leptosols (pedon 1), Leptic Cambisols (pedon 2), Vertic Luvisols (pedon 3) and Stagnic Vertisols (pedon 4), respectively. Restoration and increasing of OM and nitrogen content of the soils, implementation and maintenance of soil and water conservation practices, successful introduction and adoption of agricultural technologies on a sustained basis can tackle the investigated problems and thereby increase production and productivity of the soils of the study area. Key words: Soil characteristics, soil classification, reference soil groups, pedon. INTRODUCTION The 1980’s became the ‘decade of awareness’, as the productivity of agricultural soils world-wide was in general on the decline and per capita food grain production decreased significantly. This decline was attributed to periodic droughts, poor management and exploitative __________________________________ Corresponding author. Email: [email protected] agriculture coupled with degradation processes (Pulakeshi, 2010). Nowadays, the population of the planet is growing dramatically (Liu and Chen, 2006). However, the potential of the land for crop production to satisfy the demand of the ever increasing population is declining as a result of severe soil degradation. In Ethiopia, where agriculture is the mainstay of the national economy (Shimeles, 2012), agricultural production has been highly dependent on natural resources for centuries
Transcript of Characterization and classification of soils of Kabe...

In ternationa lScholarsJourna ls
African Journal of Soil Science ISSN 2375-088X Vol. 3 (7), pp. 134-146, July, 2015. Available online at www.internationalscholarsjournals.org © International Scholars Journals
Full Length Research Paper
Characterization and classification of soils of Kabe Subwatershed in South Wollo Zone, Northeastern
Ethiopia
Alem Hagos Hailu1, Kibebew Kibret2 and Heluf Gebrekidan3
1Department of Soil and Water Resources Management, Wollo University, Dessie, Ethiopia.
2, 3School of Natural Resource Management and Environmental Sciences, Haramaya University, Haramaya, Ethiopia.
Accepted 20 July, 2015
A study was undertaken in Kabe subwatershed of Amhara region, Ethiopia, to investigate the site, morphological and selected physico-chemical characteristics, and classification of soils. Four soil pedons at representative sites were duly described and soil samples from identifiable horizons were taken for laboratory analysis. The data obtained showed that the soils varied from shallow to very deep, poorly to well drained, very dark gray to yellowish brown in color (dry), weak fine granular to strong coarse angular blocky structure and loose to firm (moist) consistence. The values of the determined soil physical characteristics revealed that sand, silt, clay, bulk density, particle density, total porosity, field capacity, permanent wilting point and available water content ranged from 30 to 68%, 11 to 28%, 16 to 49%, 1.03 to 1.53 g cm
-3, 2.52 to 2.91 g cm
-3, 46.13 to 59.45%, 20.90 to 41.98%, 10.53 to 26.81% and 103.70 to 200.10 mm
m-1
. Moreover, the soils were slightly acidic throughout (pH 6.11 to 6.45), very low to low in OM (0.27 to 2.08%) and total N (0.01 to 0.09%), low to very high av. P (2.35 to 42.49%), high in exchangeable Ca (10.54 to 19.77 cmol(+) kg
-1) and Mg (3.96 to 8.04 cmol(+) kg
-1), medium in monovalent cations (Na and K), medium to
very high CEC (23.40 to 40.80% cmol(+) kg-1
) and PBS (59.30 to 83.20%). In addition, high status of micronutrients was obtained. Following the survey and soil analytical results, four main reference soil groups were identified in the study area and classified according to FAO/WRB (2006) as Haplic Leptosols (pedon 1), Leptic Cambisols (pedon 2), Vertic Luvisols (pedon 3) and Stagnic Vertisols (pedon 4), respectively. Restoration and increasing of OM and nitrogen content of the soils, implementation and maintenance of soil and water conservation practices, successful introduction and adoption of agricultural technologies on a sustained basis can tackle the investigated problems and thereby increase production and productivity of the soils of the study area. Key words: Soil characteristics, soil classification, reference soil groups, pedon.
INTRODUCTION The 1980’s became the ‘decade of awareness’, as the productivity of agricultural soils world-wide was in general on the decline and per capita food grain production decreased significantly. This decline was attributed to periodic droughts, poor management and exploitative __________________________________ Corresponding author. Email: [email protected]
agriculture coupled with degradation processes (Pulakeshi, 2010). Nowadays, the population of the planet is growing dramatically (Liu and Chen, 2006). However, the potential of the land for crop production to satisfy the demand of the ever increasing population is declining as a result of severe soil degradation. In Ethiopia, where agriculture is the mainstay of the national economy (Shimeles, 2012), agricultural production has been highly dependent on natural resources for centuries

Hailu et al. 134 (Amsalu et al., 2007). However, increasing pressure due to increased human population has degraded vital natural resources in the country and became a serious threat to sustainable agriculture (Gete and Hurni, 2001). Degradation of soil resources as a result of natural and anthropogenic factors is very common and low soil fertility is one of the bottlenecks to sustain agricultural production and productivity in Ethiopia. In order to meet the increasing demand for food, the farming community has to produce more and more. However, under the present situation, where land has become a limiting factor, it is impossible to bring more area under cultivation to satisfy the growing demand (Fischer et al., 2002). Thus, for agriculture to successfully meet the increasing demands for food, fiber and fuel from the decreasing per capita land, requires increasing productivity per unit and the sustainable use of soil because soil is an important non-renewable land resource determining the agricultural potential of a given area. The study and understanding of soil properties and their distribution over an area has proved useful for the development of soil management plan for efficient utilization of limited soil resources and agro-technology transfer (Buol et al., 2003). Ethiopia faces a wide set of issues in soil fertility that require approaches including, but go beyond, the application of chemical fertilizers – the only practice applied at scale, to date and some sources list Ethiopia among the most severely erosion affected countries in the world, along with Lesotho and Haiti (IFPRI, 2010). Wollo, where the study site is located, is one of the most severely degraded and low agricultural productivity parts of the Ethiopian highlands as a result of erosion and soil quality deterioration (Kebrom, 1999). The soil and land resource inventory at regional and larger level (largely out of date) are providing a basis for blanket recommendation of various package of practices including fertilizers and other inputs disregarding the mosaic soil nature of Ethiopia (IFPRI, 2010; Abdenna et al., 2013). The inherent diversity in soils and the adopted practices with intensive application, the soils are evidently expressing numerous complex problems, which are identified at different stages. Further, it is becoming difficult to provide solution at later stages. The multi-pronged problems of intensive cropping are much diversified in nature and manifesting physically, chemically, biologically and ultimately nutritionally and the blanket recommendations are not providing a suite of solutions. In the recent past, concept of watershed based holistic development has emerged as one of the potential approaches in rainfed areas, which can lead to higher productivity and sustainability in agricultural production (Madhan, 2008). The above indicated problem and property of soil call for a need to study soils at local watersheds in order to contribute to an increase agricultural productivity. Lack of detailed and site specific studies on soils hinder technology transfer. Therefore, adequate knowledge on
soil characteristics at large scale and/or local watershed/farm level is essential in tackling specific and local problems of agricultural production. However, the detailed morphological, physical and chemical characteristics of soils of Kabe Subwatershed for sustainable agriculture and maximization of crop production to the potential limits is not available. In addition, soil fertility in the study area is under pressure as an increasing number of farmers attempt to make a living based on what the soil can offer to growing crops as occurring in most highlands of Ethiopia. Therefore, the central objectives of this study were to characterize the morphological, physical and chemical properties, and classify the soils of the Kabe Subwatershed according to the FAO/WRB soil classification legends. MATERIALS AND METHODS Description of the Study Area Geographically, the Kabe Subwatershed is found in Kebele 014, Wereillu District, South Wollo Zone of the Amhara Regional State (Figure 1), in the highlands of Abay Basin. The geographical location of the study area lies between the UTM coordinates of 1197404 to 1200113 m north latitude and 548971 to 550728 m east longitude with an elevation that ranges from 2844 meters above sea level (masl) just near the Selgi River to 3172 masl at the top of the Subwatershed. The topography of the area is not uniform and most part is characterized by hilly and steeply dissected topography with moderately steep to steep slopes. A 30 year climate data (1981-2012) obtained from Ethiopian National Meteorology Authority, Kabe-Wollo Station, indicates that the mean annual rainfall of the area is about 866.5 mm and the maximum amount of rainfall is observed in the month of July followed by August. Based on 21 years climate data (1992-2012), the mean minimum and maximum annual air temperatures of
the area are 8.6 and 19.1 ⁰C, respectively, with mean
annual air temperature of 13.9 ⁰C with the warmer month occurring in June and colder in November. Based on length of growing period, the agro-ecological zone (AEZ) of the area is classified as cool to tepid moist mid highlands (dega) (EIAR, 2011). The major geologic parent materials of the area are Cenozoic volcanic rocks particularly Tarmaber-Megezez formations (transitional and alkaline basalts) (Tefera et al., 1996). Mixed livestock and crop production is the major farming system in the study area. Soil profile description, sampling and analysis Prior to the opening of soil pedons, general field visual observation, survey and auger hole observation was carr-

135 Afr. J. Soil Sci.
Figure 1. Location map of the Kabe Subwatershed.
ied out to selected representative sites for pedon excavation. A free soil survey method (Young, 1976), which follows random sampling technique was employed as a major survey method. A total of four representative pedons (1.5 m width and 2 m length) were excavated on a site which was as much as possible representative to each area category as well as slope position. The pedons for each area category were described and the horizons were designated in situ according to the guidelines of FAO for soil description (FAO, 2006a). Soil profile studies were carried out and a total of 11 disturbed and 11 undisturbed (core) soil samples were collected depth wise from each evident genetic horizon for analysis. The core soil samples were for the determination of bulk density and soil water characteristics. Soil morphological characteristics such as depth of solum and horizon, horizon boundary, color, structure, consistence etc. were described in the field during soil sample collection according to the guidelines of FAO (2006a). Soil color was measured under uniform conditions using the Munsell Soil Color Chart (Munsell Color Company, 2000). Soil structure was described in terms of the sequence: grade, size and type (shape) of aggregates whereas horizon boundaries were described in terms of depth, distinctness and topography. The soil consistence was identified at dry, moist and wet moisture conditions. The disturbed soil samples were air dried at room temperature, ground using mortar and pestle, and made to pass through 2 mm sieve in the laboratory for all the
soil parameters except for soil OM and total N prior to analysis. For the analysis of OM and total N, the soil samples were further passed through 0.5 mm sieve. Determination of particle size distribution was carried out by the Bouyoucos hydrometer method (Bouyoucos, 1962). Bulk density was determined by using core-sampling method as described by Sahlemedhin and Taye (2000). Particle density was determined by the pycnometer method as outlined by Tan (1996). The moisture contents at FC and PWP were measured at the soil water potentials of -1/3 bar (33 kPa) and -15 bars (1500 kPa) using the pressure plate apparatus technique (Richards, 1965). The results were converted into volume percent (Vol %) by multiplying with bulk density. Since, available water content (AWC) is the volume of water retained between FC and PWP, it was obtained by subtracting PWP from FC and finally converted to mm per m. The soil pH was determined in H2O (pH-H2O) and 1M KCl (pH-KCl) using 1:2.5 soil to solution ratio using pH meter as described by Carter and Gregorich (2008). The electrical conductivity was measured by conductivity meter after saturating the samples with distilled water and extracted by vacuum suction and the extracts are filtered (Okalebo et al., 2002). Organic carbon was determined using the Walkley and Black wet oxidation method (Walkley and Black, 1934). Total N of the soil was determined through digestion, distillation and titration procedures of the Micro-Kjeldahl method as described by Jackson (1973). Available soil phosphorus was determined

Hailu et al. 136 ed by the Bray I extraction method and finally determined spectrophotometrically as described by Van Reeuwijk (1992). Exchangeable bases and cation exchange capacity (CEC) of the soils were determined by using the 1M ammonium acetate (pH 7) method according to the percolation tube procedure (Rowell, 1994). Exchangeable Ca and Mg in the extracts were determined by atomic absorption spectrophotometer (AAS), while flame photometer was used to determine the contents of exchangeable K and Na. Extractable micronutrients (Fe, Mn, Zn and Cu) content of the soils was extracted by diethylene triamine pentaacetic acid (DTPA) method (Tan, 1996) and the content in the extract was determined by AAS. The soils were classified into different units (major soils) according to the FAO/WRB (2006) legend. The presence or absence of specific diagnostic horizons, properties and materials were used to distinguish soil units and subunits. Soil mapping was computed electronically with the help of Arc View and Arc GIS 10 software. Statistical Analysis Data obtained were subjected to descriptive statistical analysis in range method. Correlation analysis was also carried out to detect functional relationships among key soil properties. Statistical analysis system (SAS, 2003) software model version 9.1 was employed to carry out the analysis. RESULTS AND DISCUSSION Morphological Characteristics All the pedons described were restricted by the depth to parent materials in relation to soil pedon development and varied from shallow (25 cm) in Pedon 1 to very deep (160 cm) in Pedon 3 (Table 1). The distinctness of horizon boundary between surface and subsurface horizons in Pedons 1 and 2 was abrupt with smooth topography in both. The distinctness of horizon boundary in the surface horizons of Pedons 3 and 4, on the other hand, was found to be clear and gradual with smooth topography in both, whereas in the subsurface horizons was abrupt for both but regarding topography it was irregular in Pedon 3 and wavy in Pedon 4 (Table 1). The variations in nature of the horizon boundaries may indicate the existence of variations in processes that have formed the soils and in some cases they reflect anthropogenic impacts (Cools and De Vos, 2010). Biological activity was relatively higher in the surface horizons and decreased with depth of the pedons which could be related to decreasing root biomass, aeration, nutrients and management effects down the soil pedons. As tallied with Munsell Soil Color Chart, the surface soil color (dry) varied from very dark gray (10YR 3/1) in
Pedon 4 to reddish yellow (7.5YR 6/6) in Pedon 1, while the subsurface color varied from very dark gray (7.5YR 3/1) in Pedon 3 to yellowish brown (10YR 5/4) in Pedon 1. Similarly, the surface color patterns of the soils at moist condition varied from very dark grayish brown (2.5Y 3/2) in Pedon 4 to yellowish brown (10YR 5/6) in Pedon 1, while the subsurface color varied from very dark gray (2.5Y 3/1) in Pedon 3 to brown (7.5YR 4/3) in Pedon 1 (Table 1). The variations in color observed could probably be attributed to differences with depth and topographic position in clay, organic matter content, parent material and drainage conditions that affect the redoximorphic reactions in the soil. In line with the findings of this study, Dengiz et al. (2012) also indicated that soil color could be related to organic matter, waterlogging, carbonate accumulation and redoximorphic features. The soil structure in the surface layers of the pedons varied from strong coarse angular and sub-angular blocky in Pedon 4 to weak fine granular in Pedon 2, whereas in the subsurface horizons it ranged from very strong medium sub-angular blocky to moderate fine granular in Pedon 4 (Table 1). Most of the subsurface horizons of the pedons experienced the effect of inorganic materials for aggregation. With increasing slope and altitude general decrease in grade and size, and change in shape of soil structure characteristic was observed, which might be due to differences in clay content as well as organic matter. The finding is in consent with the statement of Tobiasova et al. (2013) who reported that aggregate dynamics is most intensively influenced by soil organic matter and particle size distribution. Considering soil consistence, characteristic outcomes in the surface layers varied from slightly hard (dry), loose (moist) and, slightly sticky and non-plastic (wet) in Pedon 2 to very hard (dry), firm (moist) and, very sticky and plastic to very plastic (wet) in Pedon 4. On the other hand, in the subsurface horizons it varied from soft (dry), loose (moist), and non-sticky and non-plastic (wet) in Pedon 3 to very hard (dry), firm (moist) and, very sticky and plastic (wet) in Pedon 4 (Table 1). The observed differences in soil consistence could probably be explained by the observed differences in particle size distribution, particularly clay content and also nature of the clay particles. In line with the findings of this study, Moradi (2013) also indicated that soil consistence varied with soil texture. Soil Physical Characteristics The particle size distribution analysis result revealed that, except in the surface layer of Pedon 4 and second layer of Pedon 3, sand is the dominant fraction in the soil pedons. Furthermore, none of the fractions showed a consistent pattern with topographic position albeit sand generally decreased and clay increased with decreasing

137 Afr. J. Soil Sci.
Table 1. Selected morphological characteristics of soil pedons of Kabe Subwatershed.
Horizon Depth (cm)
Horizon boundary Color Structure Consistence
Disti. Topo. Dry Moist Grade Size Shape Dry Moist Wet
Stickiness Plasticity
Pedon 1
Ap 0-15 A S 7.5YR6/6 10YR5/6 WE ME GR SHA VFR ST SPL
B 15-25 --- --- 10YR5/4 7.5YR4/3 MO ME PS HA FR SST SPL
Pedon 2
Ap 0-30 A S 10YR5/3 7.5YR3/2 WE FI GR SHA LO SST NPL
B1 30-64 A S 2.5YR4/1 2.5YR3/1 MO ME SB SHA VFR ST SPL
B2 64-100 --- --- 2.5YR4/3 5YR4/3 MS ME AB SHA VFR SST NPL
Pedon 3
Ap 0-35 C S 10YR4/3 5YR4/3 MS CO GR SHA FR ST SPL
Bti 35-100 A I 7.5YR3/1 2.5Y3/1 ST ME PS HA FI VST PL
C 100-160 --- --- 10YR6/2 7.5YR4/1 MA SO LO NST NPL
Pedon 4
Ap 0-40 G S 10YR3/1 2.5Y3/2 ST CO AS VHA FI VST PVP
Ag 40-75 A W 7.5YR3/2 7.5YR3/1 VST ME SB VHA FI VST PL
C 75-130 --- --- 10YR5/2 5YR3/2 MO FI GR SHA FR NST NPL Notes: Structure: WE = weak, MO = moderate, ST= strong, VST = very strong, MS = moderate to strong, CO = coarse, ME = medium, FI = fine, MA = massive, AS = angular and sub-angular blocky, SB = sub-angular blocky, GR = granular, PS = sub-angular prismatic, AB = angular blocky. Horizon Boundary: Disti = distinctness, Topo. = topography, G = gradual (5-15cm), A = abrupt (0-2cm), C = clear (2-5cm), S = smooth, W = wavy, I = irregular. Consistence: SO = soft, SHA = slightly hard, HA = hard, VHA = very hard, LO = loose, VFR = very friable, FR = friable, FI = firm, NST = non-sticky, SST = slightly sticky, ST = sticky, VST = very sticky, NPL = non-plastic, SPL = slightly plastic, PL = plastic, PVP = plastic to very plastic.
topographic position which may indicate dominance of erosion over soil formation and accumulation in the upper slope, while the reverse holds true in the lower parts of the Subwatershed. This is in agreement with the findings of Ellerbrock and Gerke (2013) who revealed that during erosion, clay sized particles can be transported along hillslopes from hilltop to foot slope areas forming the colluvic soil at topographic depressions. The clay content showed a decreasing pattern in Pedon 4 and an increasing pattern in Pedons 1 and 2 with depth. The increase in clay content with depth might indicate the
presence of eluviation and illuviation processes or simply translocation within the pedons, whereas the decrease could be explained by dominance of clay accumulation on the surface as result of erosion from the upper slopes over that accumulated in the subsurface layers by both translocation and in situ formation. In line with this finding Buol et al. (2003) indicated that the accumulation of clay in the lower horizon could have been contributed by the in situ formation of secondary clays. The textural class also varied from clayey in Pedons 3 and 4 to sandy loam in Pedon 2 (Table 2).

Hailu et al. 138 Table 2. Selected physical characteristics of soils of Kabe Subwatershed.
Horizon Depth (cm)
Particle size (%) Textural class
BD PD TP (%)
FC PWP AWC
Sand Silt Clay (g/cm3) (%v/v) (mm m
-1)
Pedon 1
Ap 0-15 50 24 26 SCL 1.16 2.73 57.51 33.06 16.27 167.90 B 15-25 45 24 31 SCL 1.23 2.57 52.14 31.30 19.04 122.60
Pedon 2
Ap 0-30 60 24 16 SL 1.05 2.57 59.14 20.90 10.53 103.70 B1 30-64 63 19 18 SL 1.03 2.52 59.13 23.79 12.82 109.70 B2 64-100 58 21 21 SCL 1.19 2.62 54.58 25.49 14.22 112.70
Pedon 3
Ap 0-35 48 23 29 SCL 1.18 2.91 59.45 28.32 14.20 141.20 Bti 35-100 35 19 46 C 1.20 2.80 57.14 32.76 22.34 104.20 C 100-160 55 24 21 SCL 1.28 2.67 52.06 39.54 19.53 200.10
Pedon 4
Ap 0-40 30 21 49 C 1.32 2.64 50.01 41.98 25.91 160.70 Ag 40-75 38 28 34 CL 1.38 2.67 48.31 39.21 26.81 124.00 C 75-130 68 11 21 SCL 1.53 2.84 46.13 34.06 19.81 142.50
Note: BD = bulk density, PD = particle density, TP = total porosity, C = clayey, CL = clay loam, SCL = sandy clay loam, SL = sandy loam, FC = field capacity, PWP = permanent wilting point, AWC = available water content.
The dry soil bulk density of soils in the Surface horizon ranged from 1.05 g/cm
3 in Pedon 2 to 1.32 g/cm
3 in Pedon
4, while in the subsurface it ranged from 1.03 g/cm3 in
Pedon 2 to 1.53 g/cm3 in Pedon 4 (Table 2). It did not exhibit
any consistent trend with topographic position. However, it typically showed an increasing trend with soil depth except in Pedon 2. The reason for the increment with depth could be related to reduced organic matter, aggregation and root penetration compared to the surface layers. Subsurface layers are also subject to the compacting weight of the soil above them. In agreement with the findings in this study, Pravin et al. (2013) indicated inverse relationship between soil OM and pore space, and bulk density of soil. The overall particle density values of the investigated horizons of the soils ranged from 2.52 g/cm
3 in Pedon 2 to
2.91 g/cm3
in Pedon 3. It did not exhibit any consistent trend with topographic position. However, it increased consistently with soil depth in Pedon 4, whereas in Pedons 1 and 3 it showed a decreasing trend. More than 50 percent of the obtained particle density values are above 2.65 g/cm
3, which
is assumed to be a standard particle density value of typical mineral soil (Brady and Weil, 2008). This could be due to the presence of high amount of iron (Table 3), which indicates the presence of heavy minerals like iron oxide. This is in agreement with the finding of Achalu et al. (2012) who reported increase in average value of particle density due to the presence of iron oxide and heavy minerals in soil. Total porosity of the soils ranged from 46.13% in Pedon 4 to 59.45% in Pedon 3 (Table 2). Nevertheless, this variation did not exhibit any consistent trend with topographic position. On the other hand, it decreased consistently with soil depth in all the soil pedons which could be due to the effect of management, penetration of crop roots that loosen the soil as well as comparatively higher OM content in the surface horizons. This is in line with the finding of Pravin et al. (2013) who reported decrease in total porosity with soil depth as a
result of increasing compaction, decreasing of rooting effect and organic matter content. Surface soil water retention at field capacity (33 kPa) of the soils of the Subwatershed ranged from 20.90% in Pedon 2 to 41.98% in Pedon 4, while in the subsurface horizons it ranged from 23.79% in Pedon 2 to 39.54% in Pedon 3. On the other hand, the surface soil water retention at permanent wilting point (1500 kPa) ranged from 10.53% in Pedon 2 to 25.91% in Pedon 4, while the subsurface values ranged from 12.82% in Pedon 2 to 26.81% in Pedon 4 (Table 2). The soil pedons opened at the upper slope area and comparatively higher altitude of the Subwatershed showed generally lower moisture content at both FC and PWP, which could be due to the resultant effect of texture. Soil water retention at FC increased consistently with soil depth in Pedons 2 and 3 and, decreased consistently in Pedons 1 and 4. On the other hand, soil water retention at PWP showed an increasing trend with soil depth in Pedons 1 and 2, whereas in Pedons 3 and 4 it did not exhibit any consistent trend. The available water content (AWC) of the soils ranged from 103.64 mm m
-1 in Pedon 2 to 200.10 mm
m-1
in Pedon 3. It showed a decreasing trend with increasing topographic position except Pedon 1. It showed an increasing trend with depth in soil Pedon 2, whereas it showed a decrement in Pedon 1. Pedons 3 and 4 showed irregular trend with depth in their AWC. Soil Chemical Characteristics
The pH-H2O values of the surface horizons of the soils ranged from 6.22 in Pedon 4 to 6.33 in Pedon 3, while in the subsurface it ranged from 6.11 in Pedon 1 to 6.45 in Pedon 3 (Table 3). The soil pedons opened in the lower area of the Subwatershed (3 and 4) had relatively higher pH-H2O and pH-KCl values than those of the upper (1 and 2) pedons which could be due to washing out of

139 Afr. J. Soil Sci. Table 3. Selected chemical characteristics of soils of Kabe Subwatershed.
Ho
rizon Dep
th (cm
)
pH (H2
O)
pH (KCl)
EC
(d
Sm
-1)
OM
Total N C:N
Av.P
(m
gkg
-
1)
Exchangeable cations CEC
CEC clay
PBS
(%)
Extractable Micronutrients
Ca Mg Na K EA Fe Mn Cu Zn
(%) cmol(+) kg soil-1
(mgkg-1
)
Pedon 1
Ap
0-15
6.24
4.58
0.011
1.31
0.05
15.21
16.90
14.25
5.07
0.52
0.41
0.24
27.40
95.31
73.92
137.20
44.59
4.74
2.67
B
15-25
6.11
4.35
0.011
0.90
0.03
17.43
14.90
15.42
6.17
0.55
0.37
0.24
29.20
88.39
77.09
131.20
45.27
3.60
4.44
Pedon 2
Ap
0-30
6.27
4.81
0.010
1.51
0.08
10.97
37.73
10.95
4.42
0.49
0.47
0.16
23.40
127.38
69.77
116.80
44.95
3.07
3.07
B1
30-64
6.16
4.63
0.011
2.08
0.09
13.43
41.33
12.30
4.69
0.36
0.38
0.24
29.80
142.44
59.50
139.20
42.09
5.53
5.02
B2
64-100
6.15
4.58
0.012
1.85
0.08
13.41
42.49
12.33
3.96
0.39
0.41
0.24
26.80
110.00
63.79
117.00
37.32
2.72
5.64
Pedon 3
Ap
0-35
6.33
4.86
0.011
1.45
0.09
9.32
17.65
10.54
6.17
0.36
0.39
0.16
28.40
87.93
61.49
151.00
35.59
8.33
5.33
Bti
35-100
6.32
5.37
0.011
1.34
0.09
8.67
13.33
12.47
6.85
0.45
0.38
0.08
34.00
68.09
59.30
140.20
32.41
12.81
7.02
C
100-
160
6.45
5.40
0.011
0.27
0.01
15.60
9.80
14.60
6.58
0.45
0.39
0.24
27.00
126.00
81.57
138.00
30.68
5.00
4.09
Pedon 4
Ap
0-40
6.22
5.40
0.011
1.02
0.08
7.42
21.57
16.28
8.01
0.62
0.46
0.16
40.80
79.10
62.17
132.80
45.99
10.35
3.11
Ag
40-75
6.36
5.70
0.013
0.80
0.05
9.27
9.41
18.42
8.04
0.55
0.45
0.16
36.20
101.76
75.86
137.00
45.95
9.56
7.42
C
75-130
6.42
6.05
0.014
0.43
0.01
25.00
2.35
19.77
6.55
0.42
0.39
0.08
32.60
151.14
83.23
121.20
45.81
4.47
3.07
Note: EC= electrical conductivity, OM = organic matter, Total N = total nitrogen, C: N = carbon to nitrogen ratio, Av.p = available phosphorus, EA = exchangeable acidity, CEC = cation exchange capacity, PBS = percent base saturation.
bases from higher parts of the Subwatershed and subsequent deposition at lower elevations, which is in agreement with the findings of Mohammed et al. (2005) and Shimeles et al. (2012). In all of the identified horizons of the representative soil pedons, soil pH-H2O values were consistently greater than the pH-KCl ones, indicating the existence of net negative charges on the exchange complex. The lower soil pH-KCl values could also indicate the presence of substantial quantity of exchangeable hydrogen ion as outlined by Mulugeta and Sheleme (2011). According to soil pH-H2O ratings of Tekalign (1991), the overall pH-H2O range of the studied soils fall under the slightly acid (6.0-6.6) soil reaction range, which is favourable range for availability of most nutrients and activities of microorganisms. Considering agricultural purposes, the obtained electrical conductivity (EC) values of the soils of the study area were negligible and were not regarded as a class of problem soils that require special remedial measures and management practices. The organic matter (OM) content in the surface horizons of the soils ranged from 1.02% in Pedon 4 to 1.51% in
Pedon 2, while in the subsurface horizons it ranged from 0.27% in Pedon 3 to 2.08% in Pedon 2 (Table 3). The OM content variation within the Subwatershed did not show any consistent trend with topographic position. However, it decreased consistently with soil depth in all the soil pedons except in Pedon 2. The relatively higher OM content observed in most of the surface horizons than the subsurface horizons could be ascribed to the presence of biomass production from crops, grasses and weeds, all of which improve the organic matter status of the soils. According to the OM content rating criteria established by Tekalign (1991), the overall OM content of the soils of the Subwatershed was in the range of very low to low which could be due to the absence of plant residues and reduced input of crop residues in such cereal based farming into the soils, since the Subwatershed is dominated by cultivated land. In line with this, Gregorich et al. (1998) cited in Abreha et al. (2012) indicated that the low accumulation of OM in cultivated soils could be due to the reduction in total organic inputs (litter, crop residues, manure), increased mineralization rates of OM caused by tillage, increased
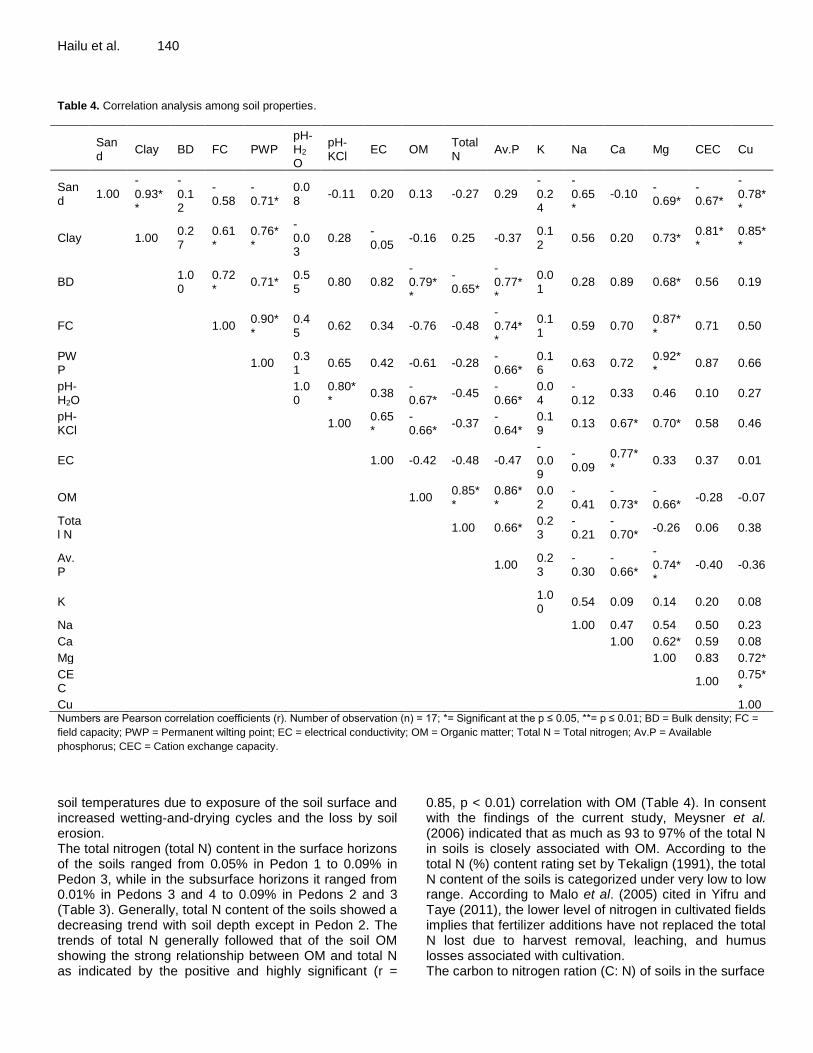
Hailu et al. 140 Table 4. Correlation analysis among soil properties.
Sand
Clay BD FC PWP pH-H2
O
pH-KCl
EC OM Total N
Av.P K Na Ca Mg CEC Cu
Sand
1.00 -0.93**
-0.12
-0.58
-0.71*
0.08
-0.11 0.20 0.13 -0.27 0.29 -0.24
-0.65*
-0.10 -0.69*
-0.67*
-0.78**
Clay 1.00 0.27
0.61*
0.76**
-0.03
0.28 -0.05
-0.16 0.25 -0.37 0.12
0.56 0.20 0.73* 0.81**
0.85**
BD 1.00
0.72*
0.71* 0.55
0.80 0.82 -0.79**
-0.65*
-0.77**
0.01
0.28 0.89 0.68* 0.56 0.19
FC 1.00 0.90**
0.45
0.62 0.34 -0.76 -0.48 -0.74**
0.11
0.59 0.70 0.87**
0.71 0.50
PWP
1.00 0.31
0.65 0.42 -0.61 -0.28 -0.66*
0.16
0.63 0.72 0.92**
0.87 0.66
pH-H2O
1.00
0.80**
0.38 -0.67*
-0.45 -0.66*
0.04
-0.12
0.33 0.46 0.10 0.27
pH-KCl
1.00 0.65*
-0.66*
-0.37 -0.64*
0.19
0.13 0.67* 0.70* 0.58 0.46
EC 1.00 -0.42 -0.48 -0.47 -0.09
-0.09
0.77**
0.33 0.37 0.01
OM 1.00 0.85**
0.86**
0.02
-0.41
-0.73*
-0.66*
-0.28 -0.07
Total N
1.00 0.66* 0.23
-0.21
-0.70*
-0.26 0.06 0.38
Av.P
1.00 0.23
-0.30
-0.66*
-0.74**
-0.40 -0.36
K 1.00
0.54 0.09 0.14 0.20 0.08
Na 1.00 0.47 0.54 0.50 0.23
Ca 1.00 0.62* 0.59 0.08
Mg 1.00 0.83 0.72*
CEC
1.00 0.75**
Cu 1.00 Numbers are Pearson correlation coefficients (r). Number of observation (n) = 17; *= Significant at the p ≤ 0.05, **= p ≤ 0.01; BD = Bulk density; FC =
field capacity; PWP = Permanent wilting point; EC = electrical conductivity; OM = Organic matter; Total N = Total nitrogen; Av.P = Available
phosphorus; CEC = Cation exchange capacity.
soil temperatures due to exposure of the soil surface and increased wetting-and-drying cycles and the loss by soil erosion. The total nitrogen (total N) content in the surface horizons of the soils ranged from 0.05% in Pedon 1 to 0.09% in Pedon 3, while in the subsurface horizons it ranged from 0.01% in Pedons 3 and 4 to 0.09% in Pedons 2 and 3 (Table 3). Generally, total N content of the soils showed a decreasing trend with soil depth except in Pedon 2. The trends of total N generally followed that of the soil OM showing the strong relationship between OM and total N as indicated by the positive and highly significant (r =
0.85, p < 0.01) correlation with OM (Table 4). In consent with the findings of the current study, Meysner et al. (2006) indicated that as much as 93 to 97% of the total N in soils is closely associated with OM. According to the total N (%) content rating set by Tekalign (1991), the total N content of the soils is categorized under very low to low range. According to Malo et al. (2005) cited in Yifru and Taye (2011), the lower level of nitrogen in cultivated fields implies that fertilizer additions have not replaced the total N lost due to harvest removal, leaching, and humus losses associated with cultivation. The carbon to nitrogen ration (C: N) of soils in the surface
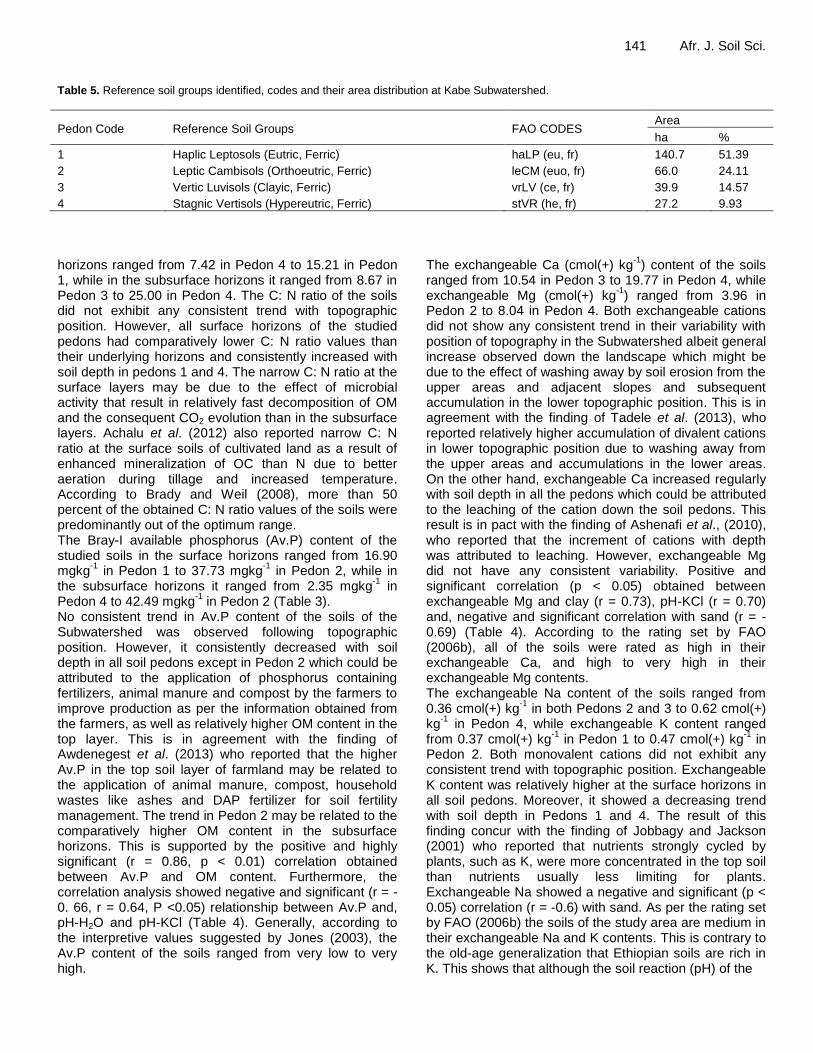
141 Afr. J. Soil Sci. Table 5. Reference soil groups identified, codes and their area distribution at Kabe Subwatershed.
Pedon Code Reference Soil Groups FAO CODES Area
ha %
1 Haplic Leptosols (Eutric, Ferric) haLP (eu, fr) 140.7 51.39
2 Leptic Cambisols (Orthoeutric, Ferric) leCM (euo, fr) 66.0 24.11
3 Vertic Luvisols (Clayic, Ferric) vrLV (ce, fr) 39.9 14.57
4 Stagnic Vertisols (Hypereutric, Ferric) stVR (he, fr) 27.2 9.93
horizons ranged from 7.42 in Pedon 4 to 15.21 in Pedon 1, while in the subsurface horizons it ranged from 8.67 in Pedon 3 to 25.00 in Pedon 4. The C: N ratio of the soils did not exhibit any consistent trend with topographic position. However, all surface horizons of the studied pedons had comparatively lower C: N ratio values than their underlying horizons and consistently increased with soil depth in pedons 1 and 4. The narrow C: N ratio at the surface layers may be due to the effect of microbial activity that result in relatively fast decomposition of OM and the consequent CO2 evolution than in the subsurface layers. Achalu et al. (2012) also reported narrow C: N ratio at the surface soils of cultivated land as a result of enhanced mineralization of OC than N due to better aeration during tillage and increased temperature. According to Brady and Weil (2008), more than 50 percent of the obtained C: N ratio values of the soils were predominantly out of the optimum range. The Bray-I available phosphorus (Av.P) content of the studied soils in the surface horizons ranged from 16.90 mgkg
-1 in Pedon 1 to 37.73 mgkg
-1 in Pedon 2, while in
the subsurface horizons it ranged from 2.35 mgkg-1
in Pedon 4 to 42.49 mgkg
-1 in Pedon 2 (Table 3).
No consistent trend in Av.P content of the soils of the Subwatershed was observed following topographic position. However, it consistently decreased with soil depth in all soil pedons except in Pedon 2 which could be attributed to the application of phosphorus containing fertilizers, animal manure and compost by the farmers to improve production as per the information obtained from the farmers, as well as relatively higher OM content in the top layer. This is in agreement with the finding of Awdenegest et al. (2013) who reported that the higher Av.P in the top soil layer of farmland may be related to the application of animal manure, compost, household wastes like ashes and DAP fertilizer for soil fertility management. The trend in Pedon 2 may be related to the comparatively higher OM content in the subsurface horizons. This is supported by the positive and highly significant (r = 0.86, p < 0.01) correlation obtained between Av.P and OM content. Furthermore, the correlation analysis showed negative and significant (r = -0. 66, r = 0.64, P <0.05) relationship between Av.P and, pH-H2O and pH-KCl (Table 4). Generally, according to the interpretive values suggested by Jones (2003), the Av.P content of the soils ranged from very low to very high.
The exchangeable Ca (cmol(+) kg-1
) content of the soils ranged from 10.54 in Pedon 3 to 19.77 in Pedon 4, while exchangeable Mg (cmol(+) kg
-1) ranged from 3.96 in
Pedon 2 to 8.04 in Pedon 4. Both exchangeable cations did not show any consistent trend in their variability with position of topography in the Subwatershed albeit general increase observed down the landscape which might be due to the effect of washing away by soil erosion from the upper areas and adjacent slopes and subsequent accumulation in the lower topographic position. This is in agreement with the finding of Tadele et al. (2013), who reported relatively higher accumulation of divalent cations in lower topographic position due to washing away from the upper areas and accumulations in the lower areas. On the other hand, exchangeable Ca increased regularly with soil depth in all the pedons which could be attributed to the leaching of the cation down the soil pedons. This result is in pact with the finding of Ashenafi et al., (2010), who reported that the increment of cations with depth was attributed to leaching. However, exchangeable Mg did not have any consistent variability. Positive and significant correlation (p < 0.05) obtained between exchangeable Mg and clay (r = 0.73), pH-KCl (r = 0.70) and, negative and significant correlation with sand (r = -0.69) (Table 4). According to the rating set by FAO (2006b), all of the soils were rated as high in their exchangeable Ca, and high to very high in their exchangeable Mg contents. The exchangeable Na content of the soils ranged from 0.36 cmol(+) kg
-1 in both Pedons 2 and 3 to 0.62 cmol(+)
kg-1
in Pedon 4, while exchangeable K content ranged from 0.37 cmol(+) kg
-1 in Pedon 1 to 0.47 cmol(+) kg
-1 in
Pedon 2. Both monovalent cations did not exhibit any consistent trend with topographic position. Exchangeable K content was relatively higher at the surface horizons in all soil pedons. Moreover, it showed a decreasing trend with soil depth in Pedons 1 and 4. The result of this finding concur with the finding of Jobbagy and Jackson (2001) who reported that nutrients strongly cycled by plants, such as K, were more concentrated in the top soil than nutrients usually less limiting for plants. Exchangeable Na showed a negative and significant (p < 0.05) correlation (r = -0.6) with sand. As per the rating set by FAO (2006b) the soils of the study area are medium in their exchangeable Na and K contents. This is contrary to the old-age generalization that Ethiopian soils are rich in K. This shows that although the soil reaction (pH) of the

Hailu et al. 142 soils of the study area is in the range that favours the availability of the cation, application of potassium containing fertilizers can increase production and productivity particularly in the cultivated lands, where there is a heavy removal of potassium by harvesting. The exchangeable acidity content of the soils of the study area ranged from 0.08 in Pedons 3 and 4 to 0.24 cmol(+) kg
-1 in Pedons 1, 2 and 3 (Table 3). In practice, above pH
5.2, no significant quantities of exchangeable aluminium are found as the Al ion is precipitated at this pH and as a result exchangeable Al
3+ was found to be trace in the
studied soils. Cation exchange capacity (CEC) of the soils of the study area across the surface and subsurface horizons ranged from 23.40 cmol(+) kg
-1 in Pedon 2 to 40.80 cmol(+) kg
-1
of soil in Pedon 4 (Table 3). It increased consistently down the topographic position with the exception of Pedon 1. Furthermore, CEC of the soils consistently decreased with soil depth in Pedon 4 but increased in Pedon 1. In the remaining pedons, it did not follow any consistent trend. The result could be strongly associated with the nature and amount of clay of the soils as it is indicated by the positive and highly significant correlation (r = 0.81, p < 0.01) with clay content (Table 4). Ahmed (2002) also reported overall higher CEC values as a result of high clay accumulation. According to the rating suggested by Hazelton and Murphy (2007), the CEC of the soils ranged from moderate in surface horizon of Pedon 2 to very high in surface horizon of Pedon 4. Following the variation in clay content, the CEC of clay ranged from 68.09 cmol(+) kg
-1 of clay in Pedon 3 to
151.14 cmol(+) kg-1
of clay in Pedon 4. Following the variation in exchangeable bases and CEC, the base saturation percentage (PBS) of the soils ranged from 59.30 in Pedon 3 to 83.20 in Pedon 4. It did not show any consistent trend with topographic position. However, it showed a consistent increasing trend with soil depth in Pedons 1 and 4 which might be due to leaching of bases from the overlying layers and subsequent accumulation in the subsurface horizons. In line with this finding, Achalu et al. (2012) also reported similar trends of the distribution of PBS with exchangeable Ca and Mg, since factors that affect these soil attributes also affect the PBS. According to the rating set by Hazelton and Murphy (2007), the PBS of the soils of the study area was within the range of moderate to very high. None of the extractable micronutrients exhibited consistent trend with topographic position. Extractable iron (Fe) in the soils ranged from 116.80 mgkg
-1 in Pedon
2 to 151.00 mgkg-1
in Pedon 3. It consistently decreased with soil depth in Pedons 1 and 3. Nevertheless, it showed unsystematic pattern with increasing depth in Pedons 2 and 4. On the other hand, extractable manganese (Mn) (mgkg
-1) of the soils ranged from 30.68
in Pedon 3 to 45.99 in Pedon 4 (Table 3). In all soil pedons of the study area except Pedon 1, extractable Mn
showed a decreasing trend with increasing soil depth. According to the interpretative values of DTPA extractable micronutrients set by Jones (2003), all the soils of the study area were rated as high in their extractable Fe and Mn contents which could be attributed to the parent material and pH condition of the soils. Abayneh (2005) and Alemayehu (2007) indicated that iron and manganese are at an adequate level in Ethiopian soils. The contents of extractable copper (Cu) across the soils ranged from 2.72 mgkg
-1 in Pedon 2 to 12.81 mgkg
-1 in
Pedon 3. It decreased consistently with soil depth in Pedons 1 and 4. On the other hand, extractable Zn of the soils ranged from 2.67 mgkg
-1 in Pedon 1 to 7.42 mgkg
-1
in Pedon 4. It showed an increasing trend with soil depth in Pedons 1 and 2. Horizons with relatively higher clay content showed relatively higher extractable Cu content than sand dominated horizons. This could be due to the adsorption in the clay sized particles as indicated by the highly significant and positive correlation (r = 0.85, p < 0.01) with clay and negative and highly significant correlation (r = -0.78, p < 0.01) with sand. The result of this study is in consent with the finding of Nazif et al. (2006) who reported that most sandy soils are deficient in micronutrients which might be due to leaching. As per the rating recommended by Jones (2003), the soils of the study area were found to be medium to high in their extractable Cu and high in their extractable Zn content. Soil Classification and Mapping Soil mapping unit SMU1 This soil mapping unit is represented by soil Pedon 1. It has steeply dissected topography with steep slope of 33%, limitation of depth by continuous rock within 25cm of the soil surface, strongly eroded area and drained soil. The representative soil pedon was characterized by gravelly and common surface stoniness. Also the mapping unit is characterized by many coarse fragments throughout and high extent of rock outcrops laid over the dissected mountainous area. Considering these features, the soils in this area (mapping unit) met the requirement for Haplic Leptosols of the FAO/WRB (2006) classification system. The pedon also had PBS of greater than 50% throughout up to the continuous rock and high status of iron, and qualifies for Eutric and Ferric suffix qualifiers. According to the indicated classification system one or a few good crops could perhaps be grown on such slopes but at the price of severe erosion. This mapping unit covers an area of 140.7 ha which is 51.39% of the study area (Table 5 and Figure 2). Soil mapping unit SMU2 This soil mapping unit is represented by soil Pedon 2. It has moderately steep slope of 23%, moderately deep

143 Afr. J. Soil Sci. effective soil depth (100cm) and well-drained soil. The soil pedon has subsurface sandy loam texture, evidence of change in soil structure from weak fine granular to moderate medium subangular in the subsoil, cation exchange capacity (by 1M NH4OAc) of greater than 16 cmol (+) kg
-1 clay, greater than 10 percent clay with
thickness of greater than 15 cm and has been identified as cambic subsurface horizon. Hence the soils are classified under Cambisols. The soil pedon had a continuous rock starting within 100 cm of the soil surface and qualifies for the leptic prefix qualifier. It further had percent base saturation of greater than 50 in all part from the soil surface down to the continuous bedrock and high iron status and therefore qualified the orthoeutric and ferric suffix qualifiers. This mapping unit covers an area of 66.0 ha which is 24.11% of the study area (Table 5 and Figure 2). Soil mapping unit SMU3 This soil mapping unit is represented by Pedon 3. It has slope of 20%, very deep effective soil depth (160cm) and moderately to well drained soil. The pedon has subsurface horizon with higher clay than an overlying horizon in which the ratio of clay in the subsurface horizon to overlying horizon is greater than 1.2 which shows the presence of argic horizon according to FAO/WRB (2006) soil classification system. This is as a result of illuvial accumulation of clay and/or pedogenetic formation of clay in the subsoil and/or destruction or selective erosion of clay in the surface. Moreover, the argic horizon has CEC (by 1M NH4OAc) of greater than 24 cmol(+) kg
-1 clay throughout. Considering these
criteria, the soil met the requirements for reference soil group (RSG) of Luvisols (Table 5 and Figure 2). Furthermore, the soil pedon had a thickness of greater than 25 cm subsurface horizon with greater than 30 percent clay, slickensides and cracks, and meet the requirement for vertic prefix qualifier. Also, the pedon had texture of clay in a layer, more than 30 cm thick, within 100 cm of the soil surface and high iron status to qualify for clayic and ferric suffixes. Therefore, the soils were classified as Vertic Luvisols with clayic and ferric suffixes. Luvisols have high activity clays throughout the argic horizon and a high base saturation at certain depths, all of which were met in this soils represented by Pedon 3. This mapping unit covers an area of 39.9 ha which is 14.57% of the study area. Soil mapping unit SMU4 This soil mapping unit is represented by Pedon 4 which was opened at the relatively lower slope area (5.5%) than the others. It has deep effective soil depth (130cm), clays that expand and swell during wet and dry seasons and cracks that open and close periodically. Furthermore, it has vertic horizon (with greater than 30 percent clay)
starting within 100 cm of the soil surface. Considering the above criteria the soils represented by this pedon meet the requirements of Vertisols. Furthermore, the representative pedon showed the occurrence of distinct pattern of mottling within 50 cm from the soil surface that reflects the presence of alternating conditions of oxidation and reduction, and thus, qualified for the stagnic prefix. Moreover, the soil pedon showed greater than 80 percent base saturation in the lower subsurface horizon and high status of iron throughout, and met the requirement of hypereutric and ferric suffix qualifiers. Therefore, the soils were classified as Stagnic Vertisols with hypereutric and ferric suffix qualifiers. This mapping unit covers an area of 27.2 ha which is 9.93% of the study area. Conclusion and Recommendations The systematic appraisal and understanding of soil resources with respect to their extent, distribution, characteristics, behavior and use potential is very important and has proved vital developing an effective land use system for augmenting agricultural production on a sustainable basis. In view of this, characterization and classification of soils was conducted in Kabe subwatershed of the south Wollo zone. Methodologies were undertaken to study the environmental, morphological, physico-chemical properties of the soils and results of the study revealed that the study area showed a great variety of soil morphological, physical, chemical characteristics and soil types due to variations in management intensity, topographic position, elevation and degradation. The soils represented by Pedons 1, 2, 3 and 4 varied from shallow to very deep and the upper lying area and steep slope soils were characterized by shallower soil depths. It was also observed that soils in the lower topographic position of the Subwatershed exhibited seasonal cracks and poor to imperfectly drained soil condition. In general, considerable variations in soil morphological properties with topographic positon and soil depth were observed in the Subwatershed. Discernible difference in amount and distribution of particle size with depth and across the soils was also investigated and none of the fractions showed a consistent pattern with topographic position albeit sand generally decreased and clay increased with decreasing topographic position. No excessive compaction and restriction of root development occurred in the soils and more than 50 percent of the obtained particle density values of the soils were above the standard value (2.65 gcm
-3). The total
porosity of the soils showed a decreasing trend with increasing soil depth in all soil pedons. The soil pedons opened at the upper slope area and comparatively higher altitude of the Subwatershed showed generally lower moisture retention. The pH-H2O of the soils was found to

Hailu et al. 144
Figure 2. Soil map of Kabe Subwatershed.
be slightly acidic throughout and fall within the range that are apt to be trouble free for agriculture. The soils were deficient in OM and total N, and OM, total N and available phosphorus content were all decreased with soil depth except in Pedon 2. Exchangeable Ca followed by Mg were found to be the dominant basic cations in the exchange complex of the colloidal material of the soils and the soils were characterized by high status of divalent (exchangeable Ca and Mg) and medium in monovalent (exchangeable Na and K) basic cations. CEC of the soils increased consistently down the topographic position with the exception of Pedon 1. Major part of the study area was characterized by high status of extractable micronutrients. Following the diversity in the indicated characteristics of the soils, four reference soil groups (RSG) were identified in the study area. These RSG are: Vertisols, Luvisols, Cambisols and Leptosols. In general, the differences observed in morphological, physical and chemical characteristics along topography, soil depth and among soils of the Subwatershed indicate the presence of different factors that affect the development of soil. Soil fertility management practices should focus on the restoration and increasing of OM and nitrogen content of the soils. In addition, soil and water conservation activities supplemented by appropriate organic and inorganic fertilizer application based on the site-specific soil fertility level should be increased and expanded across the terrains. REFERENCES Abayneh Esayas (2005). Characteristics, genesis and classification of reddish soils from Sidamo Ethiopia. PhD
Thesis, Universiti of Putra Malaysia. pp: 25-52. Abdenna Deressa, Bikila Bote and Hirpa Legesse (2013). Evaluation of soil cations in agricultural soils of east Wollega Zone in south western Ethiopia. Sci. Technol. Arts Res. J. 2(1): 10-17. Abreha Kidanemariam, Heluf Gebrekidan, Tekalign Mamo, Kibebew Kibret (2012). Impact of altitude and land use type on some physical and chemical properties of acidic soils in Tsegede highlands, Northern Ethiopia. Open J. Soil Sci. 2, 223-233. Achalu Chimdi, Heluf Gebrekidan, Kibebew Kibret and Abi Tadesse (2012). Status of selected physicochemical properties of soils under different land use systems of Western Oromia, Ethiopia. J. Biodivers. Envir. Sci. 2(3): 57-71. Ahmed Hussein (2002). Assessment of spatial variability of some physico-chemical properties of soil under different elevations and land use system in the Western slopes of mount Chilalo, Arsi. MSc Thesis, Alemaya University, Ethiopia. 111p. Alemayehu Kiflu (2007). Effect of different land use systems and topography on some selected soil properties at Delbo Watershed Area, Wolaita SNNPRS. M.Sc. Thesis, Hawassa University, Awassa, Ethiopia. pp 22-25. Amsalu Aklilu, Stroosnijder L, de Graaff J, (2007). Long-term dynamics in land resource use and the driving forces in the Beressa watershed, highlands of Ethiopia. J. Envir. Manage. 83: 448-459. Ashenafi Ali, Abayneh Esayas, Sheleme Beyene (2010). Characterizing soils of Delbo Wegene watershed, Wolaita zone, Southern Ethiopia for planning appropriate land management. J. Soil Sci. Envir. Manage. 1(8): 184-199.

145 Afr. J. Soil Sci. Awdenegest Moges, Melku Dagnachew, Fantaw Yimer (2013). Land use effects on soil quality indicators: A case study of Abo-Wonsho Southern Ethiopia. Appl. Envir. Soil Sci. Hindawi Publishing Corporation. Bouyoucus GJ (1962). Hydrometer method improvement for making particle size analysis of soils. Agron. J. 54: 179-186. Brady NC, Weil RR (2008). The nature and properties of soils, 14
th ed. Pearson Prentice hall. Upper Saddle River,
New Jersey Columbus, Ohia, USA, 965 pp. Buol SW, Southard RJ, Graham RC, McDaniel PA (2003). Soil Genesis and Classification, 5
th ed. Iowa state University
Press. Ames, USA. Carter MR, Gregorich EG (2008). Soil sampling and methods of analysis. 2
nd (Ed) Canadian Soil Science
Society. CRC press, USA. Cools N, De Vos B (2010). Sampling and analysis of soil. Manual part X, 208 pp. In: manual on methods and criteria for harmonized sampling, assessment, monitoring and analysis of the effects of air pollution on forests, UNECE, ICP Forests, Hamburg. ISBN: 978-3-926301-03-1. [http://www.icp-forests.org/Manual.htm]. Dengiz O, Mustafa S, Esra F, Saygin F, Atasoy C (2012). Morphological and physico-chemical characteristics and classification of vertisol developed on Deltaic plain, Turkey. Open J. Soil Sci. 2:20-27. EIAR (Ethiopian Institute of Agricultural Research) (2011). Coordination of National Agricultural Research System, Ethiopia. English and Amharic Version. EIAR, Addis Ababa. Ellerbrock R, Gerke H (2013). Characterization of soil organic matter composition in of top and sub soil samples from colluvial and eroded sites. ZALF, Inst. of soil landscape Research, Muncheberg, Germany. Geophys. Res. Abstracts Vol. 15. FAO (2006a). Guidelines for soil description. FAO, Rome, Italy. 109p. FAO (2006b). Plant nutrition for food security: A guide for integrated nutrient management. FAO, Fertilizer and Plant Nutrition Bulletin 16, Rome, Italy. FAO/WRB (Food and Agricultural Organization of the United Nation/World Reference Base for soil Resources) (2006). A framework for international classification, correlation and communication Report. No. 103. Rome, Italy. 145p. Fischer G, Velthuizen HV, Shah M, Nachtergaele F (2002). Global Agro-ecological Assessment for Agriculture in the 21
st
Century: Methodology and Results. International Institute for Applied Laxenburg, Australia. Food and Agriculture Organization of the United Nations Viale delle Terme di Caracalla Rome, Italy. Gete Zeleke, Hurni H (2001). Implication of land use and land cover dynamics for mountain resource degradation in the northwestern Ethiopian highlands. Mountain Res. Dev., 21: 184-191. Gregorich EG, Greer KJ, Anderson DW, Liang BC (1998). Carbon distribution and losses: Erosion and deposition effects. Soil and Tillage Research. 47 (3-4): 291-302. Hazelton P, Murphy B (2007). Interpreting soil test results: what do all the numbers mean?. 2
nd Edition. CSIRO
publishing, Sydney, Australia. 169p. IFPRI (International Food and Policy Research Institute) (2010). Fertilizer and Soil Fertility Potential in Ethiopia. Constraints and opportunities for enhancing the system.
Summary report of the soil fertility and fertilizer value chain diagnostic work. 66p. Jackson ML (1973). Soil chemical analysis. Prentice Hall, Inc., Engle Wood Cliffs. New Jersey. 183-204p. Jobbagy E, Jackson R (2001). The distribution of soil nutrients with depth: Global patterns and the imprint of plants. Biogeochemistry. Kluwer Academic Publishers. 53: 51–77. Jones JB (2003). Agronomic handbook: management of crops, soils, and their fertility. CRC Press LLC, Boca Raton, Florida, USA. 482p. Kebrom Tekle (1999). Land degradation problems and their implications for food shortage in south Wello, Ethiopia. Environmental Management, 23(4):419-427. Liu Y, Chen Y (2006). Impact of population growth and land-use change on water resources and ecosystems of the arid Tarim River Basin in Western China. Int. J. Sustain. Dev. World Ecol. V.13, 295p. Madhan M (2008). Characterization and classification of soils and land suitability of a Micro-Watershed in Hanagal Taluk. An MSc thesis submitted to Department of Soil Science and Agricultural Chemistry College of Agriculture of University of Agricultural Sciences, Dharwad University.117p. Malo DD, Schumacher TE, Doolittle JJ (2005). Long-term cultivation impacts on selected soil properties in the northern Great Plains. Soil and Tillage Research. 81: 277-291. Meysner T, Szajdak L, KU (2006). Impact of the farming systems on the content of biologically active substances and the forms of nitrogen in the soils. Agronomy Research. 4(2): 531-542. Mohammed Assen, Leroux PAL, Barker CH and Heluf Gebrekida (2005). Soils of Jelo micro-catchment in the Chercher highlands of eastern Ethiopia: I. Morphological and physio-chemical properties. Ethiopian Journal of Natural Resources, 7(1): 55-81. Moradi S (2013). Impacts of organic carbon on consistency limits in different soil textures. Int. J. Agric. Crop Sci. 5(12): 1381-1388. Mulugeta Demiss and Sheleme Beyene (2011). Characterization and classification of soils along the toposequence of Kindo Koye watershed in southern Ethiopia. MoA. Addis Ababa, Ethiopia. East Afr. J. Sci. 4 (2):65-77. Munsell Colour Company (2000). Munsell Soil Colour Company Inc. Gretagmacbeth, New Windsor, New York, USA. Nazif W, Sajida P and Saleem I (2006). Status of micronutrients in soils of district Bhimber (Azad Jammu and Kashmir), Pakistan. Journal of Agricultural and Biological Science. 1(2). Okalebo JR, Gathua KW and. Womer PL (2002). Laboratory methods of sol and plant analysis: A working manual, 2
nd Ed.
TSBF-CIAT and SACRED Africa, Nairobi, Kenya. 128p. Pravin R, Dodha V, Vidya D, Manab C and Saroj M (2013). Soil bulk density as related to soil texture, organic matter content and available total nutrients of Coimbatore soil. International Journal of Scientific and Research Publications. 3(2). Pulakeshi PH (2010). Characterization and classification of soil resources of Mantagani village in Haveri District. Thesis

Hailu et al. 146
submitted to the University of Agricultural Sciences, department of soil science and agricultural chemistry, Dharwad University, India.145p. Richards LA (1965). Physical condition of water in soil. In: C.A. Black (editor in chief). Methods of Soil Analysis, Part I, Am. Soc. Of Agronomy, Inc., Publishers, Madison, Wisconsin, USA. Rowell DL (1994). Soil science: Method and applications. Addison Wesley Longman Limited, England. 350p. Sahlemedhin Sertsu and Taye Bekele (2000). Procedures for Soil and Plant Analysis. National Soil Research center, Ethiopian Agricultural Research organization. SAS (2003). Statistical analysis system: version 9.1, SAS Institute Inc, Cary, North Carolina, USA. Shimeles Damene (2012). Effectiveness of soil and water conservation measures for land restoration in the Wello area, northern Ethiopian highlands. Ecology and Development Series No. 89. Shimeles Damene, Lulseged Tamene and Paul LG (2012). Performance of farmland terraces in maintaining soil fertility: a case of Lake Maybar watershed in Wello, Northern highlands of Ethiopia. J. Life Sci. 6. Tadele Amare, Aemro Terefe, Yihenew Gebreselassie, Birru Yitaferu, Wolfgramm B, Hurni H (2013). Soil properties and crop yields along the terraces and toposequece of Anjeni Watershed, Central Highlands of Ethiopia. Canadian Center of Science and Education. J. Agric. Sci. 5(2). Tan KH (1996). Soil sampling, preparation, and analysis. Marcel Dekker, Inc. New York, USA. pp. 68-78. Tefera Mengesha, Chernet Tadiwos, Harro W (1996). Explanation on geological map of Ethiopia a 1:2,000,000 scale. Bulletin No 3, Addis Ababa, Ethiopia, pp 2-64.
Tekalign Tadese (1991). Soil, plant, water, fertilizer, animal manure and compost analysis. Working Document No. 13. International Livestock Research Center for Africa, Addis Ababa, Ethiopia. Tobiasova E, Simansky V, Debska B, Banach-Szott M (2013). Soil structure and soil organic matter of selected soil types in different ecosystems. Agriculture (Poľnohospodárstvo), 59 (1): 1−8. Van Reewijk LP (1992). Procedures for Soil Analysis (3
rd
Ed.). International Soil Reference Center (ISRIC), Wageningen, The Netherlands, 371p. Walkley A, Black IA (1934). An examination of the Degtjareff method for determining soil organic matter and proposed modification of the titration method, Soil Soc. 37:29-34. Young A (1976). Tropical soils and soil survey. Cambridge University Press. Yifru Abera, Taye Belachew (2011). Effects of land use on soil organic carbon and Nitrogen in soils of Bale, Southeastern Ethiopia. Tropical and Subtropical Agroecosystems. 14: 229 – 235.