Characteristics of weight control and physical activity
12
Chapter 1 Characteristics of weight control and physical activity Weight control Weight control is widely defined as approaches ta maintaining weight within the 'healthy' (Le., 'normal' or 'acceptable') range of body mass index of 18.5 to 24.9 kg/m2 throughout adult- hood (WHO Expert Committee, 1995). It should also include prevention of weight gain of more th an 5 kg in ail people. ln those who are already over- weight, a reduction of 5-10% of body weight is recommended as an initial goal. Anthropometrie measures Body mass index When we speak about the prevalence of obesity in populations, we mean the frac- tion of people who have excess storage of body fat. ln adult men with weight in the acceptable range, the percentage of body fat is around 15-20%. ln women, this percentage is higher (about 25-30%). Because differences in weight between individuals are only partly due to variations in body fat, many people abject to the use of weight or indices based on height and weight (such as the body mass index) to discriminate between overweight and normal-weight people. Body mass index (BMI) is a measure of body mass relative ta height, calculated as weight (kg) divided by height squared (m2). Examples can of course be found ta illustrate inappro- priate use of BMI to compare certain individuals, such as an identical body mass index in a young male body builder and a middle-aged obese woman. ln general, however, there is a very good correlation between BMI and the per- centage of body fat in large populations. Deurenberg et al. (1991) showed that, in Dutch adults, the following equation can be used ta estimate the body fat per- centage: Percentage body fat = 1.2 x BMI + 0.23 x (age) - 10.8 x (gender) - 5.4 ln this equation the value for gender is one for men and zero for women. About 80% of the variation in body fat between individuals can be explained by this formula, with a stan- dard error of about 4%. It follows from the equation that for a given height and weight, the body fat percentage is about 10% higher in women th an in men. Also, people get fatter when they get older even when their body weight is stable. The good correlation between BMI and fat percentage implies that, at the popu- lation level, BMI can be used to classify people in terms of excess body fat. ln practice, people or populations are usu- ally not classified on the basis of their body fat percentage but of their BMI. Usually, the same cut-points are applied for men and women and for different age-groups, because the relationships between BMI and mortality are similar (Le., the relative mortality associated with obesity is similar in men and women). However, in most age-groups, the absolute mortality is much lower in women, implying that the effect of excess body fat is less in women than BMI in men. This may be because in women the excess body fat is usually distributed as subcutaneous fat and mainly peripherally (thighs, buttocks, breasts), while in men there is a relative excess of body fat stored in the abdominal cavity and as abdominal subcutaneous fat. It has been sug- gested that the optimal body mass index (Le., the BMI associated with low- est relative risk) increases with age (Andres, 1985). Fat distribution patterns Fat can be stored in adipose tissue as subcutaneous fat and as intra-abdomi- nal fat. The pattern of subcutaneous fat can differ greatly with age, sex and eth- nicity. Women tend ta store subcuta- neous fat in the gluteal and femoral regions and breasts, whereas men tend ta store subcutaneous fat more in the truncal region. Intra-abdominal (or vis- ceral) fat is formed by fat deposition in the omentum and mesentery and as retro-peritoneal fat. The omental and mesenteric adipose tissues are drained by the portal vein and are sometimes labelled as 'portal fat' (Björntorp, 1990). Apart from their unique location and venous drainage, the portal tissues have several other characteristics that make them liable to involvement in the meta- bolic disturbances associated with obe- sity. The fat ce Ils here are more respon- sive to lipolytic stimuli (such as epineph- rine and norepinephrine) and less responsive to the anti-lipolytic effect of insulin. The result can be overproduc- tion of free fatty acids which are released into the portal vein and thus expose the liver to relatively high con- centrations of free fatty acids, implicated in the development of heart disease and diabetes (Björntorp, 1990).
Transcript of Characteristics of weight control and physical activity

Chapter 1
Characteristics of weight control and physical activity
Weight controlWeight control is widely defined asapproaches ta maintaining weightwithin the 'healthy' (Le., 'normal' or'acceptable') range of body mass indexof 18.5 to 24.9 kg/m2 throughout adult-
hood (WHO Expert Committee, 1995).It should also include prevention of
weight gain of more th an 5 kg in ailpeople. ln those who are already over-weight, a reduction of 5-10% of bodyweight is recommended as an initialgoal.
Anthropometrie measuresBody mass indexWhen we speak about the prevalence ofobesity in populations, we mean the frac-tion of people who have excess storageof body fat. ln adult men with weight inthe acceptable range, the percentage ofbody fat is around 15-20%. ln women,this percentage is higher (about
25-30%). Because differences in weightbetween individuals are only partly dueto variations in body fat, many peopleabject to the use of weight or indices
based on height and weight (such as thebody mass index) to discriminatebetween overweight and normal-weightpeople. Body mass index (BMI) is ameasure of body mass relative ta height,calculated as weight (kg) divided by
height squared (m2). Examples can ofcourse be found ta illustrate inappro-priate use of BMI to compare certainindividuals, such as an identical bodymass index in a young male body builderand a middle-aged obese woman. ln
general, however, there is a very goodcorrelation between BMI and the per-
centage of body fat in large populations.Deurenberg et al. (1991) showed that, inDutch adults, the following equation canbe used ta estimate the body fat per-centage:
Percentage body fat = 1.2 x BMI + 0.23x (age) - 10.8 x (gender) - 5.4
ln this equation the value for genderis one for men and zero for women.
About 80% of the variation in bodyfat between individuals can beexplained by this formula, with a stan-dard error of about 4%. It follows fromthe equation that for a given height andweight, the body fat percentage is about10% higher in women th an in men. Also,people get fatter when they get oldereven when their body weight is stable.The good correlation between BMI andfat percentage implies that, at the popu-lation level, BMI can be used to classifypeople in terms of excess body fat. lnpractice, people or populations are usu-ally not classified on the basis of theirbody fat percentage but of their BMI.Usually, the same cut-points are appliedfor men and women and for differentage-groups, because the relationshipsbetween BMI and mortality are similar(Le., the relative mortality associated
with obesity is similar in men andwomen). However, in most age-groups,the absolute mortality is much lower inwomen, implying that the effect ofexcess body fat is less in women thanBMI in men. This may be because inwomen the excess body fat is usuallydistributed as subcutaneous fat andmainly peripherally (thighs, buttocks,
breasts), while in men there is a relativeexcess of body fat stored in theabdominal cavity and as abdominal
subcutaneous fat. It has been sug-gested that the optimal body mass
index (Le., the BMI associated with low-est relative risk) increases with age(Andres, 1985).
Fat distribution patternsFat can be stored in adipose tissue assubcutaneous fat and as intra-abdomi-nal fat. The pattern of subcutaneous fatcan differ greatly with age, sex and eth-nicity. Women tend ta store subcuta-neous fat in the gluteal and femoral
regions and breasts, whereas men tendta store subcutaneous fat more in thetruncal region. Intra-abdominal (or vis-ceral) fat is formed by fat deposition inthe omentum and mesentery and asretro-peritoneal fat. The omental andmesenteric adipose tissues are drainedby the portal vein and are sometimeslabelled as 'portal fat' (Björntorp, 1990).Apart from their unique location andvenous drainage, the portal tissues haveseveral other characteristics that makethem liable to involvement in the meta-bolic disturbances associated with obe-sity. The fat ce Ils here are more respon-sive to lipolytic stimuli (such as epineph-rine and norepinephrine) and less
responsive to the anti-lipolytic effect ofinsulin. The result can be overproduc-tion of free fatty acids which are
released into the portal vein and thusexpose the liver to relatively high con-centrations of free fatty acids, implicatedin the development of heart disease anddiabetes (Björntorp, 1990).
IARC Handbooks of Cancer Prevention, Volume 6: Weight Control and Physical Activity
Since the pioneering work of Jean
Vague in the 1940s, it has slowly
become accepted that different bodymorphology or types of fat distributionare independently related ta the healthrisks associated with obesity (Vague,
1956). Starting with Vague's brachio-
femoral adipo-muscular ratio as an indexof fat distribution (which was based onratios of skinfolds and circumferences ofthe arms and thighs), more recentindices were designed specifically to begood predictors of intra-abdominal fat.The most popular is the waist ta hipcircumference ratio (WHR). The simplestmeasure is the waist circumference,
which may be predictive of intra-abdomi-nal fat at least as accurately as the WHR
(Pouliot et al., 1994) and levels ofcardiovascular risk factors and diseaseas weil as BMI and WHR (Han et al.,1995). It has been suggested that waistcircumference could be used to replaceclassifications based on BMI and theWHR (Lean et al., 1995; Booth et al.,2000) and this has been agreed by theWHO. More complex measures, such asthe sagittal abdominal diameter, the ratioof waist/thigh circumference, the ratio ofwaist/height or the conicity index, havealso been proposed to perform even
better than waist circumference for oneor more of these purposes. However, thedifferences between these measures aresmall and the use of ratios may
complicate the interpretation of associa-tions with disease and their conse-
quences for public health. For instance,the waist/height ratio may be a betterpredictor of morbidity bec au se the waist
circumference is positively associatedwith disease, and because height, forreasons unrelated ta body composition
or fat distribution, is inversely associatedwith cardiovascular disease risk.
Replacing BMI and WHR by simpleeut-points which are optimal for eachsex, age-group, population and relation-ship with specifie diseases may, how-ever, be too simple. Still, as suggestedby Lean et al. (1995), some cut-points
2
may provide guidance in interpretingvalues of waist circumference for adults(Table 1). Other cut-points, based onclassification of subjects on a 'criticallevel' of intra-abdominal fat, have beenproposed (Lemieux et al., 1996).
Definition of obesity, overweight andunderweighteut-points of BMI, that apply to both menand women and to ail adult age-groups,have been proposed by a WHO ExpertCommittee for the classification ofoverweight (WHO Expert Committee,1995) (Table 2). The BMI eut-points fordegrees of under- and over-weight arelargely arbitrary. The cut-points foroverweight (25, 30, 40 kg/m2) were ini-tially based on the monotonic increase inthe risk of mortality throughout the rangeof 20 ta 40 kg/m2. The eut-point forunder-weight (18.5 kg/m2) was largelybased on health-related problems asso-ciated with malnutrition in developing
countries.
There are limitations in the interpreta-tion of BMI in very old subjects as weil asin certain ethnic groups with unusual
body proportions (e.g., populations
where stunted growth is common orthose with relatively short leg lengthcompared to sitting height).
Causes of obesityObesity is always caused by an excessof energy intake over energy expendi-
ture, referred to as a positive energy
balance. Factors influencing this arebiological (e.g., age, sex, genes),
environmental and behavioural (includingdiet and physical activity). It has beenargued that the prevalence of obesity inpopulations is determined mainly by thephysical, economical and socio-culturalenvironment (Egger & Swinburn, 1997),which may act at a macro-Ievel (i.e., onnations or large populations) or at a
micro-Ievel (a local or household level).These factors determine what percent-age of the population is or will become
MenWomen
Level1 a
2: 94 cm (- 37 inches)2: 80 cm (-32 inches)
Level 2b
2: 102 cm (- 40 inches)2: 88 cm (- 35 inches)
a Level 1 was initially based on replacing the classification of overweight (SMI ~ 25 kg/m2) in
combination with high WHR (~ 0.95 in men and ~ 0.80 in women)b Level 2 was based on classification of obesity (SMI ~ 30 kg/m2) in combination with high
WHR (Han et a/., 1995; Lean et al., 1995).
SMI WHO classification
0( 18.5 kg/m2
18.5-24.9 kg/m2
Underweight
25.0-29.9 kg/m2
30.0-39.9 kg/m2
2: 40.0 kg/m2
Grade 1 overweight
Grade 2 overweight
Grade 3 overweight
Popular description
Thin
'Healthy', 'normal' or
'acceptable' weight
Overweight
ObesityMorbid obesity
Source: WHO Expert Committee, 1995

obese, but do not explain which individu-ais are likely to become obese; at theindividuallevel, the biological and behav-ioural factors are the primary determi-
nants of obesity.Diminished physical activity, changing
dietary patterns, energy-dense diets andinadequate adjustment of energy intakerelative to diminished energy require-ments are ail likely to be major determi-nants of the observed changes in theprevalence of obesity over time. Prenticeand Jebb (1995) proposed that, at thepopulation level, limited physical activitywas more important than energy or fatconsumption in explaining the timetrends of obesity in the United Kingdom.Their analysis was based on aspects ofphysical activity (such as number ofhours spent watching television) andhousehold consumption survey data.Although such ecological correlationsseem compelling, they may also be mis-leading. One could, for example, findvery impressive correlations over timewhen plotting the density of mobile
Characteristics of weight control and physical activity
phones versus the prevalence of obesity,without any likely mechanism.
The influence of dietary intake on theprevalence of obesity in populations andindividuals is a very difficult subject tostudy, as it is usually necessary to rely onself-reporting of die!. ln particular, energyand fat consumption are known ta beunderreported with increasing degreesof overweight (Seidell, 1998).
Changes in smoking behaviour mayalso contribute ta changes in bodyweight at a population level. Data fromthe United States show that, althoughsmoking cessation can explain some ofthe increase in the prevalence of over-weight, it cannot on its own account forthe major portion of the increase (Flegal
et al., 1995). Other studies have sug-gested that the increase in prevalence ofobesity may be independent of smokingstatus (Boyle et al., 1994; Wolk &Rassner, 1995).
Epidemiological methods based onself-reporting, used ta assess energyintake and energy expenditure, are not
(a) A fine balance: 600 kJ (140 kcal) excessintake is equivalent to:
only subject to bias but also have a highratio of within- to between-subject varia-tion. Even subtle disruptions in energybalance can explain weight gain overtime in individuals or populations (Figure3). ln populations, an increase of oneunit in BMI corresponds ta an increase ofabout 5% in the prevalence of obesity.Assuming height remains constant, anaverage weight increase of slightly lessth an 3 kg corresponds ta an increase inone unit of BMI. If this occurs over a ten-year period, the excess number of calo-ries ingested need only be of the order of87 000 kJ (21 000 kcal) over ten years(i.e. about 21 kJ (5 kcal) per day). ln thistheoretical calculation, we ignore theeffect of the increased energy expendi-ture that results from a weight increase(about 190-250 kJ (45-60 kcal) perday for a 3-kg weight increase). Never-
theless, an energy imbalance of about210 kJ (50 kcal) per day is easilyachieved. It is clear that such sm ailpersistent changes in energy balanceover several years are not detectable
(b) Energy expenditure of 600 kJ
~,,-.",,;;~,i :,_:?~~ilii .p.... . ,L . - . ;¡~Skò~11&'f~"" -..;¿ ,:~:. ,'.~~1~ -'? "'" ~
one croissantone piece ofchocolate cake
= 14 minutes
handful of peanuts
one bottle of beer = 21 minutes
Figure 3 A fine balance: examples of (a) intake and (b) expenditure of 600 kJ (140 kcal)
= 19 minutes
= 35 minutes
3

IARC Handbooks of Cancer Prevention, Volume 6: Weight Control and Physical Activity
by existing methods for measuring
energy expenditure and energy intake inpopulations (WHO Expert Committee,1995).
At the population level, some othercharacteristics are associated with theprevalence of obesity, which in individu-ais is the result of a long-term positive
energy balance. These include:
. Age: obesity increases at least up to
age 50 to 60 years in men and
women. Gender: women generally have a
higher prevalence of obesity com-
pared with men, especially above 50years of age
. Ethnicity: there are large, usually
unexplained, variations between
ethnic groups. Educational level and income: in
industrialized countries, prevalenceof obesity is higher in those with
lower education and/or income. Marital status: obesity tends to
increase after marriage. Parity: BMI may increase with
increasing number of children.Although this contribution seems tabe, on average, less than 2 kg per
pregnancy (Williamson et al., 1994),pregnancy-related weight gain maybe a significant contribution to weightgain for some women, especiallythose not lactating.
. Smoking: smoking lowers body
weight and cessation of smoking
leads to an increase. The associa-
tions between smoking and obesitymay, however, vary considerablybetween populations (Molarius et al.,1997).
. Alcohol consumption: the effect is
unclear in most populations
Obesity also has a strong familialcomponent. By combining evidence fromtwin studies, adoption studies, familystudies and other relevant data, it hasbeen calculated that the heritability ofoverweight is in the range 25-40%
4
(Bouchard, 1994) (Figure 4). Studies inanimal models of genetic obesity haverevealed important pathways of energyhomeostasis, e.g., the role of leptin(Friedman & Halaas, 1998), and genemutations have been identified thatare rare causes of human obesity. Forcommon human obesity, however,the evidence for genetic factors is stillfragmentary and incomplete (Chagnon etal., 2000). It is very likely that obesity is amultifactorial polygenic trait. Gene-envi-ronment and gene-ene interactions arelikely ta play an important role.
Timing of obesityAlthough it is clear that obesity can
develop at any age, there are several
critical periods when humans seem ta bemore liable to accumulate body fat(Dietz, 1994).
. Prenatal growth: there is evidence
that low birth weight is associated
Biological parents27
26
/1~i J/
V/
CI 25-i:aii-:g 24-o:i 23CD
22
21
with abdominal fatness in middle-age
(Dietz, 1994). Adiposity rebound period: when BMI
is plotted against age, there is first asharp reduction of SMI from birthuntil about six years of age. There isthen a levelling off followed by anincrease of SMI with age. Dietz
(1994) has proposed that an earlyadiposity rebound is predictive ofobesity in adults.
. Adolescence: physical activity inaffluent societies declines rapidly
with age in adolescents, the decline
being especially pronouncedbetween 15 and 18 years (Casper-sen et al., 2000).
. Young adulthood: a peri ad of rapid
weight gain is often observed inyoung adults aged 25-40 years.This is usually a period of great
behavioural change. People becomesettled, have children, buy a car andwork long hours to build a career.
Adoptive parents27
26
25 r~,L----1:-l ...".,." r ........ .."' ....r24
23
22
Il
21II iv IlAdoptee weight class
IV
- Father-- -- Mother
II
Figure 4 Genes versus environ ment: the BMI of adults who were adopted as children is clearlycorrelated with that of their biological parents but not that of the adoptive parents (1, thin; IL, medi-
an, III, overweight; iV, obese)
Adapted from Stunkard et al. (1986)
Such changes ail may reducephysical activity levels.
. Menopause: BMI tends ta level off inmen by the age of 50-60 years butcontinues ta increase in women.
Women tend ta continue ta gainweight after menopause and to accu-mulate more fat as abdominal fatcompared ta their premenopausal
period.
Measures of weight (critícal assess-ment of the various measures used)BMI, WHR and waist circumference(Figure 5) are the most cam mon mea-sures used to estimate overweight,
obesity and relative body composition inepidemiological studies. The only widelyaccepted criteria for obesity are based onBMI. New methods based on electricalresistance and impedance, magnetic res-onance imaging and computer-assistedtomography are also used, but are
expensive and seldom applicable in epi-demiological studies. This chapter there-fore concentrates on simple anthropo-
metric methods.The reproducibility and validity of
weight and height measurements are
high (Willett, 1998). ln general, bodyweight is among the most precise biolog-ical measurements, even under imper-fect conditions. However, in manyepidemiological studies, weight andheight are based on self-reports and it isknown that people tend ta underreporttheir weight and overreport their heightslightly (Figure 6). As a consequence,BMI based on self-reported data will bebiased downward. The degree of under-reporting is proportional ta the degree ofoverweight, age, and socioeconomic sta-tus (Niedhammer et al., 2000). Epidemio-logical measures of association, such asrelative risks, however, are not apprecia-bly affected by this degree of measure-ment error. ln contrast, comparisons
of obesity prevalence between popula-tions will be invalid if some data arebased on actually measured weight andheight while others are based on
self-reported values. For instance, astudy in Australia showed that 62% ofmen and 47% of women were c1assifiedas overweight or obese based on mea-sured height and weight compared with39% and 32%, respectively, based onself-reported height and weight (Flood etal., 2000). Even recalled weight frommany years earlier is highly valid,although the error is greater than for self-reported current weight. Correlations
between measured weight at 18-30years of age and recalled weight20-30 years later usually are about0.80 (Rhoads & Kagan, 1983; Stevens etal., 1990; Must et al., 1993; Troy et al.,1995).
The validity of BMI as a measure ofobesity is generally high. ln studies
where the reference method has beenunderwater weighing, the correlationbetween BMI and densitometry-esti-mated body fat has generally been
0.60-0.70 in adults (see Willett, 1998).Although BMI is primarily thought of asan estimate of percentage body fat, it ismore correctly a measure of absolute fatmass adjusted for height. Thus, consid-erably higher correlations (0.82-0.91)between BMI and absolute fat massadjusted for height have been found(Spiegelman et al., 1992).
Even though BMI is an excellent mea-sure of adiposity in young and middle-aged adults, it is less useful in olderadults. Many elderly people lose leanbody mass, so that for the same BMI, thepercentage of fat mass increases
(Gallagher et al., 1996). Thus other
measures of adiposity may be moreappropriate for the elderly (Willett, 1998).For example, changes in abdominal cir-cumference reflect adipose rather thanmuscle tissue and may thus be a betterindicator of ove rail adiposity than weightalone or BMI.
There are also differences between
populations in body build. For example,the relationship between percentage
body fat and BMI is different betweenSingaporeans and Caucasians and also
Characteristi?s of weig~~~.?ntro~~~Jiysical ac~~il
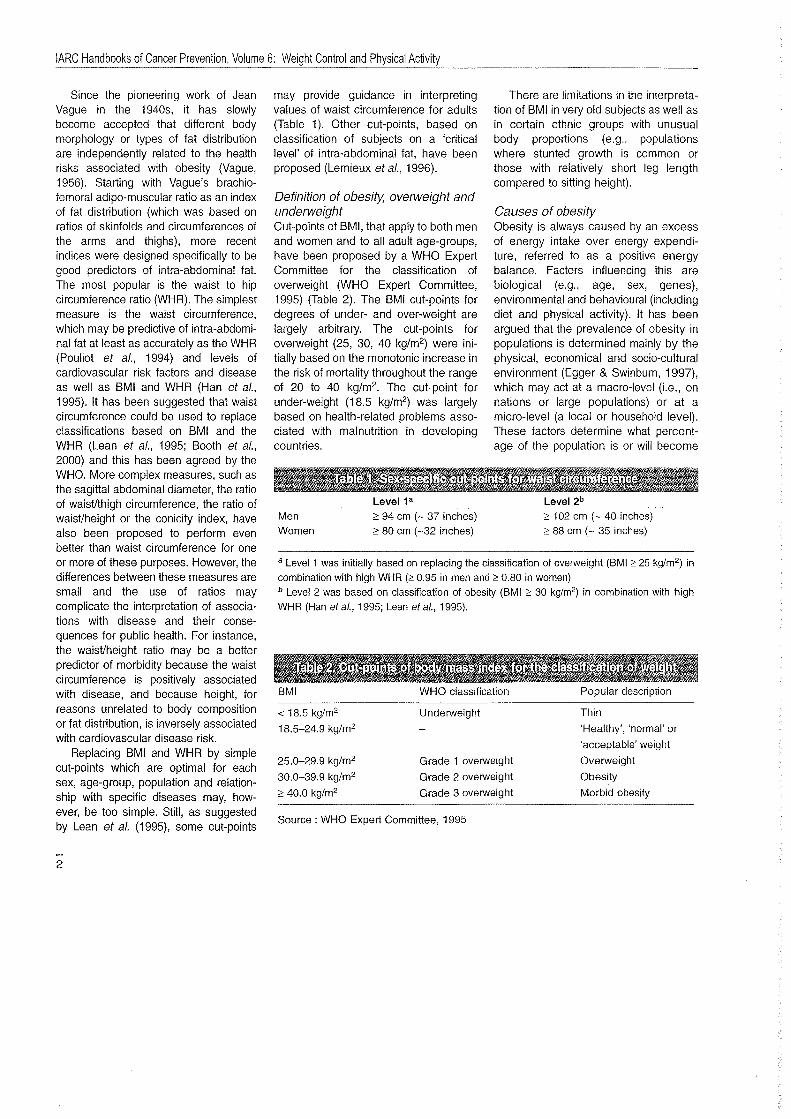
Figure 5 Waist circumference measurement.Ta measure waist circumference, locate theupper hip bone and the top of the right iliaccrest. Place a measuring tape in a horizontalplane around the abdomen at the level of theiliac crest. Before reading the tape measure,ensure that the tape is snug, but does not com-
press the skin, and is parellel to the floor. Themeasurement is made at the end of a normalexpiration.
Figure 6 Studies have demonstrated that
obese people have a tendency to underreport
their weight
5

IARC Handbooks of Cancer Prevention, Volume 6: Weight Control and Physical Activity
between the Chinese, Malaysians and
Indians in Singapore (Deurenberg- Yap
et al., 2000). For the same amount ofbody fat as for Caucasians who haveBMI 30 kg/m2 or over, the cut-points forobesity would have to be about 27 forChinese and Malays and 26 for Indians.ln contrast, Polynesians living in NewZealand (Maoris and Samoans) have asignificantly higher ratio of lean bodymass ta fat mass compared with
Europeans (Swinburn et al., 1999).Thus, at higher BMI levels, Polynesians
are significantly leaner than Europeans,suggesting the need for ethnic-specificBMI definitions of overweight andobesity.
With the increasing evidence on thehealth risks associated with a predomi-nance of abdominal (visceral) fat, numer-ous anthropometric indicators of abdom-inal obesity have been proposed
(Molarius & Seidell, 1998). Of theseindicators, waist circumference andWHR are widely used in epidemiologicalstudies as weil as in screening persansat risk of chronic diseases.
The WHR is difficult ta measure in astrictly standardized way and alsodifficult to interpret biologically. The waistcircumference predominantly measuresvisceral organs and abdominal (bathsubcutaneous and intra-abdominal) fat.The hip circumference may reflectvarious aspects of body composition,
such as muscle mass, fat mass and
skeletal frame. When these Iwo circum-ferences are combined in a ratio, it isdifficult ta interpret differences betweenor within individuals (Molarius & Seidell,1998). ln addition, a reduction in weightusually results in a reduction in
both waist and hip circumference, so willnot necessarily result in a change inWHR.
Waist circumference is strongly corre-lated with visceral fat areas and caneasily be measured and interpreted. Thismakes it a suitable candidate for anindicator of abdominal obesity. It is alsoweil correlated with ove rail fatness.
6
Waist circumference is stronglycorrelated with BMI and adding waistmeasurements to age and BMI does notmuch improve the explanation of thevariance in visceral fat, especially inwomen (Seide ii et al., 1988). Waist
circumference is also strongly correlatedwith abdominal subcutaneous fat, totalabdominal fat and total body fat (Lean etal., 1996).
Cut-points have been suggested forboth waist circumference and WHR(Molarius & Seidell, 1998), based onresults obtained in Caucasian popula-tions. A detailed analysis of 19
populations in the WHO MONICA studyshowed that the optimal screening cut-points for waist circumference may bepopulation-specifie (Molarius et al.,1999). At waist action level 2 (waist cir-cumference 102 cm or more in men and88 cm or more in women, respectively;BMI 30 kg/m2 or more), sensitivity variedfrom 22% ta 64% in men and from 26%ta 67% in women, whereas specificitywas :095% in ail populations. Sensitivitywas in general lowest in populations inwhich overweight was relatively uncom-mon and highest in populations with arelatively high prevalence of overweight.
Even though criteria for waist circum-ference and WHR to be used in thepublic health settng are difficult to deter-mine, these measurements should beapplied in epidemiological studies, as theuse of different measures of adiposity
may give further insight into the etiologyof disease.
Physical activityDefinition of physical actívityPhysical activity is defined as bodily
movement that is produced by the con-traction of skeletal muscle and that sub-stantially increases energy expenditure
(US Department of Health and HumanServices, 1996) (Figure 7). It has threemain components:. Occupational work
. Household, garden and otherdomestic activities
. Leisure-time physical activity(including exercise and sport)
By the terms physical inactivity orsedentary behaviour, we mean "a statein which body movement is minimal andenergy expenditure approximates theresting metabolic rate".
Measurement of physical activityTa determine the relationship betweenphysical activity and cancer, it is neces-sary to obtain valid and reproducible
measurements of exposure and out-come variables. This can be difficult,since physical activity is a very complexbehaviour that can be measured in manyways. Further, methods for measuringhuman energy expenditure are eitherprecise but very restrictive - andthus limited ta use over a short period oftime - or are less restrictive and usableover longer periods but of lower
precision.Available methods to estimate physi-
cal activity and total energy expenditureinclude:. Calorimetry (direct and indirect)
. Physiological markers (e.g., using
doubly labelled water). Mechanical and electronic monitors
(e.g., of heart rate, pedometers). Behavioural observation
..~(1..:::!"5i 500.)((1;:CI..(1c:W
Thermie effect of food
Resting metabolic rate(RMR)
Figure 7 Components of daily energy expenditure
Adapted from: US DHHS, 1996

. Job classification
. Surveys (indirect calorimetric diaries,recall questionnaires, quantitative
histories, and lifetime individual
histories)
The operational definition of physicalactivity will vary not only according ta themeasurement method used, but alsoaccording to the type of research beingdone.
The biological and physiologicalapproaches ta assessment of physicalactivity, i.e., calorimetry, physiological
and mechanical monitors, are not applic-able in large population studies, but
provide objective data for validating pop-ulation surveys. The method using dou-bly labelled water has potential to bridgethe gap. This involves measuring integralproduction of carbon dioxide for up tathree weeks by the difference in elimina-tion rates of the stable isotopes deu-
terium and oxygen-18 from doubly
labelled water after ingestion of a quantityof water enriched with both isotopes. Atpresent, however, such labelled water isexpensive and not widely available.
The most convenient and commonlyused measures of physical activity incancer epidemiology have been jobclassification and surveys. Question-naires and interviews used in such
surveys are usually unrestricted butImprecise. Because of the low costsinvolved, they remain the mostfrequently used methods for assessmentof physical activity, especially in epidemi-ological studies. The validity andtest-retest reproducibility of question-
naires and/or interviews concerning
physical activity have not been exten-sively studied. ln general, strenuous
physical activity appears ta be recalledwith greater accuracy th an light ormoderate-intensity activity, whether therecall is for recent periods or earlier peri-ods of time (Slattery & Jacobs, 1995). Itis useful to include bath weekdays andweekend days and to include seasonalvariation in the assessmenL.
A number of factors need to be takeninto account in choosing methods forassessing physical activity:. Accuracy (reliability and validity). Time frame
. Nature and details of the physicalactivity. Physical activity is commonlyconsidered to have three dimen-
sions: duration, frequency and inten-sity (or "strenuousness").
. The performance of an activity orgroup of activities such as in a jobactivity questionnaire.
. Mode of data collection (personalinterview, telephone interview, self-administered questionnaire or mail
survey). Summary estimate of physical activity
for an individual (or a group), i.e., asummary estimate or score that canbe used for ranking individualsaccording to level of physical activity)
Intensity of physical activityMany terms have been used tocharacterize the intensity of physical
activity such as light, moderate, hardor very hard. These terms can berelated ta the absolute amount of
energy expenditure or oxygen con-
sumption associated with specifictypes of physical activity. An exampleis the amount of oxygen consumed inwalking at 5 km/h, which may beexpressed in multiples of resting oxy-gen consumption. One metabolicequivalent (MET) is set at 3.5 mL ofoxygen consumed per kilogram bodymass per minute - an amount associ-ated with sitting in a rested state.Walking at 5 km/h requires about 3METs or 630 mL of oxygen consumedper minute by a 60-kg persan. it shouldbe noted that the amount of oxygen
consumed by a young or old 60-kgperson while walking at 5 km/h willhave the same absolute level, but thisconstitutes a greater relative demandfor the older person because maximaloxygen consumption declines withage.
Characteristics of weight control and physical activity
Another way of characterizing inten-sity of activity is to describe the effect ofparticipating in a specific type of activityrelative ta an individual's maximal
oxygen consumption. This approach hasbeen valuable in prescribing safe levelsof exercise for cardiac patients and forotherwise healthy adults in whom
exercise may produce untoward conse-quences (American College of sportsMedicine, 1990). Because oxygen con-sumption and heart rate during physicalexercise are highly correlated, the per-centage of maximal heart rate has oftenbeen used to reflect the relative effect onmaximal oxygen consumption (American
College of Sports Medicine, 1990).
Finally, on a subjective level, a persanmay rate the intensity of an activityhim/herself. For example, a person maybe asked ta report the frequency and
duration of participation in vigorous
activity that results in increased breath-ing or heart rate. As noted above, thiswould c10sely parallel the relativedemands on a person.
Summary scores in physicalactivity measuresPhysical activity can be described in avariety of ways, as evidenced by themany different summary scores used invarious countries for large representativesurveys or as part of epidemiological
studies, notably in relation to monitoringcardiovascular disease risk. One way ofcharacterizing physical activity is estima-tion of energy expenditure, expressed
either as total energy expenditure (kilo-joules, kJ) per day or week, or relative taan individual's body mass (kJ/kg/day). lnaddition, specific patterns of frequencyand duration of physical activity can beestablished ta c1arify the particularcategories and specific amounts ofbehaviours being reported. Some
combinations of parameters have beenused to reflect energy expenditure (e.g.,regular moderate physical activity suchas walking five times per week for 30minutes). Another pattern reflects the
7

IARC Handbooks of Cancer Prevention, Volume 6: Weight Control and Physical Activity
L
Figure 8 Examples of leisure-time physical activity (cross-country skiers and canoeists)
~..activity needed ta improve or maintainaerobic capacity (e.g., vigorous activityperformed three times per week andlasting for 20 minutes) - the traditionalexercise prescription for cardiovascular
disease prevention (Caspersen et al.,1994). Other summary scores have beencreated by combining data on the
frequency, duration and intensity of ail oreven specific types of physical activity.Such scores have often been inferred tareflect energy expenditure.
Critical assessment of thevarious measures usedMeasures of cardiorespiratory fitnesshave been considered as a surrogate ofphysical activity and have beenemployed in some prospective studies ofcancer mortality (Oliveria et al., 1996).However, because genetic aspectsdictate both cardiorespiratory fitness
level and its response to physical activity,and because fitness measures areinfluenced by age, gender and otherhealth habits, cardiorespiratory fitness
level is inadequate as a measure ofphysical activity (Ainsworth et al., 1994).
8
These measures have rarely been usedin epidemiological studies of cancer, andare not considered further.
Job classificationBecause employed adults spend manyhours at work and have the opportunityfor considerable expenditure of energy,
occupation al titles and relatedapproaches have been used to definelevels of physical activity in cancer stud-ies. ln a study of breast cancer, Calle etal. (1998a) asked about the current andlongest-held job over a woman's lifetimeand identified and compared separaterisks for 13 occupational groups, usinghousewife as a reference group. Anotherstudy used occupational titles tocompare cancer risks for four occupa-tional groupings as part of three indus-
tries, using farmworkers/agriculture asthe referent group (Hsing et al., 1998a).Some studies have gone beyond usingtitles alone to further delineate tasks, byusing resources such as the USDepartment of Labor's Oictíonary ofOccupational Tit/es (1993), which usesthe intensity and duration of lifting,
pushing and pulling, the body's positionduring exertion, as weil as the estimatedrate of energy expenditure for work
tasks, to create sedentary, light, mediumand heavy groupings (Coogan et al.,1997; Coogan & Aschengrau, 1999).Others have used similar approaches tocreate three (Fredriksson et al., 1989) orfive occupational activity groupings
(Moradi et al., 1998; Bergström et al.,1999), while Dosemeci et al. (1993)created two separate indices, one forjob-related energy expenditure (~ 8,8-12, :;12 kJ/min) and one for sittingtime (~ 2, 2-6, :; 6 h/day), to comparecancer risks in their population. Whileoccupational tii es and related classifica-tions can be valuable, they are unreliableif misclassification is known to exist, or inpopulations where work-related energyexpenditure is less prevalent. ln suchinstances, other types of physical activitymust be assessed and in some casescombined with occupational measures toyield measures of exposure.
QuestionnairesRecall questionnaires for occupation,
leisure, household or other activitygenerally require less respondent effortand are less likely to affect the respon-dents physical activity. Because recallquestionnaires have time frames of oneweek (Sallis et al., 1985) to one year(Taylor et al., 1978) or even a lifetime(Friedenreich et al., 1998), the respon-dent may have to expend considerableeffort in remembering details of pastparticipation in physical activity. Recallquestionnaires can be either self- orinterviewer-administered, the latter
entailing more interviewer training,quality control and study costs. Recallquestionnaires may ask for precisedetails on physical activity or may solicitgeneral reports of usual participation inphysical activity over a given time frame;they can generally be characterized asglobal, single-item and comprehensivequestionnaires.
Characteristics of weight control and physical activity
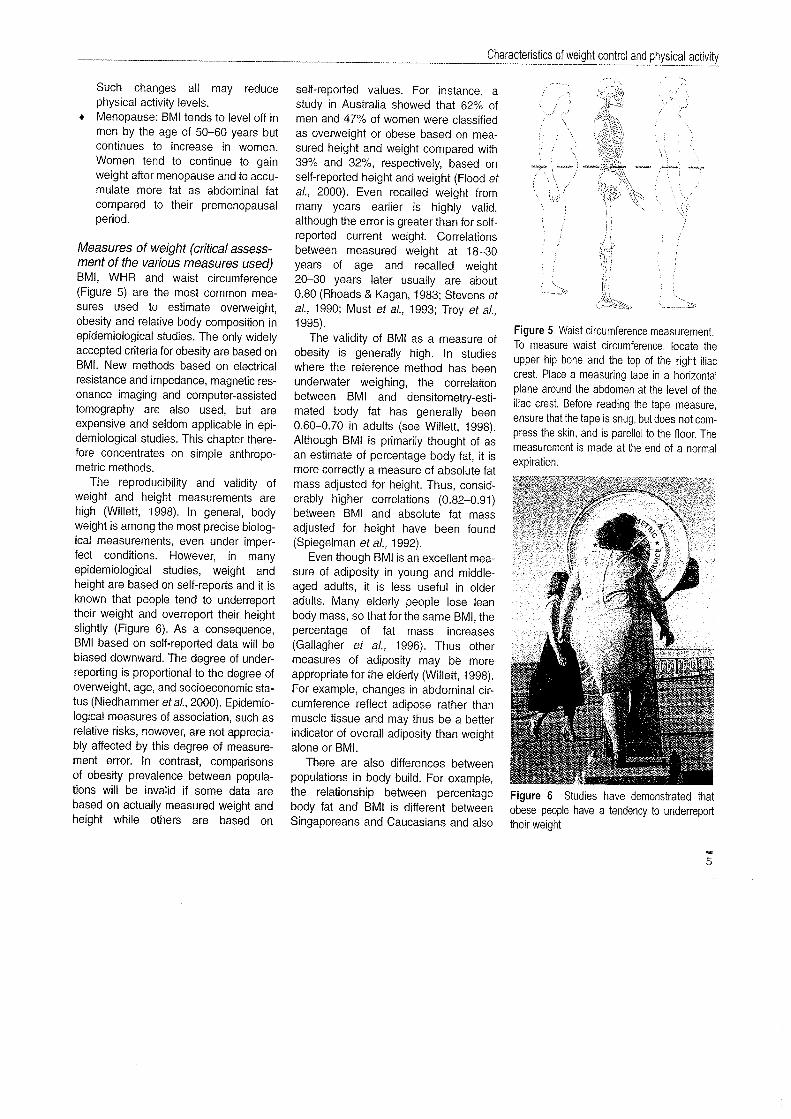
Figure 9 Rice planting in the Philippines
Global questionnaires require compari-
son of one's physical activity with that ofother people in general. The global self-report is very easy ta use and has atleast some evidence of validity (Sternfeldet al., 2000). Seve rai cancer studies
have used global questionnaires
(Andersson et al., 1995; Kotake et al.,1995; Neugut et al., 1996; Marcus et al.,1999; Verloop et al., 2000). However, ithas been questioned what precisephysical activity profiles form the basis ofcomparison when groups differing inage, gender, or racial/ethnie status reportthe same self-assessment rating(Sternfeld et al., 2000).
Single-item questionnaires allow rapid
assessment of general patterns of phys-ical activity. For example, among Iowawomen aged 55-69 years, physicalactivity was measured as the weeklyfrequency of moderate-intensity and
vigorous activity and responses to thetwo questions were used ta group
women into low-, moderate- and high-activity categories (Mink et al., 1996;
Moore et al., 2000a), though the repeata-bility and validity of these two items haveyet ta be reported. ln prospective studiesof physicians in the United States, inves-tigators assessed the frequency of vigor-ous physical activity likely to promotesweating (Lee et al., 1997a; Liu et al.,2000). Correlations between answers tathe sweat question and oxygen uptake
were reported to be 0.54 for males, 0.26for females and 0.46 for the total group(Siconolfi et al., 1985).
The Godin questionnaire assessesthe frequency per week of exercise last-ing at least 15 minutes or more for threecategories of effort: strenuous (heart
beating rapidly), moderate (not exhaust-ing) and mild (minimal effort) (Godin &Shephard, 1985). For each category,examples of activities that produce thelevel of effort are proposed, while anadditional question asks "how often doyou engage in any regular activity longenough to work up a sweat?".Coefficients for 2-4-week repeatabilityhave ranged from 0.24-0.48 for lighteffort ta 0.84-0.94 for strenuous effort
and 0.69-0.80 for the sweat question
(Godin & Shephard, 1985; Jacobs et al.,1993). Correlations of 0.54-0.61 with
other physical activity surveys (Miller etal., 1994), with indices of maximal
cardiorespiratory fitness (0.52-0.57) andwith body fat (-0.43) (Jacobs et al.,1993) constitute indices of validity for thisapproach. Friedenreich and Rohan(1995) modified the Godin questionnaireto assess total time per week at eachlevel of effort and multiplied each by5-, 7.5-, and 10 kcal/min ta create a sum-mary score in kcal/week. Thune et al.(1997) and Gram et al. (1999) used onequestion for work and one for leisure,each graded from 1 ta 4, as part of theSecond and Third Tromsö Studies(Thune et al., 1998). These twoquestions demonstrated some aspectsof validity (Wilhelmsen et al., 1976;
Holme et al., 1981; Løchen &Rasmussen, 1992). Many other single-item questionnaires have been used incancer studies (Garfinkel & Stellman,
1988; Gerhardsson de Verdier et al.,1990a; Hirose et al., 1995; Fraser &Shavlik, 1997; Hartman et al., 1998;
John et al., 1999; Terry et al., 1999;
Stessman et al., 2000), but neither theirrepeatability nor validity have beenreported.
Comprehensive questionnaires. lnstudies of college alumni, Lee et al.(1999a) used a recall questionnaire taassess the distance and pace of walking,flights of stairs c1imbed, and frequencyand duration of sports or recreational
activities typically performed during thepast year, in order to create a kilocaloriesummary score. For this questionnaire,the short-term repeatability (four weeks)for the total score was 0.76 (Washburnet al., 1991), while Rauh et al. (1992)found two-week repeatability to begreater for flights climbed (0.68) andsports participation (0.67) than for blockswalked (0.23), again revealingbetter recall of participation in moreintense activity. Long-term repeatability
9
IARC Handbooks of Cancer Prevention, Volume 6: Weight Control and Physical Activity
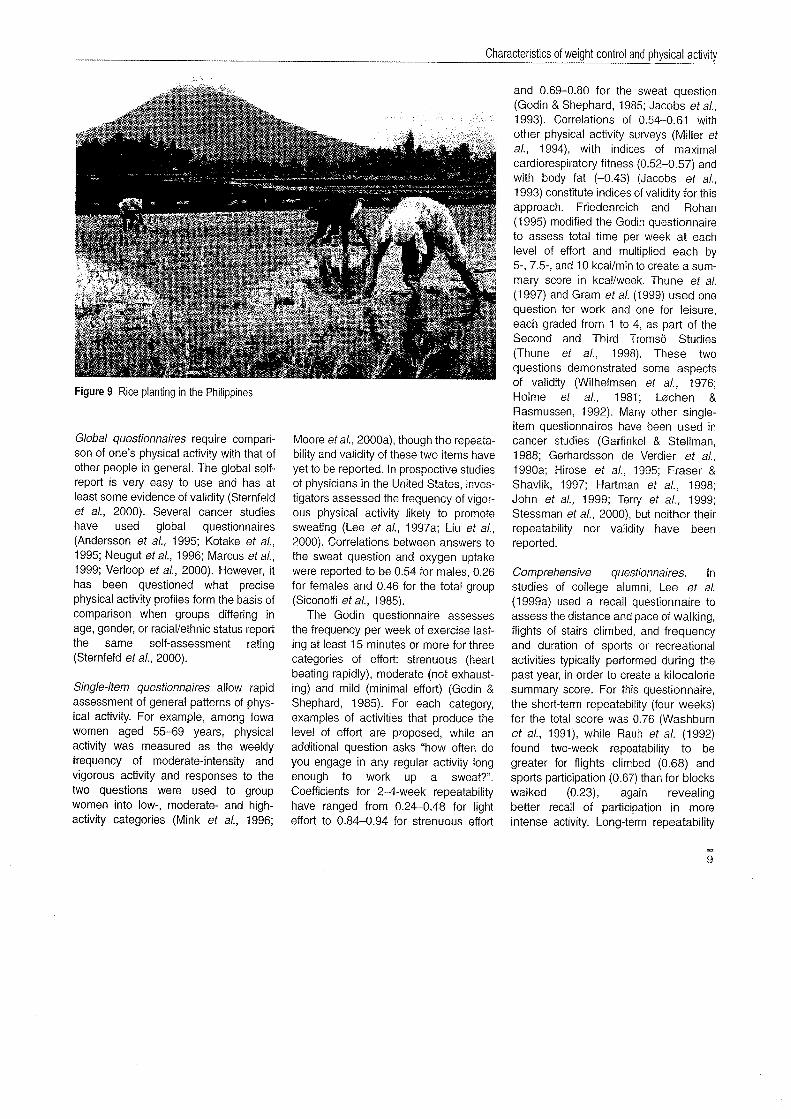
Figure 10 Workers in a park in Hanoi, Vietnam
(9-12 months) was between 0.50 and0.73, with coefficients ranging between0.39 and 0.42 for flights climbed,between 0.30 and 0.54 for blocks walkedand 0.63 for sports (LaPorte et al., 1983;Jacobs et al., 1993). As indices of valid-ity, the College Alumni questionnaire hasshawn favourable correlations (;; 0.50)with other instruments (Albanes et al.,1990) and reasonable correlations with afour-week activity history (0.31), indicesof cardiorespiratory capacity (0.52) andbody fat (-0.30) and motion sensor
counts (0.30) (Jacobs et al., 1993).As part of the Framingham Study,
Dorgan et al. (1994) used an interviewer-administered recall questionnaire toassess hours spent per day in sleep,work and extracurricular activities in atypical day, and then multiplied the timeestimates by weighting factors of 1.1,1 .5, 3.4 and 5.0, corresponding ta
increasing levels of oxygen uptake.
Modest repeatability coefficients of0.30-0.59 between reports two ta threeyears apart have been found for thisinstrument (Garcia-Palmieri et al., 1982),while validity has been assessed bycorrelations with other physical activityquestionnaires (0.48-0.72) and with total
10
energy intake (0.43) (Albanes et al.,1990).
Le Marchand et al. (1997) used theStanford seven-day physical activityrecall questionnaire (Sallis et al., 1985)to assess usual work and leisureaveraged over a three-year period. TheStanford recall questionnaire asks sub-jects ta report time spent in sleep,
moderate, hard and very hard activitiesfor each of the past five weekdays andtwo weekend days, differentiatingbetween work and leisure. Repeatabilitycoefficients for the total report haveranged from 0.34 (Jacobs et al., 1993) to0.86 (Gross et al., 1990), while subtotalsfor very hard activity and sleep havecorrelations as high as 0.86 and 0.76,respectively (Rauh et al., 1992). However,moderate-intensity activity had correla-tions of 0.08-0.12 (Sallis et al., 1985;Jacobs et al., 1993) ta 0.52 (Rauh et al.,1992). Validity coefficients for weekendand weekday physical activity logs wereas high as 0.70 and 0.75 for moderate-intensity activity and 0.66 and 0.39 forhard and very hard activity, respectively
(Taylor et al., 1984). Validity correlationswere low (having an absolute value of0.36 or less) between the survey score
and a four-week activity history, indices ofcardiorespiratory capacity and body fat,and motion sensor counts (Jacobs et al.,1993).
Sandler et al. (1995) used atelephone-administered version of the
Baecke questionnaire (Baecke et al.,1982). This particular physical activityrecall questionnaire consists of sectionsfor work activity, sports activity andnon-sports leisure activity. Each sectionhas questions scored on a five-pointLikert scale ranging from "never" ta"always" or "very often", except that forreports of the two most frequently playedsports, the number of months peryear and hours per week of participationare solicited. The repeatability, in termsof correlation coefficients, has beenbetween 0.70 and 0.90 for the threesections, regardless of the study popu-lation of men and women, and whetherfor short (1-5 months) (Baecke et al.,1982; Jacobs et al., 1993) or longer timeperiods (11 months) (Pois et al., 1995).Validity for the Baecke questionnairehas been demonstrated by favourablecorrelations with data from other physicalactivity questionnaires (0.56-0.78)
(Albanes et al., 1990; Miller et al., 1994)and physical activity diaries (0.33-0.66)
(Pois et al., 1995; Richardson et al.,1995). Richardson et al. (1995) reportedcorrelations of 0.46 and 0.57 comparingthe survey results with cardiorespiratoryfitness, and of -0.51 and -0.30with indices of body fat for women andmen, respectively.
The CARDIA (Coronary Arery RiskDevelopment in Young Adult Study)questionnaire (Jacobs et al., 1989)
consists of a set of 13 activity categories
(eight for strenuous and five fornon-strenuous activities). For each set,the respondent provided the totalnumber of months of participation, withfurther probing for the number of monthsin which activities were performed for atleast one hour, and additionally foractivities performed for at least twohours, during any of the preceding

Characteristics of weight control and physical activity
12 months. Slattery and Jacobs (1995)found, for a subsample of 81 CARDIAparticipants, that recalled activity two tothree years earlier was highly associatedwith activity reported during theexamination of the corresponding time.Spearman correlations were 0.84 for vig-orous, 0.64 for moderate, and 0.81 fortotal activity. Distantly recalled activitywas less weil associated with contem-porary activity reports, with correlationsbeing 0.57, 0.45 and 0.59, respectively,suggesting that activity was not com-pletely stable over time. As an index ofvalidity, Slattery and Jacobs (1995)found that distantly recalled activity wassignificantly correlated with resting pulserate as measured during the examinationat the corresponding time (-0.21). TheCARDIA questionnaire has been used inseveral cancer studies (Slattery et al.,1997a, 1999).
Comprehensive questionnaires havebeen used in large prospective studies ofhealth professionals. Men participating inthe Health Professionals Follow-up
Study recalled the average time perweek spent over the past year in sixvigorous Uogging, running, bicycling,swimming, tennis/squash/racket-ball,calisthenics/rowing) and two non-vi garous activities (walking/hiking, flightsof stairs c1imbed) (Giovannucci et al.,1995, 1998). Time spent in each activitywas multiplied by a specific intensitycode (Ainsworth et al., 1993) to derive anestimate of energy expenditure in
physical activity (MET-hours/week).
Two-year repeatability coefficients were0.52 for vigorous, 0.42 for non-vigorousand 0.39 for lack of activity, while, as anindex of validity, correlations with datafrom four one-week seasonal diarieswere 0.58, 0.28 and 0.41, respectively
(Chasan-Taber et al., 1996). The closecorrespondence between the averagesand distributions for the four diaries andthe recall suggested that respondents
had effectively incorporated seasonalinformation over the preceding year
ta create the average weekly estimate as
part of their recall. ln the Nurses' HealthStudy (in even years, beginning in 1986)and the Nurses' Health Study il(in 1989), women completed a physicalactivity questionnaire similar to thatused by men in the Health ProfessionalsFollow-up Study (Giovannucci et al.,1996; Martinez et al., 1997; Rockhill etal., 1998, 1999). The two-year repeata-bility of the Nurses' Health Study IL ques-tionnaire was 0.59 for activity and 0.52for inactivity, while validity coefficients,
as assessed with the four one-week
seasonal diaries, were 0.56 and 0.41,respectively (Wolf et al., 1994).
The European Prospective Investi-gation into Cancer and Nutrition (EPIC)included physical activity recall amongother lifestyle assessments in its corequestionnaire (Riboli & Kaaks, 1997).Subjects were asked to describe theirparticipation in various types of activity:work (sedentary, standing, manual,
heavy manual); walking, cycling,gardening, do-it-yourself activity,exercise, and housework (hours/week);stairs climbed (flights/day). Five-monthand 11-month repeatability coefficientsfor energy expenditure were 0.86 and0.75 for men and 0.63 and 0.68 forwomen, respectively (Pois et al., 1997).The correlation between energy
expenditure estimated from the ques-
tionnaire with that from four three-dayseasonal diaries was 0.43 for men and0.51 for women.
HistoriesQuantitative history The retrospectivequantitative history is the most thoroughphysical activity enquiry because itrequires detailed recall of physical
activity for time frames of up to one yearor longer. The immense detail associ-ated with the quantitative history implies
a very large memory burden for therespondent and has high costs foradministration, interviewer training,quality control and data-processing
(Caspersen, 1989). Quantitative historyquestionnaires that cover at least one
year can assess seasonal physicalactivity. For example, McTiernan et al.(1996) asked respondents to reportmonths, average frequency, and durationof participation for individual activities,identified from Iisted activity groupings,over the preceding two years, modelling
their questionnaire on the Minnesota
Leisure-Time Physical Activity Ques-tionnaire (MLTPAQ) (Taylor et al., 1978).The time reported for each activity in theMLTPAQ was multiplied by an activitymetabolic index (AMI, work metabolic
rate divided by basal metabolic rate) tocreate a summary score approximatingenergy expenditure per week. The
summary score has been furtherreported according to total, light (AMI 0(4), moderate (AMI 4-6), and heavy (AMI)- 6) activity following a convention thatapplies almost solely ta men aged 35-57years participating in that study. Theshort-term repeatability (about four
weeks) for total, light, moderate andheavy activity was 0.92, 0.73, 0.80 and0.95, respectively, while values for long-
term (one year) repeatability were 0.69,0.60, 0.32, and 071, respectively
(Richardson et al., 1994). As a reflectionof validity, the MLTPAQ has comparedfavourably with other physical activityquestionnaires, showing correlations ofgreater th an 0.47 (Albanes et al., 1990).ln addition, the MLTPAQ has shown rea-sonable correlations with a physical
activity record (0.47), an index ofaerobic capacity (0.47) and body fatmeasurements (-0.24) (Richardson etal., 1994).
Lífetime history To overcome part of theproblem of memory burden, one lifetimephysical activity questionnaire
(Friedenreich et al., 1998) used cognitiveinterviewing techniques for women aged34-65 years, noting a high test-retestrepeatability (Pearson correlation ~ 0.72)for a 6-8-week repeat questionnaire foroccupational, household, exercise/sportsand total activities for women.
Repeatability was generally highest for
11

IARC Handbooks of Cancer Prevention, Volume 6: Weight Control and Physical Actìvity
- 40..CI
ëii::.. 30 'CI;:0-0CI0i:CI
¡¡;:CI..0.
0-:1
15.8
34.9
24.5
19.5 21.3
2-5
TV viewing (h/week)Figure 11 Relationship between overweight and TV viewing
Data from Ching et al. (1996)
occupational activity, for high-intensityactivities, and for each type of activityreported for time periods earlier than forthe year preceding the interview. On theother hand, repeatability of lifetimephysical activity recall may vary bygender. A comparison of recalledphysical activity with data from essen-tially the same questionnaire adminis-tered 30-35 years earlier found intra-c1ass correlations of 0.43 for light and0.45 for moderate weekday (occupa-
tional) activity for bath men and women,and 0.38 for hard free-day (Ieisure)activity for women only (men had a cor-relation of 0.26) (Falkner et al., 1999). lnaddition, while under-estimation occurredfor both men and women who reportedtime spent in past weekday activities;only men over-estimated hard free-dayactivity. Otherwise, estimated time didnot vary by gender when examined byintensity level of activity. Cognitive inter-viewing techniques hold promise for life-time quantitative questionnaires in termsof bath the quantity and precision of
responses, compared with traditionalstandardized interviews, but they entail
12
additional costs for interviewer training,time spent in conducting interviews anddifficulties in coding the responses.While they may be an excellent way toassess activity in a specific population,their specificity may limit the possibility ofcomparing different populations or use inother settings (Fisher et al., 2000).
Concluding commentsPhysical activity takes many forms,which explains, in part, why it is difficultto measure and why it has beenmeasured in so many ways as part ofexperimental, intervention and epidemi-ology research. While some measuressuch as calorimetry and use of daublylabelled water are precise, they tend torestrict the physical activity behaviourbeing measured. On the other hand, jobclassification and recall measures(global, general, comprehensive andquantitative histories) are less precisebut do not restrict physical activity mea-surement and are most often used forepidemiology and survey research.
One area of particular interest issedentary behaviour as a distinct entity.
Sedentary behaviour needs ta be seenas different from simple non-participationin physical activity. There is evidencethat time spent in sedentary behaviaur(particularly television viewing) is signifi-cantly associated with being overweight,even among people who are quitephysically active in their leisure time
(Figure 11) (Salmon et al., 2000), butdata on the health impact of such behav-iour, its prevalence in populations andtrends over time are sparse (Jebb &
Moore, 1999; Pratt et al., 1999; Owen etal., 2000).
Many questionnaires that have beenused in cancer epidemiology have beentested for reliability and validity. lngeneral, strenuous physical activityappears to be recalled with greateraccuracy than either light or moderate-intensity activity, while recent activitiesare recalled more accurately th an thaseperformed at earlier times. However, somany different samples of persansvarying in age, gender and other impor-tant sociodemographic characteristicshave been studied, so many differentvalidation measures have been applied,and so many different correlatianalstatistics have been used ta assesstheir quality that it is not possible todetermine what type of questionnaire isbest or even qualitatively belter th ananother.
A programme of new research toestablish a broader set of reliable andvalid measures is gaining momentum(Macera & Pratt, 2000). The use ofobjective tools such as accelerometers(motion sensors), heart rate monitors
and direct observation of physical
activities is also being explored (Salls &Saelens, 2000). These assessment
procedures may help to validate the self-report measures that are used becauseof the practical and financial constraintsinherent in carrying out large-scale
population surveys.