APPLY SOCIAL-NETWORK-SERVICE (SNS) FOR SOLVING PROBLEMS OF IMPLEMENTING A KMS IN VIETNAMESE SME
Upload
edward-mclaughlinCategory
view
215download
0
Characteristics of the Vietnamese Business Environment:
Evidence from the 2007 Small and Medium Enterprise (SME) Survey
Key Results, Policy Implications and Next Steps
Finn TarpSimon McCoy Hanoi, 15th January 2009

Key Results
2

1. Enterprise Dynamics2. Bureaucracy, Informality, Tax Evasion
and Bribes3. Employment, Education and Social
Insurance4. Production and Technology5. Investment and Access to Finance6. Environment
3
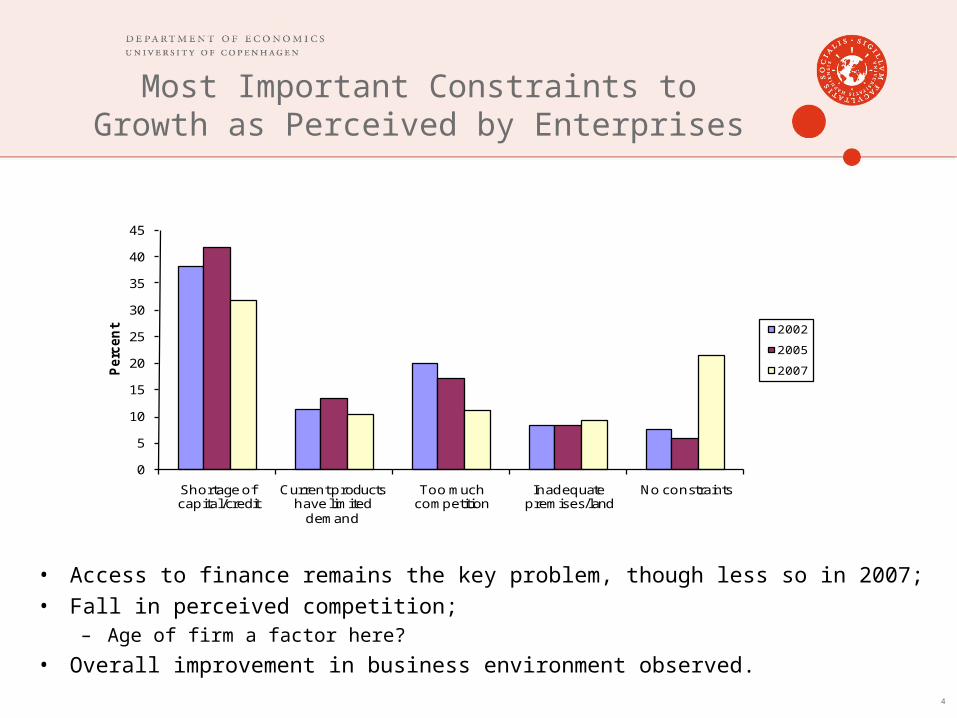
Most Important Constraints to Growth as Perceived by Enterprises
• Access to finance remains the key problem, though less so in 2007;• Fall in perceived competition;
– Age of firm a factor here?
• Overall improvement in business environment observed.
0
5
10
15
20
25
30
35
40
45
Shortage of capital/credit
Current products have limited
demand
Too much competition
Inadequate premises/land
No constraints
Percent 2002
2005
2007
4
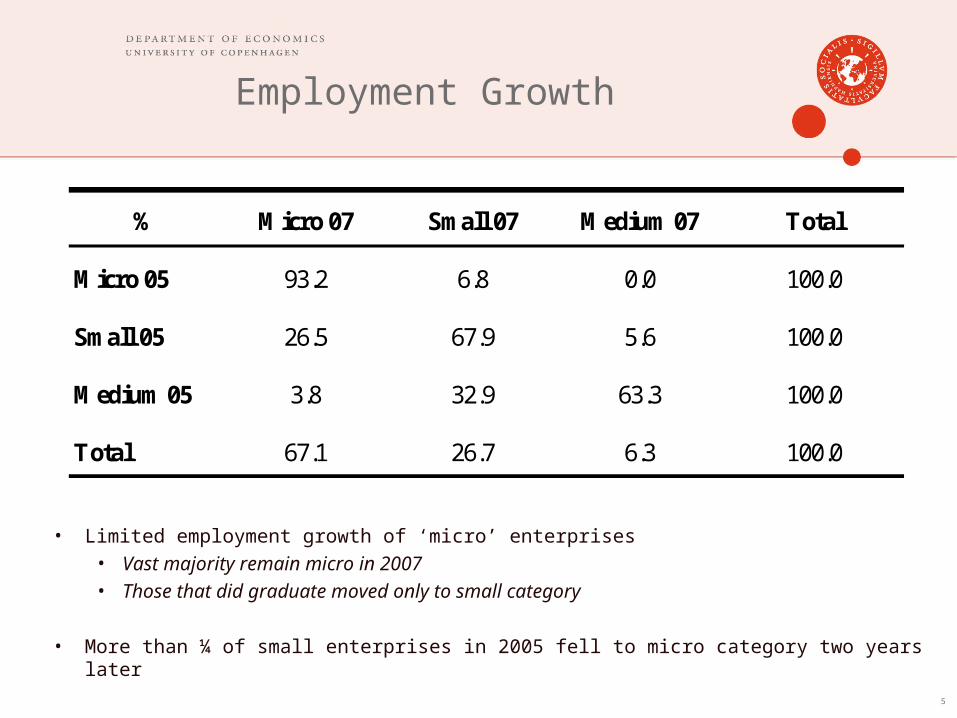
Employment Growth
• Limited employment growth of ‘micro’ enterprises• Vast majority remain micro in 2007• Those that did graduate moved only to small category
• More than ¼ of small enterprises in 2005 fell to micro category two years later
5
% Micro 07 Small 07 Medium 07 Total
Micro 05 93.2 6.8 0.0 100.0
Small 05 26.5 67.9 5.6 100.0
Medium 05 3.8 32.9 63.3 100.0
Total 67.1 26.7 6.3 100.0
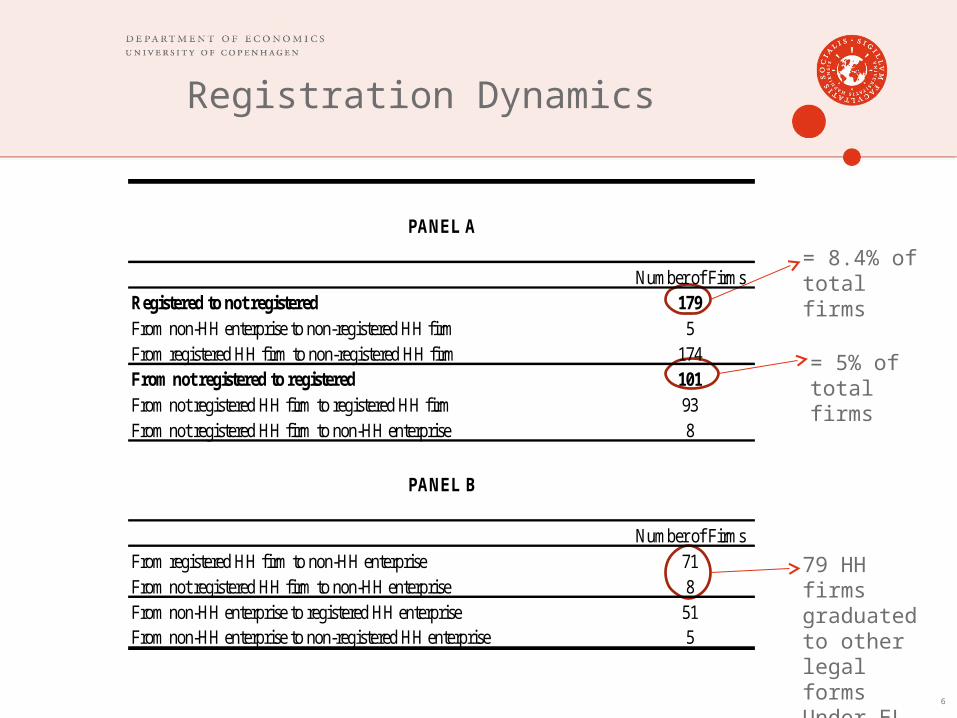
Registration Dynamics
6
= 8.4% of total firms
= 5% of total firms
79 HH firms graduated to other legal formsUnder EL
Number of FirmsRegistered to not registered 179From non-HH enterprise to non-registered HH firm 5From registered HH firm to non-registered HH firm 174From not registered to registered 101From not registered HH firm to registered HH firm 93From not registered HH firm to non-HH enterprise 8
Number of FirmsFrom registered HH firm to non-HH enterprise 71From not registered HH firm to non-HH enterprise 8From non-HH enterprise to registered HH enterprise 51From non-HH enterprise to non-registered HH enterprise 5
PANEL A
PANEL B

1. Enterprise Dynamics2. Bureaucracy, Informality, Tax
Evasion and Bribes3. Employment, Education and Social
Insurance4. Production and Technology5. Investment and Access to Finance6. Environment
7

SME Knowledge of Laws and Regulations
• General lack of knowledge observed, with a worsening from 2005 to 2007;• For Household Enterprises, ’formalization’ is associated with performing well
economically and firm survival.
0
10
20
30
40
50
60
70
80
90
100
Percent
2005
2007
8
Proportion of firms who have poor or no knowledge of specific laws or government regulations:

Burden of Bureaucratic Procedures
• Bureaucratic burden quite low in Vietnam (in confirmation of WB ‘Doing Business’ 2008);
• Consistent Provincial discrepancies (Lam Dong vs Khanh Hoa).
Percent (a) Low Performer High PerformerBusiness Registration License 70.2 Lam Dong Khanh HoaTax Code Registration Certificate 86.4 Ha Noi Khanh HoaSocial Insurance Registration Certificate 70.0 Lam Dong Phu ThoInvestment Certificate 54.2 Nghe An Phu ThoEnvironmental Standards Certificate 70.0 Ha Tay Hai PhongFire Prevention Certificate 78.9 Lam Dong Khanh HoaTechnology Transfer Certificate 61.8 Hai Phong Phu ThoSeal Engraving Permit 85.3 Lam Dong Quang NamRemittances Transfer Permit 93.7 .. ALLLicense to Operate Overseas Accounts 86.1 .. ALL
(a) Percentage of firms indicating that license was obtained within 15 days from the date of application
9
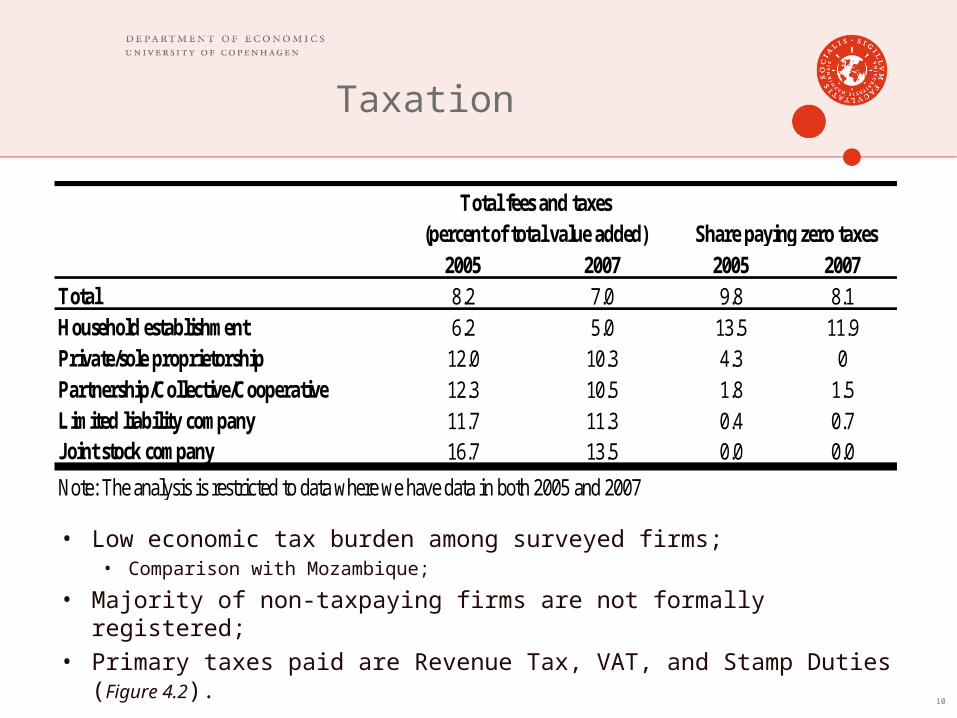
Taxation
• Low economic tax burden among surveyed firms;• Comparison with Mozambique;
• Majority of non-taxpaying firms are not formally registered;• Primary taxes paid are Revenue Tax, VAT, and Stamp Duties
(Figure 4.2).
2005 2007 2005 2007Total 8.2 7.0 9.8 8.1Household establishment 6.2 5.0 13.5 11.9Private/sole proprietorship 12.0 10.3 4.3 0Partnership/Collective/Cooperative 12.3 10.5 1.8 1.5Limited liability company 11.7 11.3 0.4 0.7Joint stock company 16.7 13.5 0.0 0.0
Note: The analysis is restricted to data where we have data in both 2005 and 2007
Total fees and taxes (percent of total value added) Share paying zero taxes
10

Payment of Bribes
0
5
10
15
20
25
30
35
40
45
Conn
ect
to P
ublic
Se
rvic
es
Obt
ain
Lice
nses
/ Pe
rmits
Deal
with
Ta
xes /
Ta
x Co
llecto
rs
Gai
n Go
vt Co
ntra
cts
/ Pub
lic
Proc
urem
ent
Cust
oms
Oth
er
Percent
2005
2007
11
• Large fall in number of firms paying bribes;• Bribes are small in relation to total revenue.
2005 2007
Firms paying bribes 41.2 26.5
How much did you pay?
(as % of total revenue)0.50 0.67

1. Enterprise Dynamics2. Bureaucracy, Informality, Tax Evasion
and Bribes3. Employment, Education and Social
Insurance4. Production and Technology5. Investment and Access to Finance6. Environment
12
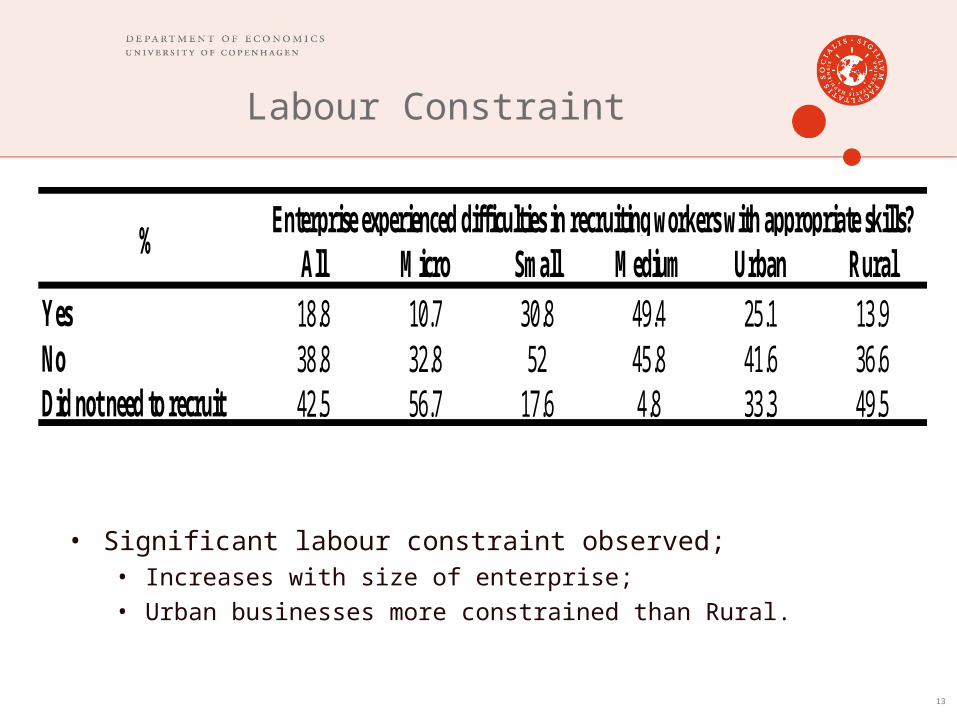
Labour Constraint
• Significant labour constraint observed;• Increases with size of enterprise;• Urban businesses more constrained than Rural.
13
All Micro Small Medium Urban RuralYes 18.8 10.7 30.8 49.4 25.1 13.9No 38.8 32.8 52 45.8 41.6 36.6Did not need to recruit 42.5 56.7 17.6 4.8 33.3 49.5
%Enterprise experienced difficulties in recruiting workers with appropriate skills?

Fringe Benefits
14
Consistent gender difference
All Male Female
18.8 18.2 20.0
34.1 32.1 38.2
Have regulation
31.4 29.7 34.9
Follow regulation
87.5 86.9 88.5
Have regulation
21.0 19.7 23.8
Follow regulation
69.6 70.7 67.8
Have regulation
28.0 27.8 28.2
Follow regulation
37.6 34.8 43.4
Have regulation
21.8 20.6 24.4
Follow regulation
93.0 93.0 93.2
Have regulation
76.0 74.9 78.2
Follow regulation
99.0 99.0 98.9Others
Pay contribution to social and health insurance
Compensate workforce directly for accidents and illness
Employees enjoy any of the following benefits (directly from Govt)
Sick leave with pay
Paid maternity leave
No paid maternity leave
Annual leave with pay

1. Enterprise Dynamics2. Bureaucracy, Informality, Tax Evasion
and Bribes3. Employment, Education and Social
Insurance4. Production and Technology5. Investment and Access to Finance6. Environment
15

Diversification and Innovation
• High, and rising, degree of specialization among SMEs;• Sharp decline in innovation rates;• Improvement of existing products appears to be most
important area of activity.
% Diversify Introduced new productImproved existing
product
2005 11.1 40.8 61.8
2007 8.8 4.9 44.1
Note: Since last survey means a 3 year period for 2005 data and 2 year period for 2007 data.
16

Technology Characteristics
• Rising level of technology used in production process;
• Over 85% of technology used is under 10 years old;
• Purchase of new equipment becoming more common;
• Firms less credit constrained?
• Introduction of new technology positively and significantly associated with employment growth and firm survival (Table 6.5).
2005 2007
Level of technology Only hand tools only 10.3 7.7Manually operated machinery only 3.5 5.0Power driven machinery only 24.6 27.5All of the above 61.6 59.8
Age of technology Under 3 years old 22.9 22.0Between 3 and 5 years old 34.9 36.5between 6 and 10 years old 30.4 27.5Between 11 and 20 years old 9.5 12.5More than 20 years old 2.3 1.5
New or second hand New 61.1 71.7Used 34.1 24.4Self-constructed 4.8 3.9
Note: Figures in percentages
17
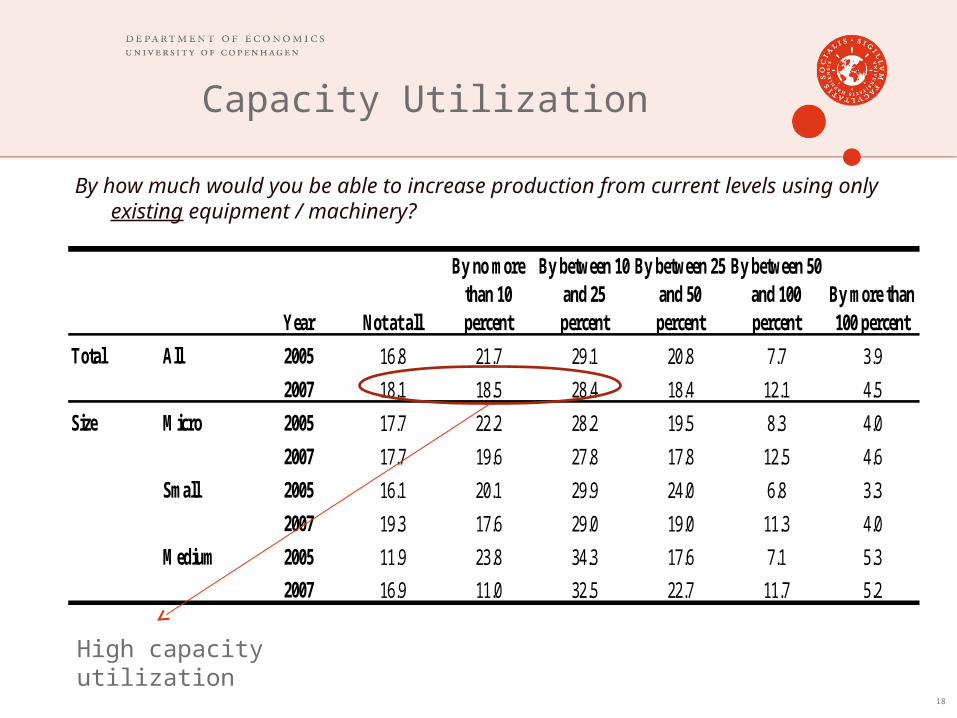
Capacity Utilization
By how much would you be able to increase production from current levels using only existing equipment / machinery?
18
Year
Total All 2005 16.8 21.7 29.1 20.8 7.7 3.9
2007 18.1 18.5 28.4 18.4 12.1 4.5
Size Micro 2005 17.7 22.2 28.2 19.5 8.3 4.0
2007 17.7 19.6 27.8 17.8 12.5 4.6
Small 2005 16.1 20.1 29.9 24.0 6.8 3.3
2007 19.3 17.6 29.0 19.0 11.3 4.0
Medium 2005 11.9 23.8 34.3 17.6 7.1 5.3
2007 16.9 11.0 32.5 22.7 11.7 5.2
By between 50 and 100 percent
By more than 100 percentNot at all
By no more than 10 percent
By between 10 and 25 percent
By between 25 and 50 percent
High capacity utilization
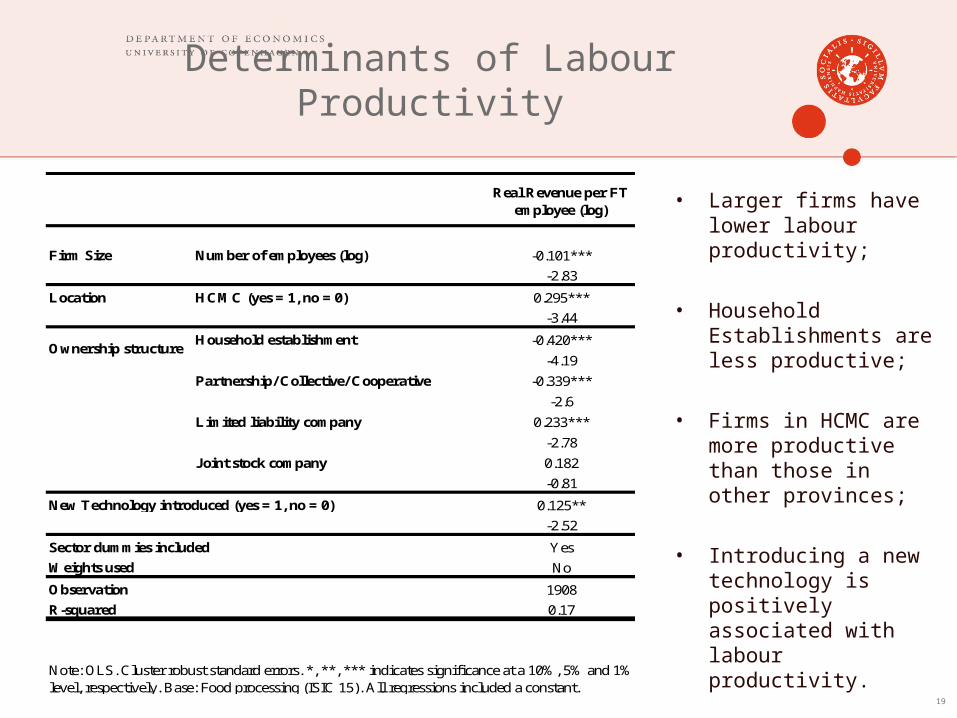
Determinants of Labour Productivity
• Larger firms have lower labour productivity;
• Household Establishments are less productive;
• Firms in HCMC are more productive than those in other provinces;
• Introducing a new technology is positively associated with labour productivity.
19
Real Revenue per FT employee (log)
Firm Size Number of employees (log) -0.101***
-2.83
Location HCMC (yes = 1, no = 0) 0.295***
-3.44
Household establishment -0.420***
-4.19
Partnership/ Collective/ Cooperative -0.339***
-2.6
Limited liability company 0.233***
-2.78
Joint stock company 0.182
-0.81
0.125**
-2.52
Yes
Weights used No
Observation 1908
R-squared 0.17
New Technology introduced (yes = 1, no = 0)
Sector dummies included
Note: OLS. Cluster robust standard errors. *, **, *** indicates significance at a 10%, 5% and 1%level, respectively. Base: Food processing (ISIC 15). All regressions included a constant.
Ownership structure

1. Enterprise Dynamics2. Bureaucracy, Informality, Tax Evasion
and Bribes3. Employment, Education and Social
Insurance4. Production and Technology5. Investment and Access to Finance6. Environment
20

New Investments and their Financing
• High levels of new investment;• But falling level;• Increases by firm
size;
• Retained earnings remain a major source of investment financing;
• Easier access to credit for larger urban firms?
21
2005 2007 2005 2007
All 62.2 42.4 66.9 74.0Micro 55.5 34.2 67.3 77.9Small 72.4 56.3 69.3 71.8Medium 76.7 69.4 57.1 61.2Urban 56.5 38.6 71.2 70.1Rural 66.6 45.2 64.0 76.5
Percent of enterprises that has made investments since last survey
Percent financed by own capital/ retained earnings
Note: Since last survey means a 3 year period for 2005 data and 2 year period for 2007 data.

Access to Credit I
• Approximately 7.5% of firms in 2007 are clearly ‘credit constrained’;
• And taking into account those firms wanting more, the proportion rises to over 23% of the sample;
• This represents a slight fall since 2005.
22
No NoEnterprise applied for formal loan (1670) (1589)
61.0 63.8Problems getting loans Yes No Yes No
(201) (868) (188) (715)18.8 78.2 20.8 79.2
Are you still in need of a loan 82.1 60.4 79.8 54.4
Note: All numbers in percentages (observations in parenthesis)
39.0 36.2
2005 2007Yes
(903)Yes
(1069)

Access to Credit II
• Why don’t Enterprises apply for loans?
23
0
10
20
30
40
50
60
Inadequate collateral
Don't want to incur debt
Process too difficult
Didn't need a loan Interest rate too high
Already heavily indebted
other
Percent
2005
2007

Structure
1. Enterprise Dynamics2. Bureaucracy, Informality, Tax Evasion
and Bribes3. Employment, Education and Social
Insurance4. Production and Technology5. Investment and Access to Finance6. Environment
24
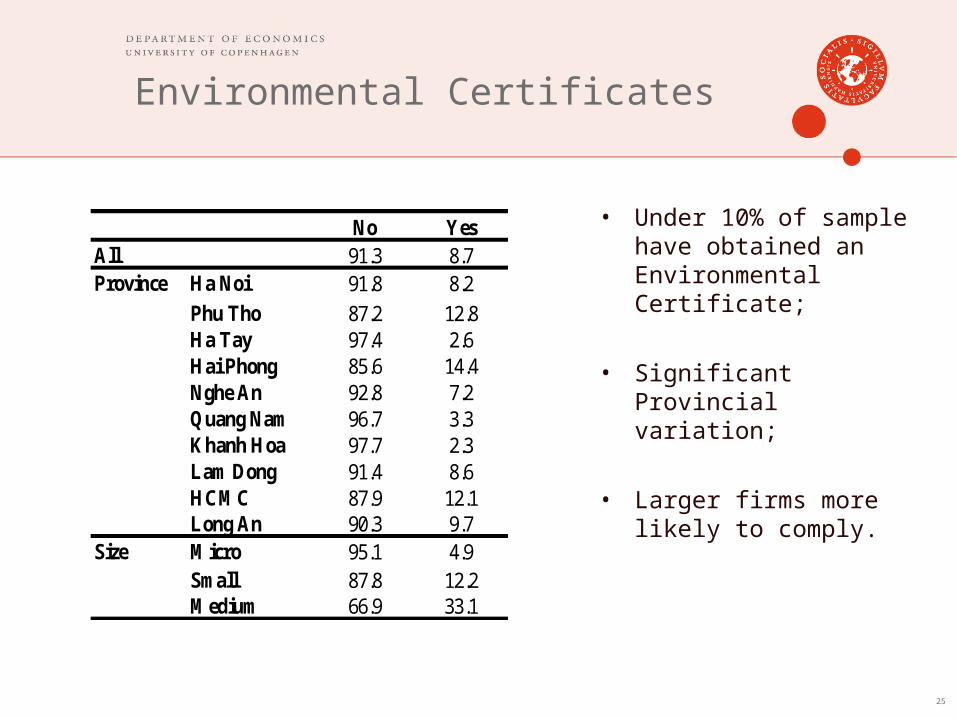
Environmental Certificates
• Under 10% of sample have obtained an Environmental Certificate;
• Significant Provincial variation;
• Larger firms more likely to comply.
25
No YesAll 91.3 8.7Province Ha Noi 91.8 8.2
Phu Tho 87.2 12.8Ha Tay 97.4 2.6Hai Phong 85.6 14.4Nghe An 92.8 7.2Quang Nam 96.7 3.3Khanh Hoa 97.7 2.3Lam Dong 91.4 8.6HCMC 87.9 12.1Long An 90.3 9.7
Size Micro 95.1 4.9Small 87.8 12.2Medium 66.9 33.1

Water: Use, Conservation, and Discharge
26
Main water use Frequency Percent
Input in production process 619 32.5Equipment cleaning 276 14.5Cooling/heating process 106 5.6Other production use 904 47.4
Made investments to save water?No 1,890 99.2Yes 15 0.8
Implemented other measures to save water ? No 1,897 99.6Yes 8 0.4
Frequency PercentWhere does enterprise discharge the water?
Public sewage 1,364 71.6River 225 11.8Lake 18 0.9Ocean 2 0.1Nearby grounds 215 11.3Other 81 4.2
Does the enterprise or authorities measure the quantity of water discharged?
No 1,869 98.1Yes 36 1.9
Measure the pollution concentration?No 1,412 74.1Yes 31 1.6Don't know 462 24.3
Is the water treated before discharge?No 1,578 82.8Yes 43 2.3Missing info 284 14.9

Concluding Remarks, Policy Implications,
and Next Steps
27

Point of Departure and Perspective
• Key goals: • Capacity building• Collaborative research• Contribute to science/evidence based policy making
• Complementary scientific approaches• Qualitative/stories• Quantitative/data
• Time series versus cross-sectional• Association versus causality (omitted variables and reverse
causation)• Make descriptive and suggestive observations and raise
questions in analytical perspective: some selected examples (following outline in Report) – see report for much more
28
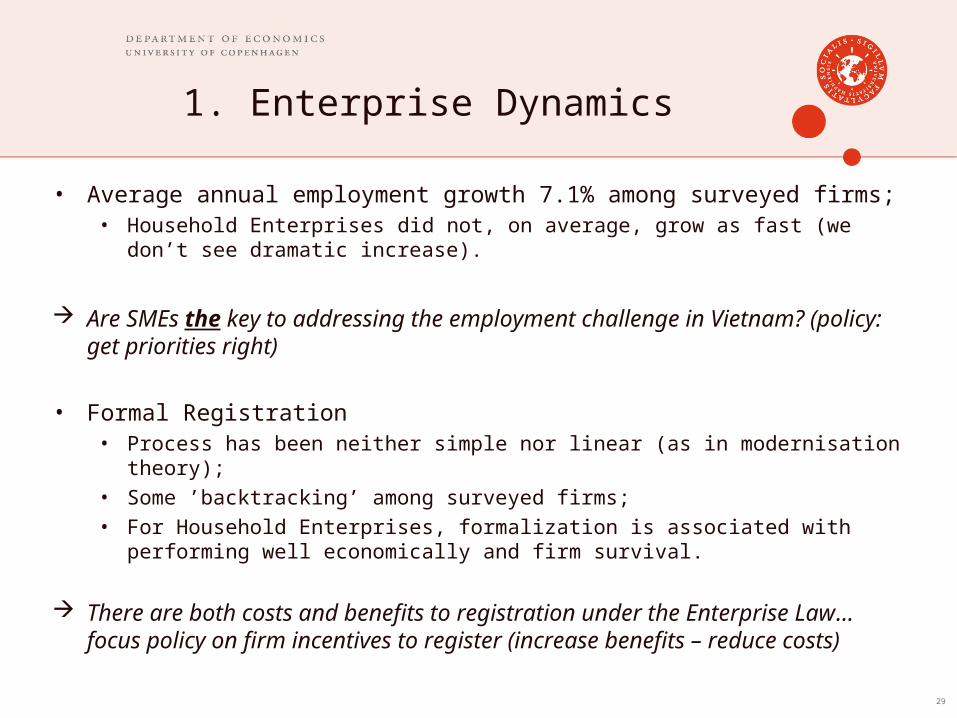
1. Enterprise Dynamics
• Average annual employment growth 7.1% among surveyed firms;• Household Enterprises did not, on average, grow as fast (we don’t see
dramatic increase).
Are SMEs the key to addressing the employment challenge in Vietnam? (policy: get priorities right)
• Formal Registration• Process has been neither simple nor linear (as in modernisation theory); • Some ’backtracking’ among surveyed firms;• For Household Enterprises, formalization is associated with performing
well economically and firm survival.
There are both costs and benefits to registration under the Enterprise Law… focus policy on firm incentives to register (increase benefits – reduce costs)
29
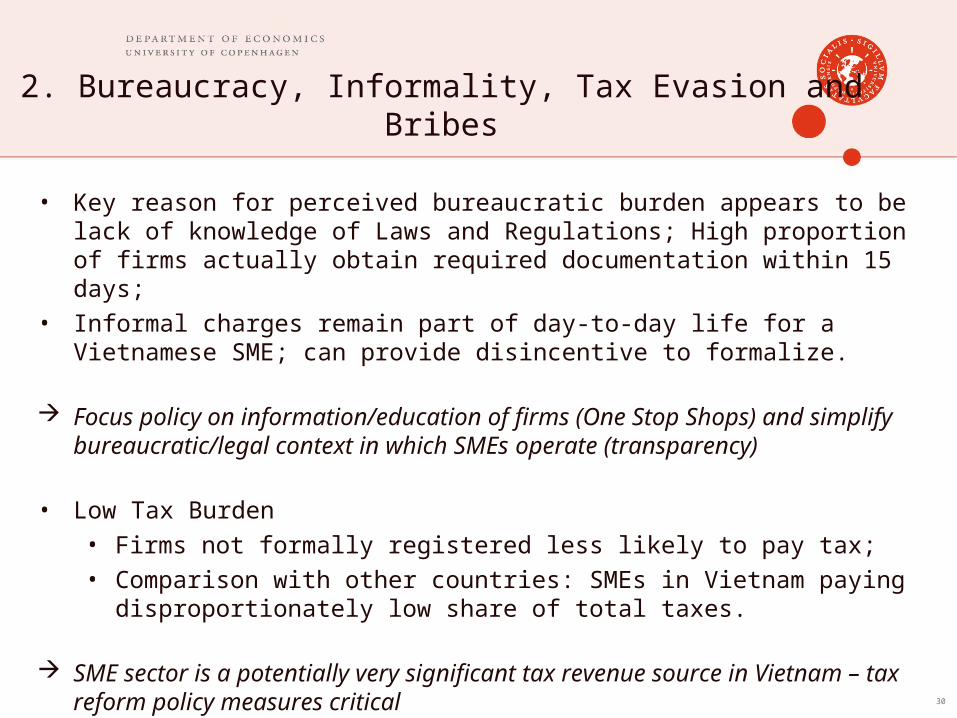
2. Bureaucracy, Informality, Tax Evasion and Bribes
• Key reason for perceived bureaucratic burden appears to be lack of knowledge of Laws and Regulations; High proportion of firms actually obtain required documentation within 15 days;
• Informal charges remain part of day-to-day life for a Vietnamese SME; can provide disincentive to formalize.
Focus policy on information/education of firms (One Stop Shops) and simplify bureaucratic/legal context in which SMEs operate (transparency)
• Low Tax Burden• Firms not formally registered less likely to pay tax;• Comparison with other countries: SMEs in Vietnam paying
disproportionately low share of total taxes.
SME sector is a potentially very significant tax revenue source in Vietnam – tax reform policy measures critical 30

3. Employment, Education and Social Insurance
• Labour constraint in SMEs is large and becoming larger;• Shortage of skilled labour increasingly an issue.
Much to suggest that phase of unlimited labour supply (and “easy” growth) in Vietnam coming to an end – focus policy on education (quality not quantity), vocational training and quality of capital investment
• Clear and consistent gender difference in provision of ’fringe benefits’ to employees;
Policy: formalization key to extend fringe benefits, but gender policy can indirectly help increase/broaden social benefits – so not only a matter of equity: More fringe benefits may help reduce excessive labour turnover (flexibility
important, but in a modern economy in service skills are important)31

4. Production and Technology
• High degree of specialization; Firms appear less willing than before to innovate (seem not to capture benefits);
• Larger firms found to be more innovative and diversified.
Policy: create incentives to innovate and invest in R&D Intellectual Property Rights: Patents, Copyrights (competition
important – but market failures must be addressed)
• Technological upgrading is happening; and has positive impacts on labour productivity;
• Capacity utilization of existing technology is high.
Policy: “no free lunches” – capacity constraints are starting to bind: how expand capital and ensure access to new machinery/equipment is key.
32

5. Investment and Access to Finance
• Despite recent expansion in supply of credit, excess demand remains;
• Lack of access to finance remains the key perceived constraint in survey;
• High proportion of surveyed firms are credit constrained;• Retained earnings remains significant source of financing.
Policy 1: Expansion of formal credit is needed But quality of supply must be ensured: e.g Credit Rating Schemes; And risk management and loan appraisal mechanisms need to be
introduced / improved; Policy 2: Training of SMEs to formulate and present coherent loan
applications (organized accounts and business plan).
33
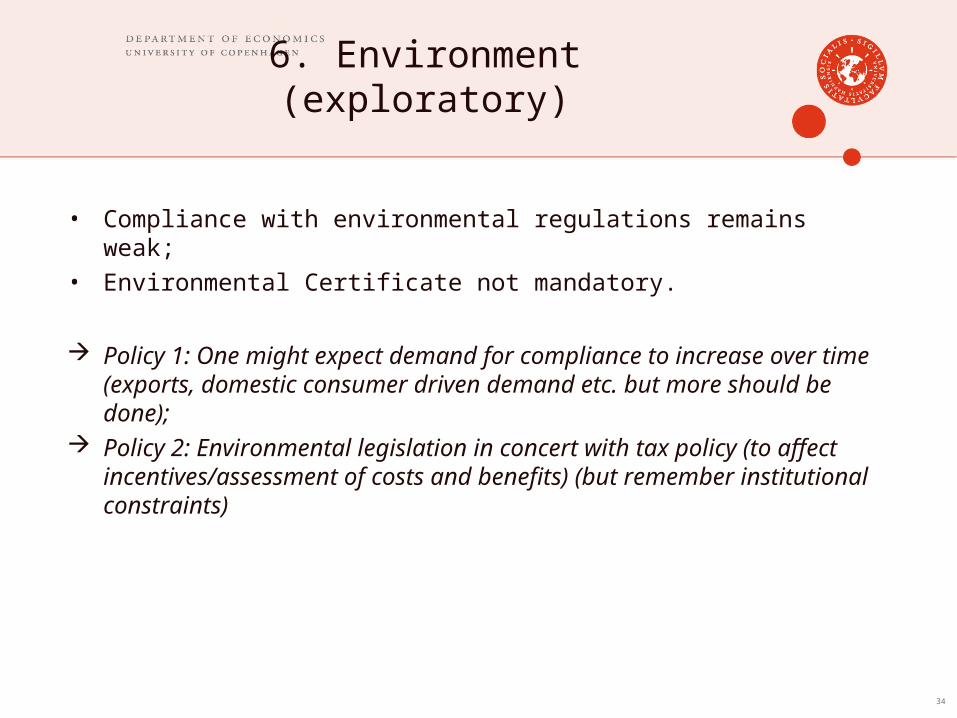
6. Environment (exploratory)
• Compliance with environmental regulations remains weak;• Environmental Certificate not mandatory.
Policy 1: One might expect demand for compliance to increase over time (exports, domestic consumer driven demand etc. but more should be done);
Policy 2: Environmental legislation in concert with tax policy (to affect incentives/assessment of costs and benefits) (but remember institutional constraints)
34
Next Steps
• Hope you will enjoy reading report (much more there).
• In-depth collaborative research studies and policy briefs considering selected key issues arising from 2007 database.
• New Survey to be implemented in 2009 with ILSSA, CIEM and DoE;• Same firms to be interviewed (panel database);• Only small modifications to the questionnaire;• Additional module to be incorporated (Environment in 2007)?
• Report to be published in 2010.
35

•
Thank you for
your attention
36