CHARACTERISTICS OF SUCCESSFUL TECHNOLOGY CEOs · CHARACTERISTICS OF SUCCESSFUL TECHNOLOGY CEOs...
36
REPORT A PUBLICATION OF VELL EXECUTIVE SEARCH INC. DECEMBER 2010 CHARACTERISTICS OF SUCCESSFUL TECHNOLOGY CEOs Predictors of CEO Success
Transcript of CHARACTERISTICS OF SUCCESSFUL TECHNOLOGY CEOs · CHARACTERISTICS OF SUCCESSFUL TECHNOLOGY CEOs...

C H A R A C T E R I S T I C S O F S U C C E S S F U L T E C H N O L O G Y C E O S I
(REVENUE RANGE $10 0 MILL ION TO $1 B ILL ION)
REPORT
A PUBLICATION OF VELL EXECUTIVE SEARCH INC.
DECEMBER 2010
CHARACTERISTICS OF SUCCESSFUL TECHNOLOGY CEOs
Predictors of CEO Success

Introduction 1
Research Report
Topic One: Education 2
Topic Two: Experience 6
Topic Three: Internal vs. External Hire 17
Topic Four: Age 20
Topic Five: Tenure 23
Topic Six: Combined Chairman and CEO 27
Methodology 30
About Vell Executive Search 31
Dora Vell 32
ISBN-13: 978-0980249415ISBN-10: 0980249414
© Copyright, 2009 by Vell Executive Search Inc. All rights reserved. Printed in the United States ofAmerica. No part of this publication may be reproduced or distributed in any form or by anymeans, or stored in a database or retrieval system, except as permitted under sections 107 or108 of the United States Copyright Act, without prior written permission of the publisher.
Contents

C H A R A C T E R I S T I C S O F S U C C E S S F U L T E C H N O L O G Y C E O S 1
This Vell research report on Characteristics of Successful CEOs investigates whether common perceptions
regarding the predictors of CEO success are valid. The research uses data about public technology prod-
ucts companies in New England with over $100 M in revenues — and their CEOs.
Our research examines the correlation (or lack of) between a company’s performance and the CEO’s
education, experience, tenure, age, reliance on an independent Chair, and whether the CEO came in as
internal promotion vs. external hire.
Not unexpectedly, technology companies differ from other companies in many significant ways. Although
we work extensively with technology CEOs, some of the findings were surprising to us. For example, the
predominance of founders among companies with revenues between $100 M – $1 B was unexpected.
Each topic has three sections. The “Patterns Detected” section summarizes the underlying distribution of
our data set, e.g., the percent of CEOs who were founders by company size. The “So Where Were the Differ-
ences” section reports the correlation between corporate performance and the relevant characteristics,
e.g., founders vs. non-founders. The “Key Take-Aways” section highlights the most striking conclusions.
We hope that you find this study both informative and insightful. If you would like to discuss any aspect
of this study further, please contact us at [email protected]. Your input will help fuel investments in future
research we publish.
Best Regards,
Dora Vell
CEO
Introduction

2
24%
16%
8%16%
36%
11%11%
22%
33%
22%
21%
15%
12%
21%
32%
All>$ 1 B$100 M – $1 B
100%
80%
60%
40%
20%
0%
PhD
Master’s Only
Master’s & MBA
Bachelor’s & MBA
Bachelor’s Only
Company Revenue
Degree Distribution by Company Size
Topic One: EducationPAT T E R N S D E T E C T E D
CEOs are highly educated
• 68%haveadvanceddegrees
• 43%ofCEOswithadvanceddegreeshaveMBAs(33%ofallCEOshaveMBAs)
• 21%ofallCEOshavePhDs
CEOs in larger companies differ from those in smaller companies as follows:
• LargercompanyCEOsaremorelikelytohaveanadvanceddegree(88%vs.64%forcompaniesbetween $100 M and $1 B)
• AlargerportionofbigcompanyCEOswithadvanceddegreeshaveMBAs(55%vs.24%forcompanies between $100 M and $1 B)
C H A R A C T E R I S T I C S O F S U C C E S S F U L T E C H N O L O G Y C E O S 3
21%
7%
29%
43%
45%
15%
15%
25%
35%
12%
21%
32%
AllTechnicalNon-Technical
100%
80%
60%
40%
20%
0%
Master’s / PhD, no MBA
Master’s & MBA
Bachelor’s & MBA
Bachelor’s Only
Level of Degree by Type
3-Y
ear
Gro
wth
Rat
e
> $1 B$100 M – $1 B
600%
400%
200%
0%
-200%
3-Y
ear
Gro
wth
Rat
e
CEO Performance by Company Size
Min, -20%
Median, 93%
Max, 8394%
Min, -22%
Median, 61%
Max, 342%
Company Revenue
CEOs with technical degrees predominate (59% of all CEOs in our study) and these are more likely to have advanced degrees.
CEOs with Ivy League degrees were in the minority (40%) but over-represented – not a surprise given the preponderance of Ivy Leaguers in New England.
• Theyarelesslikelytohavetechnicalbackgrounds(33%vs.68%fornon-IvyLeagueCEOs)
S O W H E R E W E R E T H E D I F F E R E N C E S ?
Notsurprisingly,growthrateswereloweratlargercompanies(61%vs.93%median3-yeargrowthrates)

4
Non-MBAMBA
500%
400%
300%
200%
100%
0%
-100%
3-Y
ear
Gro
wth
Rat
eMBA vs. Non-MBA Performance Comparison
Company Revenue $100 M – $1 B
Min, -5%
Median, 159%
Max, 324%
Min, -20%
Median, 89%
Max, 8394%
TechnicalMaster’s / PhD
Non-Technical
800%
600%
400%
200%
0%
-200%
3-Y
ear
Gro
wth
Rat
e
Technical vs. Non-Technical Performance ComparisonAll Companies
Min, -22%
Median, 71%
Max, 607%
Min, -3%
Median, 101%
Max, 407%
Technical Bachelor’s Only
Min, -36%
Median, 99%
Max, 8394%
MBAs outperform non-MBAs at companies under $1 B in revenue (159% vs. 89% median 3-year growth rates)
Forcompaniesover$1Binrevenue,theresultsweremuchcloser,61%forCEOswithMBAsvs.70% for CEOs without MBAs.
The companies with CEOs holding technical degrees outperformed companies with CEOs who didn’t (99% and 101% vs. 71% median 3-year growth rates)
Even though the median 3-year growth rate was close for technical CEOs whether they had a BS or higherdegree,themaximumgrowthrateCEOswithjustaBSdegreewasover8000%–acompanythatgrewfrom$3.6Mto$306Min3years.Thisoutlierunderscoresthevalueofidentifyingandtaking advantage of technology trends, which often requires a technical background.

C H A R A C T E R I S T I C S O F S U C C E S S F U L T E C H N O L O G Y C E O S 5
TechnicalNon-Technical
400%
300%
200%
100%
0%
-100%
3-Y
ear
Gro
wth
Rat
eTechnical vs. Non-Technical Performance Comparison
Company Revenue > $1 B
Min, -22%
Median, 47%
Max, 200%
Min, -3%
Median, 99%
Max, 342%
Ivy LeagueNon-Ivy League
400%
300%
200%
100%
0%
-100%
3-Y
ear
Gro
wth
Rat
e
Ivy vs. Non-Ivy Performance ComparisonCompany Revenue $100 M – $1 B
Min, -20%
Median, 86%
Max, 252%
Min, 43%
Median, 287%
Max, 8394%
In companies over $1 B in revenue, the technical degree premium was even more striking (99% vs. 47% for companies whose CEOs had non-technical degrees)
Companies whose CEOs have Ivy-League degrees significantly outperformed companies of CEOs without (287% vs. 86%)

6
26%
3%
26%
45%
22%
78%
34%
3%
28%
34%
31%{ 29%}
All>$ 1 B$100 M – $1 B
100%
80%
60%
40%
20%
0%
GM Only
CEO & GM
CEO Only
None
Company Revenue
CEO & GM Experience Distribution
K E Y TA K E AWAYS
MBA degrees are correlated with stronger growth, but only in companies between $100 M and $1 B. Moreover, the strongest growth of any of the smaller companies was by a non-MBA CEO. An MBA is a useful early indicator of business savvy – and perhaps drive, but as executives build their experience, results should be a larger factor in selecting candidates than whether they have an MBA or not.
Some search committee members favor CEO candidates with strong business backgrounds, which often blind them to excellent candidates with valuable technical backgrounds. Our experience is that technical degrees often correlate with high intelligence levels and also that CEO comfort with technical details helps address strategic issues such as where the market is headed and where the best opportunities are to be found.
AnIvyLeaguedegreeisanassettoperformance.Perhapstheadmissionsprocessintheseprogramsisa great filter for work ethic and smarts. Search committees tend to be biased either for or against Ivy Leaguedegrees.ThisdatashowsthatanIvyLeaguedegreeispositivelycorrelatedtoperformance.
Topic Two: ExperienceCEO / General Manager Experience
PAT T E R N S D E T E C T E D
Only 29% of companies have a current CEO with prior CEO experience.
• CEOsatcompanieswithrevenuebelow$1BwereslightlymorelikelytohavepriorCEOexperience,butstillonly31%didso.
• 34%ofCEOsatcompaniesbetween$100M-$1BinrevenuehadneitherpriorCEOoranyGMexperience.MostoftheseCEOswerefounders(70%of34%or23%ofallCEOs).
• Incompanieswithrevenuesover$1B,78%hadGMpriorexperienceonlyand22%hadCEOandGMexperience.

C H A R A C T E R I S T I C S O F S U C C E S S F U L T E C H N O L O G Y C E O S 7
29%
45%
16%11%
44%
33%
22%
38%
45%
10%7%
72%}All>$ 1 B$100 M – $1 B
100%
80%
60%
40%
20%
0%
Both
GM Current Only
GM Prior Only
None
Company Revenue
GM Experience Distribution
Prior CEO ExperienceNo Prior CEO Experience
125%
100%
75%
50%
25%
0%
-25%
3-Y
ear
Gro
wth
Rat
e
Company Performance by CEO ExperienceAll Companies
Min, -22%
Median, 66%
Max, 8394%
Min, 32%
Median, 89%
Max, 607%
Inversely, 72% of CEOs had General Manager experience, either at current or prior companies
• AllCEOsatcompanieswithrevenueover$1BhadGMexperience.
• However,inmostcases,CEOswereexperiencedasGMsatothercompanies.
• Incompanieswithrevenueover$1B,CEOstypicallyhavetoprovetheirtalentasGMinthe currentcompany:56%oftheseCEOshadbeenGMsattheircurrentcompany.
• Only11%ofCEOshadGMexperienceatboththeircurrentandpriorcompanies.
S O W H E R E W E R E T H E D I F F E R E N C E S ?
Prior CEO experience correlates to higher median 3-year growth rates.

8
Prior CEO ExperienceNo Prior CEO Experience
250%
200%
150%
100%
50%
0%
-50%
3-Y
ear
Gro
wth
Rat
eCompany Performance by CEO Experience
Company Revenue > $1 B
Min, -22%
Median, 33%
Max, 342%
Min, 61%
Median, 130%
Max, 200%
Prior CEO ExperienceNo Prior CEO Experience
125%
100%
75%
50%
25%
0%
-25%
3-Y
ear
Gro
wth
Rat
e
Company Performance by CEO ExperienceCompany Revenue $100 M to $1 B
Min, -20%
Median, 77%
Max, 8394%
Min, 32%
Median, 89%
Max, 607%
However, the advantage is more pronounced at large companies.
Perhaps because they rarely bring in outside CEOs - only 1 in 5 large company CEOs had prior CEO experience - and when they do, the vetting process brings in best-in class-CEOs.
At companies between $100 M - $1 B - where 70% of CEOs are founders - CEOs with prior CEO experience outperform their peers, but by a smaller edge.

C H A R A C T E R I S T I C S O F S U C C E S S F U L T E C H N O L O G Y C E O S 9
Prior CEO ExperienceNo Prior CEO Experience
250%
200%
150%
100%
50%
0%
-50%
3-Y
ear
Gro
wth
Rat
e
Company Performance by CEO ExperienceCompany Revenue > $1 B
Min, -22%
Median, 33%
Max, 342%
Min, 61%
Median, 130%
Max, 200%
No GM ExperiencePrior Company Only
200%
150%
100%
50%
0%
-50%
3-Y
ear
Gro
wth
Rat
eCompany Performance by CEO’s GM Experience
All Companies
Min, -20%
Median, 98%
Max, 8394%
Min, 12%
Median, 110%
Max, 607%
Where CEO Was GM
Min, -22%
Median, 39%
Max, 106%
Current Company or Both
General Manager (GM) experience initially appears to be detrimental to median 3-year growth rates.
This can be partially explained because CEOs at companies with over $1 B in revenue are over-representedintheGMexperienceclass–recalltheyallhadGMexperience-andtheirgrowthratesare slower than smaller companies.
In companies with revenues over $1 B, GM experience at the current company correlates with a significant edge for median 3-year growth rates.

1 0
No GM ExperienceGM Current or Both
200%
150%
100%
50%
0%
-50%
3-Y
ear
Gro
wth
Rat
e
Company Performance by CEO’s GM ExperienceCompany Revenue $100 M to $1 B
Where CEO Was GM
Min, -5%
Median, 43%Max, 56%
Min, 12%
Median, 110%
Max, 607%
GM Prior Only
Min, -20%
Median, 89%
Max, 8394%
Asyoumightexpectintheselargecompanies,CEOswithGMexperienceatapriorcompanyhavesignificantly lower performance than those promoted from within. Especially in larger companies, a successful track record with the company’s technology, market, competitors, and culture might be a more significant predictor of success as CEO. This emphasizes the importance of having a solid succession and development plan in larger companies.
In addition to a solid succession plan, companies could benefit greatly from a talent management program, where the talent in their specific industry is tracked and nurtured over years. Potential successors are courted over years and relationships developed with key players and up and comers in the industry so that when they are needed they can be easily approached.
In companies with revenues between $100 M and $1 B, the highest median 3-year growth rate was associated with CEOs who lacked GM experience – 73% of these being company founders.
AmongtheCEOswithGMexperienceinsmallercompaniestheresultistheinverseofthatfoundinlargercompanies:experienceasGMinapriorcompanycorrelatestohighermedian3-yeargrowthratesthanGMexperienceinthecurrentcompanyorboth.
K E Y TA K E - AWAYS
Prior CEO experience is more important to companies with revenue over $1 B.
In smaller companies, a very small percentage of CEOs have prior CEO experience.
GMexperienceisnotapredictorofstrongcorporaterevenuegrowth.
Inlargercompanies,allCEOshavesomeGMexperience.Inthisclassofcompanies,experienceasaGMinthecurrentcompanyisstronglycorrelatedtohigherperformance,underscoringtheimportance of familiarity with the company’s challenges and options.
Incompanieswithrevenuesbetween$100M-$1B,CEOswithoutGMexperience–mostofwhomare founders – are the top performers. Companies with revenues between $100 M – $1 B are more likelytolookatoutsidecandidateswithpriorCEOthanpriorGMexperience.
C H A R A C T E R I S T I C S O F S U C C E S S F U L T E C H N O L O G Y C E O S 11
Strategy BackgroundNo Strategy Background
250%
200%
150%
100%
50%
0%
-50%
3-Y
ear
Gro
wth
Rat
e
CEO Performance by Background ExperienceAll Companies
Min, -22%
Median, 82%
Max, 8394%
Min, -5%
Median, 159%
Max, 607%
Strategy Role
PAT T E R N S D E T E C T E D
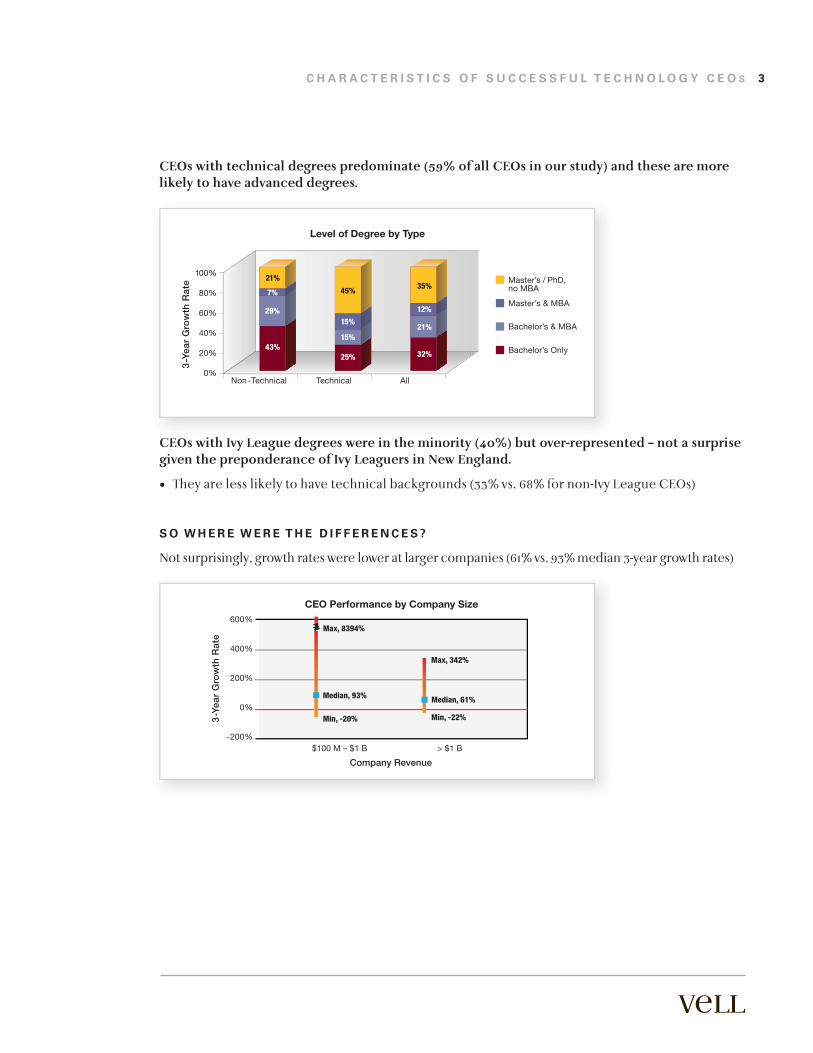
Only13%ofCEOsinourstudyhadheldaStrategyrole.Allofthesewereincompanieswith revenues between $100 M – $1 B.
S O W H E R E W E R E T H E D I F F E R E N C E S ?
Median 3-year growth rate was higher for those CEOs with Strategy backgrounds.
While the median 3-year growth rate was higher for those CEOs with Strategy backgrounds, this may be partly due to the fact that they are in smaller companies, which typically experience higher growth rates.
K E Y TA K E - AWAYS
Both strategy and operational skills need to be present when selecting a CEO. Executives with strategy backgrounds can make a significant impact as CEOs if they are also skilled in operations, but this combination of talents is rare.
Succession planning committees thinking about future CEO candidates should be assessing executives with strategy backgrounds for operational potential – and where merited – giving them opportunities to develop and hone their operational skills through a series of progressive and meaningful roles.

1 2
Consulting BackgroundNo Consulting Background
200%
150%
100%
50%
0%
-50%
3-Y
ear
Gro
wth
Rat
e
CEO Performance by Background ExperienceAll Companies
Min, -22%
Median, 76%
Max, 8394%
Min, 106%
Median, 110%
Max, 159%
Consulting Role
PAT T E R N S D E T E C T E D
Only8%ofCEOsinourstudyhadworkedpreviouslyasconsultants.Allofthesewereincompanieswithrevenuesbetween$100M–$1B.Giventhatthecompaniesinourstudywereproductvendors,it is not surprising that only a small subset had a consulting background.
S O W H E R E W E R E T H E D I F F E R E N C E S ?
Consulting experience correlates with higher median 3-year growth.
As with strategy backgrounds, consulting experience correlates with higher median 3-year growth rates,butthesefolksareinaminority(8%)andfoundonlyincompanieswithrevenuesbetween$100 M – $1 B.
K E Y TA K E - AWAYS
Executives with consulting backgrounds can make a significant impact as CEOs and should be considered but only if they also understand the product side and can operate a business.
Succession planning committees thinking about future CEO candidates should give executives with consulting backgrounds opportunities to demonstrate their operational abilities.

C H A R A C T E R I S T I C S O F S U C C E S S F U L T E C H N O L O G Y C E O S 1 3
Engineering BackgroundNo Engineering Background
150%
100%
50%
0%
-50%
3-Y
ear
Gro
wth
Rat
e
CEO Performance by Background ExperienceCompany Revenue $100 M – $1 B
Min, -22%
Median, 66%
Max, 8394%
Min, 43%
Median, 98%
Max, 407%
Engineering Role
PAT T E R N S D E T E C T E D
29%ofCEOshadheldengineeringroles,withalmostallofthese(91%)incompanieswithrevenuesbetween$100M–$1B.Inthissmallercompanyset,theyconstitute39%ofCEOs.Only11%ofCEOsin companies with revenues over $1 B had engineering experience.
S O W H E R E W E R E T H E D I F F E R E N C E S ?
Median 3-year growth rate was higher for those CEOs with prior engineering functional roles.
Again, while the median 3-year growth rate was higher for those CEOs who had held engineering functional roles, this may be partlyinfluencedbythefactthatmost(91%)oftheseCEOsareinsmallercompanies, which typically experience higher growth rates. Even in the smaller companies, however, CEOs with engineering experience correlate with superior median 3-year growth rates.
Because the maximum, minimum, and median numbers are the same for all companies as for companies in the $100 M – $1 B range, we only show the latter, more relevant, chart.
K E Y TA K E - AWAYS
We recommend that while candidates with business backgrounds need to be considered, a good grounding as an engineering executive should be considered a positive indicator of success. When paired with strong business acumen, experience in engineering can broaden a CEO’s perspectives on the potentials of the technology and help with the strategic orientation and nimble repositioning of the company based on changes in market and competitive conditions.
Some search committees do value the engineering functional experience as a real asset, because deep understanding of the technology fundamentals, paired with a good business mind is a decidedly strong indicator for performance.

1 4
66%
11%8%
16%
67%
11%11%11%
66%
10%7%
17%
All>$ 1 B$100 M – $1 B
100%
80%
60%
40%
20%
0%
Both
Marketing Only
Sales Only
None
Company Revenue
CEO Background Distribution
NeitherSales & Marketing
400%
300%
200%
100%
0%
-100%
3-Y
ear
Gro
wth
Rat
e
Company Performance by Background ExperienceAll Companies
Min, -22%
Max, 252%
Min, -5%
Median, 87%
Max, 607%
Median, 79%
Sales Only
Min, 10%
Max, 360%
Median, 147%
Marketing Only
Min, -20%
Median, 200%
Max, 8394%
Background
Sales & Marketing Roles
PAT T E R N S D E T E C T E D
Most CEOs (66%) did not come from a Sales & Marketing background.
This was consistent across the different company sizes. Of those with sales or marketing backgrounds,roughlyhalfwerelikelytohaveacombinedsalesandmarketingbackground.80%ofthe CEOs with combined sales and marketing experience were in the smaller companies.
S O W H E R E W E R E T H E D I F F E R E N C E S ?
The top performers were CEOs with marketing rather than sales backgrounds.

C H A R A C T E R I S T I C S O F S U C C E S S F U L T E C H N O L O G Y C E O S 1 5
Finance BackgroundNo Finance Background
150%
100%
50%
0%
-50%
3-Y
ear
Gro
wth
Rat
e
Min, -20%
Median, 91%
Max, 8394%
Min, -5%
Median, 43%
Max, 159%
Company Performance by CEO ExperienceCompany Revenue $100 M to $1 B
Executives with sales experience and executives with marketing experience outperformed executives with neither.
Interestingly, all companies whose CEOs had both sales & marketing backgrounds performed the worst.
When sales and marketing are combined, the tendency has been to give the role to a strong sales executive, who focuses on field marketing as opposed to strategy and product management / marketing.
K E Y TA K E - AWAYS
Many technology company search committees focus heavily on sales backgrounds. Marketing backgrounds tend to be considered less frequently, especially in the B2B sector. It may be that marketing positively correlates to performance only when the executive has had strategic marketing experience. Understanding how to focus the company and targeting it to the right buyers may be more valuable than tactical sales execution. Clearly, both marketing strategy and sales execution are required for the functioning of a company, but the question here is who is at the helm and what bias they bring to the thinking of its strategy.
Finance
PAT T E R N S D E T E C T E D
16%ofCEOsinourstudyhadexperienceinfinance,withthemajority(83%)oftheseCEOsincompanieswithrevenuesbetween$100M–$1B.CEOswithfinanceexperienceconstitute11%ofCEOsatcompanieswithrevenuesgreaterthan$1Band17%ofCEOsatcompanieswithrevenuesbetween $100 M – $1 B.
S O W H E R E W E R E T H E D I F F E R E N C E S ?
In companies with revenues between $100M – $1 B, CEOs without finance experience produced significantly higher 3-year growth rates.

1 6
VC / Private Equity Background
No VC / Private Equity Background
400%
300%
200%
100%
0%
-100%
3-Y
ear
Gro
wth
Rat
e
Company Performance by CEO ExperienceAll Companies
Min, -22%
Median, 82%
Max, 8394%
Min, 66%
Median, 200%
Max, 360%
CEOs without finance experience produced significantly higher median 3-year growth rates than CEOs with finance backgrounds in companies with revenues between $100 M – $1 B. However, the highest performing CEO had a finance background, so there are exceptions to the rule.
K E Y TA K E - AWAYS
Financial acumen, including a clear understanding of performance measurements, is a vital requirement for an executive, especially in this era of higher regulation. Financial executives tend to be well prepared for the top role because they have access to the boardroom at very early stages in their careers.
Perhaps the correlation between prior finance roles and lower corporate growth rates is because financial executives tend to be selected in turnaround or financial re-engineering situations that have measures of success other than revenue growth. Venture Capital or Private Equity
PAT T E R N S D E T E C T E D
Only8%ofCEOshadventurecapitalorprivateequityexperienceandmostofthesewereinsmallercompanies.
S O W H E R E W E R E T H E D I F F E R E N C E S ?
As with strategy backgrounds, VC and investment experience correlates with higher median 3-year growth rates, but these executives are in a minority (8%) and found mainly in companies with revenues between $100 M – $1 B.
K E Y TA K E - AWAYS
Venture Capital and Private Equity often attract the best and brightest. In our sample, the performance by CEOs with experience in VC or private equity firms was superior to their peers. As with consulting or strategy backgrounds, when VC or private equity experience is paired with operational capability, it can become a very potent background for a CEO.

C H A R A C T E R I S T I C S O F S U C C E S S F U L T E C H N O L O G Y C E O S 1 7
39%
37%
24%
67%
33%
52%
28%
21%
All>$ 1 B$100 M – $1 B
100%
80%
60%
40%
20%
0%
Externally Hired
Internally Promoted
Founder
Company Revenue
CEO Distribution
Topic Three: Internal vs. External HirePAT T E R N S D E T E C T E D
39% of all CEOs were founders. However, all the founders were in companies with revenue between $100 M – $1 B.
• Foundersconstitute52%ofCEOsincompaniesbetween$100M–$1B.
• 14%ofthesefounder-CEOswereco-founderswhowerepromotedintotheCEOslot.
• 37%ofallCEOswereinternallypromoted,including67%ofCEOsatcompanieswithrevenue>$1B.
• 24%ofCEOswererecruitedexternally.
1 8
Externally HiredFounder
200%
150%
100%
50%
0%
-50%
3-Y
ear
Gro
wth
Rat
e
Company Performance by CEO OriginationAll Companies
Min, 12%
Median, 93%
Max, 607%
Min, 33%
Median, 89%
Max, 8394%
Internally Promoted
Min, -22%
Median, 58%
Max, 407%
S O W H E R E W E R E T H E D I F F E R E N C E S ?
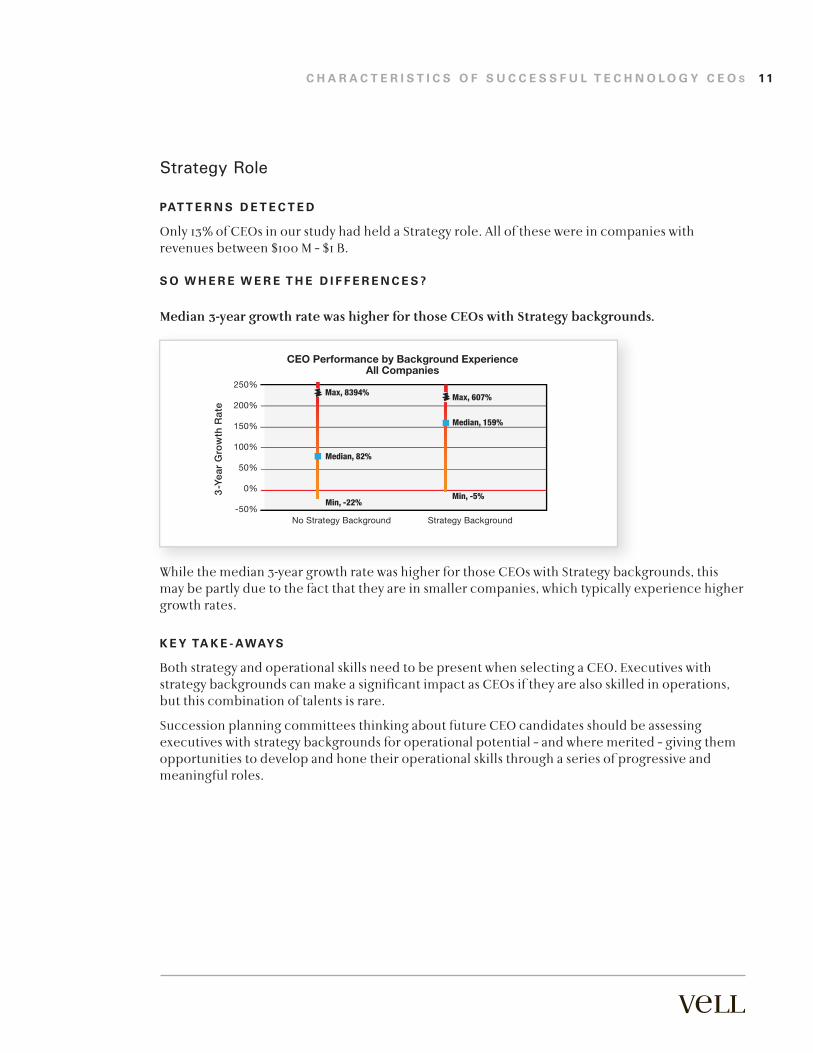
Founders turned in the best revenue growth rates, partially because they are all in smaller companies.
Founders and externally hired CEOs both had an edge over internally promoted CEOs in terms of 3-year median growth rates.
The performance difference between external hires and internally promoted executives is significantly greater (3x greater) for companies with revenues > $1 B than for companies with revenues between $100 M – $1 B.
Externally HiredInternally Promoted
150%
100%
50%
0%
-50%
3-Y
ear
Gro
wth
Rat
e
CEO Performance by Background ExperienceCompany Revenue >$1 B
Min, -22%
Median, 35%
Max, 342%
Min, 33%
Median, 99%
Max, 200%

C H A R A C T E R I S T I C S O F S U C C E S S F U L T E C H N O L O G Y C E O S 1 9
In companies with revenue between $100M – $1B, founders outperform all other CEOs, but they have only a slight edge over external hires.
Founders who can scale in management skills as the company grows are able to apply their in-depth knowledge and passion to drive higher growth rates.
K E Y TA K E - AWAYS
Entrepreneurial founders are passionate and intimately knowledgeable about the products and markets they serve. There are many founders that have the ability to scale their skills as the company grows and deliver superior performance in companies up to $1 B in revenue.
It was surprising that external hires outperformed internal hires even in larger companies, where you’d expect greater bench strength.
Inspiteofthis,75%ofCEOsinthelargercompanieswereinternalpromotions.
There may be a bias to bet on the ones you know intimately when internal and external candidates are each a close fit for the CEO role. Conversely the bar for external candidates may be slightly higher.
Companies with a strong succession planning process give internal candidates opportunities to develop their skills and vie for the CEO slot. But these companies go with outside candidates when the external candidates are clearly a better fit than anyone in the internal pool. Even when they select an external CEO, the internal talent pool is typically strengthened as a result.
Externally HiredFounder
150%
100%
50%
0%
-50%
3-Y
ear
Gro
wth
Rat
eCompany Performance by CEO Origination
Company Revenue $100 M to $1 B
Min, 12%
Median, 93%
Max, 607%
Min, 66%
Median, 89%
Max, 8394%
Internally Promoted
Min, -20%
Median, 66%
Max, 407%

2 0
3%16%
53%
29%
11%
67%
22%
3%17%
48%
31%
All>$ 1 B$100 M – $1 B
100%
80%
60%
40%
20%
0%
60–69
50–59
40–49
30–39
Company Revenue
CEO Age Distribution
Topic Four: AgePAT T E R N S D E T E C T E D
Smaller companies have a higher percentage of CEOs older than 60.
The predominance of older CEOs in companies with revenues between $100 M – $1 B is partially attributable to over half of these CEOs being founders.
FounderNon-Founder
100%
80%
60%
40%
20%
0%
60–69
50–59
40–49
30–39
Non-Founder vs. Founder Age DistributionCompany Revenue $100 M to $1 B
7%13%
33%
47%
21%
64%
14%

C H A R A C T E R I S T I C S O F S U C C E S S F U L T E C H N O L O G Y C E O S 2 1
0 5 10 15 20 25 30 35 40
Ag
eCorrelation between Age and Tenure at Company
All Companies
Tenure at Company
70
65
60
55
50
45
40
35
0 5 10 15 20 25 30
Ag
e
Correlation between Age and Tenure as CEOFounders vs. Non-Founders
Tenure as CEO
70
65
60
55
50
45
40
35
Founders
Non-Founders
Interestingly, there was no apparent correlation between age and overall tenure at a company.
Nor is there an apparent correlation between age and tenure as CEO of that company.

2 2
60–6950–5938–49
200%
150%
100%
50%
0%
-50%
3-Y
ear
Gro
wth
Rat
e
Company Performance by CEO Age GroupCompany Revenue >$1 B
Min, -22%
Median, 66%
Max, 342%
Min, -3%
Median, 29%
Max, 61%
Median, 106%
Age Group
60–6950–59
300%
200%
100%
0%
-100%
3-Y
ear
Gro
wth
Rat
e
Company Performance by CEO Age GroupCompany Revenue $100 M to $1 B
Min, -20%
Median, 85%
Max, 407%
Min, 12%
Median, 56%
Max, 252%
Median, 156%
38–49
Age Group
Min, 76%
Max, 8394%
S O W H E R E W E R E T H E D I F F E R E N C E S ?
CEOs between 38-49 years old do correlate with higher median 3-year growth rates.
In part, this is because companies with revenue between $100 M –$1 B are over-represented in the youngest age group. However, the performance edge of younger CEOs is consistent when looking at CEOs from the smaller companies by themselves.
The edge of younger CEOs is consistent, though more muted, in companies with revenues > $1 B.

C H A R A C T E R I S T I C S O F S U C C E S S F U L T E C H N O L O G Y C E O S 2 3
Interestingly, theonlyCEOofacompanywith>$1Binrevenuewhowasunder50outperformedthe majority of CEOs.
K E Y TA K E - AWAYS
Youth can be a real asset to emerging companies, especially those under $1 B. In technology companies, executives familiar with emerging technology tend to be younger.
Ages50-59seemtobeidealforoptimalcompanygrowthforcompanies>$1B.
13%
39%
13%
24%
22%
33%
11%11%
22%
10%
41%
14%10%
24%
11%
All>$ 1 B$100 M – $1 B
100%
80%
60%
40%
20%
0%
>20
16–20
11–15
6–10
4–5
Company Revenue
Distribution of CEOs by Tenure at Company
Topic Five: TenurePAT T E R N S D E T E C T E D
Of the CEOs who have been in their position at least 3 years – the focus of our research – over 87% have been at their companies more than 5 years.
The pattern of tenure at their current company for the CEOs in our study is fairly consistent across company size. The exception is that in larger companies the mix of CEOs who have been there less than10yearsistiltedmoretowardsthosewhohavebeentherelesstime–between4–6years.

2 4
150%
100%
50%
0%
-50%
3-Y
ear
Gro
wth
Rat
e
Company Performance Comparison by CEO Tenure GroupAll Companies
Years in Current Company as CEO3.1–6<3
Min, -22%
Median, 99%
Max, 407%
Min, -17%
Median, 43%
Max, 110%
Min, -5%
Median, 59%
Max, 8394%
>6
21%
44%
13%10%10%
44%
33%
22%
14%
48%
10%
14%
14%
All>$ 1 B$100 M – $1 B
100%
80%
60%
40%
20%
0%
>20
16–20
11–15
6–10
4–5
Company Revenue
Distribution of CEOs by Tenure as CEO
Of the CEOs who have been in their position at least 3 years – the focus of our research – over 79% of CEOs have been CEO at their companies more than 5 years.
The pattern of tenure as CEO at their current company is dramatically different by company size. CEOsatlargercompaniesaremuchmorelikelytobereplacedafter5–10years.Longertenureatcompanieswithrevenuesbetween$100M–$1Breflectthatover50%oftheseCEOswerefounders.
Our comparisons in this research are primarily among the 38 public technology companies in New England with at least 3 years of reported results for the current CEO. It is important to observe that including the 13 companies who had replaced their CEOs in the last 3 years (with an average tenure as CEO of .85 years), the average tenure overall as CEO was 5.4 years.
S O W H E R E W E R E T H E D I F F E R E N C E S ?
Not surprisingly, the median 3-year growth rate was smallest for companies that replaced their CEO in the last 3 years.

C H A R A C T E R I S T I C S O F S U C C E S S F U L T E C H N O L O G Y C E O S 2 5
3.1–6
150%
100%
50%
0%
-50%
3-Y
ear
Gro
wth
Rat
e
Min, -3%
Median, 21%
Max, 61%
Min, -22%
Median, 106%
Max, 343%
Company Performance Comparison by CEO Tenure GroupCompany Revenue >$1 B
Years in Current Company as CEO
>6
Company Performance Comparison by CEO Tenure GroupCompany Revenue $100 M to $1 B
Min, -5%
Median, 77%
Max, 8394%
Min, -17%
Median, 43%
Max, 110%
Min, -20%
Median, 89%
Max, 407%
150%
100%
50%
0%
-50%
3-Y
ear
Gro
wth
Rat
e
Years in Current Company as CEO
>63.1–6<3
• WhilesomeCEOswerereplacedduetodeathorage-relatedretirement,mostCEO replacements could be tied to company struggles to reach growth targets.
• Itwasalsosurprisingtoseethatthemedian3-yeargrowthrateforCEOswhohavebeeninthe saddlefor3–6yearswassignificantlyhigherthanthatforlonger-tenuredCEOs.
The difference in median 3-year growth rate was much less for companies with revenues between $100 M – $1 B.
The difference in median 3-year growth rate was markedly greater for CEOs who have been in the saddle for 3 – 6 years in companies with revenues over $1 B.

2 6
Min, -22%
Median, 85%
Max, 8394%
Min, -17%
Median, 43%
Max, 110%
Min, -6%
Median, 43%
Max, 237%
Long Term CEOsPost Recent CEOs –Normalized
Prior to Recent CEOs
Contrast Company Performance Before and After CEO Replacementvs. Companies with Long Term CEOs - All Companies
150%
100%
50%
0%
-50%
3-Y
ear
Gro
wth
Rat
e
In the chart below, we compare the 3 year growth rate for the companies that recently changed CEOs for the 3 years before the change, with the growth rate since the new CEO – normalized to a 3 year growth rate – in order to compare it with the last 3 years of growth for the companies with long term CEOs.
Comparing companies with recently changed CEOs against companies that had CEOs in place for at least 3 years is tricky, since there is no 3-year track record for the same period.
The story shown here is that:
• mostofthecompanieswhochangedCEOsinthelast3yearsweregrowthchallenged(thecom pany growth slowed before the transition)
• thingshaveimprovedslightlyaftertheCEOchange
• butgrowthremainsslowerthanatcompanieswithCEOswhohavebeeninplaceatleast3years.
The implication is that when CEO transitions result from growth shortfalls, it can take a period of time to show significant improvement.
K E Y TA K E - AWAYS
Although there is much talk recently about the average tenure of CEOs declining, this trend is not asstrongamongtechnologycompanies.Only25%ofthesecompanieschangedCEOsinthelast3years–andin4%ofallcompanies,theCEOtransitionwasduetoadeathofthefounder.
However,itisthecasethatCEOswhohavebeeninplacebetween3–6yearsoutperformtheirpeerswith longer tenure as CEO, especially in the larger companies.

C H A R A C T E R I S T I C S O F S U C C E S S F U L T E C H N O L O G Y C E O S 2 7
47%
53%
56%
44%
45%
55%
All>$ 1 B$100 M – $1 B
100%
80%
60%
40%
20%
0%
CEO &Chairman
CEO
Company Revenue
CEO Only vs. CEO & Chairman Distribution
Topic Six: Combined Chairman and CEOPAT T E R N S D E T E C T E D
Fewer than 50% of companies had independent Chairmen, and companies with revenue between $100 M – $1 B are slightly more prone to allowing one person to hold the combined roles.
S O W H E R E W E R E T H E D I F F E R E N C E S ?
Companies with independent chairmen outperformed companies that combined roles.
CEO Only vs. CEO & Chairman Performance ComparisonAll Companies
Min, -20%
Median, 63%
Max, 324%
Min, -22%
Median, 99%
Max, 8394%
CEO Only
150%
100%
50%
0%
-50%
3-Y
ear
Gro
wth
Rat
e
CEO’s Scope of ResponsibilityCEO & Chairman

2 8
The performance edge was more marked in larger companies.
There is a smaller edge for companies with revenue between $100 M – $1 B.
CEO Only vs. CEO & Chairman Performance ComparisonCompany Revenue >$1 B
CEO Only
150%
100%
50%
0%
-50%
3-Y
ear
Gro
wth
Rat
e
CEO’s Scope of ResponsibilityCEO & Chairman
Min, -22%
Median, 99%
Max, 324%
Min, 10%
Median, 47%
Max, 106%
CEO Only vs. CEO & Chairman Performance ComparisonCompany Revenue $100 M to $1 B
Min, -20%
Median, 74%
Max, 324%
Min, -5%
Median, 98%
Max, 8394%
CEO Only
150%
100%
50%
0%
-50%
3-Y
ear
Gro
wth
Rat
e
CEO’s Scope of ResponsibilityCEO & Chairman

C H A R A C T E R I S T I C S O F S U C C E S S F U L T E C H N O L O G Y C E O S 2 9
The smaller edge for companies with revenue between $100 M – $1 B may be due to the fact that there has not been an impetus to recruit an independent Chair when a strong founder has successfully transitioned from start-up to mid-sized company. Formalizing a separate Chair role tends to happen as companies mature.
K E Y TA K E - AWAYS
Companies with independent chairs do nominally outperform their peers based on median 3-year growth rates. However, the labels can mask actual division of responsibilities.
In some companies, a CEO transitioning to a Chair-only role may influence selection of a cooperative replacement CEO who lets the Chair still call the shots. In other companies, a strong CEO forced to accept an “independent” Chair may influence the selection to retain as much free reign as possible.
This is a controversial area and one that merits more investigation.

3 0
Methodology Vell Executive Search selected public technology companies in New England with revenues over $100 M. Financial and technical data were collected from Hoovers, ZoomInfo, and archived press releases.
Companies where CEOs had been on board for less than 3 years were excluded from most analyses. The key exception was comparing performance of companies where the CEO has been on board for at least 3 years (38 companies) vs. companies that recently replaced the CEO (13 companies).
Companies where the CEOs educational background was not available were excluded from the educational analysis, leaving 34 companies for that analysis.
We intend to expand the analysis and would value hearing about your questions / concerns that may not have addressed in this phase of the research.

C H A R A C T E R I S T I C S O F S U C C E S S F U L T E C H N O L O G Y C E O S 3 1
About Vell Executive Search Vell Executive Search is a retained executive search firm that specializes in recruiting board directors,CEOsandC-Levelexecutivesinthesoftwareindustry.Vellhasbuiltareputationforrecruiting talented high-performing leadership teams globally.
Our services are designed to help you build strong leadership at the top. We offer retained executive and board level search, reference checking, candidate benchmarking, and access to a pool of interim candidates.
We are a boutique firm with Fortune 500 experience. Veteran senior consultants with backgrounds at the world’s largest executive search firms handle all of our board and C-level assignments. Because our executive recruiters are technology industry specialists, we can focus more time and attention on fewer searches and projects – and drive strong results.
With our unique operational and technical background, Vell becomes deeply versed with your company faster, helping not only find the right candidates, but also excite them about your opportunity and perform assessments to ensure the right skills and cultural match.
W H Y O U R C L I E N T S C H O O S E U S
1. Deep tech industry expertise through veteran consultants.
2. More dedicated time as consultants have few parallel projects.
3. Thorough understanding of your company’s business and culture through comprehensive meetings with leadership team.
4. In-depth view of the executive’s skills and culture fit through behavioral interviews and competency scorecards.
5. Constant two-way, direct communication during your search with regular status calls and 24/7 availability.
6.Insightful and detailed reference checking through our extensive network of senior executives.
7. Broad reach of candidates: no hidden relationships, no parallel searches holding up the best candidates.

3 2
Dora Vell is Managing Partner of Vell Executive Search, a retained firm focused on recruiting top C-level executives and board members in the Software/Technology industry. Vell was a Partner in the Heidrick & Struggles technology practice for seven years. Prior to her career in executive search, Vell was a sales executive at IBM managing a $150m software sales region, and an engineering executive responsible for a 100-person software development team. Vell has published and been quoted in numerous articles including The Wall Street Journal, Forbes, Fortune, Agenda Week, MSN, MSNBC, Mass High Tech, the OPUS for the World Economic Forum, BostonBusinessJournal,GlobeandMail,CIO,andIEEE,andhasbeenafeaturedspeakeratnumerous events.
Vell is a member of the National Association of Corporate Directors (NACD), and serves on the board of Framingham State University and the Advisory board of ZoomInfo. She has served on theboardofEntrepreneur’sOrganization,Goodwill,andMaryCentrefordevelopmentallyhandicapped adults, and the venture firms garage.ca and RBC Capital Partners. She regularly conducts pro-bono search assignments for non-profit organizations, such as CAB Health and Perkins School for the Blind.
Vell received an MBA from the University of Toronto , a Master in Computer Science from the University of Waterloo and a Bachelor in Computer Science from Carleton. She holds seven worldwide software patents.
Contact Ms. Vell at [email protected]
Dora Vell


3 4
Vell Executive Search1050 Winter Street, Suite 1000 Waltham, MA 02451Phone: 781.416.4003 e-Fax: 781.207.0553
www.vell.com
$125.00
© Copyright, 2009 by Vell Executive Search Inc. All rights reserved. Printed in the United States of America. No part of this publication may be reproduced or distributed in any form or by any means, or stored in a database or retrieval system, except as permitted under sections 107 or 108 of the United States Copyright Act, without prior written permission of the publisher.