Comparative clinical study of pulsatile and non-pulsatile perfusion in ...

Received date 2019.7.1 Email of the corresponding author: [email protected]
Characteristics of pulsatile flow with the reverse flow in
the grooved channel
Junxiu PAN*1, Yongning BIAN*1, Hirofumi ARIMA*2 and Yasuyuki IKEGAMI*2
*1State Key Laboratory of Structural Analysis for Industrial Equipment Dalian University of Technology, 116024, China
*2Institute of Ocean Energy, Saga University, 840-8502, Japan
Abstract The characteristics of pulsatile flow with the reverse flow in the grooved channel are investigated
experimentally. Three flow parameters are considered: the net flow Reynolds number, the oscillatory fraction of the flow rate and the oscillatory frequency. The flow structures are visualized using the aluminum dust method. It is observed that the flow tends to be more unstable in the deceleration phase for the pulsatile flow. Meanwhile, the experimental oscillatory fraction of the flow rate is easier to reach the theoretical value at lower oscillatory frequency. Furthermore, it is found that the oscillatory fraction of the local pressure decreases with the increase of the period of oscillation, and the oscillatory fraction of the downstream local pressure is larger than that of the upstream local pressure. Keywords: pulsatile flow, grooved channel, flow visualization, oscillatory fraction 1. Introduction
Ocean thermal energy conversion (OTEC) is a system which takes advantages of the temperature difference between the warm water at the surface of the ocean and cold water of the depths. However, the typical thermal efficiency of the Rankine cycle is only 3–5% which is primarily limited by the finite temperature difference (Khan et al., 2017). The authors and other researchers made researches about how to improve the thermal efficiency of the OTEC system (Bian et al., 2019). It was found that both double flute tube-type and plate-type heat exchangers are best fitted for the OTEC (Uehara et al., 1984).
In recent years, the characteristics of heat transfer in grooved channels have attracted many researchers’ attention. Nishimura et al. (2004) studied mass-transfer enhancement and fluid dynamic behavior in a wavy-walled tube for pulsatile flow. They concluded that the unstable flow leads to remarkable fluid mixing and contributes to the mass-transfer enhancement. Bian et al. (2009) studied the relationship between the transitional characteristic and the enhancement mechanism in an axisymmetric wavy-walled tube under steady flow. They pointed that the most effective mass transfer enhancement occurred just before the transition flow regime. Zhang et al. (2018) experimentally analyzed the oscillatory flow in the grooved channel. They proposed that there is some difference between the experimental oscillatory fraction and the theoretical oscillatory fraction, and the experimental oscillatory fraction is close to the theoretical value with a lower Reynolds number. Huang et al. (2017) carried out the experimental study in the relationship between the characteristics of the pressure drop and the laminar pulsatile flow. They found that the overall pressure drop decreases with increase of the oscillatory frequency. Sun et al. (2010) studied the self-sustained flow in grooved channels. They found that the internal pressure of the channels strongly affects the amplitude of the self-sustained wave and increasing the pressure of the channels makes the amplitude higher.
1OTECVol. 24 (2019),1 〜 7 Characteristics of pulsatile flow with the reverse flow in the grooved channel

The present study deals with the characteristics of the pulsatile flow in the grooved channel. The effects of oscillatory frequency and Reynolds number on the experimental oscillatory fraction and the oscillatory fraction of the overall pressure drop and the local pressure are examined. 2. Experimental system
The diagram of the experimental system is shown in Fig. 1 and all the experimental apparatus are consistent with the previous ones. The city water is used as the working fluid and the net flow is provided by a centrifugal pump. The volumetric flow rate of the pulsatile is given as:
𝑄𝑄� = 𝑄𝑄� + 𝑄𝑄�sin (2𝜋𝜋𝜋𝜋𝜋𝜋𝜋 (1) where Qs is the net flow rate which is determined with a flow-meter, f is the frequency of the pulsatile flow, t is the flow time, Q0 is the amplitude of the pulsatile flow and it is expressed as:
𝑄𝑄� = 2𝜋𝜋𝜋𝜋𝜋𝜋(𝜋𝜋𝜋𝜋��/4𝜋 (2) where , Dp =50mm is the diameter of the piston.
The test section is depicted in Fig. 2. The grooved channels consist 55 grooved modules and the length of every grooved module is 𝐿𝐿 = 2𝐿𝐿𝐿, 𝑙𝑙 = 𝑙𝐿𝐿𝐿, 𝑊𝑊 = 2𝐿𝐿𝐿𝐿, ℎ = 2.5𝐿𝐿. The local pressures 𝑃𝑃�(n=1,2,3…8) are measured at different locations which are shown in Fig. 3.
①
②
③
④⑤
⑥
⑦⑧
① Circulating pump② Centrifugal pump③ Control valve④ Piston pump⑤ Test zone
⑥ Differential transducer⑦ Flow-meter⑧ Overflow tank
Fig. 1 Diagram of the experimental system
lL
h2h
Wflow direction
Fig. 2 Dimensions of the grooved channels
P1 P2 P3 P4 P5 P6 P7 P8
90 210 210 90 210 120 90
1100
Fig. 3 Locations of the local pressure measurement
Junxiu PAN, Yongning BIAN, Hirofumi ARIMA and Yasuyuki IKEGAMI2

To get a better understanding of the pulsatile flow, some parameters are defined as follows: The net flow Reynolds number (Re)
𝑅𝑅𝑅𝑅 𝑅 𝑅𝑅𝑅𝑅𝑅𝑅𝑅𝑅 (3) where 𝑅𝑅 and 𝑅𝑅 are the density and the viscosity of water respectively. The characteristic velocity of the flow u is calculated by:
𝑅𝑅 𝑅 𝑢𝑅𝑢 𝑢 𝑅𝑅� (4) where 𝑅𝑅� is calculated as follow
𝑅𝑅� 𝑅 𝑄𝑄�𝑅(𝑢𝑊𝑊𝑅𝑊 (5) The oscillatory fraction (P) of the flow rate
𝑃𝑃 𝑅 𝑄𝑄�𝑅𝑄𝑄� (6) The oscillatory fraction of the overall pressure drop (P’)
𝑃𝑃� 𝑅 (∆𝑃𝑃��� − ∆𝑃𝑃�𝑊𝑅∆𝑃𝑃� (7) where ∆𝑃𝑃��� is the instantaneous max value of the overall pressure drop, ∆𝑃𝑃� is the time-averaged pressure drop. The oscillatory fraction of the local pressure (𝑃𝑃��)
𝑃𝑃�� 𝑅 (𝑃𝑃� − 𝑃𝑃��𝑊𝑅𝑃𝑃�� (8) where 𝑃𝑃� (i=3,5,7) is the instantaneous value of the local pressure, 𝑃𝑃�� is the time-averaged value of the local pressure. The instantaneous velocity 𝑅𝑅� is depicted as:
𝑅𝑅� 𝑅 𝑅𝑅� + 𝑃𝑃 𝑢 𝑅𝑅� 𝑢 sin (𝑢𝜋𝜋𝜋𝜋𝜋𝜋𝑊 (9) The aluminum dust method is used to visualize the flow patterns. The aluminum dust method, i.e. perfusion with a suspension of aluminum particles which are about 40 m in diameter, enables us to observe the pathlines approximately corresponding to streamlines in the whole flow field. Besides, the flow patterns are recorded by a digital video camera. All the experiments are conducted at the room temperature. 3. Results and discussion 3.1 Filter processing
In order to reduce the interference of noise in the experiment, the experimental data, i.e. the signal of the volume flow rate and the pressure drop, need to be filtered. As can be seen in Fig. 4, all the experimental data are processed 1Hz low pass fit filter. Though there is a slight deviation between the experimental data and the filtered data at the beginning and end of the experiment, the filtered data in the middle section are consistent with the experimental data. Therefore the following discussions are based on the filtered data in the middle section.
0.0 0.3 0.6 0.9 1.2 1.50
20
40
60
80
100
120
140
t/T
p
p
(Pa)
P=0.8, Re=250, f=0.0432Hz
0.0 0.3 0.6 0.9 1.2 1.5
0
20
40
60
80
100
120
p (P
a)
t/T
1Hz low pass fft filter of p
0.0 0.3 0.6 0.9 1.2 1.50
20
40
60
80
100
120 P=0.8, Re=250, f=0.0432Hz
Q (m
l/s)
t/T
Q
0.0 0.3 0.6 0.9 1.2 1.50
20
40
60
80
100
120 1Hz low pass fft filter of Q
Q (m
l/s)
t/T
Fig. 4 Comparison of the experimental data with the filtered data.
Characteristics of pulsatile flow with the reverse flow in the grooved channel 3
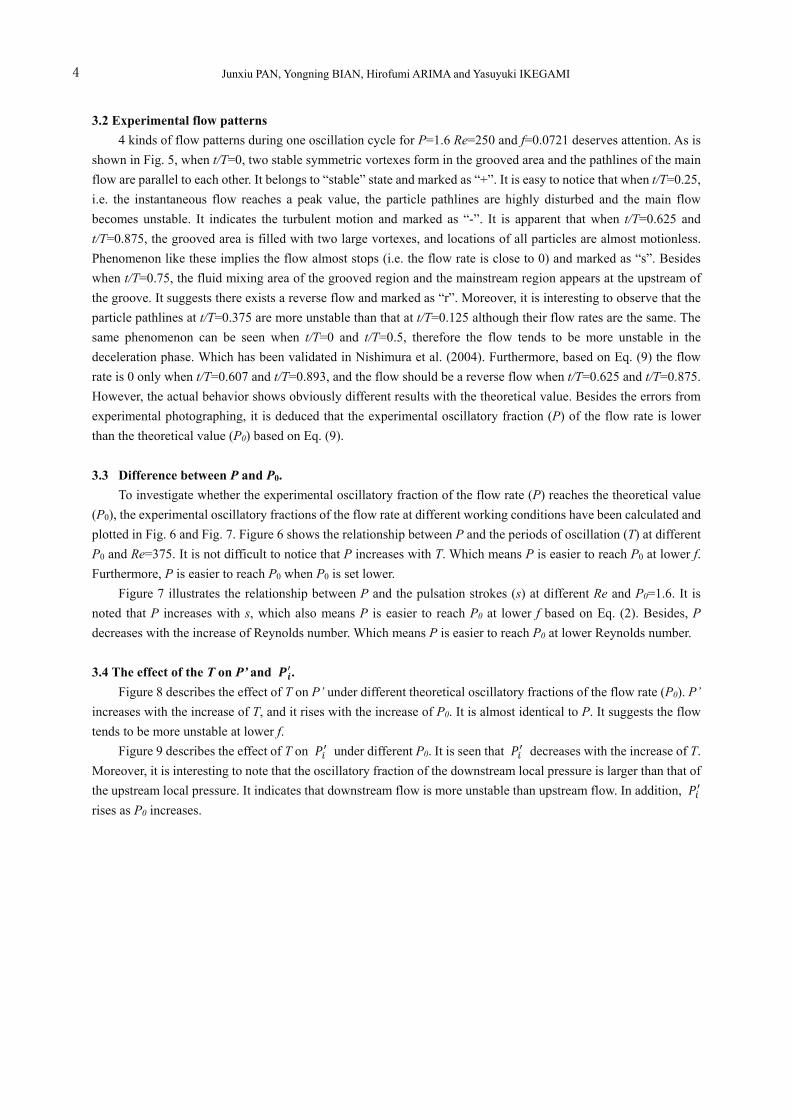
3.2 Experimental flow patterns 4 kinds of flow patterns during one oscillation cycle for P=1.6 Re=250 and f=0.0721 deserves attention. As is
shown in Fig. 5, when t/T=0, two stable symmetric vortexes form in the grooved area and the pathlines of the main flow are parallel to each other. It belongs to “stable” state and marked as “+”. It is easy to notice that when t/T=0.25, i.e. the instantaneous flow reaches a peak value, the particle pathlines are highly disturbed and the main flow becomes unstable. It indicates the turbulent motion and marked as “-”. It is apparent that when t/T=0.625 and t/T=0.875, the grooved area is filled with two large vortexes, and locations of all particles are almost motionless. Phenomenon like these implies the flow almost stops (i.e. the flow rate is close to 0) and marked as “s”. Besides when t/T=0.75, the fluid mixing area of the grooved region and the mainstream region appears at the upstream of the groove. It suggests there exists a reverse flow and marked as “r”. Moreover, it is interesting to observe that the particle pathlines at t/T=0.375 are more unstable than that at t/T=0.125 although their flow rates are the same. The same phenomenon can be seen when t/T=0 and t/T=0.5, therefore the flow tends to be more unstable in the deceleration phase. Which has been validated in Nishimura et al. (2004). Furthermore, based on Eq. (9) the flow rate is 0 only when t/T=0.607 and t/T=0.893, and the flow should be a reverse flow when t/T=0.625 and t/T=0.875. However, the actual behavior shows obviously different results with the theoretical value. Besides the errors from experimental photographing, it is deduced that the experimental oscillatory fraction (P) of the flow rate is lower than the theoretical value (P0) based on Eq. (9).
3.3 Difference between P and P0.
To investigate whether the experimental oscillatory fraction of the flow rate (P) reaches the theoretical value (P0), the experimental oscillatory fractions of the flow rate at different working conditions have been calculated and plotted in Fig. 6 and Fig. 7. Figure 6 shows the relationship between P and the periods of oscillation (T) at different P0 and Re=375. It is not difficult to notice that P increases with T. Which means P is easier to reach P0 at lower f. Furthermore, P is easier to reach P0 when P0 is set lower.
Figure 7 illustrates the relationship between P and the pulsation strokes (s) at different Re and P0=1.6. It is noted that P increases with s, which also means P is easier to reach P0 at lower f based on Eq. (2). Besides, P decreases with the increase of Reynolds number. Which means P is easier to reach P0 at lower Reynolds number. 3.4 The effect of the T on P’ and 𝑷𝑷𝒊𝒊�.
Figure 8 describes the effect of T on P’ under different theoretical oscillatory fractions of the flow rate (P0). P’ increases with the increase of T, and it rises with the increase of P0. It is almost identical to P. It suggests the flow tends to be more unstable at lower f.
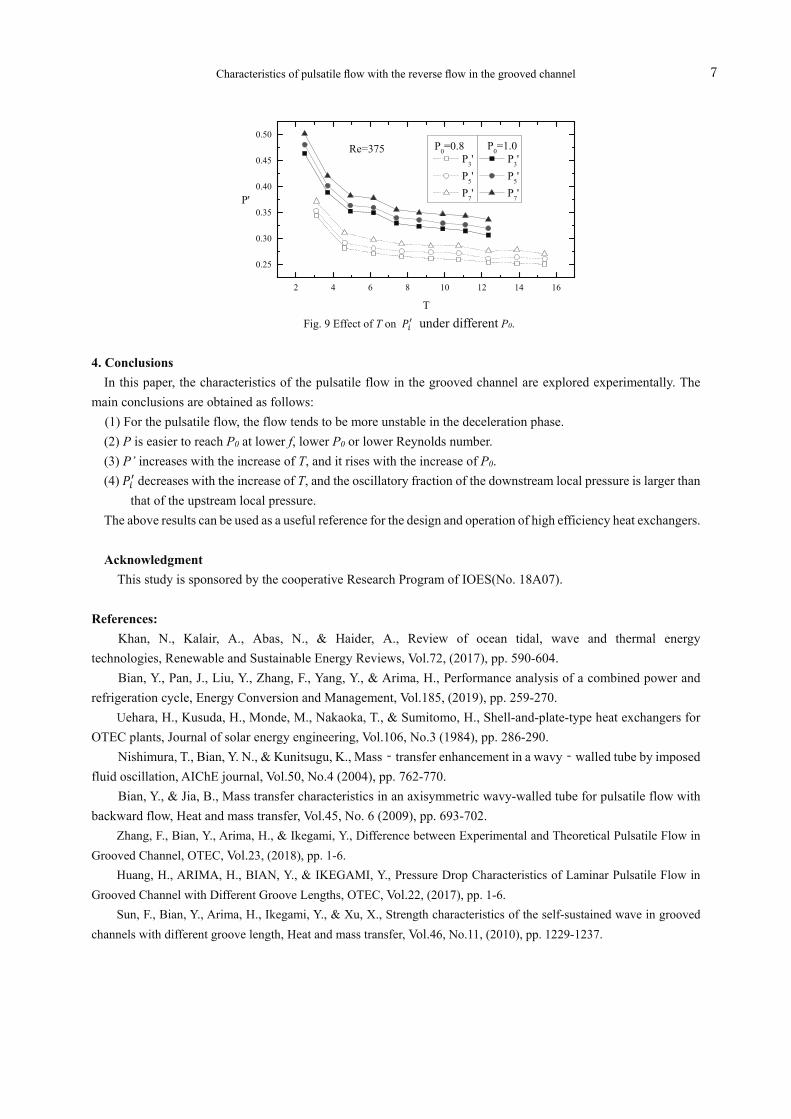
Figure 9 describes the effect of T on 𝑃𝑃�� under different P0. It is seen that 𝑃𝑃�� decreases with the increase of T. Moreover, it is interesting to note that the oscillatory fraction of the downstream local pressure is larger than that of the upstream local pressure. It indicates that downstream flow is more unstable than upstream flow. In addition, 𝑃𝑃�� rises as P0 increases.
Junxiu PAN, Yongning BIAN, Hirofumi ARIMA and Yasuyuki IKEGAMI4

Fig. 5 Experimental flow patterns for P=1.6 Re=250 and f=0.0721.
Characteristics of pulsatile flow with the reverse flow in the grooved channel 5

0 2 4 6 8 10 12 14 16 18 200.2
0.4
0.6
0.8
1.0
1.2
1.4
1.6
P
T
P0=0.8 P0=1.0 P0=1.2 P0=1.4 P0=1.6
Re=375
Fig. 6 Relationship between P and T at different P0 and Re=375.
20 40 60 80 100 120
0.2
0.4
0.6
0.8
1.0
1.2
1.4
1.6
P
s (mm)
Re=250 Re=375 Re=500 P0=1.6
Fig. 7 Relationship between P and s at different Re and P0=1.6.
0 4 8 12 16 200.2
0.3
0.4
0.5
0.6
0.7
0.8
0.9
P'
T
P0=0.8 P0=1.0
Re=375
Fig. 8 Effect of T on P’ under different P0.
Junxiu PAN, Yongning BIAN, Hirofumi ARIMA and Yasuyuki IKEGAMI6
2 4 6 8 10 12 14 16
0.25
0.30
0.35
0.40
0.45
0.50
P'
T
P3' P3' P5' P5' P7' P7'
P0=0.8 P0=1.0Re=375
Fig. 9 Effect of T on 𝑃𝑃�� under different P0.
4. Conclusions
In this paper, the characteristics of the pulsatile flow in the grooved channel are explored experimentally. The main conclusions are obtained as follows:
(1) For the pulsatile flow, the flow tends to be more unstable in the deceleration phase. (2) P is easier to reach P0 at lower f, lower P0 or lower Reynolds number. (3) P’ increases with the increase of T, and it rises with the increase of P0. (4) 𝑃𝑃�� decreases with the increase of T, and the oscillatory fraction of the downstream local pressure is larger than
that of the upstream local pressure. The above results can be used as a useful reference for the design and operation of high efficiency heat exchangers. Acknowledgment
This study is sponsored by the cooperative Research Program of IOES(No. 18A07). References:
Khan, N., Kalair, A., Abas, N., & Haider, A., Review of ocean tidal, wave and thermal energy technologies, Renewable and Sustainable Energy Reviews, Vol.72, (2017), pp. 590-604.
Bian, Y., Pan, J., Liu, Y., Zhang, F., Yang, Y., & Arima, H., Performance analysis of a combined power and refrigeration cycle, Energy Conversion and Management, Vol.185, (2019), pp. 259-270.
Uehara, H., Kusuda, H., Monde, M., Nakaoka, T., & Sumitomo, H., Shell-and-plate-type heat exchangers for OTEC plants, Journal of solar energy engineering, Vol.106, No.3 (1984), pp. 286-290.
Nishimura, T., Bian, Y. N., & Kunitsugu, K., Mass‐transfer enhancement in a wavy‐walled tube by imposed fluid oscillation, AIChE journal, Vol.50, No.4 (2004), pp. 762-770.
Bian, Y., & Jia, B., Mass transfer characteristics in an axisymmetric wavy-walled tube for pulsatile flow with backward flow, Heat and mass transfer, Vol.45, No. 6 (2009), pp. 693-702.
Zhang, F., Bian, Y., Arima, H., & Ikegami, Y., Difference between Experimental and Theoretical Pulsatile Flow in Grooved Channel, OTEC, Vol.23, (2018), pp. 1-6.
Huang, H., ARIMA, H., BIAN, Y., & IKEGAMI, Y., Pressure Drop Characteristics of Laminar Pulsatile Flow in Grooved Channel with Different Groove Lengths, OTEC, Vol.22, (2017), pp. 1-6.
Sun, F., Bian, Y., Arima, H., Ikegami, Y., & Xu, X., Strength characteristics of the self-sustained wave in grooved channels with different groove length, Heat and mass transfer, Vol.46, No.11, (2010), pp. 1229-1237.
Characteristics of pulsatile flow with the reverse flow in the grooved channel 7