Characteristics of Ozonizer Using Pulsed Power
5
CHARACTERISTICS OF OZONIZER USING PULSED POWER T. Namihira ξ , K. Shinozaki, S. Katsuki, R. Hackam* H. Akiyama and T. Sakugawa** Department of Electrical and Computer Engineering, Kumamoto University, Kurokami 2-39- 1, Kumamoto 860-8555, Japan Abstract Recently industrial applications of ozone have increased in widely different areas including oxidation, sterilization, deodorization, bleaching and others. Ozone generation has been attained using ultra violet irradiation, electrolysis and electrical discharges. The electrical discharge technique includes silent discharge, surface discharge, pulse corona discharge and superimposed silent and surface discharges. In this study, high concentration ozone was produced by using a pulsed streamer discharge under atmospheric pressure of oxygen. A magnetic pulse compressor (MPC) which has a maximum output voltage of 60 kV, a maximum pulse repetition rate of 500 pulses per second (pps) and a pulse duration of about 130 ns was used as a pulsed power source. A spiral copper wire (1 mm in diameter, 10 mm pitch) wound on PVC tubes ( 26 mm and 30 mm in outside diameters) formed the central electrode in a coaxial geometry. A copper cylinder of 60 mm in internal diameter formed the outer electrode. The ozone production characteristics of three reactors having different dimensions of the gap spacing (15 mm and 17 mm) and length (500 mm and 1000 mm) were investigated. An oxygen flow rate in the range of 1 to 3 l/min at atmospheric pressure was used. It has been found that the dependence of ozone concentration on energy density (J/l) was almost the same for the three different reactors. Typically a production yield of ozone of 100 g/kWh at 30 g/m 3 was attained. I. INTRODUCTION There is a growing worldwide interest in the production of ozone for a wide range of applications. Ozone is increasingly being used as an alternative to chlorination of potable water, treatment of indust rial wastes, bleaching processes, and chemical synthesis as well as processing of semiconductor devices. In addition the use of ozone has the advantage of less energy consumption compared to other alternatives, namely the chlorination process [1]. Historically, the major application of ozone has been in the treatment of drinking water, which is known as a potent bactericide and viricide [2]. Since ozone cannot be shipped or stored in a gaseous form due to its short lifetime, it must be generated where it is required [1]. Currently major efforts are being expended world wide to increase the efficiency of ozone production in order to reduce costs. Many studies on ozone production using dielectric barrier discharges were reported [1-4]. Usually ozone is generated in silent discharges using a dielectric barrier placed adjacent to the outer cylinder [1-3, 5] where micro discharges with a very short duration prevail at the surface of the dielectric. A dc voltage has also been used for ozone generation in a wire-cylinder geometry [6]. On the other hand, there are only few studies using pulsed corona discharges without any dielectric material between the electrodes in spite of its substantia l advantages [7-9]. In the present work, a pulsed corona discharge has been used in three different reactors. The effects of the pulse voltage, the pulse repetition rate, the gas flow rate and the discharge energy density (J/L) are reported. II. EXPERIMENTAL APPARATUS AND PROCEDURE A schematic diagram of the magnetic pulse compressor (MPC) [10], which was used as the pulsed power source, is shown in figure 1. The MPC consists of a high speed Gate Turn Off Thyristor (GTO: H10D33YFH, Meidensha Co., Japan) and a single stage pulse compression element. Following the charging of the capacitor C 0 , GTO is turned on. At the beginning, the current in GTO is reduced by the saturable inductor (SL 1 ). After the saturation of SL 1 , the stored charge in C 0 is stepped up to C 1 through GTO, the step-up pulse transformer (PT) and the saturable transformer (ST). The ST compresses the current pulse and steps up the voltage. After the saturation of ST, the charge in C 1 is transferred to the peaking capacitor (C P ). Finally C P is charged to the desired voltage. The pulses obtained were directly applied to the coaxial electrodes (Load). This setup provided the voltage and current pulses with a repetition rate of up to 500 pps. A typical duration of 130 ns, defined as the full width at half maximum (FWHM) of the pulse voltage, was measured at 35 kV output voltage. Figure 2 shows the experimental set-up. This set-up consisted of a cylinder of oxygen, the discharge chamber, an ozone monitor and the MPC. The purity of the oxygen *Department of Electrical and Computer Engineering , University of Windsor, Canada **Meidensha Corporation, Japan ξ E-mail: [email protected] umammoto-u.ac.jp 0-7803-7120-8/02/$17.00 © 2002 IEEE
-
Upload
the-nikola-tesla-institute -
Category
Documents
-
view
214 -
download
0
Transcript of Characteristics of Ozonizer Using Pulsed Power
7/29/2019 Characteristics of Ozonizer Using Pulsed Power
http://slidepdf.com/reader/full/characteristics-of-ozonizer-using-pulsed-power 1/4
CHARACTERISTICS OF OZONIZER USING PULSED POWER
T. Namihiraξ, K. Shinozaki, S. Katsuki, R. Hackam* H. Akiyama and T. Sakugawa** Department of Electrical and Computer Engineering, Kumamoto University, Kurokami 2-39-1, Kumamoto 860-8555, Japan
Abstract
Recently industrial applications of ozone have increased
in widely different areas including oxidation, sterilization,
deodorization, bleaching and others. Ozone generation has
been attained using ultra violet irradiation, electrolysis andelectrical discharges. The electrical discharge technique
includes silent discharge, surface discharge, pulse corona
discharge and superimposed silent and surface discharges.
In this study, high concentration ozone was produced by
using a pulsed streamer discharge under atmospheric pressure of oxygen. A magnetic pulse compressor (MPC)
which has a maximum output voltage of 60 kV, a maximum
pulse repetition rate of 500 pulses per second (pps) and a
pulse duration of about 130 ns was used as a pulsed power source. A spiral copper wire (1 mm in diameter, 10 mm
pitch) wound on PVC tubes (26 mm and 30 mm in outside
diameters) formed the central electrode in a coaxial
geometry. A copper cylinder of 60 mm in internal diameter
formed the outer electrode. The ozone production
characteristics of three reactors having different dimensions
of the gap spacing (15 mm and 17 mm) and length (500 mm
and 1000 mm) were investigated. An oxygen flow rate in
the range of 1 to 3 l/min at atmospheric pressure was used.It has been found that the dependence of ozone
concentration on energy density (J/l) was almost the same
for the three different reactors. Typically a production yield
of ozone of 100 g/kWh at 30 g/m3
was attained.
I. INTRODUCTION
There is a growing worldwide interest in the production
of ozone for a wide range of applications. Ozone is
increasingly being used as an alternative to chlorination of potable water, treatment of industrial wastes, bleaching
processes, and chemical synthesis as well as processing of
semiconductor devices. In addition the use of ozone has the
advantage of less energy consumption compared to other
alternatives, namely the chlorination process [1].
Historically, the major application of ozone has been in thetreatment of drinking water, which is known as a potent
bactericide and viricide [2]. Since ozone cannot be shipped
or stored in a gaseous form due to its short lifetime, it must
be generated where it is required [1]. Currently major
efforts are being expended world wide to increase the
efficiency of ozone production in order to reduce costs.
Many studies on ozone production using dielectric barrier discharges were reported [1-4]. Usually ozone is generated
in silent discharges using a dielectric barrier placed adjacent
to the outer cylinder [1-3, 5] where micro discharges with a
very short duration prevail at the surface of the dielectric. A
dc voltage has also been used for ozone generation in a
wire-cylinder geometry [6]. On the other hand, there areonly few studies using pulsed corona discharges without
any dielectric material between the electrodes in spite of its
substantial advantages [7-9].
In the present work, a pulsed corona discharge has been
used in three different reactors. The effects of the pulsevoltage, the pulse repetition rate, the gas flow rate and the
discharge energy density (J/L) are reported.
II. EXPERIMENTAL APPARATUS AND
PROCEDURE
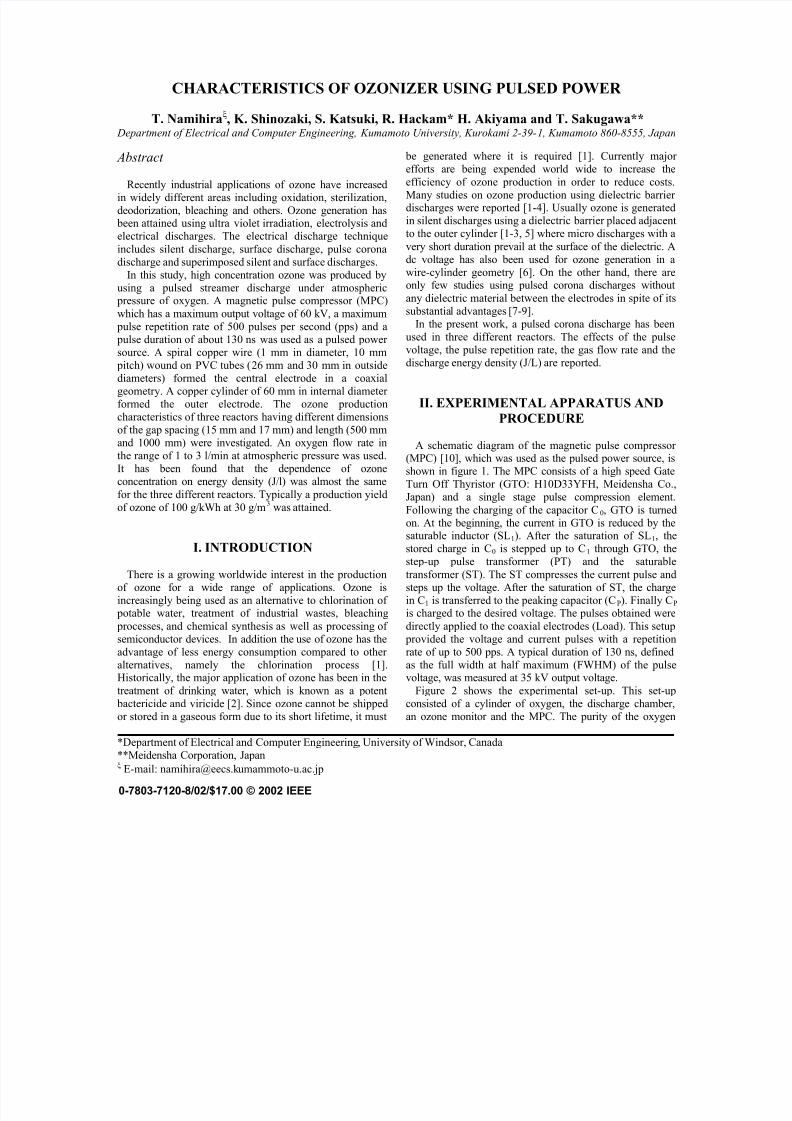
A schematic diagram of the magnetic pulse compressor
(MPC) [10], which was used as the pulsed power source, isshown in figure 1. The MPC consists of a high speed Gate
Turn Off Thyristor (GTO: H10D33YFH, Meidensha Co.,
Japan) and a single stage pulse compression element.
Following the charging of the capacitor C0, GTO is turned
on. At the beginning, the current in GTO is reduced by thesaturable inductor (SL1). After the saturation of SL1, the
stored charge in C0 is stepped up to C1 through GTO, the
step-up pulse transformer (PT) and the saturable
transformer (ST). The ST compresses the current pulse and
steps up the voltage. After the saturation of ST, the charge
in C1 is transferred to the peaking capacitor (CP). Finally CP is charged to the desired voltage. The pulses obtained were
directly applied to the coaxial electrodes (Load). This setup
provided the voltage and current pulses with a repetition
rate of up to 500 pps. A typical duration of 130 ns, defined
as the full width at half maximum (FWHM) of the pulse
voltage, was measured at 35 kV output voltage.Figure 2 shows the experimental set-up. This set-up
consisted of a cylinder of oxygen, the discharge chamber,
an ozone monitor and the MPC. The purity of the oxygen
*Department of Electrical and Computer Engineering, University of Windsor, Canada
**Meidensha Corporation, Japanξ E-mail: [email protected]
0 7803 7120 8/02/$17 00 © 2002 IEEE
7/29/2019 Characteristics of Ozonizer Using Pulsed Power
http://slidepdf.com/reader/full/characteristics-of-ozonizer-using-pulsed-power 2/4
cylinder was 99.5 % (Kumamoto Sanso, Japan). The gas
flow rate and the ozone concentration were monitored by
means of a flow-stat meter (FLOWLINE model SEF-1R,
STEC, Japan) and ultraviolet (UV) ray absorption ozonemeter (DOA 300, Ebara, Japan). The UV absorption
measurements were carried out at 253.7 nm where theabsorption cross-section is large at 1.14×××× 10-21
m2
[1, 11].
Gas flow rates in the range of 0.5 to 3.0 l/min were used.
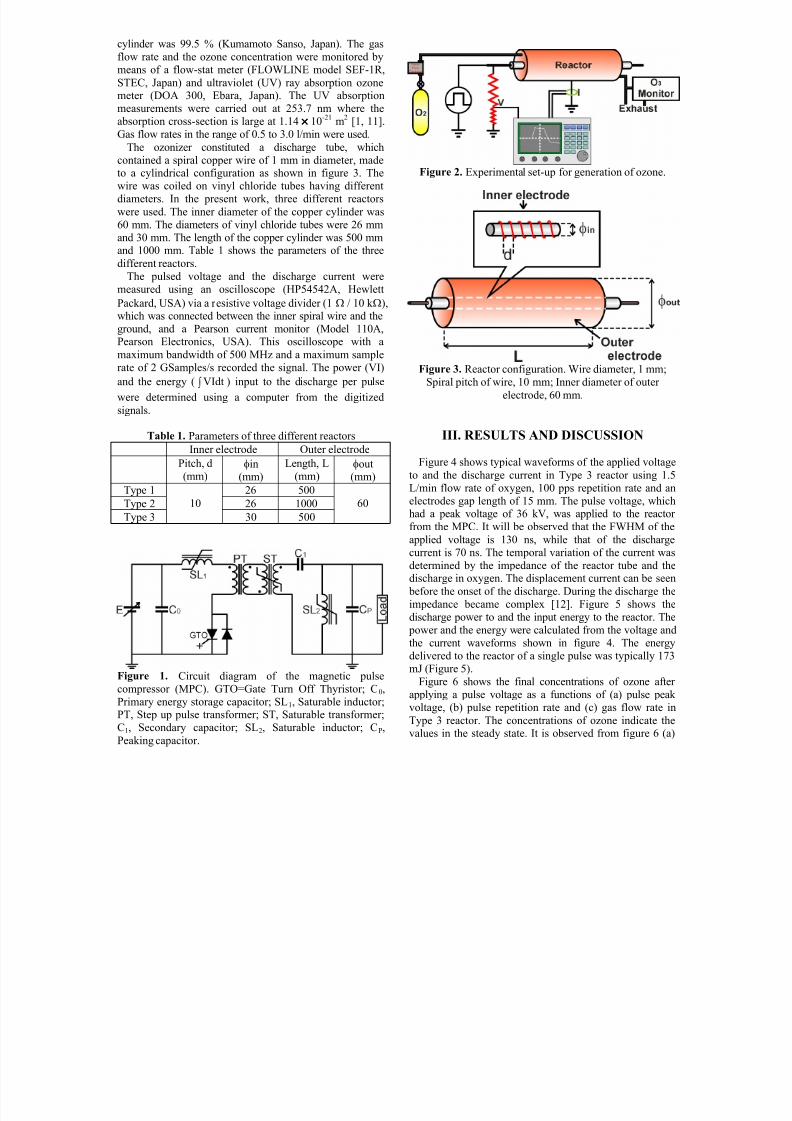
The ozonizer constituted a discharge tube, which
contained a spiral copper wire of 1 mm in diameter, madeto a cylindrical configuration as shown in figure 3. The
wire was coiled on vinyl chloride tubes having different
diameters. In the present work, three different reactors
were used. The inner diameter of the copper cylinder was
60 mm. The diameters of vinyl chloride tubes were 26 mmand 30 mm. The length of the copper cylinder was 500 mmand 1000 mm. Table 1 shows the parameters of the three
different reactors.
The pulsed voltage and the discharge current were
measured using an oscilloscope (HP54542A, Hewlett
Packard, USA) via a resistive voltage divider (1 Ω / 10 k Ω),which was connected between the inner spiral wire and the
ground, and a Pearson current monitor (Model 110A,
Pearson Electronics, USA). This oscilloscope with amaximum bandwidth of 500 MHz and a maximum sample
rate of 2 GSamples/s recorded the signal. The power (VI)
and the energy ( ∫VIdt ) input to the discharge per pulse
were determined using a computer from the digitized
signals.
Table 1. Parameters of three different reactors
Inner electrode Outer electrodePitch, d
(mm)φin
(mm)
Length, L
(mm)φout(mm)
Type 1 26 500
Type 2 26 1000
Type 3
10
30 500
60
Figure 1. Circuit diagram of the magnetic pulsecompressor (MPC). GTO=Gate Turn Off Thyristor; C0,
Primary energy storage capacitor; SL1, Saturable inductor;PT, Step up pulse transformer; ST, Saturable transformer;
C1, Secondary capacitor; SL2, Saturable inductor; CP,
Peaking capacitor.
Figure 2. Experimental set-up for generation of ozone.
Figure 3. Reactor configuration. Wire diameter, 1 mm;
Spiral pitch of wire, 10 mm; Inner diameter of outer
electrode, 60 mm.
III. RESULTS AND DISCUSSION
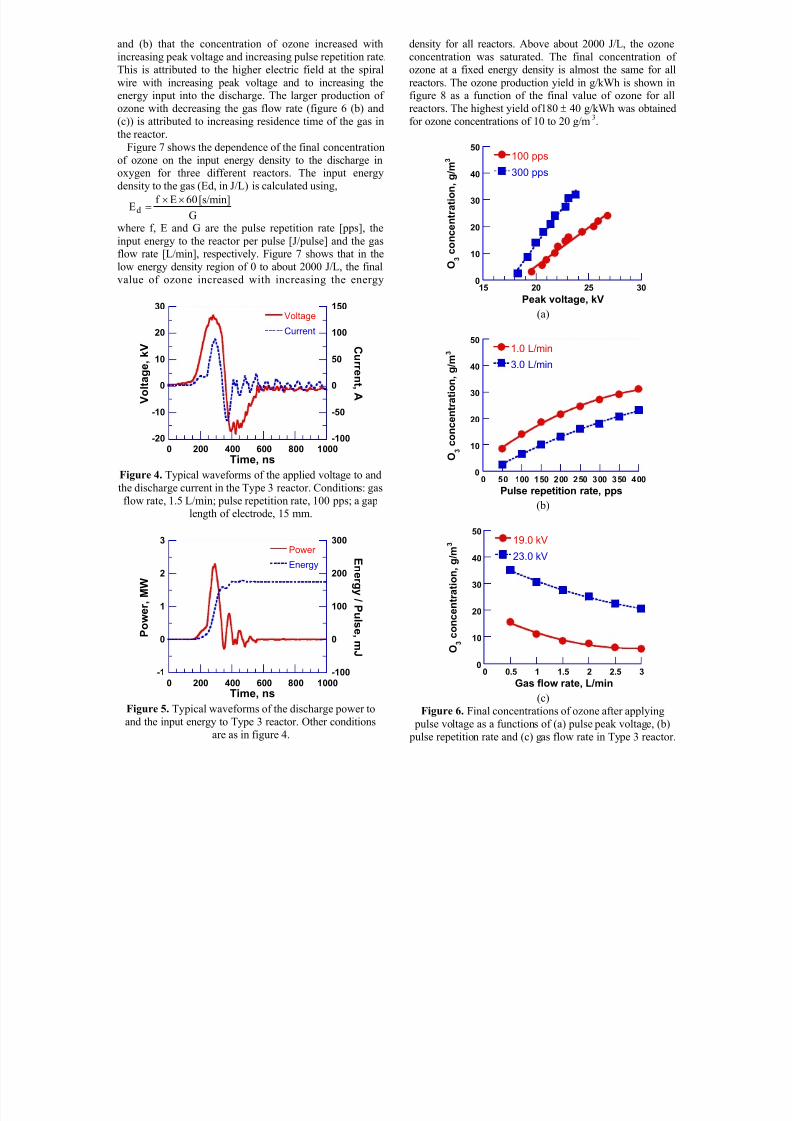
Figure 4 shows typical waveforms of the applied voltage
to and the discharge current in Type 3 reactor using 1.5
L/min flow rate of oxygen, 100 pps repetition rate and an
electrodes gap length of 15 mm. The pulse voltage, whichhad a peak voltage of 36 kV, was applied to the reactor
from the MPC. It will be observed that the FWHM of the
applied voltage is 130 ns, while that of the discharge
current is 70 ns. The temporal variation of the current was
determined by the impedance of the reactor tube and thedischarge in oxygen. The displacement current can be seen
before the onset of the discharge. During the discharge the
impedance became complex [12]. Figure 5 shows the
discharge power to and the input energy to the reactor. The
power and the energy were calculated from the voltage and
the current waveforms shown in figure 4. The energy
delivered to the reactor of a single pulse was typically 173
mJ (Figure 5).
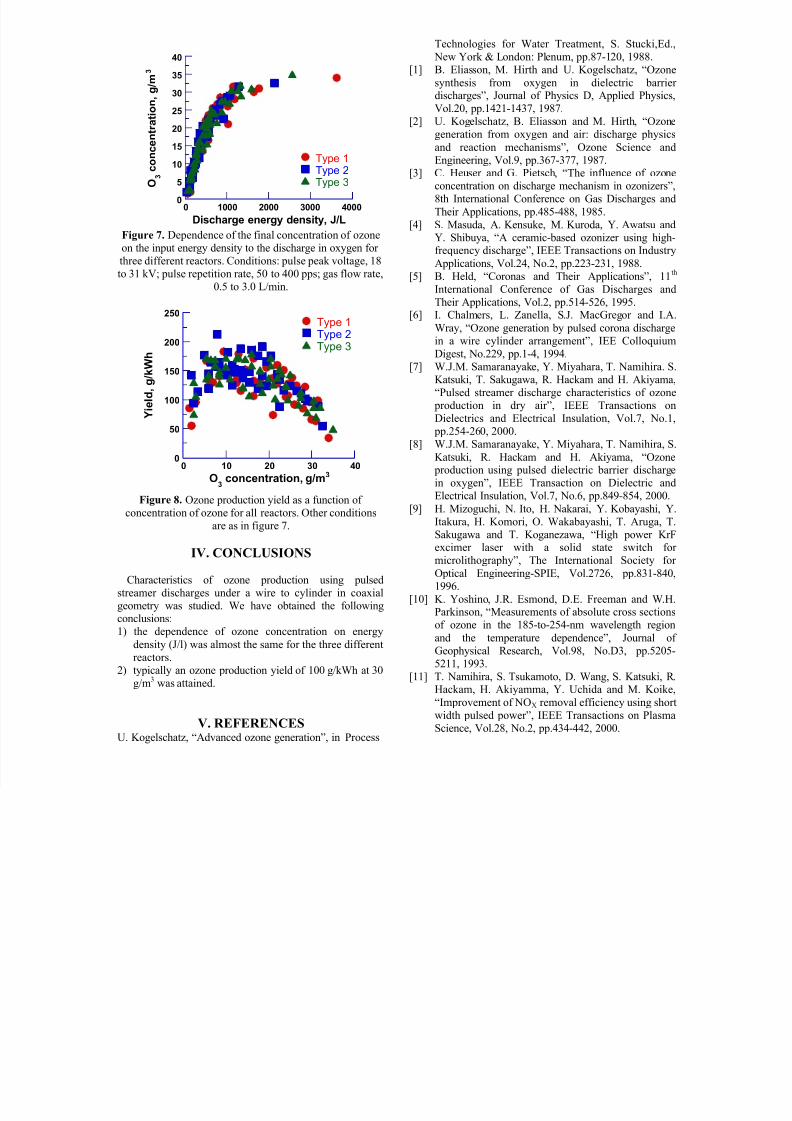
Figure 6 shows the final concentrations of ozone after applying a pulse voltage as a functions of (a) pulse peak
voltage, (b) pulse repetition rate and (c) gas flow rate in
Type 3 reactor. The concentrations of ozone indicate thevalues in the steady state. It is observed from figure 6 (a)
7/29/2019 Characteristics of Ozonizer Using Pulsed Power
http://slidepdf.com/reader/full/characteristics-of-ozonizer-using-pulsed-power 3/4
and (b) that the concentration of ozone increased with
increasing peak voltage and increasing pulse repetition rate.
This is attributed to the higher electric field at the spiral
wire with increasing peak voltage and to increasing theenergy input into the discharge. The larger production of
ozone with decreasing the gas flow rate (figure 6 (b) and(c)) is attributed to increasing residence time of the gas in
the reactor.
Figure 7 shows the dependence of the final concentration
of ozone on the input energy density to the discharge inoxygen for three different reactors. The input energy
density to the gas (Ed, in J/L) is calculated using,
G
[s/min]60Ef Ed
××=
where f, E and G are the pulse repetition rate [pps], theinput energy to the reactor per pulse [J/pulse] and the gasflow rate [L/min], respectively. Figure 7 shows that in the
low energy density region of 0 to about 2000 J/L, the final
value of ozone increased with increasing the energy
-20
-10
0
10
20
30
-100
-50
0
50
100
150
0 200 400 600 800 1000
Voltage
Current
V o l t a g e , k V C
ur r en t ,A
Time, ns Figure 4. Typical waveforms of the applied voltage to and
the discharge current in the Type 3 reactor. Conditions: gas
flow rate, 1.5 L/min; pulse repetition rate, 100 pps; a gaplength of electrode, 15 mm.
-1
0
1
2
3
-100
0
100
200
300
0 200 400 600 800 1000
Power
Energy
P o w e r , M W
E n er g y / P ul s e ,m J
Time, ns Figure 5. Typical waveforms of the discharge power to
and the input energy to Type 3 reactor. Other conditions
are as in figure 4.
density for all reactors. Above about 2000 J/L, the ozone
concentration was saturated. The final concentration of
ozone at a fixed energy density is almost the same for all
reactors. The ozone production yield in g/kWh is shown infigure 8 as a function of the final value of ozone for all
reactors. The highest yield of180± 40 g/kWh was obtainedfor ozone concentrations of 10 to 20 g/m3.
0
10
20
30
40
50
15 20 25 30
100 pps
300 pps
O 3 c o n c e
n t r a t i o n , g / m 3
Peak voltage, kV (a)
0
10
20
30
40
50
0 50 100 150 200 250 300 350 400
1.0 L/min
3.0 L/min
O 3 c o n c e n t r a t i o n , g / m 3
Pulse repetition rate, pps (b)
0
10
20
30
40
50
0 0.5 1 1.5 2 2.5 3
19.0 kV
23.0 kV
O 3 c o n c e n t r a t i o n ,
g / m 3
Gas flow rate, L/min (c)
Figure 6. Final concentrations of ozone after applying
pulse voltage as a functions of (a) pulse peak voltage, (b)
pulse repetition rate and (c) gas flow rate in Type 3 reactor.
7/29/2019 Characteristics of Ozonizer Using Pulsed Power
http://slidepdf.com/reader/full/characteristics-of-ozonizer-using-pulsed-power 4/4
0
5
10
15
20
25
30
35
40
0 1000 2000 3000 4000
Type 1Type 2Type 3 O
3 c o n c e n t r a t i o n , g / m 3
Discharge energy density, J/L Figure 7. Dependence of the final concentration of ozone
on the input energy density to the discharge in oxygen for
three different reactors. Conditions: pulse peak voltage, 18
to 31 kV; pulse repetition rate, 50 to 400 pps; gas flow rate,
0.5 to 3.0 L/min.
0
50
100
150
200
250
0 10 20 30 40
Type 1Type 2Type 3
Y i e l d , g / k W h
O3
concentration, g/m3
Figure 8. Ozone production yield as a function of
concentration of ozone for all reactors. Other conditions
are as in figure 7.
IV. CONCLUSIONS
Characteristics of ozone production using pulsed
streamer discharges under a wire to cylinder in coaxial
geometry was studied. We have obtained the followingconclusions:
1) the dependence of ozone concentration on energy
density (J/l) was almost the same for the three different
reactors.
2) typically an ozone production yield of 100 g/kWh at 30
g/m3 was attained.
V. REFERENCESU. Kogelschatz, “Advanced ozone generation”, in Process
Technologies for Water Treatment, S. Stucki,Ed.,
New York & London: Plenum, pp.87-120, 1988.
[1] B. Eliasson, M. Hirth and U. Kogelschatz, “Ozone
synthesis from oxygen in dielectric barrier discharges”, Journal of Physics D, Applied Physics,
Vol.20, pp.1421-1437, 1987.[2] U. Kogelschatz, B. Eliasson and M. Hirth, “Ozone
generation from oxygen and air: discharge physics
and reaction mechanisms”, Ozone Science and
Engineering, Vol.9, pp.367-377, 1987.[3] C. Heuser and G. Pietsch, “The influence of ozone
concentration on discharge mechanism in ozonizers”,
8th International Conference on Gas Discharges and
Their Applications, pp.485-488, 1985.
[4] S. Masuda, A. Kensuke, M. Kuroda, Y. Awatsu andY. Shibuya, “A ceramic-based ozonizer using high-frequency discharge”, IEEE Transactions on Industry
Applications, Vol.24, No.2, pp.223-231, 1988.
[5] B. Held, “Coronas and Their Applications”, 11th
International Conference of Gas Discharges and
Their Applications, Vol.2, pp.514-526, 1995.[6] I. Chalmers, L. Zanella, S.J. MacGregor and I.A.
Wray, “Ozone generation by pulsed corona discharge
in a wire cylinder arrangement”, IEE ColloquiumDigest, No.229, pp.1-4, 1994.
[7] W.J.M. Samaranayake, Y. Miyahara, T. Namihira. S.
Katsuki, T. Sakugawa, R. Hackam and H. Akiyama,
“Pulsed streamer discharge characteristics of ozone
production in dry air”, IEEE Transactions on
Dielectrics and Electrical Insulation, Vol.7, No.1,
pp.254-260, 2000.
[8] W.J.M. Samaranayake, Y. Miyahara, T. Namihira, S.
Katsuki, R. Hackam and H. Akiyama, “Ozone production using pulsed dielectric barrier discharge
in oxygen”, IEEE Transaction on Dielectric and
Electrical Insulation, Vol.7, No.6, pp.849-854, 2000.
[9] H. Mizoguchi, N. Ito, H. Nakarai, Y. Kobayashi, Y.
Itakura, H. Komori, O. Wakabayashi, T. Aruga, T.
Sakugawa and T. Koganezawa, “High power KrFexcimer laser with a solid state switch for
microlithography”, The International Society for
Optical Engineering-SPIE, Vol.2726, pp.831-840,
1996.
[10] K. Yoshino, J.R. Esmond, D.E. Freeman and W.H.Parkinson, “Measurements of absolute cross sections
of ozone in the 185-to-254-nm wavelength region
and the temperature dependence”, Journal of
Geophysical Research, Vol.98, No.D3, pp.5205-
5211, 1993.
[11] T. Namihira, S. Tsukamoto, D. Wang, S. Katsuki, R.Hackam, H. Akiyamma, Y. Uchida and M. Koike,
“Improvement of NOX removal efficiency using short
width pulsed power”, IEEE Transactions on Plasma
Science, Vol.28, No.2, pp.434-442, 2000.