Characteristics, Engagement and Academic Performance of ... · Characteristics, Engagement and...
220
Characteristics, Engagement and Academic Performance of First-Year Nursing Students in Selected Ontario Universities by Rupinder Khaira A thesis submitted in conformity with the requirements for the degree of Doctor of Philosophy Department of Leadership, Higher and Adult Education Ontario Institute for Studies in Education University of Toronto © Copyright by Rupinder Khaira 2016
Transcript of Characteristics, Engagement and Academic Performance of ... · Characteristics, Engagement and...

Characteristics, Engagement and Academic Performance of
First-Year Nursing Students in Selected Ontario Universities
by
Rupinder Khaira
A thesis submitted in conformity with the requirements
for the degree of Doctor of Philosophy
Department of Leadership, Higher and Adult Education
Ontario Institute for Studies in Education
University of Toronto
© Copyright by Rupinder Khaira 2016

ii
CHARACTERISTICS, ENGAGEMENT AND ACADEMIC PERFORMANCE OF
FIRST-YEAR NURSING STUDENTS IN SELECTED ONTARIO UNIVERSITIES
Rupinder Khaira
Doctor of Philosophy
Department of Leadership, Higher Education and Adult Education
Ontario Institute for Studies in Education
University of Toronto
2016
Abstract
With an aging population nationally, nursing programs have struggled to meet the
demand for nurses in our healthcare system. Student attrition remains high at 28% within the first
two years of the Baccalaureate nursing programs. In order to meet healthcare system demand,
nursing programs need to ensure that students persist, graduate, and are academically successful
on the national examination. As a first step in student success, one needs to identify effective
educational practices in first-year nursing programs that are associated with student engagement
within the Canadian context. Extensive research in the U.S. has examined educational practices
and student engagement. However, few national or international studies examined nursing
student characteristics and engagement and student success.
This study examined the extent to which first-year nursing students are engaged in
effective educational practices and any relationships between student demographic, external,
academic, social, and institutional variables, and student engagement. A descriptive correlational
design was used to conduct a secondary analysis of pre-existing 2008 National Survey of Student
Engagement (NSSE) data from nursing students in 13 Ontario Universities. Descriptive statistics
were computed to examine student characteristics and the distribution of NSSE benchmark
iii
scores. Step-wise multiple regression analysis was used to identify relationships between
predictor variables and student engagement and academic performance (grade point average).
The results identified several significant predictors of first-year nursing student
engagement including age, ethnicity, hours spent preparing for class per week, grade point
average, hours per week spent participating in cocurricular activities, participating in physical
fitness activities, and institutional size. Being a first-generation student and age were significant
predictors of academic performance for first-year nursing students.
The findings provide insight into some of the drivers of engagement in first-year nursing
education and may also inform policy and practice for improving nursing student engagement
and, ultimately, graduation rates.

iv
Acknowledgements
Over the past five years I have received the support, encouragement, and motivation from
a number of people who shared their valuable time and knowledge with me.
I would like to thank my thesis supervisor Dr. Peter Dietsche for his unwavering support,
insight and valuable expertise in my research and writing. I would also like to thank my
committee members, Dr. Katharine Janzen and Dr. Leesa Wheelahan, for their support and
feedback as I moved through the different stages of my thesis.
I would like to thank, Professor Hyacinth Jackson, a fellow colleague, friend, and mentor
who has helped me through the years with motivating talks, listening to my ideas, and
proofreading my thesis.
I would like to thank my husband, Gurpreet, for his ongoing patience, motivation, and
faith in me to achieve “our” goal. I am proud of my children, Esha and Arjun, who have seen me
study and write since their early toddler years and have grown up being very supportive. Thank
you for taking care of mommy by making tea, cleaning up and help take of things around the
house. You kids are awesome! I am also grateful to my mom for her support and encouragement.
I would like to dedicate my thesis to my father, Iqbal Khaira, who has inspired and
motivated me from childhood to always do better. I started my thesis to ‘make you proud dad’,
however you are no longer with us here today as I achieve my doctorate. You have been missed
very much. You were and always will be my friend, and mentor.

v
Table of Contents
Abstract.......................................................................................................................................... ii
Acknowledgements ...................................................................................................................... iv
List of Acronyms ........................................................................................................................... x
Chapter One: Introduction .......................................................................................................... 1
Introduction ................................................................................................................................. 1
Background Statement of the Problem ........................................................................................ 3
Purpose of the Research .............................................................................................................. 4
Rationale and Significance of the Study ..................................................................................... 5
Researcher’s Interest ................................................................................................................... 7
Worldview ................................................................................................................................... 9
Purpose statement ...................................................................................................................... 10
Research Questions ................................................................................................................... 10
Theoretical Frameworks of Student Engagement Studies ........................................................ 10
Pace’s quality of effort. ......................................................................................................... 11
Astin’s College Impact Models. ............................................................................................ 12
Tinto’s Theory of Student Departure. ................................................................................... 14
Pascarella’s General Model for Assessing Change. .............................................................. 15
Chickering and Gamson’s Good Practices in Undergraduate Education. ............................. 16
Scope and Limitations of the Research ..................................................................................... 18
Chapter Outlines ........................................................................................................................ 20
Terms and Definitions ............................................................................................................... 21
Chapter Two: Literature Review .............................................................................................. 27
What is student engagement? .................................................................................................... 27
Studies of student engagement in higher education .................................................................. 29
Demographic variables. ......................................................................................................... 30
External Variables. ................................................................................................................ 36
Academic variables. .............................................................................................................. 39
Social Variables. .................................................................................................................... 42
Institutional Variable. ............................................................................................................ 45
Studies of student engagement in nursing ................................................................................. 47
Predicting success in nursing students. ................................................................................. 48
Predicting retention in nursing students. ............................................................................... 52
The use of active learning strategies in nursing education. ................................................... 53
Benchmarking nursing student engagement. ......................................................................... 55
Linking Student Engagement and Nursing Student Academic Success ................................... 58

vi
Instruments to measure student engagement ............................................................................. 59
The National Survey of Student Engagement (NSSE). ......................................................... 60
Summary ................................................................................................................................... 63
Chapter Three: Research Design and Methodology ............................................................... 66
Research Method and Design .................................................................................................... 66
Instrument .................................................................................................................................. 67
Study variables, coding and source of data ............................................................................... 72
Sample characteristics ............................................................................................................... 82
Inclusion criteria. ................................................................................................................... 82
Data Collection and Recording ................................................................................................. 83
Data Analysis ............................................................................................................................ 83
Methodological Assumptions .................................................................................................... 87
Limitations................................................................................................................................. 87
Ethical Issues and considerations .............................................................................................. 90
Summary ................................................................................................................................... 90
Chapter Four: Results ................................................................................................................ 91
Research Question One ............................................................................................................. 91
Demographic variables. ......................................................................................................... 91
External variables. ................................................................................................................. 92
Academic variables. .............................................................................................................. 93
Social variables. ..................................................................................................................... 93
Institutional variable. ............................................................................................................. 94
Research Question Two............................................................................................................. 94
Research Question Three......................................................................................................... 100
Stage One – Predictor Selection. ......................................................................................... 101
Stage Two - Regression of significant predictor variables. ................................................. 114
Research Question Four .......................................................................................................... 131
Research Question Five ........................................................................................................... 134
Summary ................................................................................................................................. 137
Chapter Five: Discussion, Implications, Recommendations and Conclusion ..................... 140
Discussion of Findings ............................................................................................................ 140
Research Question One. ...................................................................................................... 140
Research Question Two. ...................................................................................................... 151
Research Question Three. .................................................................................................... 156
Research Question Four. ..................................................................................................... 167
Research Question Five. ...................................................................................................... 169
Implications and Recommendations ....................................................................................... 171
Conclusion ............................................................................................................................... 175
References .................................................................................................................................. 178
vii
Appendix A ................................................................................................................................ 190
Appendix B ................................................................................................................................ 198
Appendix C ................................................................................................................................ 202
Appendix D ................................................................................................................................ 203
Appendix E ................................................................................................................................ 205
Appendix F ................................................................................................................................ 207
Appendix G ................................................................................................................................ 210

viii
List of Tables
Table 1 Proposed Model of Nursing Student Engagement ........................................................... 64
Table 2 First-Year NSSE 2008 Mean Benchmark Scale Scores ................................................... 72
Table 3 Research Questions and Sources of Data ........................................................................ 81
Table 4 Distribution of the Five NSSE Benchmark Scores for the Nursing Students ................... 95
Table 5 Significant Demographic Predictors of Level of Academic Challenge (LAC) Scores .. 102
Table 6 Significant Demographic Predictors of Active and Collaborative Learning (ACL) Scores
............................................................................................................................................. 103
Table 7 Significant Demographic Predictors of Student-Faculty Interaction (SFI) Scores ....... 104
Table 8 Significant Demographic Predictors of Enriching Educational Experience (EEE) Scores
............................................................................................................................................. 105
Table 9 Significant Demographic Predictors of Supportive Campus Environment (SCE) Scores
............................................................................................................................................. 106
Table 10 Significant Academic Predictors of Level of Academic Challenge (LAC) Scores ....... 107
Table 11 Significant Academic Predictors of Active and Collaborative Learning (ACL) Scores
............................................................................................................................................. 107
Table 12 Significant Academic Predictors of Student-Faculty Interaction (SFI) Scores ........... 108
Table 13 Significant Academic Predictors of Enriching Educational Experience (EEE) Scores
............................................................................................................................................. 109
Table 14 Significant Academic Predictors of Supportive Campus Environment (SCE) Scores . 109
Table 15 Significant Social Predictors of Level of Academic Challenge (LAC) Scores ............ 110
Table 16 Significant Social Predictors of Active and Collaborative Learning (ACL) Scores .... 111
Table 17 Significant Social Predictors of Student-Faculty Interaction (SFI) Scores ................. 111
Table 18 Significant Social Predictors of Enriching Educational Experience (EEE) Scores .... 112
Table 19 Significant Social Predictors of Supportive Campus Environment (SCE) Scores ....... 112
Table 20 Significant Institutional Predictor of Active and Collaborative Learning (ACL) Scores
............................................................................................................................................. 113
Table 21 Significant Institutional Predictor of Student-Faculty Interaction (SFI) Scores ......... 114
Table 22 Significant Institutional Predictor of Enriching Educational Experience (EEE) Scores
............................................................................................................................................. 114
Table 23 Significant Predictor Variable of LAC Scores ............................................................. 116
Table 24 Significant Predictor Variables of ACL Scores ........................................................... 117
Table 25 Significant Predictor Variables of SFI Scores ............................................................. 123
Table 26 Significant Predictor Variables of EEE Scores ........................................................... 126
Table 27 Significant Predictor Variables of SCE Scores ........................................................... 129
Table 28 Spearman Analysis for the Relationship between Institution Size and NSSE Scores .. 132
Table 29 Significant Demographic Predictor Variables of Academic Performance ................. 135
Table 30 Summary of Significant Predictor Variables of Nursing Student Engagement ........... 139
Table 31 A Comparison of First-Year NSSE 2008 Mean Benchmark Scale Scores ................... 156

ix
List of Figures
Figure 1. Distribution of the Level of Academic Challenge scores (LAC). ................................. 97
Figure 2. Distribution of the Active and Collaborative Learning scores (ACL). ......................... 98
Figure 3. Distribution of the Student-Faculty Interaction scores (SFI). ....................................... 98
Figure 4. Distribution of the Enriching Educational Experiences scores (EEE). ......................... 99
Figure 5. Distribution of the Supportive Campus Environment scores (SCE). ............................ 99
Figure 6. A dot plot of the relationship between LAC scores and participating in cocurricular
activities. .............................................................................................................................. 116
Figure 7. A dot plot of the relationship between ACL scores and institution size. .................... 119
Figure 8. A dot plot of the relationship between ACL scores and hours spent preparing for class.
............................................................................................................................................. 120
Figure 9. A dot plot of the relationship between ACL scores and hours spent participating in
cocurricular activities. .......................................................................................................... 120
Figure 10. A dot plot of the relationship between ACL scores and ethnicity. ........................... 121
Figure 11. A dot plot of the relationship between ACL scores and student age. ....................... 122
Figure 12. A dot plot of the relationship between SFI scores and participating in cocurricular
activities. .............................................................................................................................. 124
Figure 13. A dot plot of the relationship between SFI scores and Institution Size. ................... 124
Figure 14. A dot plot of the relationship between SFI scores and ethnicity. ............................. 125
Figure 15. A dot plot of the relationship between EEE scores and exercise or participation in
physical fitness activities. .................................................................................................... 127
Figure 16. A dot plot of the relationship between EEE scores and self-reported GPA. ............ 127
Figure 17. A dot plot of the relationship between EEE scores and institution size. .................. 128
Figure 18. A dot plot of the relationship between SCE scores and hours spent preparing for class.
............................................................................................................................................. 130
Figure 19. A dot plot of the relationship between SCE scores and the participation of the student
in exercise or physical fitness activities. .............................................................................. 130
Figure 20. A dot plot of the relationship between ACL scores and institution size. .................. 132
Figure 21. A dot plot of the relationship between SFI scores and institution size. .................... 133
Figure 22. A dot plot of the relationship between EEE scores and institution size. .................. 134
Figure 23. A dot plot of the relationship between first generation student and percent grades. 136
Figure 24. A dot plot of the relationship between age and percent grades. ............................... 137

x
List of Acronyms
ACL – Active and Collaborative Learning
BNP - Baccalaureate nursing program
CASN - Canadian Association of Schools of Nursing
CIHI - Canadian Institute for Health Information
CNA – Canadian Nurses Association
EEE – Enriched Educational Experience
GPA - Grade point average
LAC – Level of Academic Challenge
NSSE - National Survey of Student Engagement
SCE – Supportive Campus Environment
SFI – Student-Faculty Interaction

1
Chapter One: Introduction
Introduction
Canada’s health care system is faced with many challenges. One may argue that the
genesis of some of these issues lies within the current nursing shortage. The Canadian Nurses
Association ([CNA], 2009) projects that the shortage will increase from 11,000 registered nurses
(RNs) in 2007 to approximately 60,000 registered nurses by 2022 in Canada. “The regulated
nursing workforce is of critical importance to the health of Canadians and …to human resource
planners” (Canadian Institute for Health Information [CIHI], 2010, p. 9). Between the years 2009
and 2013, there was an average annual growth rate of 1.0% in the Canadian RN workforce
(CIHI, 2014). The total number of RNs increased from 268,397 in 2005 (CIHI, 2010) to 293,205
in 2014 (CIHI, 2015). However, the demand of the healthcare system far exceeds the supply of
nurses.
Enrollment in Baccalaureate nursing programs has been increasing for the past ten years
as has the number of graduates from these programs (Canadian Association of Schools of
Nursing [CASN] & CNA, 2009). A total of 13,068 students entered Baccalaureate nursing
programs (BNPs) across Canada in 2001-2002, which increased to 15,370 students in 2010-2011
(CASN & CNA, 2012). However, there was a decrease of 1.5% (from 15,606 to 15, 370
admissions) noted for the first time in ten years between 2009-2010 and 2010-2011. Overall, the
number of graduates from these programs has also been increasing steadily from 4,816 in 2000
to 10,827 in 2011 (CASN & CNA, 2012). According to CIHI (2015), “the number of graduates
from Canadian entry-to-practice (ETP) nursing programs continued to increase, reaching 20,146
in 2013” (p.12). Nonetheless, the rate of growth in graduates has slowed down, as well as the
number of students admitted to nursing programs has been decreasing (CIHI, 2015). Despite
2
this growth, nursing programs across the nation have not been able to meet the increasing
demand for new nurses and the shortage continues.
For the first time in nearly two decades the supply of RNs in the workforce declined in
2014 resulting in a net loss of RNs (-1.0%), with the majority of nurses leaving the profession
from Ontario (CIHI, 2015). Recent regulatory changes in Ontario resulted in the loss of 12,273
RNs (College of Nurses of Ontario [CNO], 2015). With the recent change in requirements with
the CNO, a member can only renew their license if they have practised nursing in Ontario or if
they have become registered or reinstated within the past three years (CNO, 2015). As 2014 was
the first year of this new requirement, one may speculate that the loss of RNs may continue to be
seen in Ontario for at least the next two years. In addition to the nursing shortage, the nursing
student attrition rate also remains high at an average of 28% of all students enrolled in BNPs
across Canada (CNA, 2009), with students leaving mainly in the first two years of the program
(Day, Paul, Boman, McBride, & Idriss, 2004).
In order to address the national nursing shortage, not only do we need more nursing
students but also those that enter the program must graduate. It is essential that these nursing
students persist in their studies and be academically successful in the classroom (Reyes, 2007).
Various factors account for why nursing students leave their studies, but a major issue in nursing
student retention in schools of nursing relates to student success (Campbell & Dickson, 1996).
Therefore, the challenge faced by BNPs today is to identify effective educational practices, in
student success, to engage and retain these nursing students in order to meet the on-going needs
of the demanding healthcare system. In order to identify effective educational practices, nursing
student characteristics associated with student engagement and in turn student success need to be
identified. This chapter introduces the statement of the problem, purpose of the study, rationale,

3
philosophical world view, research questions, theoretical framework, scope and limitations of the
research and key terms.
Background Statement of the Problem
Nursing education has evolved over the past few centuries. Early nursing school
preparation was mostly informal and consisted of observation, on the job training, and the
passing of knowledge to another (Ross-Kerr, 2003). Today nursing has become a profession that
requires a baccalaureate degree which takes four years of full-time study to complete and a
national licensing exam (CIHI, 2010). In 2000, the Government of Ontario amended nursing
regulations to require all candidates to hold a baccalaureate degree granted by a university. This
required that the diplomas offered by colleges be phased out and for colleges to form
collaborations with universities to administer a four-year nursing program with the university as
the degree-granting institution (Colleges Ontario, 2010). Today BNPs are delivered either in a
collaborative relationship between a college and university or solely by the university. Since
nursing programs are the source of new nurses in the workforce, a clear and comprehensive
understanding of the factors that influence nursing student success becomes crucial in order to
graduate a higher percentage of nurses. Currently, most schools of nursing determine program
and student success by the pass rates on the national licensing examination. However, exam pass
rates do not account for the student attrition rate over the course of the four years of the program.
The escalating nursing shortage demands the identification of variables in these students that
predict success and persistence in nursing programs. “It is important that students who enter
nursing programs persist in their studies to optimize the use of educational resources and curtail
student wastage or non-completion” (Hayes, 2007, p. 262).

4
The nursing education literature that I reviewed did not focus on identifying
characteristics associated with student engagement. Instead the focus was primarily on
exploratory methods examining learning preferences and teaching styles (Berg & Lindseth,
2004; Rassool & Rawaf, 2007; Walker et. al., 2006). Studies identified in nursing education
indicated that grade point average and past science grades predict academic success in nursing
students (Campbell & Dickson, 1996; Symes, Tart, & Travis, 2005; Jeffreys, 2006; Peterson,
2009). In addition, other nursing studies have examined variables that predict student success on
the national licensing examination (Abbott, Schwartz, Hercinger, Miller & Foyt, 2008;
Alameida, Davis, & Renwanz-Boyle, 2011; Arathuzik & Aber, 1998; Beeson & Kissling, 2001;
Campbell & Dickson, 1996; Higgins, 2005; Sayles, Shelton, & Powell, 2003). Student
engagement research in higher education revealed a relationship between variables such as
student, environmental, and institutional characteristics; social and academic engagement to
student engagement and learning outcomes (Pascarella & Terenzini, 2005; Pike & Kuh, 2005;
Carini, Kuh, & Klein, 2006; Kuh, Kinzie, Buckely, Bridges, & Hayek, 2007a). Limited research
was identified that examined these variables and their effect on nursing student engagement,
which could provide greater insight into nursing student success and persistence in baccalaureate
nursing programs in Ontario.
Purpose of the Research
The discipline of nursing needs evidence that identifies and evaluates nursing student
characteristics and engagement variables as potential indicators of successful academic outcomes
in the Canadian context. Currently, the National Survey of Student Engagement (NSSE) has been
used by universities across Canada to assess which, and to what extent, first and senior year
students participate in educationally sound activities (Appendix A). The NSSE also assesses “the

5
institutional policies and practices that induce students to take part in such activities” (NSSE,
2002, p. 8). Since Canadian nursing students leave nursing schools mainly within the first two
years of study (Day et al., 2004), first-year nursing students were examined in this study.
The purpose of this study was to examine the extent to which first-year nursing students
are engaged in effective educational practices and to determine any relationships between student
demographic, external, academic, social and institutional variables, and student engagement.
Degree-granting institutions in Ontario were selected for this study based upon criteria that the
institution had a four-year BNP and that the institution’s nursing students participated in the
2008 NSSE survey. As some collaborative nursing programs do not participate in the NSSE,
only BNPs that had first-year nursing students in the university setting were included. The 2008
NSSE data subset was used as it was the most recent data subset available at the time of this
study.
Rationale and Significance of the Study
The escalating shortage of nurses has been projected to reach 60, 000 nurses by the year
2022 (CNA, 2009). With the on-going nursing shortage in the Canadian healthcare system,
nursing schools need to identify effective educational practices to retain and engage nursing
students to ensure the graduation of nurses into the workforce. Even though the entry-to-practice
program (undergraduate nursing) admissions have reached a 10-year high and continue on an
upward trend that started in 2004-2005, as well as an increase in the number of graduates from
nursing programs (CASN & CNA, 2012), the attrition rate in Canada continues to remain high at
28% (CNA, 2009), mainly in the first two years of study (Day et al., 2004). Some of the reasons
nursing students leave their studies include lack of financial resources, weak academic skills,
stress, the nursing program’s structure and lack of academic support (Day et al., 2004). At the

6
undergraduate level, nursing students face stress that arises from continuous assessment of
clinical performance and skills (Gibbons, Dempster & Moutray, 2007; Hallin & Danielson,
2007). The ongoing assessment of the student only adds to and further demands an increasing
level of responsibility and accountability for client care. Furthermore, it also adds to the burden
of the already struggling or at-risk student. In order to meet the current and future projected
demand of the healthcare system, an understanding of the student characteristics is essential to
the development and implementation of effective programs and outcomes to support student
development and in turn retention.
The CNA (2009) stated that educational institutions need to examine opportunities to
improve the retention of nursing students as one of the six solutions proposed to address the
projected RN shortage. In higher education research, student engagement has been shown to
influence student learning and personal development (Astin, 1999; Pascarella & Terenzini,
2005), as well as student retention and persistence (Tinto, 1998). “Of all the factors studied in
this field, the strongest consensus has formed around the significance of student engagement as a
key determinant of student retention/attrition” (Canadian Council on Learning, 2009, p. 7).
Current enrolment trends, societal needs, and attrition rates highlight the need to prioritize the
retention of nursing students (Jeffreys, 2012). Nursing students face stress associated with on-
going evaluation in the classroom and clinical setting. The rigor of the nursing program may be a
reason why some of these students leave the program (Day et al, 2004). To design a retention
strategy targeting specific student populations first requires an understanding of the influencing
factors or other variables (Jeffreys, 2012). Educators need to focus on the larger group of
students who remain and persist in the program rather than those who have left the program
(Cameron, Roxburgh, Taylor, & Lauder, 2011), as those students who remain will be the ones
entering the workforce. Since nursing students are subject to constant and on-going evaluation,

7
one may speculate that the engagement scores for these nursing students may be different from
the average student in higher education. Thus nursing schools need to understand student
characteristics that are associated with academic success to enhance engagement and persistence
in nursing programs and in turn graduate more nurses. The findings of this research study will be
of key interest to stakeholders in nursing education in Ontario and will also aid faculty and
nursing programs in course and program design and development with a central focus on student
success outcomes.
Researcher’s Interest
Through my personal experience over the past 14-years teaching in a large urban college,
I have noticed that the number of students in the nursing program has increased. I have also
noticed a change in the student demographic profile of students entering nursing education. For
example, a more recent personal observation has been that the students are now younger, coming
directly from high school, have less work and life experience, diverse backgrounds and learning
needs, more technologically savvy, and have a sense of student entitlement. In other words, the
student population entering nursing programs has changed in comparison to a decade ago. The
change in the student population characteristics has also affected the national examination pass
rates at this college. All of these changing variables over time ultimately influenced and
motivated me to take the first step in examining nursing student characteristics and to identify
engagement variables in the Canadian context. As educators in Canada, we need to invest time in
identifying variables or factors that may foster student persistence in nursing programs and keep
these students engaged in their studies.
In my experience, undergraduate nursing students are faced with a curriculum that
assesses and evaluates the student on an ongoing basis. Every semester students are required to

8
attend a clinical placement in the hospital setting. Clinical hours may be two 6-hour shifts per
week or one 12-hour shift, during which the student provides client care within the scope of
practice of a Registered Nurse. Students are expected to arrive early prior to start of the shift and
this on its own presents a challenge when the hospital location is far from the student’s residence
and the only means of transportation may be local transit. On the other hand, students who have
children experience the stress of finding daycare at 0600 hours in the morning. These examples
provide a glimpse into sources of stress faced by nursing students. Not only do the students need
to apply what they have learned in class to the clinical setting, but they also need to deal with all
of the other intervening factors. In my opinion, examining nursing student engagement, whether
it is academic outcomes or personal achievement, is complex and multi-faceted. As stated by
Jeffreys (2012), “[t]he nursing profession must be ready to embrace a new age of realism with
regard to the changing student population…Nurse educators are in a key position to influence
retention positively” (p.4). Institutions in higher education need to lead the way in alleviating this
shortage in nursing. For every student who departs nursing education there will be one fewer
nurse who will graduate and enter the workforce. This issue is of importance to me because as a
faculty member I believe that it is important to identify and understand what keeps these students
motivated to persist and be academically successful in their studies. As a nursing educator, I
believe we have the ability to create and engage our students in interactive learning that fosters
student development. These in turn will create experiences for nursing students to make
competent decisions at the bedside when providing client care and at the national examination. I
am convinced that by examining nursing student characteristics that are associated with
engagement behaviours we can develop and incorporate evidence-based strategies to increase
nursing student retention and in doing so increase graduation rates and nurses in the workforce.

9
Worldview
The conceptual underpinning for this study was engagement as it is related to nursing
student success using a postpositivist lens. According to Creswell (2009) “postpositivists reflect
the need to identify and assess the causes that influence outcomes” (p. 7). Postpositivists use an
objective lens that is based on observation and measurement of reality and includes “variables
that comprise hypotheses and research questions” (p. 7). The approach is reductionist in nature as
ideas are reduced into smaller parts in attempting to understand a broader concept. The objective
reality includes what “exists ‘out there’ in the world” (p.7). However, this approach also
acknowledges that reality may never be completely known and triangulation from various
sources and analysis of data can lead to an approximation of the truth (Creswell, 2009).
Consistent with a postpositivist approach , this study employed a quantitative descriptive
correlational design (including a stepwise multiple regression analysis approach) to examine the
extent to which first-year nursing students are engaged in effective educational practices and
determine any relationships between nursing student demographic, external, academic, social and
institutional variables and student engagement scores. A postpositivist seeks to explain or
describe the relationships of interest and uses theory to help explain the findings (Creswell,
2009). A postpositivist approach is used for prediction and explanation. Similarly this research
study was guided by the theories of student engagement, used a survey to collect data, and
analyzed any relationships between variables (Creswell, 2009). This study used a quantitative
approach as a first step to examine relationships between variables, and provided insight into
changes for future larger scale trial with the possibility of including a qualitative component.

10
Purpose statement
The purpose of this study was to examine the extent to which first-year nursing students
are engaged in effective educational practices and determine any relationships between nursing
student demographic, external, academic, social and institutional variables, and student
engagement.
Research Questions
The main research question of this study was: “What nursing student characteristics are
associated with student engagement in Baccalaureate nursing programs in selected Ontario
Universities?” The following sub-questions aided in answering the main research question:
1) What are the characteristics of first-year full-time nursing students in 13 selected Ontario
universities?
2) What is the distribution of scores on the five NSSE engagement scales for these students?
3) What is the relationship between demographic, external, academic, social and
institutional variables and student engagement scores on the five NSSE benchmarks for
first-year full-time nursing students in selected Ontario universities?
4) What is the relationship between student engagement scores on the five NSSE scales and
institutional size for first-year full-time nursing students in selected Ontario universities?
5) What is the relationship between student and institutional characteristics and academic
performance of first-year full-time nursing students in selected Ontario universities?
Theoretical Frameworks of Student Engagement Studies
Several theoretical models have been developed that explain student engagement.
Although the engagement premise has been in the literature for more than seventy years, the
construct has evolved over time (Astin, 1993; Pascarella &Terenzini, 2005; Pace, 1984). Much

11
of the research literature on student engagement has its roots in sociological, psychological and
educational theory. One of the earliest works dating back to the 1930s was that of Ralph Tyler,
an education psychologist, who showed the positive effects of time-on-task on learning (Merwin,
1969). In other words, the more time a student spent learning would in turn lead to positive
academic outcomes and learning. In the 1970s Pace extended the concept to show that
educationally purposeful tasks yielded more gains. He added the dimension of quality of effort
by the student. Astin (1984, 1999) further enhanced the concept of quality of effort with his
theory of involvement studying individual student and institutional characteristics. Over the
years other scholars such as Tinto, Chickering and Gamson, Pascarella, and Kuh et al. have
examined different dimensions of time-on-task and quality of effort and their relationship to
various desired outcomes of the college experience (Kuh, 2009). Since the definition of student
engagement has evolved over time, theories will be reviewed in chronological order from the
1970s to the present.
Pace’s quality of effort.
In the 1970s Robert Pace introduced the dimension of quality of effort in student learning
and development by building on Tyler’s time-on-task concept. Pace (1984) showed that all
learning and development required an investment of time and effort by the student and in turn it
was the student who was accountable and responsible for the amount, scope, and quality of effort
that one invested in. In other words, it was not only the opportunities for engagement that an
institution offered or the student’s mere participation in the event, but the quality of the students’
engagement that will impact growth and development in the college setting (Pace, 1984). He
developed the College Student Experiences Questionnaire (CSEQ) to measure his concept of
quality of effort to ascertain the activities related to student development and learning. Pace

12
showed that students gained more from their studies and the college experience when they
invested more time and energy in educationally purposeful tasks such as interacting with peers
and teachers, and applying their learning (Kuh, 2009). Pace concluded that the quality of student
effort was more closely related to academic outcomes than background factors (Tinto, 1993).
The items from the CSEQ were later adopted and used in what is known as the student
engagement survey, NSSE.
Astin’s College Impact Models.
Astin proposed one of the first college impact models known as the input-environment-
output (I-E-O) model (Astin, 1984; Astin, 1993, Pascarella & Terenzini, 2005). “According to
this model, college outcomes are viewed as functions of three sets of elements [input,
environment and output]”, that explained the effect that the college setting has on the student
(Pascarella & Terenzini, 2005, p. 53). Inputs referred to the characteristics of the student at the
time of initial entry to the institution. The input measurements may include test scores, and
demographic variables such as gender, ethnicity, socio-economic status, career choice, subjects
taken in high school, and religion. The inputs are presumed to shape the outcomes directly and
indirectly depending upon the student’s engagement with the institutional environment. To better
understand the impact that the college has on the students, one needs to first assess the inputs
upon entry to college. The environment refers to programs, policies, faculty, peers, and
educational experiences the student is exposed to during the college experience. Outputs referred
to the student’s characteristics, knowledge, skills, values, beliefs, attitudes, and behaviours after
exposure to the college environment. Any changes or growth in the student during the time they
have spent in college is determined by comparing the outcome with the input characteristics
(Astin, 1993). In other words, the output or impact was the result of the student inputs mixing

13
with the college environment. The model posited a direct relationship between the inputs,
environment and outputs. The model focused primarily on behaviours in which a student
engaged in the college experience.
Astin also proposed “a ‘theory of involvement’ to explain the dynamics of how students
change or develop” (Pascarella & Terenzini, 2005, p. 53). The relationship between student
persistence and involvement in the social and academic aspects of the institution is described by
the theory of involvement. According to Astin (1999) students learn by becoming involved in
activities other than preparing, attending, and studying for classes. He further added to his theory
by adding the elements of Tyler’s concept of time-on-task. The involvement theory has five basic
postulates: 1) involvement requires the investment of physical and psychological energy in
various objects (tasks, people, or activities); 2) involvement is a continuous concept and different
students will invest varying amounts of energy in different objects; 3) involvement has both
quantitative and qualitative features; 4) the amount of student learning and personal development
is directly proportional to the quality and quantity of student involvement; 5) the effectiveness of
any educational policy or practice is directly related to its capacity to induce student involvement
(Astin, 1999; Pascarella & Terenzini, 2005). Astin used the term student involvement
synonymously with student engagement, with a focus on behaviours that influenced and
described engagement. The theory first proposed as the input-environment-output model and
later as the theory of student involvement has been cited often in the student engagement
literature to explain the effect that the college has on the student (Carini et al., 2006; Hu & Kuh,
2002; Kuh, 2001; Kuh, Cruce, Shoup, & Kinzie, 2008; Salamonson, Andrew, & Everett, 2009;
Seifert, Pascarella, Salisbury, & Blaich, 2010).
14
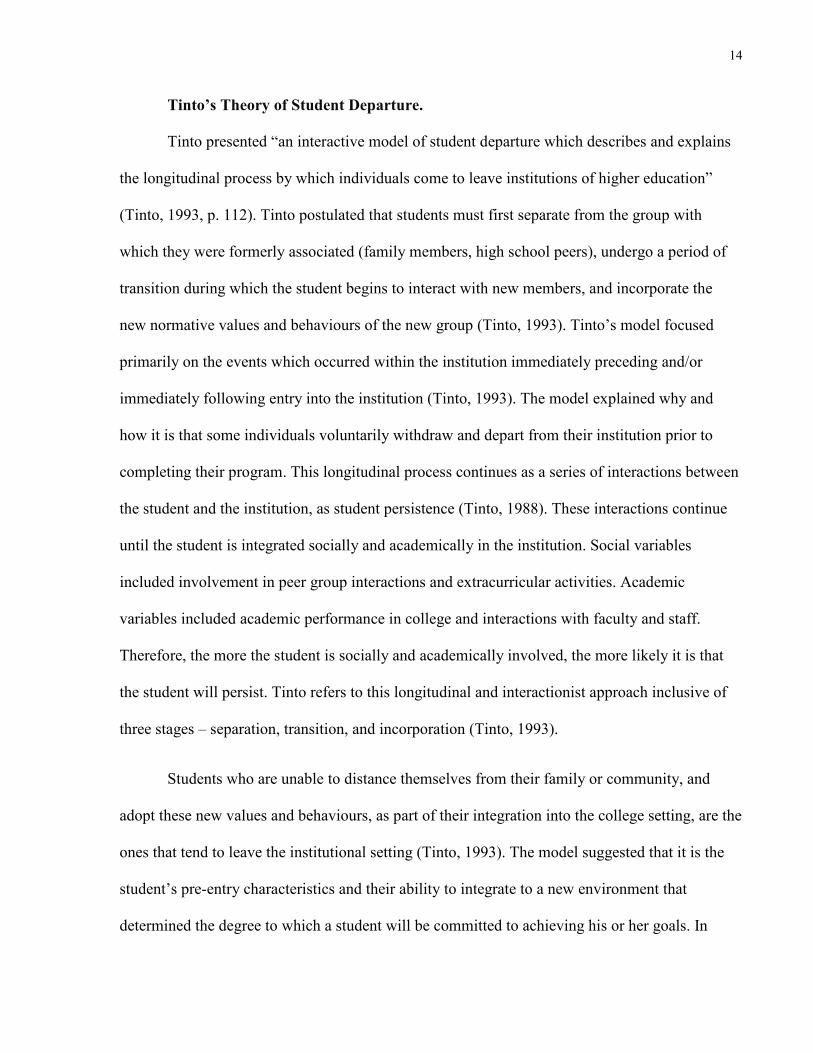
Tinto’s Theory of Student Departure.
Tinto presented “an interactive model of student departure which describes and explains
the longitudinal process by which individuals come to leave institutions of higher education”
(Tinto, 1993, p. 112). Tinto postulated that students must first separate from the group with
which they were formerly associated (family members, high school peers), undergo a period of
transition during which the student begins to interact with new members, and incorporate the
new normative values and behaviours of the new group (Tinto, 1993). Tinto’s model focused
primarily on the events which occurred within the institution immediately preceding and/or
immediately following entry into the institution (Tinto, 1993). The model explained why and
how it is that some individuals voluntarily withdraw and depart from their institution prior to
completing their program. This longitudinal process continues as a series of interactions between
the student and the institution, as student persistence (Tinto, 1988). These interactions continue
until the student is integrated socially and academically in the institution. Social variables
included involvement in peer group interactions and extracurricular activities. Academic
variables included academic performance in college and interactions with faculty and staff.
Therefore, the more the student is socially and academically involved, the more likely it is that
the student will persist. Tinto refers to this longitudinal and interactionist approach inclusive of
three stages – separation, transition, and incorporation (Tinto, 1993).
Students who are unable to distance themselves from their family or community, and
adopt these new values and behaviours, as part of their integration into the college setting, are the
ones that tend to leave the institutional setting (Tinto, 1993). The model suggested that it is the
student’s pre-entry characteristics and their ability to integrate to a new environment that
determined the degree to which a student will be committed to achieving his or her goals. In

15
other words, these pre-entry characteristics have a direct influence on student departure
decisions. These pre-entry student characteristics include family and community backgrounds,
personal attributes (age, sex, intellectual and social skills), and precollege educational
experiences and achievements (high school grade point average [GPA], achievement test scores).
Tinto’s longitudinal model has been frequently cited by research studies that examine student
engagement (Carini et al., 2006; Hu & Kuh, 2002; Kuh, 2001; Salamonson et al., 2009). This
model of student attrition and persistence sets the stage for future research and to further explore
the area of student engagement in educational institutions in order to retain the at-risk students in
higher education.
Pascarella’s General Model for Assessing Change.
Pascarella proposed the causal model for assessing change as an extension of the works
of other authors, including Astin’s input-environment-output college impact model. His model
assessed the effects of differential environments on student learning and cognitive development
(Pascarella, 1985). The causal model included the consideration of the institutional structural
characteristics and its environment. The causal model for assessing change considered the direct
and indirect effects of five main sets of variables that effect student change and growth
(Pascarella, 1985). The first variable set included the student’s background and precollege traits
that students exhibit before entering college. The second variable set included the structural and
organizational characteristics of institutions (such as faculty-student ratio, enrolment statistics).
The first two variable sets establish the third variable, institutional environment. The first three
variable sets are representative of the initial indications of student change prior to the inclusion
of college experiences. The model then accounted for the direct and indirect effects of the first
three variable sets on the fourth variable which captured the interactions with agents of

16
socialization or those with whom the student interacted on a daily basis (such as faculty, peers,
and staff). Then the impact of these four variable sets on the fifth variable, quality of student
effort is assessed for any direct and indirect effects on student change (Pascarella, 1985). This
model can only assess change when the student has participated in the college environment, and
the longer the student persists in the higher education environment, the greater the chances that
student change will be more prominent in student outcomes.
Chickering and Gamson’s Good Practices in Undergraduate Education.
Based on the research of Chickering and Gamson (1987) there are seven principles of
good teaching and learning. These principles included: 1) student-faculty contact; 2) develop
reciprocity and cooperation among students; 3) encourage active learning; 4) prompt feedback;
5) time-on-task; 6) communicate high expectations; 7) respect for diverse talents and ways of
learning (Chickering & Gamson, 1987). The seven principles “rest on 50 years of research on the
way teachers teach and students learn, how students work and play with one another, and how
students and faculty talk to each other” (Chickering & Gamson, 1987, p. 2). Teachers and
students are responsible for improving undergraduate education but in addition need an
environment that is favorable to good practice in higher education (Chickering & Gamson,
1987). “Emphasizing good educational practice would help focus faculty, staff, students and
others on the tasks and activities that are associated with higher yields in terms of desired student
outcomes” (Kuh, 2002, p. 1). These seven principles provide guidelines for faculty, students, and
administrators with support from the institutions to improve teaching and learning. These
principles have guided the student engagement dialogue, research, and practice. In addition,
these seven principles have been foundational in studying student engagement in the present day.

17
In terms of the NSSE survey, the concept of student engagement is anchored most directly to
Chickering and Gamson’s (1987) seven principles.
Tyler, Pace, Astin, Tinto, Pascarella and Chickering and Gamson have presented theories
and models of student retention, attrition, and involvement that all share similar characteristics.
As a synthesis, all of the models recognize that the student has inherent characteristics and
experiences that he or she brings to the college experience. In addition, there is a consensus
between the models that the institutional characteristics (such as structure, programs, services,
values, and behaviours) and environment also impact student success. In turn, it is the impact or
interaction between student and institutional characteristics, whether positive or negative, that
determines student persistence. “At the intersection of student behaviours and institutional
conditions is student engagement” (Kuh et al., 2006, p.8). In other words, student engagement
comprises of common characteristics from these theories and models. One may also see these
theories as being complementary to the concept of student engagement. Another crucial
component embedded in most of the models is that of the quality of the effort and engagement by
the student allows for opportunities of growth and change or departure from the institution.
These theories of student success are based on research conducted primarily with traditional
students during their first year of study. Variables of student engagement that have been
recognized in higher education as significant in predicting success are also relevant for nursing
education. However, since nursing students are subjected to regular on-going evaluation and
exposed to clinically-focused education and/or training, one may argue that there is a greater
likelihood that nursing students may differ in engagement scores in comparison to the average
student in higher education. Hence, the student engagement concept in this study was examined
as the interplay between the theoretical models discussed to provide a holistic view.

18
Engagement of students today is widely being assessed through the use of a nationally
administered survey, NSSE, to gain a better understanding of the levels of engagement of first
and senior year students. The NSSE takes into account and incorporates components of these
theories and models in order to provide a holistic assessment of the extent to which students are
engaged in educationally purposeful activities. Hence the NSSE was chosen for this study to
examine first-year nursing students in Ontario as a first-step in assessing this student population.
In turn institutions with nursing programs would be better prepared to plan and implement
strategies and other interventions to support students to enhance and encourage academic
engagement and student success (Popkess, 2010).
Scope and Limitations of the Research
Limited scholarly research was identified that examined nursing student engagement. The
literature that was identified focused primarily on in-class learning strategies. Only one study
was found that examined nursing student engagement in the American context. Furthermore, a
Canadian perspective was not evident in the literature examining nursing student engagement.
The aim of this study was to contribute to the existing body of knowledge and to examine and
describe nursing student characteristics associated with student engagement scores. The findings
of this study may be useful for nursing programs in Ontario to identify and implement strategies
to assist nursing students to be academically successful and persist in their studies and graduate.
In turn, the findings may inform policies and practices to improve program retention rates,
increase the number of graduates and in turn have more nurses enter the workforce.
The limitations of this study are related to use of a secondary analysis approach using the
NSSE survey as an instrument. As a secondary analysis, this study was unable to account for any
institutional changes that may have taken place as a result of previous NSSE results. For

19
example, if the NSSE scores were low for a benchmark in a previous administration of the
survey, the institution may have implemented interventions or changes resulting in an
improvement in scores. This study also did not account for students who left an institution and
then returned. This study was also limited to an examination of the variables that were collected
in the NSSE survey. As a secondary analysis any errors made in the original survey are no longer
visible (coding and data entry), and inability to assess data quality (survey design and testing).
However, there should be no interviewing, coding, or data entry errors because the NSSE was
administered as an online survey that students completed by entering their responses on the
NSSE web site. Also as a secondary analysis this study was not able to account for any NSSE
instrumentation errors that may have existed.
Since the sample in this study only consisted of a sample of convenience of Ontario
universities that participated in the NSSE in 2008, the conclusions were strictly limited to those
institutions. Using a convenience sample also introduces the potential of sampling bias, such as
over or under representation of certain subgroups within the sample (Burns & Grove, 1997).
Furthermore, the size of the sample in this study consisted of 293 first-year nursing students. In
2008, a total of 4,212 first-year nursing students were enrolled in BNPs across Ontario (CASN &
CNA, 2012). The sample size in this study represented a small proportion of the entire first-year
nursing student population. Hence the findings of this study cannot be generalized to the broader
population of nursing programs across Canada. However, only tentative conclusions can be
drawn for other Ontario institutions and very tentative conclusions for other institutions in
Canada that offer nursing programs.

20
Even though the data examined in this study were from the 2008 data set, the findings
would still be relevant today for BNPs as no major changes have occurred at a provincial level to
date that may have affected the curriculum of the baccalaureate nursing program.
Chapter Outlines
This thesis is presented in five chapters. Chapter 1 presents an overview of the problem
statement, purpose of the study, rationale, research questions, theoretical framework, and the
scope and limitations of the study. Chapter 2 is the review of the literature that presents a
definition of student engagement, theories of student engagement, discussion of student
engagement studies, nursing student engagement, and linking student engagement and nursing.
Chapter 3 describes the research methodology. Chapter 4 presents the results of the study.
Chapter 5 includes a discussion of the findings, conclusions, limitations, and recommendations
for future research.

21
Terms and Definitions
Academic variables: Academic performance was both a predictor and outcome measure for this
study and was measured by the student’s self-reported GPA, the first academic variable. The
second academic variable was the number of hours per seven-day week spent preparing for class
(studying, reading, writing, doing homework or lab work, analyzing data, rehearsing, and other
academic activities) by the first-year nursing students.
Attrition rate: Attrition rates refer to the percentage of students who dropped out or departed
from nursing programs.
Baccalaureate nursing program (BNP): In Ontario, universities are the only institutions
authorized to grant baccalaureate degrees in nursing. In 2001, Ontario colleges and universities
“…beneficially combined in nursing collaborative programs in a number of respects” (Council of
Ontario Universities, 2010, p. 2). These combined efforts included curriculum development,
accessibility, and resources. The term “[c]ollaborative refers to a relationship of cooperation
between a university and one or more college-level institutions.” (CASN & CNA, 2012, p. 57).
Across the province different models of collaborative relationships exist which include “all at a
university site, mixed sites, all at a college site with university faculty travelling out to teach,
incorporation of distance education modalities, and so on…” (Council of Ontario Universities,
2010, p. 3). BNPs that participated in the NSSE 2008 were included in this study.
Demographic variables: Demographic variables in this study included age, gender, ethnicity,
first generation student status and place of residence.
Effective educational practice: The five NSSE benchmarks are indicators of effective
educational practice (NSSE, 2000). If the institution scores above the average on all five
benchmarks, it may be considered as an educationally effective institution or academic program
(NSSE, 2000).
22
Entry-to-practice programs: “Entry-to-practice programs entitle the successful graduate to
apply for licensure/registration as [a Registered Nurse].” (CASN & CNA, 2012, p. 7)
External variables: Also known as an extraneous variable. An external variable was
operationally defined as a variable that may affect the response variable. The external variables
in this study included the number of hours per week spent commuting to class;, the number of
hours spent per week working off campus; and the number of hours spent per week caring for
dependents.
First generation status: “Students were defined as non-first generation if either parent had
completed university” (Conway, Zhao, and Montgomery, 2011, p. 45). In other words, if both
parents had not completed university, the student was coded as a first-generation student.
Institutional variable: University size was the only institutional variable examined in this study.
This study operationally defined university size as defined by Conway et al. (2011). “Small” was
defined as less than 6,500 students, “medium” was 12,000 to 21,000 students, and “large” was
defined as more than 24,500 students. There were no institutions identified that had nursing
programs with enrollments between 6,500 and 12,000 full-time students.
National Survey of Student Engagement (NSSE): NSSE is a survey that measures the quality
of undergraduate post-secondary education experience across North America. “NSSE is a
powerful and increasingly important tool for assessing and improving the quality of
undergraduate education …” (NSSE, 2008a, p. 8). It provides quantitative information on the
time and efforts that students devote to educationally purposeful activities. Universities in
Canada and the United States use the NSSE to measure the extent to which students engage in
effective educational practices that are empirically linked with learning, personal development,
and other desired outcomes such as student satisfaction, persistence and graduation (NSSE,

23
2006; NSSE, 2008a). The survey is administered to first and senior year students in the spring
term. The 2008 NSSE survey items are given in Appendix A.
NSSE Benchmark or Scales: Each behaviour item (question) in the five NSSE benchmark
scales measures a different type of student engagement: (a) Level of academic challenge (LAC)
with 11 items, (b) Active & Collaborative Learning (ACL) with 7 items, (c) Student-Faculty
Interaction (SFI) with 6 items, (d) Enriching Educational Experience (EEE) with 11 items, and
Supportive Campus Environment (SCE) with 6 items. Students received a score for each scale on
the basis of their responses to the items related to the scale. The NSSE benchmarks are used to
help colleges and universities better respond to accountability questions (NSSE, 2008a).
Appendix B (Benchmark Sources of Data) depicts the breakdown of the NSSE survey items into
the five scales. The item codes used for data analysis are also provided in Appendix B.
Level of Academic Challenge: This benchmark included the following items: hours spent
preparing for class; number of assigned textbooks, books, course readings; number of written
papers or reports; courses emphasizing: analysis, making judgments, applying theories or
concepts; working harder than you thought you could; campus environment: spending significant
amount of time studying (NSSE, 2008a).
Active and Collaborative Learning: This benchmark included the following items: asked
a question in class or contributed to class discussions; made a class presentation; worked with
other students on projects during class; worked with classmates outside of class to prepare class
assignments; tutored or taught other students (paid or voluntary); participated in a community-
based project as part of the course; discussed ideas from your readings or classes with others
outside of class (NSSE, 2008a).
Student-Faculty Interaction: This benchmark included the following items: discussed
grades or assignments with an instructor; talked about career plans with a faculty member or

24
advisor; discussed ideas from your readings or classes with faculty outside of class; worked with
faculty members on activities other than coursework; received prompt written or oral feedback
from faculty on your academic performance; worked on a research project with a faculty member
outside of course or program requirements (NSSE, 2008a).
Enriching Educational Experiences: This benchmark included the following items: hours
spent participating in cocurricular activities; practicum, internship, field experience, co-op;
community service or volunteer work; foreign language coursework and study abroad;
independent study or self-directed major; culminating senior experience; serious conversations
with student of different: religious beliefs, political opinions, personal values, ethnicity or race;
campus environment encouraging contact among students from different economic, social and
racial or ethnic backgrounds; participate in a learning community or other programs where
groups of students take two or more classes together (NSSE, 2008a).
Supportive Campus Environment: This benchmark included the following items:
provides the support you need to help you succeed academically; helps you cope with your non-
academic responsibilities; provide the support you need to thrive socially; quality of relationships
with other students; quality of relationships with faculty members; quality of relationships with
administrative personnel and offices (NSSE, 2008a).
Other ethnic groups: Operationally defined non-Caucasian students inclusive of North
American Indian, Metis, Inuit, Chinese, South Asian (e.g. East Indian, Pakistani, Sri Lankan,
etc.), Black, Filipino, Latin American, Southeast Asian (e.g. Cambodian, Indonesian, Laotian,
Vietnamese, etc.), Arab (e.g. Saudi, Egyptian, etc.), West Asian (e.g. Afghan, Iranian, etc.),
Japanese, and Korean.
Persistence: Persistence is defined as students continuing to attend the institution from one
semester to the next. Students who persist are referred to as persisters.

25
Predictor variable: Also known as an independent variable. For the purpose of this study, the
term predictor variable was used since the variables in this study were simply observed with the
use of secondary analysis of survey data (Creswell, 2009; Tabachnick & Fidell, 2013). Since
predictor variables predict the values on the dependent or response variable (Creswell, 2009;
Tabachnick & Fidell, 2013) the use of this term was appropriate with regression analysis. The
predictor variables included demographic, external, academic, social and institutional variables.
Response variable: Refers to the variable being measured or the response/outcome of a non-
experimental study (Creswell, 2009), also known as a dependent variable in experimental
studies. Student engagement was the response variable for this study and was measured by the
five available NSSE benchmarks of student engagement (Level of Academic Challenge, Active
and Collaborative Learning, Student Faculty Interaction, Enriching Educational Experience, and
Supportive Campus Environment).
Retention rate: Retention rate refers to the percentage of students who persist or continue in the
nursing program from the point of entry to the institution and graduate from the program.
Social variables: The term social variable was operationally defined to include variables that
capture the student’s involvement or socialization outside of the classroom setting. The first
social variable examined in this study was the number of hours spent per week by a student
participating in cocurricular activities. The cocurricular activities included organizations, campus
publications, student government, fraternity or sorority, intercollegiate or intramural sports, etc.
The second social variable examined includes the participation of the student in exercise or
physical fitness activities during the school year.
Student characteristics: Student characteristics were operationally defined as inclusive of all
demographic, external, academic and social variables.

26
Student engagement: The concept of student engagement was defined as an active process and
multidimensional concept that consists of behavioural, cognitive and psychological
characteristics that influence student learning and personal development. Student engagement
has been noted in the literature as a broadly-defined term that describes the student’s effort,
interest and time invested in meaningful education experiences inside and outside of the
classroom (CCI Research Inc., 2009). In other words, the term engagement includes academic,
selected non-academic and social aspects of the student experience (Krause & Coates, 2008).
The operational definition of student engagement includes the extent to which students
participate in effective educational practices as measured by the five NSSE benchmarks.
Student success: Student success has been “defined as academic achievement, engagement in
educationally purposeful activities, satisfaction, acquisition of desired knowledge, skills and
competencies, persistence, attainment of educational objectives, and post college performance.”
(Kuh, Kinzie, Buckley, Bridges, & Hayek, 2006, p. 7).
Traditional Student: Operationally defined as an undergraduate student between the ages of 18
to 23 years (Jeffreys, 2007; NSSE, 2008; Pascarella & Terenzini, 2005). Pascarella and Terenzini
(2005) further described the traditional student as predominantly Caucasian undergraduates,
enrolled as full-time students in four-year institutions, live on campus, not employed and with
few family responsibilities. On the other hand, a ‘non-traditional’ student has been defined as
one that is of the age 24 years or older, enrolled as a part-time student, with family
responsibilities, first-generation student and/or with a job (Jeffreys, 2007).

27
Chapter Two: Literature Review
This Chapter presents a literature review of student engagement in higher education and
nursing education. The analysis and critique of the literature in higher education student
engagement revealed studies across cognitive and behavioural domains. Limited research was
identified that pertained to nursing student engagement. The first section presents the literature
related to student engagement in higher education followed by nursing education studies.
What is student engagement?
An area of inquiry in examining student success that has received considerable attention
in the literature in recent years has been student engagement. “The term ‘student engagement’
has developed over time through the efforts of several theorists and educational researchers”
(CCI Research Inc., 2009). The definition of student engagement has evolved in order to be
inclusive and representative of changes in the types of students entering higher education and
changing pedagogy in educational institutions. Student engagement has been defined as a
multidimensional concept that consists of behavioural characteristics (Astin, 1993). Bean (2005)
adds that student engagement is not understood in its entirety with behavioural components only
and that it includes cognitive and psychological aspects in addition to behavioural characteristics.
Student engagement is described as an active process in which students of diverse backgrounds
interact with each other relating to a particular topic (Comerford, 2005). This active student
involvement and engagement is an important factor that has been shown to influence student
learning and personal development (Astin, 1999), as well as student retention and persistence
(Tinto, 1998). In other words, student engagement occurs in a learning environment where
students are active participants and not merely passive recipients of their education (Astin, 1993;
Chickering & Gamson, 1987; Tinto, 1993; Pascarella & Terenzini, 2005).

28
Student engagement is an indicator of student success (Kuh 2001; Pascarella & Terenzini
2005). Success has a different meaning for different institutions. The means by which success
may be measured may also vary between institutions. For example, academic success may be
defined as persistence and graduation by an institution. On the other hand, academic success may
be defined by whether or not a graduate is able to pursue a career as a result of their education.
From the student’s perspective success may be reporting satisfaction with their college
experience or attaining marketable skills. In addition, success may be defined as the student’s
engagement in educationally purposeful activities. Institutions may measure academic success by
grades, graduation rates, retention rates, or student self-reports (Pascarella &Terenzini, 2005).
Student success may be defined differently by students and institutions depending upon their
own perspective or institutional research focus. In student success, student engagement is a key
factor in determining whether a student will survive and thrive in college, which in turn is
dependent upon the extent to which they take part in educationally purposeful and effective
activities (Kuh, et al., 2006). Kuh (2003) states that “[t]he engagement premise is deceptively
simple, even self-evident: the more students study a subject, the more they learn it. Likewise, the
more students practice and get feedback on their writing, analyzing, or problem-solving, the
more adept they become” (p.25). Therefore, one may assume that the more a student is engaged,
the chances of student success would also increase.
Student engagement has two key components that contribute to student success. The first
component is “the amount of time and effort the students put forth in their studies, activities and
experiences that have success-based outcomes (CCI Research Inc., 2009, p. 15). The second
component is the manner in which opportunities and services are provided by the institutions that
would encourage students to participate and benefit from their participation (CCI Research Inc.,
2009). Student engagement is a broadly-defined term that describes the student’s effort, interest
29
and time invested in meaningful education experiences inside and outside of the classroom (CCI
Research Inc., 2009). In other words, engagement includes academic, selected non-academic and
social aspects of the student experience (Krause & Coates, 2008). Student engagement represents
activities that are traditionally associated with learning, such as reading, writing, preparing for
class, and interacting with faculty. Other key activities include collaborating with peers on
projects, problem-solving tasks and community service. A review of the literature presents a
definition of student engagement that posits an association exists between engagement with the
college experience and optimal positive learning outcomes for the student (Bowen, 2005; Carini
et al., 2006; Kuh, 2003; Kuh, et al., 2006; Krause & Coates, 2008; Pascarella &Terenzini, 2005).
Studies of student engagement in higher education
Student engagement has been studied using the college impact model that seeks to
identify institutional and individual characteristics that have an impact on student outcomes in
the college setting (Astin, 1993; Astin, 1999; Chickering & Gamson, 1987; Pace, 1984; Tinto,
1993; Pascarella & Terenzini, 2005). The college experience consists of a number of events or
experiences that originate from the college environment. “Many of these experiences stem from
events and conditions which the college makes possible and which at least in some respect are
intended to facilitate student learning and development” (Pace, 1984, p. 7). In response to these
events and conditions, the student exerts some level of effort to engage themselves in the college
experience. The amount of involvement or engagement by the student would also reflect the
amount of physical and psychological energy that the student devotes to the college experience
(Astin, 1999). According to Kuh (2003) about one-fifth of first and senior year students
frequently come to class unprepared and state that their institutions “give little emphasis to

30
studying and spending time on academic work” (p. 27). In turn, it is the quality (effort) and
quantity (amount) of the engagement by the student that will determine outcomes.
Student engagement at the college level leads to positive outcomes including persistence
and commitment to the educational institution (Berger & Milem, 1999). In a study by Kuh
(2003) examining institutional engagement it was found that students reported gains such as
acquiring job related skills; broad general education; writing and speaking clearly; problem-
solving and independent learning as outcomes. Student level outcomes resulting from
engagement includes increased quality of learning, and personal achievement measured by
academic performance (GPA), and student persistence (Carini, Kuh, & Klein, 2006; Kuh et al.,
2008; Pascarella & Terenzini 2005; Pike & Kuh, 2005). In addition, studies have consistently
shown correlations between student engagement and improvements in desirable outcomes such
as general abilities and critical thinking (Kuh, 2003; Kuh & Vesper, 1997; Pike, Kuh, & Gonyea,
2003), student satisfaction (Kuh & Vesper, 1997), improved GPA (Astin, 1993; Carini et al,
2006; NSSE, 2005; Pike, Schroeder, & Berry, 1997); and persistence (Astin, 1993; Bean, 2005;
Bridges, Cambridge, Kuh, & Leegwater, 2005; Pascarella & Terenzini, 2005; Tinto, 1993).
Studies also show that students learn more when efforts are directed toward a variety of
educationally purposeful activities, in and out of the classroom (Hu & Kuh, 2002; Kuh, 2003;
Salamonson et al., 2009). Student engagement literature describes student and institutional
characteristics that are associated with engagement and presents correlations between student
engagement and academic success.
Demographic variables.
Student engagement literature identifies relationships between student engagement and
demographic characteristics (Astin, 1993; Chickering & Gamson, 1987; Pascarella & Terenzini,

31
2005). Overall, students who are engaged are on average full-time students, female, who live on
campus, native students (those who start and graduate from the same school), learning
community students, and students with a diversity of experiences (Kuh, 2003; Kuh et al., 2006;
NSSE, 2000; Pike & Kuh, 2005). These findings were expected as these students would take
more classes, read and write more, and spend more time preparing for class (Kuh, 2003). Other
student characteristics such as age, language (English/French), province of origin, and college
transfer status were not found to be significant predictors of engagement in Canadian
Universities (Conway et al., 2011).
Age. Age as a predictor variable in student persistence and retention has been found to be
consistent in nursing and higher education literature. A students’ age has been reported to range
from 18 to 23 years in the higher education setting defining a traditional student (Jeffreys, 2007;
NSSE, 2008; Pascarella & Terenzini, 2005).The traditional student is one that has recently
graduated from high school, lives on campus, is not employed, and has few family
responsibilities (Jeffreys, 2007; Pascarella & Terenzini, 2005). The NSSE 2011 survey results for
Canadian Universities indicated that 71% of the first-year students were 19 years of age or
younger and approximately 9% were 24 years of age or older. Younger students dominate the
first-year population with 86% of the students being 25 years or younger with those in the 22
years or younger category growing as the majority (The Association of Universities and Colleges
of Canada [AUCC], 2007). The AUCC findings are similar to the 2011 NSSE survey results. A
Pan-Canadian study of the College sector revealed that 47% of college entry students were 19
years of age or younger and only one-fifth were 25 years of age or older (Association of
Canadian Community Colleges, 2007). Furthermore, in nursing education a trend of more older
or mature students entering nursing programs has been noted (Salamonson & Andrew, 2006). In
a synthesis of the literature in nursing education and student profile characteristics, Jeffreys
32
(2012) found that older students demonstrated better study habits and time management, more
goal direction and self-direction, and had higher grades than the traditional student. On the other
hand, the non-traditional or older student has also been linked with additional role
responsibilities (such as employment and/or a caregiver) that may impact persistence and
retention (Jeffreys, 2012). In addition, studies report that non-traditional age first-year students
engage in more educationally purposeful activities (Gibson & Slate, 2010) and have higher levels
of engagement for the ACL benchmark (Conway et al., 2011).
Gender. The gender trends in Canada have indicated an upward slope for the number of
full-time women entering postsecondary institutions since the 1970s (AUCC, 2007). Women
account for 58% of the baccalaureate enrollment in Canada. This increase in the percentage of
women in higher education is not a unique occurrence for Canada and has been seen in most
countries (AUCC, 2007). The NSSE 2008 and 2011 survey results on U.S. institutions found that
36% of the respondents were male compared to 64% female. This finding was similar to Kinzie
et al. (2007) who examined the relationship between gender and student engagement. The sample
in this study consisted of 472,985 randomly sampled first and senior year students who
participated in the 2005 and 2006 NSSE survey in the U.S. The sample demographics revealed
36% were male students. In other words, 64% of the sample was female. This study also revealed
some intriguing differences between male and female engagement patterns across the U.S. Male
students were found to devote more time to non-academic activities such as relaxing and
socializing, exercising and participating in physical fitness and cocurricular activities. In
contrast, female students devoted more time to academic activities, preparing multiple papers,
and making class presentations. Furthermore, women exceed men in academic performance
during their first year of higher education (DeBard & Sacks, 2010; Kinzie et al., 2007).

33
When examining gender differences in engagement behaviours, differences were found
between male and female students. For the Level of Academic Challenge (LAC) benchmark,
female students scored significantly higher than their male counterparts and the effect was larger
for senior students (Kinzie et al., 2007). For the Active and Collaborative Learning (ACL)
benchmark, first-year male students scored higher than their female counterparts but the
difference was noted to be trivial. For the Student-Faculty Interaction (SFI) benchmark, first-year
male students scored higher than female students. For the Enriching Educational Experience
(EEE) benchmark, no significant differences were found between male and female students. For
the Supportive Campus Environment (SCE) benchmark, male students perceived the campus
environments as less supportive compared to women, however the difference was noted to be
trivial (Kinzie et al., 2007). Hu and Kuh (2002) also found that women undergraduates are more
academically engaged, and spent more time preparing for class. However, one also needs to
consider the area of study being examined as some majors, such as nursing, remain female
dominant and male students are underrepresented, and other areas of study are male dominant,
such as mathematics and engineering (Lackland & De Lisi, 2001). Nursing has been traditionally
a female dominant profession with 84% of the students being women (Jeffreys, 2007). This
proportion is even higher in Canada with the percentage of women in the field being reported as
high as 93.8% (CIHI, 2010).
Ethnicity. The majority of students in the higher education setting have been noted to be
Caucasian (NSSE, 2008). Similar findings have been noted in nursing in that historically nursing
students have been predominantly Caucasian (Jeffreys, 2012). When examining race and
ethnicity, NSSE results indicate that students from different backgrounds appear to engage in
educational practices at comparable levels (Kuh et al., 2006). However, some exceptions have
been noted. The findings indicate that Asian Pacific Americans and African Americans are

34
somewhat more likely to take part in enriching educational experiences than their peers; Latinos
and Caucasians are most satisfied with their college experience and African American students
are generally least satisfied; and African Americans report more Active and Collaborative
Learning activities and Asian Pacific Americans being the least engaged (Kuh et al., 2006).
Berger and Milem (1999) found that African American students enter the institution with strong
levels of institutional commitment but were less likely to perceive the institution as being
supportive. The authors also found that of all the entry student characteristics examined being
African American had a negative effect on persistence. Conway et al. (2011) examining
Canadian institutions reported that students from other ethnic groups (non-Caucasian) have
slightly lower scores on the SCE benchmark than Caucasian students. Kuh et al. (2008) found
similar results in that while exposure to effective educational practices generally benefits all
students, the effects were even greater for students from other ethnic groups and lower ability
students, suggesting that institutions should seek focus practices towards those that start college
with two or more risk factors such as first generation students, low income backgrounds, and
academically underprepared students.
First-generation status. Conway et al. (2011) examining Canadian institutions defined a
non-first generation student if either parent had completed university. So, for students who had
both parents that had not completed university, the student was defined as a first-generation
student. First-generation students tend to be less engaged and less likely to successfully integrate
college or university experiences than other students because they know less about the
importance of engagement and engagement activities (Pike & Kuh, 2005). Since first-generation
students are the first to attend a college or university in their family they may not have the
guidance, role model, or experience in a higher education setting that the second generation
student might have pertaining to activities of engagement and in turn student success.

35
Furthermore, students who have one or both parents with a completed baccalaureate degree are
more likely to attend university (AUCC, 2007). These students are twice as likely to attend
university when either parent has attained a degree (AUCC, 2007; Pascarella & Terenzini, 2005),
and students who have parents with education higher than a bachelor’s degree are five times
more likely to earn a degree compared with first-generation students (Pascarella & Terenzini,
2005). According to Pascarella and Terenzini (2005) “postsecondary education offers an
intergenerational legacy in children’s knowledge acquisition [and] …this effect is likely
attributable to the fostering of learning capital in offspring…” (p. 590).
Conway et al. (2011) reported that first-generation status was associated with lower
engagement levels. According to Kuh et al. (2006), parental education “is an important variable
for predicting college predisposition among all low socioeconomic status students, but the
strength of this relationship depends on students’ race and gender, rather than having the same
effect for all” (p. 20). Second generation students are more likely to have their parents’ guide
their educational planning, and are more likely to earn a bachelor’s degree (Pascarella &
Terenzini, 2005). The 2008 NSSE administration reported that 43% of respondents were first
generation students with neither parent having completed an undergraduate degree. Jeffreys
(2007) conducted a study with nursing students and found that first-generation status was
representative of 29% of the students in the sample.
Place of residence. Campus living can provide opportunities for students to integrate into
college life and living. Pascarella and Terenzini (1991) concluded that living on campus
significantly enhances effort and involvement in both academic and social experiences in college
as these students generally would have the opportunity to interact more with faculty and peers.
Living on campus was also identified as significantly increasing the chances of persisting in

36
college and earning a bachelor’s degree. However, the effects of living on campus on persistence
and degree completion are considered as more indirect rather than direct (Pascarella & Terenzini,
2005). Similarly, Pike et al. (1997) found that campus residences did not directly improve
academic performance and persistence in first-year students; instead it enhanced their integration
into the college environment. On the other hand, according to Astin (1993) retention is enhanced
by living in campus residences. When examining learning outcomes, living on campus had a
direct and positive effect on learning and intellectual development (Astin, 1993; Kuh et al.,
2006), and these students were less likely to withdraw from school (Hughes & Pace, 2003).
Living on campus also helped the development of peer communities and social networking,
which in turn has been shown to be a powerful influence on the student’s social and cognitive
development (Astin, 1993). According to the 2008 NSSE report based on U.S and Canadian
institutions, most of the students (44%) live in campus housing, with 38% living within driving
distance and 17% living within walking distance to campus.
Pike and Kuh (2005) in examining first and second generation students reported that
living on campus had a positive effect on academic engagement (p< .05), social engagement (p<
.01) and gains in learning and intellectual development (p< .001). Conway et al. (2011) when
examining Canadian institutions found that in particular the EEE benchmark scores decline
significantly as the distance from the student’s place of residence to campus increases (i.e. a
commuter student).
External Variables. External variables have also been referred to in the literature as
environmental variables. Dietsche (1989) defined environmental variables as “those over which
the organization has little or no control” (p. 27). Such external variables include family
obligations and responsibilities, employment, and commuting to campus. Overall, full-time
students are more engaged as these students tend to have fewer obligations, such as family

37
responsibilities, and off-campus work that would prevent them from taking part in educational
activities (Kuh, 2003). In this study, the external variables included working off campus,
commuting, and caring for dependents.
Working off campus. Studies have shown that working off campus has a negative
association with degree completion and retention (Astin, 1993; Pascarella & Terenzini, 2005).
Kuh et al. (2007b) found that students who spent more time working off-campus had lower first-
year grades. Hence this suggested a negative correlation between working and retention.
Similarly, these students spent less time attending class, studying, and doing homework
(Dietsche, 1989; Pascarella & Terenzini, 2005). However, an opposite effect can be noted when
the student is working on campus. Students who work on campus are more likely to be involved
in campus activities and interact with faculty members (Astin, 1993), as well as increase the
chances of student persistence (Pascarella & Terenzini, 1991).
In a study examining academic engagement in nursing students, Salamonson et al. (2009)
reported that working part-time was a significant predictor of academic performance. Activities
and external commitments as such precluded these students from participating in certain
educational activities and taking full advantage of the college experience. These findings are
consistent with the conclusions made by Pascarella and Terenzini (2005) that work has a
significant negative association with academic effort, involvement and time spent studying. In
fact, working part-time off campus was found to have similar patterns as those that were
associated with students working full-time, which indicated a most profound negative effect with
bachelor’s degree completion (Astin, 1993).
Commuting. Time spent commuting to class per week has also been noted in the
literature to have similar patterns as working off campus. The commuter has been described in

38
the literature as the student whose residence is not on campus or in a fraternity or sorority house.
Commuting to campus has been shown to be negatively associated with degree attainment and
retention (Astin, 1993), and lower engagement scores (Conway et al., 2011). Astin (1993) also
reported that as the time spent commuting increased, the level of stress experienced by the
students also increased. In a dated study Chickering (1974) summarized commuter students as
“students who live at home, in comparison with those who live in college dormitories, are less
fully involved in academic activities, in extracurricular, and in social activities with other
students” (p.84). The commuter student may have limited opportunities to engage in social
activities, meet other students, or have less faculty contact. According to Kuh (2001) first-year
students who live on campus have higher gains in personal and social competence than those that
drive to campus. Astin (1993) also reported that commuting was viewed as a negative factor in
the college experience. Kuh, Gonyea and Palmer (2001) examined the engagement levels of the
commuter student. They found that approximately 67% of first-year students lived on campus,
most were female, younger than 19 years of age, and with fewer hours per week spent on
working and caring for dependents. Commuter students were representative of the non-
traditional or older students, first-generation students, those who worked more hours off campus
and spent more time caring for dependents. Furthermore, commuters were found to have less
contact with their teachers, did not take part in cocurricular activities, study abroad, and
internships. However the findings also revealed several key NSSE areas in which the commuter
resembled their non-commuter counterparts. These activities included working harder than they
thought, working with other students on projects during class, asking questions, discussing ideas,
writing long papers and reading on their own for personal enjoyment or academic enrichment
(Kuh et al., 2001). Overall, the findings of Kuh et al. (2001) were consistent with other research
examining the commuter student (Chickering, 1974; Pascarella & Terenzini, 2005). Research

39
concludes that distance to campus makes a difference in the engagement level of the commuter
student, but in some of the areas identified above these students are comparable to their non-
commuter counterparts.
Caring for dependents. Another constraint on the student’s time is the number of hours
spent per week caring for dependents. Limited studies were identified that examine the impact of
this variable and engagement measures. Caring for dependents at home is seen as a risk factor
that threatens persistence and graduation from college (Kuh et al., 2006). Kuh et al. (2006)
reported that about 55% of older female students spend more than 30 hours per week caring for
dependents that live with them compared with only 15% of older male students. According to
Jeffreys (2012), having more family responsibilities and obligations may interfere with the
student’s attendance, study skills, grades, interactions, and retention, especially if these caring
activities are seen as a deterrent. If these students are spending more time per week attending to
family responsibilities this in turn would serve as one of many explanations why these students
may be spending less time in academic activities such as studying and preparing for class
(McCormick, 2011).
Academic variables.
Preparing for class. Student involvement in academic activities, such as attending class,
preparing for class, or working on assignments, impacts success and persistence in higher
education (Astin, 1993). To assess the quantity of student involvement in academic work, Astin
(1993) used three measures of academic involvement including the time spent attending classes
or labs, studying or doing homework, and using a personal computer. Hours spent per seven-day
week preparing for class, such as studying or doing homework was found to have a stronger and
more widespread positive effect than other involvement measures. This variable was positively
40
related to academic outcomes such as retention, graduating with honors, enrollment in graduate
school, and self-reported increases in cognitive and affective skills (Astin, 1993). According to
Astin (1993) this measure is also positively related to all measures of satisfaction, and careers in
science, engineering, and college teaching. Students who spent more time studying per week
tend to have higher grades (Kuh et al., 2007b). Dietsche (1989) also reported that the amount of
student involvement in academic activities (such as preparing for class) contributes significantly
to student persistence in the college setting. In a nursing study examining the effect of time spent
studying and academic performance, Salamonson et al. (2009) found that time spent in
homework completion and lecture attendance had a positive correlation with academic
performance. And homework completion emerged as the strongest predictor to academic
success.
Academic grade point average. Pascarella and Terenzini (2005) concluded that college
grades are the “single best predictors of student persistence, degree completion, and graduate
school enrollment” (p. 396). A students’ grades make statistically significant and often the
largest contribution to student persistence and attainment (Pascarella & Terenzini, 2005). Studies
have revealed that engagement and grades go hand in hand. Carini et al. (2006) found that the
level of student engagement is positively related to GPA. “In fact, GPA is positively related to all
of the effective educational practices measured by NSSE ” (Kuh et al., 2006, p. 76). Conway et
al. (2011) also reported for Canadian universities that high school and current grades were strong
engagement predictors for first-year students. In addition, self-reported gains were also found to
be positively related to GPA (Carini et al., 2006). On the other hand, Hughes and Pace (2003)
reported that student attrition was related to grades that were a “C” or lower. According to the
NSSE 2008 findings, 40% of first-year students reported earning “A” grades and about 5%
reported earning “C” grades or lower.

41
Kuh, Kinzie, Cruce, Shoup, & Gonyea (2007b) examined the effects of multiple
measures of time on task on first-year GPA. Students who spent more time working off-campus,
participating in cocurricular activities, and relaxing or socializing had lower first-year grades
(Kuh et al., 2007b). Furthermore, students who worked part-time also spend less time attending
class, studying and doing homework (Dietsche, 1989). In contrast, students who spent more time
studying per week had a positive effect on first-year GPA (Kuh et al., 2007b). These findings are
consistent with the engagement premise that the more the students studies a subject, the more
they retained the subject matter, and the more they learnt it (Kuh, 2003). Overall the NSSE
findings for academic performance indicated that women report higher grades than men;
Caucasian students generally report higher grades than students of other races; grade patterns
vary by major fields; and that grades do not vary significantly by institutional type (Kuh et al.,
2006).
Fuller, Wilson, and Tobin (2011) examined whether each NSSE benchmark predicted
GPA in a cross-sectional and longitudinal sample of students. They found that the LAC
benchmark emerged as a significant predictor of final cumulative GPA in first-year students. On
the other hand, there was no evidence that LAC scores predicted cumulative GPA for senior year
students. The ACL benchmark was a significant predictor of cumulative GPA when it was
completed by senior students. However, there was no evidence of a similar relation for first-year
student scores. The results also suggested that cross-sectional analyses can adequately detect
modest effects on final GPA (Fuller et al., 2011). Similarly, according to Kuh (2002), GPA has
been noted to be positively correlated with all five of the NSSE benchmarks. The higher the
engagement, the higher the grades!

42
Social Variables.
In view of a holistic approach to student engagement, activities both in and outside of the
classroom must be considered. It is these activities that help integrate the first-year student to the
college environment. As stated by Tinto’s (1993) theory of student departure, students bring with
them personal characteristics and goals, skills, and academic knowledge that will be reshaped
through their interactions in the higher education setting. Those who successfully integrate will
persist, while others who do not will depart. The formal and informal activities or opportunities
to engage with peers, and faculty lead to greater student integration and in turn persistence
(Pascarella & Terenzini, 2005). According to Astin’s theory of student involvement,
involvement in out of class activities and experiences are beneficial to student development
(Astin, 1984) and in turn promote retention (Astin, 1993; Tinto, 1993). In this study these
measures of student involvement or out of class experiences include the amount of physical
fitness or exercise the student participated is during the school year and cocurricular activities
(such as participation in organizations, campus publications, student government, fraternity or
sorority, and intercollegiate or intramural sports).
Physical fitness activities. Participating in exercise or fitness activity creates an
opportunity for students to interact with each other and develop a sense of belonging (Buccholz,
1993). Exercise also has numerous health benefits including the reduction in stress and weight
gain, and mental health well-being (Chan, 2014; FitzGerald, 2015; Hawker, 2012). Nursing
students tend to experience higher stress levels compared with other professionals, as a result of
the on-going assessment in the classroom and clinical settings (Gibbons et al., 2007; Hallin &
Danielson, 2007). Participation in physical fitness activity has been found to not only improve
mental well-being but in turn also decrease the risk of anxiety and depression in students
(Hawker, 2012). Moderate amount of exercise has been shown to be positively associated with
43
perceived health and negatively with depression (Adams, Moore, and Dye, 2007). According to
Astin (1993) physical health, emotional health, and leadership abilities are all positively affected
by exercise. Furthermore, studies have shown that first-year student participation in fitness
activity has positive correlations with academic performance (GPA) and persistence (Hackett,
2007; Judge et al., 2014). Even though the benefit of exercise is evident in the literature, a meta-
analysis reports high non-participation rates ranging from 36% to 50% in college students
(Keating, Guan, Pinero, & Bridges, 2005). Since physical exercise is an activity that promotes
student involvement, this out of classroom activity may in turn support the student’s integration
into the college setting.
Cocurricular activities. Cocurricular experiences not only play a crucial role in student
development in higher education (Pascarella & Terenzini, 2005) but also impact academic
performance (Kuh et al., 2008). Zacherman and Foubert (2014) found a curvilinear relationship
between the hours per week spent in cocurricular activities and GPA. The authors reported that
academic performance improved with up to 10 hours per week of involvement in cocurricular
activities. Participation in moderate to high amount (11 – 30 hours) was neither detrimental nor
beneficial to academic performance. However participation in excessive activities (more than 30
hours per week) was negatively related to GPA in college students. On the other hand, Kuh et al.
(2007b) reported that students who spent more time participating in cocurricular activities had
lower first-year grades and the NSSE results revealed that first-year student participation in
cocurricular activities more than five hours was correlated with a decrease in GPA (Kuh et al.,
2008).
Research has also shown that student interaction with peers can positively influence
overall academic development (Kuh, 1993) and foster learning (Astin, 1993). Peer interactions
that foster learning include: working on group projects for classes; tutoring other students;

44
participating in sports; being a member of a social fraternity or sorority; and spending time each
week socializing or in student clubs or organization (Astin, 1993, p. 385). Studies examining
cocurricular activities such as social fraternities or sororities (commonly called Greek
organizations) have presented mixed findings. Pascarella et al. (1996) found that Greek
affiliation had negative effects on students’ learning, intellectual development, and academic
performance of first-year students. These negative effects are found to diminish in magnitude in
their second and third years of study (Pascarella & Terenzini, 2005; Pascarella, Flowers, &
Whitt, 2009). These findings are somewhat surprising as research has also shown that fraternity
and sorority members tend to be more involved (Astin, 1993; Pike, 2000) and involvement is
positively related to student learning and intellectual development (Astin, 1993; Pascarella &
Terenzini, 2005). In contrast, Pike (2003) found that Greek affiliation had a weak positive
relationship with engagement and gains in learning, than non-Greek students. Fraternity or
sorority members were at least as engaged as non-Greek students. In addition, senior Greek
students were significantly more involved, reported making significantly greater gains in
academic and personal development than senior non-Greek students (Pike, 2003). DeBard and
Sacks (2010) also found that fraternity or sorority affiliation had positive effects on various
measures of academic performance during the first-year of college compared to those students
who decided to remain unaffiliated. Furthermore, affiliated and non-affiliated men had academic
performance below that of their female counterparts.
Another out-of-class activity that impacts academic learning is that of student athletes.
Student engagement studies have shown that athletes participate as often or more than their non-
athlete peers in effective educational practices (NSSE, 2005; Umbach, Palmer, Kuh, & Hannah,
2006). Athletes (male and female) reported greater gains in the areas of personal and social
development compared to non-athletes (Umbach et al., 2006). In addition, male student athletes

45
reported earning lower grades that their non-athlete peers, whereas female student athletes
reported similar grades as female non-athletes (Umbach et al., 2006). Even though the literature
indicates that involvement in cocurricular activity is positively associated with student
persistence, approximately 43% of first-year students at four-year colleges will not spend time
participating in the activities (NSSE, 2005).
Institutional Variable.
Institutional size. The institutional measure examined in this study was university size.
“Institutional characteristics have few if any direct effects on measures of student success” (Kuh
et al., 2006, p. 52). Other institutional characteristics include size, sector, control, mission,
residential character, endowment, structural diversity and student-faculty ratio (Kuh, et al.,
2006). A comprehensive review of the research on the impact of college on students reveals that
the results of the effect(s) of these institutional characteristics on student success are inconclusive
(Pascarella & Terenzini, 2005). However, the institutional characteristic of size has been
described in the Canadian and U.S. literature as a variable that is inversely related to student
persistence, degree completion, educational attainment, and development of social self-image,
though the impact is small and indirect (Pascarella & Terenzini, 2005). Furthermore, the
synthesis concluded that large institutions also appeared to have small, positive direct effects on
occupational status and earnings. Similarly Astin (1993) also found that large institutions had
negative effects on student satisfaction, with the quality of instruction, support services, overall
college experience, GPA, degree aspirations, and student interest in pursuing careers majoring in
physical sciences, to mention a few.
Overall the findings in the literature indicate that smaller schools generally engage
students more effectively, and are more academically challenging. The NSSE research on

46
American institutions indicates a decline in the engagement level for several benchmarks as
institutional enrolment increases (Kuh, 2003; NSSE, 2002). Conway et al. (2011) reported the
same pattern for Canadian institutions, in which small institutions experience higher average
scores for the first-year SCE, SFI, and ACL benchmarks. The EEE and LAC benchmarks were
insensitive to institutional size. Similarly Kezar (2006) also concluded that institutional size was
related to the LAC, ACL, SFI, and SCE benchmarks. According to Kuh et al. (2006) there are
various reasons why smaller institutions have higher engagement scores. First, smaller
institutions may be geographically isolated increasing the likelihood that students will be living
in close proximity to one another and close to campus. Smaller institutions tend to have smaller
class sizes and student-faculty ratios, making it easier for faculty to know the names of the
students, and for students to be engaged in dialogue amongst themselves contributing to the
social and academic integration to the institutional environment (Kuh et al., 2006) and academic
success (Astin, 1993). In addition, Conway et al. (2011) also reported that institutional size and
identity were stronger engagement drivers than student characteristics and academic program
mix variables which were also significant. The literature examining the differences in student
engagement between institutions also revealed that engagement tends to differ more within a
given institution than between institutions (Kuh, 2003).
Minimal studies were identified that examined first-year nursing student characteristics in
the Canadian context. Furthermore, the relationship between first-year nursing student and
institutional characteristics and academic performance has not been examined in the literature in
Canada. As discussed in the proceeding sections, nursing literature has examined student success
rates on the national licensing examination and grades in higher education using high school
predictors and current course grades. However any potential relationship between the student and
institutional characteristics and grades is an area that requires further study.

47
Studies of student engagement in nursing
Nursing programs traditionally keep track of student progression, graduation rates and
success rates on the national licensure exam. These measures may guide nursing programs in
monitoring their success and allow feedback or maintain strategies to facilitate student success
(Robertson et al., 2010). A number of variables have been studied in various combinations by
researchers examining nursing student success and retention. Academic success has been
operationalized in various ways. For example, academic success may be grades in a specific
course, or the overall GPA at the end of the semester or the end of the year in the program. A
review of the literature in nursing education identified that research has focused on factors (GPA,
past science grades, demographic variables) that predict success in nursing students and retention
(Arathuzik & Aber, 1998; Campbell & Dickson, 1996; Jeffreys, 2006; Peterson, 2009);
predicting success on the national licensure exam (Abbott et al., 2008; Alameida et al., 2011;
Arathuzik & Aber, 1998; Beeson & Kissling, 2001; Campbell & Dickson, 1996; Higgins, 2005;
Sayles et al., 2003); understanding and predicting attrition and retention (Cameron et al., 2011;
Jeffreys, 2007; Pence, 2011; Wells, 2003; Williams, 2010); evaluating nursing success programs
(Hadenfeldt, 2012; Symes et al., 2005); and the use of active learning strategies in the classroom
(Beers & Bowden, 2005; Diekelmann, 2005; Patterson-Johnson & Mighten, 2005; Popkess,
2010; Reyes, 2007). Few studies were identified in the literature review that examined different
aspects of student engagement (Bruce, Omne-Ponten, & Gustavsson, 2010; Feingold et al., 2008;
Popkess & McDaniel, 2011; Reyes, 2007; Salamonson et al., 2009). Limited studies were
identified that examined nursing student engagement, using the NSSE survey, as a key factor in
student success (Popkess & McDaniel, 2011).
“[The] literature documents a lack of standardization of terms and measurement
processes” (Robertson et al., 2010, p. 100), and academically sound benchmarks (Robertson et

48
al., 2010). In addition, the majority of the nursing research was conducted by researchers in the
United States, with a few studies identified from Australia, and the United Kingdom. One model,
the model of nursing undergraduate retention and success (NURS), was identified in the
literature by Jeffreys (2012) that examined U.S. nursing student retention which was analogous
to the student engagement theories in higher education and incorporated some of the features of
the NSSE. However, limited studies were identified that have used the NURS model, as well as
any information pertaining to the reliability and validity of the tool. “The NURS model proposes
that retention decisions will be based on the interaction of student profile characteristics, student
affective factors, environmental factors, professional integration factors, academic outcomes,
psychological outcomes, and outside surrounding factors” (Jeffreys, 2012, p. 15).
Predicting success in nursing students.
In January 2015, the Canadian Registered Nursing Examination was replaced with the
National Council Licensure Examination for Registered Nursing (NCLEX-RN) across Canada
(CASN, 2015). “This substantial change is likely to have a profound impact on Canadian
undergraduate nursing degree program practices.” (Sears, Othman, and Mahoney, 2015, p. 10).
According to Sears et al. (2015), an examination of the factors that influence student success on
the NCLEX in the U.S. may provide insight for Canadian nursing programs. Sears et al. (2015)
conducted a systematic review to identify and synthesize studies examining the relationship
between undergraduate nursing program performance and NCLEX-RN performance. The studies
included in this review were predominantly American. For academic factors, the review
concluded that some nursing courses have significant predictive value in determining success on
the NCLEX-RN. Individual factors, such as demands on time by family (or stress), were found to
be highly inversely correlated to success on the exam. Older age was found to be a significant

49
predictor of success. Overall, the studies examined in this review presented mixed results for
individual factors to predict NCLEX-RN success (Sears et al., 2015). With a new national
examination in Canada, that has limited reliability or validity information in the Canadian
context, warrants a closer look at the factors or predictors of success for all nursing students.
Campbell and Dickson (1996) conducted an integrative review and meta-analysis of the
literature to describe and evaluate nursing education research on predictors of retention,
graduation and national licensure examination success of baccalaureate nursing students. They
examined a total of 47 (43 descriptive, 3 experimental, 1 quasi-experimental) U.S. published
research studies between the years 1981 to 1990. Most of the studies used a sample of
convenience. Most of the nursing studies did not report the use of a conceptual framework,
operational definitions, and reliability and validity of instruments. The findings of the integrative
review showed that there are cognitive, self-enhancement and demographic predictors of success.
Cognitive variables that demonstrated significance in predicting retention, graduation, and
nursing licensure exam success included GPA, pre-admission testing scores, standardized testing
scores, and science (chemistry, and biology) GPAs. The findings were congruent with other
nursing studies that showed the best predictors of academic achievement to be the GPA in
nursing and science courses. Self-enhancement variables studied include cognitive/learning style,
self-concept/esteem, test anxiety, social support, and situational variables. Only test anxiety and
self-concept/esteem showed any correlations with nursing licensure exam success. Demographic
variables that demonstrated significance included parental education, age, race/ethnicity, finance,
and gender. Only parental education and age were the best predictors of success. The findings
indicated that there is a “continued inability of nursing research to consistently identify student
50
characteristics predictive of successful retention, graduation, and NCLEX success” (Campbell &
Dickson, 1996, p. 57).
In a descriptive correlational design, Arathuzik and Aber (1998) studied academic and
non-academic factors associated with success on the national nursing licensure exam. Significant
correlations were found between success on the U.S. national licensure exam and cumulative
undergraduate nursing program GPA, English as the primary language spoken at home, lack of
family responsibilities or demands, lack of emotional distress and sense of competency in critical
thinking. However, with a small sample size (n=79), the findings of this study are not
generalizable to the population at large.
Beeson and Kissling (2001) conducted a study in the U.S. with 505 graduates to identify
predictors of success on the NCLEX licensure examination. The results indicated that students
who passed the nursing licensure examination had significantly higher biology and sophomore
nursing GPAs. The most significant predictor of success was the number of C, D, and F grades
earned in nursing courses through the junior year. Students who earned even one ‘C’ by the end
of the sophomore year in a nursing course were more likely to fail the licensure examination.
Age as a variable was positively correlated with nursing licensure examination success. Non-
traditional students were more likely to pass the licensure exam with higher grades than
traditional students (Beeson & Kissling, 2001).
In another study examining the predictors of nursing licensure exam success, Abbott et al.
(2008) found that pre-RN assessment exam scores were significantly related to the nursing
licensure exam results. In addition, those students with previous science degrees and higher
admission GPAs were more likely to pass the examination. Similarly, Sayles et al. (2003)
reported that nursing math and reading entrance test scores and GPA (in required courses) were

51
significantly related to nursing exam success. In addition, Higgins (2005) also found a
relationship between successfully passing the licensure exam and academic grades in biology. In
a Canadian study, using a sample of 258 baccalaureate nursing students, Wong and Wong (1999)
reported that cumulative GPA in nursing courses was significantly correlated with age. They also
identified a correlation between science GPA and licensure scores.
Research in the U.S. examining demographic factors contributing to passing the national
licensure exam yielded varied results. According to Beeson and Kissling (2001), age as a
variable was related to performance on the national exam. It was found that students who were of
non-traditional age had a higher passing rate (95.7%) than those students who were of traditional
age (88.3%). Campbell and Dickson (1996) in an integrative review of 47 studies also identified
age as a significant variable in five of those studies. Several studies indicated that gender was not
significantly different for students (Beeson & Kissling, 2001; Higgins, 2005; Sayles et al., 2003).
Sayles et al. (2003) reported that graduates who were successful on the licensure exam were
predominantly Caucasian students. According to Haas, Nugent, and Rule (2004) failure rates
were higher for African American and Asian students in comparison to Caucasian students.
Campbell and Dickson (1996) also found that ethnicity was identified as significant in one study
to predict graduation and in two studies as predicting success on the national exam. Alameida et
al. (2011) and Jeffreys (2006) reported no statistically significant relationships between graduate
demographic characteristics and licensure exam success. Peterson (2009) examining self-esteem,
self-efficacy and environmental variables in predicting success for nursing students also found
no statistically significant relationships. The current research presents a mixed view of
demographic factors contributing to nursing student success.
52
Predicting retention in nursing students.
Cameron et al. (2011) conducted an integrative review of the literature to identify student
characteristics and strategies in research studies investigating student retention in nursing
education. A total of 15 studies were identified and reviewed from the United Kingdom. Two
broad themes emerged from the analysis, program and personal. The program theme identified
issues specific to preregistration programs of nursing and midwifery. This theme comprised of
profession knowledge of the role and personal experience of being cared for, and academic
support that enabled students to continue their studies. The second theme identified personal
factors that were important in keeping the students in the program. Subthemes included student
characteristics and family. Cameron et al. (2011) found that support was frequently cited as a
vital element in retention, remediation programs and personal commitment leading to increased
program retention. Family pressures were cited as reasons for student attrition. Even though
support was identified as an essential element for retention, the definition of support was not
explicitly stated and needed to be more clearly articulated.
Jeffreys (2007) examined non-traditional students’ perceptions of variables influencing
retention in nursing students. The sample consisted of 1,156 nursing students enrolled in degree
programs in multiple sites. The demographic characteristics included 84% of the sample as
women, 32% as Caucasian, with 50% over the age of 30 years. Approximately 65% of the
students were enrolled part-time and 29% were first generation students. Jeffreys (2007) found
that non-traditional nursing students perceived environmental variables as more influential for
retention than other variables (professional integration and socialization variables). In addition,
the results demonstrated that employment significantly affected environmental factors. On the
other hand, Pence (2011) found that the demographic variable of age was the only statistically
significant predictor of retention at the end of the first nursing course. The findings suggested

53
that older students may be more likely at risk for early departure from nursing programs than the
traditional younger students. Similarly, Jeffreys (2007) also reported that attrition was higher in
older students since older nursing students may have additional role responsibilities, hence
increasing their risk for attrition. On the other hand, Salamonson and Andrew (2006) found that
older nursing students were more likely to be successful than the younger traditional student.
Research studies examining age as a predictor for retention have found inconsistencies.
Williams (2010) conducted a qualitative study with a purposive sample (n=10) to
understand persistence in beginning nursing students. Four major themes emerged from the
interviews as key to persistence in these students. The themes included: keeping up, doing it, not
giving up and connecting. All of the students interviewed were persisters who continued their
studies in nursing.
The use of active learning strategies in nursing education.
Studies in nursing education research have revealed that active learning in the classroom
have a positive effect on student outcomes (Beers & Bowden, 2005; Diekelmann, 2005;
Patterson-Johnson & Mighten, 2005; Popkess, 2010; Reyes, 2007). Most of these studies
examined teaching methods and active learning strategies and its effects on student outcomes.
Beers and Bowden (2005) used a quasi-experimental design, with a control group to
compare the effects of problem-based learning and traditional lecture on the nursing student’s
long-term retention of content. This study used a sample of convenience of baccalaureate nursing
students (n=46). Statistically significant differences were found between the mean scores on
Post-test 1 (m = 4.98) and Post-test 2 (given one year later; m = 6.23) in the problem-based
learning group.

54
Patterson-Johnson and Mighten (2005) likewise used a quasi-experimental design to
examine the scores of two groups in a medical-surgical course. The control group (n=88)
received the lecture only. The experimental group (n=81) received a structured group discussion
and lecture. A statistically significant difference was found between the mean examination scores
of the experimental and control group. The findings indicated that the examination scores of
students who received lecture notes and structured group discussions as a teaching method were
significantly higher than those who received the lecture only. Diekelmann (2005) also examined
the concept of engagement in the classroom with nursing students and teachers as co-creators of
a learning environment. Nursing instructors who reported boredom while teaching, also had
students in their classrooms who were not engaged. Diekelmann (2005) suggested that for
positive student outcomes in the classroom, teachers must be willing to explore new processes
and change the environment of the classroom. The findings of these studies were similar to the
literature on student engagement in higher education in that they suggested that student success
is a product of the inputs and the environment (Astin, 1984; Pascarella & Terenzini 2005).
Popkess (2010) conducted a descriptive study to measure the level of engagement and
perceived degree of active learning in the classroom reported by nursing students. The purpose of
this study was to determine relationships among student engagement, demographic, and
academic variables and learning environments. The sample consisted of 347 undergraduate
baccalaureate nursing students. T-test and ANOVA analyses were conducted to compare group
differences. The results indicated a significant difference in the level of student engagement
related to the perceived active learning outcomes in the classroom. Students in active and mixed
learning environments reported higher engagement levels than those in passive learning
environments. Students who were over the age of 25 years, and with higher GPAs reported
significantly higher engagement scores than their counterparts. The findings from this study
55
suggested that student engagement in the learning process may be positively influenced by an
active learning environment in the classroom. The findings of Popkess (2010) were similar to the
literature on student engagement in higher education (Kuh, 2003; Pascarella & Terenzini 2005).
Reyes (2007) used a correlational research design to examine the relationship between
classroom engagement activities and the academic performance of professional nursing students
using the Classroom Survey of Student Engagement. The sample consisted of 317 university
nursing students enrolled in seven different nursing courses. The student engagement responses
were compared to the numeric grades earned in their respective courses. The findings revealed
significant relationships between specific engagement practices and grades earned in a course.
The findings revealed that nursing students respond in the same manner as an average college
student, in response to engagement activities. Since educational practices and engagement
activities are associated with higher grades and student self-reported educational gains (Kuh,
2003; Pascarella & Terenzini 2005), student retention and persistence follow closely after (Tinto,
1988).
Benchmarking nursing student engagement.
Studies were identified in the literature review that examined different aspects of student
engagement (Bruce et al., 2010; Feingold et al., 2008; Popkess & McDaniel, 2011; Salamonson
et al., 2009). Only one of these American studies examined nursing student engagement using
the five benchmark scales of engagement from the NSSE tool (Popkess & McDaniel, 2011).
Research on nursing student engagement has focused primarily on learning outcomes.
“[F]ew studies considered whether student engagement can indicate how effectively students
cope with stress in the higher educational environment” (Bruce et al., 2010, p. 2). Bruce et al.
(2010) surveyed nursing students during their three-year education and examined active and

56
emotional engagement. The results indicated that active engagement increased and emotional
engagement decreased during the study years. Male, older students and those with prior assistant
nurse education had higher active engagement than other students. Conversely, in higher
education, Kuh (2003) reported that women were more engaged. Similarly Bruce et al. (2010)
also found that female, older students, with good self-rated health and those attending
universities had higher emotional engagement. Studies examining gender differences and
engagement presented varied results. Overall the findings suggested that higher educational
institutions need to be attentive to and nurture student engagement in learning situations or have
student engagement programs that are discipline specific, as this may increase the student’s
ability to cope with stress.
Feingold et al. (2008) examined team learning using observations and interviews in
nursing education. Results of the study indicated that almost all of the students in the team
learning environment were on task 51% of the class time, and engaged in instructional activity
84% of the class time. Learner-to-learner engagement was to predominant direction of
engagement at 70% of the time, with learner to instructor engagement direction of engagement at
17% of the time. The data from the classroom observations were consistent with the literature
and demonstrated that team learning promotes student engagement. Feingold et al. (2008) also
noted that this evidence supports “the aim of developing interactive learning and teamwork
among students in the health professions” (p. 221).
In another study with nursing students, Salamonson et al. (2009) examined academic
engagement and disengagement as a predictor of performance among nursing students. Using a
prospective survey design, this study examined three elements of academic engagement
(homework completion, lecture attendance, and study hours). The results indicated that
homework completion emerged as the strongest positive predictor of academic performance,

57
followed by lecture attendance. Time spent studying was not a significant predictor of academic
performance. This is contrary to the literature in higher education that have found that time spent
studying is a determining factor (Kuh et al., 2007b).
One study was identified that examined nursing student engagement using the NSSE
survey. Popkess and McDaniel (2011) conducted a secondary analysis of 3000 randomly selected
students in nursing, other health professions and teaching majors from the 2003 NSSE data set.
The design of this study was a descriptive correlational design to examine freshmen and senior
year students. Each group of 1,000 subjects included 500 first-year and 500 senior students. The
researchers analyzed the data using ANOVA and t-tests to examine relationships using selective
demographic data and the five benchmark scales of engagement from the NSSE data. The results
indicated that freshmen were significantly less engaged than seniors in four of the five NSSE
scales. Nursing and health profession majors were less engaged in collaborative learning than
students in education majors. Nursing students also perceived themselves as significantly more
academically challenged than students in other majors. Nursing and other health students
indicated that they spent significantly more time studying than education major students. The
results revealed that the mean scores of freshman (first-year) nursing students were significantly
lower than those of seniors on four of the five engagement benchmark scales. Also the
significant differences between freshmen and senior nursing students on all but one benchmark
scale are consistent with the findings in the literature. Popkess and McDaniel (2011) found that
even though nursing students were engaged in rigorous curriculum, they did not perceive
themselves to be engaged in student centered and interactive pedagogies.

58
Linking Student Engagement and Nursing Student Academic Success
The literature acknowledged the link between certain educational best practices and
student engagement, as noted above. The literature also indicated that when students are actively
involved in their learning, positive outcomes resulted including improved problem-solving,
critical thinking, and persistence. “However, the discipline of nursing lacks evidence that
evaluates student characteristics and engagement as a function of successful academic outcomes
based on best practice models” (Popkess & McDaniel, 2011, p. 13). Hence understanding student
engagement is crucial for nursing, as it presents an indicator for student learning potential and
learning outcomes (Popkess & McDaniel, 2011). As indicators for student success are identified
for nursing students, this new knowledge in the Canadian context could be used to create
institutional persistence programs focused on the identified specific demographic variables and
engagement items. In turn, nursing student persistence would positively affect the student
attrition and graduation rates as more students are successful.
Studies examining engagement in higher education present a profile of the students who
are at–risk of dropping out and those students who are disengaged (not engaged). Characteristics
of the disengaged student include: majority male students, in part-time studies, from age of 24
years and younger, students from other ethnic groups, and students with lower grades or GPA
(Center for Community College Student Engagement, 2009; Kuh, 2003; Laird, Chen, & Kuh,
2008). On the other hand, nursing literature examining student attrition rates indicated no
statistically significant differences between genders (Higgins, 2005; Stickney, 2008). Nursing
studies revealed that attrition has been found to be higher for English as a Second Language
students, older or mature students, those from other ethnic groups, and student’s with lower math
skills or lower GPA (Hines, 2002; Leroy, 2008). A difference in the age of the students who are
leaving nursing and those that are ‘at-risk’ in student engagement studies is noted. For a mature,

59
non-traditional, student to leave their studies may be expected as the student is perhaps also
working, has family obligations, or other stresses. Higher education student engagement
literature acknowledges and notes the challenges and differences between the traditional and
non-traditional students with similar reasoning (Kuh, 2003), as does the nursing literature. Other
common characteristics between the ‘at-risk’ student and nursing students who are leaving
include those who are from other ethnic groups, and have a lower GPA. Overall, students who
are leaving nursing programs have similar characteristics in comparison with those students who
have been identified as ‘at-risk’ students in higher education student engagement studies. Hence,
nursing educators and post-secondary administrators need to first examine the characteristics of
nursing students that are associated with engagement in order to be able to successfully
implement active student engagement activities in nursing programs to retain graduates.
Instruments to measure student engagement
The literature identified different instruments that have been utilized in the Canadian
context examining first-year students. Two instruments identified included the Ontario College
Student Engagement Survey and the Freshman Integration and Tracking System (CCI Research
Inc., 2009). Both of these instruments have been used to examine student retention, success and
to profile student characteristics in the college setting. The purpose of this research study was to
examine student engagement in first-year nursing students in baccalaureate nursing programs.
These instruments were not considered as a survey instrument of choice for this study since
nursing education for Registered Nurses is a four-year Baccalaureate degree and is granted by a
University. In addition, college surveys focused on identifying student determinants of first-term
retention and success or at-risk students (CCI Research Inc., 2009) rather than student
engagement.

60
The National Survey of Student Engagement (NSSE).
The NSSE survey is a widely used instrument that captures student engagement activities.
NSSE was developed by the Indiana University Center for Postsecondary Research to assess the
undergraduate student experience. It has been designed to assess the extent to which students are
engaged in good educational practices and what they gain from their college experience (Kuh,
2002). The main content of NSSE represents student behaviours that are “highly correlated with
many desirable learning and personal development outcomes of college” (Kuh, 2002, p. 2).
These educational practices have been empirically linked by studies to desired outcomes such as
student persistence, satisfaction, graduation and success. The NSSE survey requires that the
student reflect on what they are putting into and getting out of the postsecondary experience. The
survey captures aspects of the student experience and behaviours, which represent the multi-
dimensional nature of student engagement (Appendix A). Each question is assigned to a cluster
of similar activities that have led to the development of five national benchmark scales of
effective educational practice (NSSE, 2000). The construction of the benchmarks has four steps.
First, all items relating to each NSSE benchmark scale scores are expressed in 100-point scales
(from 0 to 100). For example, items that have four response set values such as ‘never’,
‘sometimes’, ‘often’, and ‘very often’ are recoded with values of 0, 33.33, 66.67, or 100. For
question seven in the instrument for the Enriching Educational Experience (EEE) benchmark,
students who indicated that they have already ‘done’ receive a score of 100, whereas students
who responded as ‘plan to do’, ‘do not plan to do’, or ‘have not decided’ to participate in the
activity receive a zero score. These benchmarks are “unweighted indices of items…intended to
be a useful tool for internal evaluation, and …to facilitate comparisons among other institutions
and institutional types (Gordon, Ludlum, & Hoey, 2008, p. 20). Secondly, part-time student
scores are adjusted for four of the LAC benchmark items. Thirdly, student-level benchmarks

61
scores are created for each set of items by taking the mean of each student scores. Student-level
benchmarks scores are calculated as long as the student has answered three-fifths of the items
relating to each benchmark. For the final step, institutional-level scores are created by calculating
the weighted averages of the student-level scores. For the purpose of this study, only student-
level scores were examined. The student-level benchmark scores have been used to examine
differences in key student sub-groups or characteristics (major area of study, gender, enrollment
status, etc.). The larger the benchmark score, the more positive the underlying student responses.
Even though “NSSE does not directly assess learning outcomes, the results of the survey
point areas where …[institutions] are performing well in enhancing learning, as well as to
aspects of the undergraduate experience that could be improved” (Kuh, 2003, p. 26). By design,
NSSE has demonstrated that student engagement can be reliably measured across large numbers
of institutions and that the data can be used immediately by faculty and institutions (Kuh, 2009).
NSSE results have been used in various ways and include supporting student learning and
development, developing a cohort of experiences for groups of students, monitoring academic
standards, institutional improvement, accountability and transparency, and facilitating student
retention and engagement, to mention a few (NSSE, 2010). In particular, Banta, Pike and Hansen
(2009) described four main purposes of NSSE which include accreditation, accountability,
strategic planning and program assessment.
NSSE is a survey that is randomly administered to first and senior year students across
the United States and Canada, in participating higher education institutions. Institutions are
encouraged to participate every three or four years so that the same students in the first-year
would then be the senior students three or four years later. The survey is administered during the
spring term so that each participating student has had sufficient experience in the institution to
attempt every item on the survey (NSSE, 2008a). The survey has approximately 41 items and

62
each item is assigned to a cluster of similar activities (for a total of approximately 105 subscales)
that have led to the development of five national benchmark scales of effective educational
practice. “The NSSE benchmarks are a window into student and institutional performance at a
national, sector, and institutional levels” (Kuh, 2003, p. 26). The five engagement clusters or
benchmark scales are believed to promote persistence and include: 1) Level of Academic
Challenge (LAC), 2) Active and Collaborative Learning (ACL), 3) Student-Faculty Interaction
(SFI), 4) Enriching Educational Experience (EEE), and 5) Supportive Campus Environment
(SCE). Each cluster or benchmark scale is made up of six to 11 related items. Items are scored on
a four point Likert-type scale described in the item (1=never; 4 = very often). The survey also
takes into account variables such as years in school, race, sex, age, transfer status, place of
residence, major field of study, enrollment status, parental educational attainment, sector, and
institutional selectivity, to mention a few (Kuh, 2003). The Canadian English web version of the
survey takes approximately 15 minutes or less to complete (CCI Research Inc., 2009).
Most of the items on the NSSE survey instrument “have been used in other long-running,
well-regarded college student research programs such as UCLA’s Cooperative Institutional
Research Program… and Indiana University’s College Student Experiences Questionnaire
[CSEQ] Research Program” (Kuh, 2002, p. 4). In fact, two-thirds of the original NSSE items
were the same or similar to questions on the CSEQ (Kuh, 2001, 2009). “It is not unusual for
questions used on nationally normed instruments to be adapted for use on local surveys because
researchers perceive them to have merit, especially if psychometric analyses demonstrate that the
items are sound ” (Ouimet, Bunnage, Carini, Kuh, & Kennedy, 2004, p. 234).
The psychometric properties of NSSE have been reported by Kuh (2002). Face and
content validity has been established (Kuh, 2002). “Logical relationships exist between the items
in ways that are consistent with the results of objective measures and with other research” (Kuh,

63
2002, p. 5). The responses to the survey items are reported as approximately normally
distributed. The test-retest reliability among students was reported as 0.83, both within and
across major fields and institutions (Kuh, 2002).
Most of the studies examined in this analysis of student engagement literature used the
NSSE (Bruce et al., 2010; Carini et al., 2006; Hughes & Pace, 2003; Laird et al., 2008; Kuh,
2001; Kuh et al., 2008; Popkess, 2010; Popkess & McDaniel, 2011). The NSSE has also been
used in recent years in Canada by Universities to gain an understanding of the student’s
institutional experience and motivations. In addition, Universities have utilized the instrument for
accreditation, accountability, strategic planning and program assessment purposes.
Summary
In this chapter, the review of the literature has presented factors that led to student
success. In order for nursing students to be successful, one must first begin with identifying
variables that exist in this population that are indicative of a student who is engaged. The
identification of these factors could lead to the creation of institutional persistence programs that
would be focused on these specific demographic variables and engagement items. The NSSE
provides a tool to help nursing programs not only understand persistence, and in turn
engagement, but as well as identify any relationships that may exist between these factors. The
variables selected for this proposed study, shown in Table 1, have all been shown in the literature
to be related to student engagement.
Table 1 depicts the predictor variables, described as demographic, external, academic, social and
institutional variables that have been shown in the literature to be related to student engagement.

64
Table 1
Proposed Model of Nursing Student Engagement
Predictor Variables
Student Characteristics
Response/Outcome Variable
Student Engagement
X1
X2
Demographic Variables X3
X4
X5
X6 Y1
External Variables X7 Y2
X8 Y3
Academic Variables X9
Y4
X10 Y5
Social Variables
Institutional Variable
X11
X12
X13
Student Characteristics
Demographic Variables
X1 = Age X2 = Gender
X3 = Ethnicity X4 = First Generation status
X5 = Place of residence

65
External Variables
X6 = Hours per seven-day week spent working for pay off campus
X7 = Hours per seven-day week spent commuting to class
X8 = Hours per seven-day week spent providing care for dependents living with you
Academic Variables
X9 = Hours per seven-day week spent preparing for class
X10 = Self-reported GPA
Social Variables
X11 = Exercised or participated in physical fitness activities
X12 = Hours per seven-day week spent participating in cocurricular activities
Institutional Variables
X13 = institutional size
Response Variable
Y = Student engagement
Y1 = Level of academic challenge
Y2 = Active and Collaborative Learning
Y3 = Student-Faculty interaction
Y4 = Enriching Educational Experiences
Y5 = Supportive Campus Environment
The next chapter describes the research design and methodology, research questions, site and
participant selection, data collection and recording, data analysis, limitations and ethical
considerations of the study.

66
Chapter Three: Research Design and Methodology
The purpose of this study was to examine the extent to which first-year nursing students
are engaged in effective educational practices and determine any relationships that may exist
between demographic, external, academic, social and institutional characteristics, and student
engagement. Student engagement, the main response variable, was measured by the five NSSE
benchmarks of student engagement. These benchmarks included 1) Level of Academic
Challenge, 2) Active and Collaborative Learning, 3) Student-Faculty Interaction, 4) Enriching
Educational Experiences, and 5) Supportive Campus Environment. The five response variables
were examined to identify possible associations with predictor variables, which were measured
by the NSSE. These included demographic variables (age, gender, ethnicity, first generation
status and place of residence), external variables (number of hours spent per week working off
campus, commuting to class and caring for dependents), social variables (number of hours spent
per week participating in cocurricular activities and exercise or participation in fitness activity)
and academic variables (number of hours spent per week preparing for class and self-reported
GPA). The NSSE Institute agreed to add one further predictor variable to the data file, which was
a measure of the size of each student’s institution. This variable enabled the study of possible
relationships between NSSE engagement scores and university size as an institutional variable.
Research Method and Design
A descriptive correlational design was used to conduct a secondary analysis of the pre-
existing 2008 NSSE data for nursing students in 13 selected Ontario universities. The data set
was provided by the NSSE Institute for Effective Educational Practice, which is affiliated with
Indiana University. A descriptive design was chosen since descriptive studies are used to gain
more information about characteristics within a particular field of study. In addition, in a

67
correlational design, relationships between variables are examined. Furthermore, a survey may
be used as a data collection tool in descriptive or correlational studies (Burns & Grove, 1997).
Hence, a descriptive correlational design was chosen for this secondary analysis as it examined
relationships that may exist between variables in the data set that occurred in the past (Burns &
Grove, 1997). In a descriptive correlational design, no attempt is made to control or manipulate
the situation, and variables need to be clearly identified and defined (Burns & Grove, 1997). In
this study a secondary data analysis was conducted on existing NSSE survey data and no attempt
was made to collect new data.
A postpositivist approach was used to conduct the secondary analysis of data from a real-
world evaluation nursing student engagement. The 2008 NSSE survey was used as the source of
the data for this research study. The study design included a quantitative approach as a first step
in examining the nursing student characteristics of the first-year nursing students and
relationships that may exist between predictor variables and student engagement scores in the
Canadian context.
Instrument
The study instrument used in the study was the NSSE survey and is described in Chapter
two. The NSSE survey, launched in the year 2000, was designed to assess the extent to which
students engage in educational practices that are associated with high levels of student learning
and development (NSSE, 2008a). The NSSE survey was chosen for this study as Ontario
universities participate in administering the survey to first and senior year students to capture
engagement data as meaningful indicators of educational quality. The 2008 NSSE survey results
were used as it was the most recent data set available at the time of this study. The questionnaire
collected information in five categories: 1) participation in dozens of educationally purposeful

68
activities; 2) institutional requirements and the challenging nature of coursework; 3) perceptions
of the college environment; 4) estimate of educational and personal growth since starting college;
and 5) background and demographic information. The NSSE instrument was used to measure
engagement on five subscales also known as benchmarks. These benchmarks have been known
as the best practices leading to engagement and include: 1) Level of Academic Challenge, 2)
Active and Collaborative Learning, 3) Student-Faculty Interaction, 4) Enriching Educational
Experience, and 5) Supportive Campus Environment.
The Canadian NSSE survey was a web-based survey (Indiana University Center for
Postsecondary Research, n.d.). For the 2008 survey, the recruitment method included an
institutionally customized survey invitation message sent directly to students via email by the
NSSE Institute. Email recruitment included five electronic contacts with individualized links
permitting the students to log into the survey with one click. First-year and senior students were
randomly selected to participate in the survey. But for the purpose of this study, only first-year
student data were examined. The NSSE instrument relies on self-reports and was intentionally
designed to reduce threats to validity by adhering to the five conditions that have shown to
increase self-report validity (Kuh, 2002). These conditions included: 1) when the information
requested is known to the respondents; 2) questions are phrased clearly and unambiguously; 3)
questions refer to recent activities; 4) respondents think the questions merit a serious and
thoughtful response; and 5) answering the questions does not threaten, embarrass, or violate the
privacy of the respondent to respond in socially desirable ways (Kuh, 2002).
The reliability of the NSSE has been established from the analyses of survey results.
NSSE (2007) reported Cronbach’s alpha coefficients of greater than .700 for three of the five
benchmarks (Level of Academic Challenge, Student-Faculty Interaction and Supportive Campus
Environment). The alpha coefficients for the remaining two benchmarks were .583 for Enriching

69
Educational Experiences and .657 for Active and Collaborative Learning (NSSE, 2007). The
Cronbach’s alpha coefficients indicate the extent to which different items in an instrument
measure the same construct. The alpha values range from zero to one. The closer the value is to
1.00 the higher internal consistency (Burns & Grove, 1997, p. 329). Nunnally (1978) proposed
that Cronbach’s alpha for a measurement scale should be .7 or higher before the scale can be
considered sufficiently reliable for basic research (p. 245). Similarly, as suggested by NSSE
(2007), benchmark alpha coefficients of less than .70 should be used with caution and noting that
different subpopulations may result in different alpha values. Overall, three of the five NSSE
benchmarks (Level of Academic Challenge, Student-Faculty Interaction and Supportive Campus
Environment) are noted to be generally reliable across different subpopulations (NSSE, 2007).
The majority of the self-rated items were reported to have strong internal consistency among the
variables represented (Kuh, 2002). The responses to the survey items were reported as
approximately normally distributed. The test-retest reliability among students was reported as
0.83, both within and across major fields and institutions (Kuh, 2002). Face and content validity
has been established (Kuh, 2002). “Logical relationships exist between the items in ways that are
consistent with the results of objective measures and with other research” (Kuh, 2002, p. 5).
A more recent examination of the psychometric properties of NSSE questioned the
validity of the tool to appraise quality for research-extensive institutions (Campbell & Cabrera,
2011). The authors also stated that individual institutions need to examine their own institutional
context before administering the NSSE. Campbell and Cabrera (2011) acknowledged that the
NSSE may not be a universal tool to be used to assess institutional quality. Porter (2011) also
noted that students were not reporting responses accurately and some items had ambiguous
wording. However, despite the shortcomings of this tool, the NSSE has been used by Ontario
universities as a quality assurance measure as a direct outcome of the Rae Report (2005). The

70
NSSE was implemented in 2006 as a short term measure for all Ontario universities to provide
baseline data on student engagement and permit benchmarking (Rae, 2005, p. 55). To date
Ontario institutions have continued to administer the NSSE to first and senior year students. The
NSSE, which is representative of the American context of higher education, was not tailored to
capture the Canadian higher education environment prior to its roll-out in 2006. Today, in 2015,
a customized Canadian survey of student engagement is still outstanding in order to benchmark
and gauge institutional quality, student experience and engagement in Ontario.
The NSSE Institute provides a guide for institutions and researchers on analyzing the
survey data. According to the guide, the appropriate method of analysis for the NSSE data
includes cohort and longitudinal comparisons with multiple years of data. For example, a cohort
comparison would include first-year students in one year with another year (likewise for senior
students). Longitudinal comparisons would include first-year respondents as they become seniors
three years later. Comparisons between first and senior year students from the same year are
discouraged as they “are different educational contexts, with different engagement patterns”
(NSSE, 2011, p. 3). Hence, for the purpose of this research study only first-year nursing student
were examined in the 2008 NSSE data subset.
All Ontario universities have administered the NSSE survey “…at least twice as a
component of an accountability framework developed with the Ministry of Training, Colleges,
and Universities” (Conway, 2010, p. 14). A total of forty-seven Canadian institutions
participated in NSSE 2008. Of these, 20 institutions were from Ontario, and all participated via
the web-only administration mode. More than 200,000 Canadian students were invited to
participate and the number of respondents was 78,288. The response rate was 39% and ranged
between 17% and 56% for all institutions. The overall low response rate may be seen as a
limitation to the study. On the other hand, online surveys have usually resulted in a lower

71
response rate than paper surveys (Nulty, 2008). According to NSSE (2014) the response rate in
part depends on the number of respondents. “A high response rate is no guarantee of data
quality, nor does a low response rate automatically mean your results are biased” (NSSE, 2014,
p. 1). Yet NSSE (2014) acknowledged that a low response rate may influence the results of a
study and suggested strategies to maximize responses. Of the total number of respondents,
approximately 19,000 students were first-year Ontario students. About 29% of respondents were
19 years old or younger, 43% of the students were 20-23 years of age and 12% were between the
ages 24 and 29 (NSSE, 2008b). The majority of the respondents were female (63%), with full-
time status (88%), and Caucasian (71%).
Conway et al. (2011) completed a detailed NSSE report (item means and frequencies,
benchmark scales and learning scales) at the academic program and student subgroup level for
individual institutions across Canada. They also developed statistical regression models to
measure the contribution to engagement variation of student characteristics, program mix and
institutional character at the student and institutional level. The institutions that were included in
the report were those that participated in the 2008 or 2009 Canadian NSSE administration.
Several student characteristics were identified as significant predictors of engagement and
included: gender, first-generation status, ethno-cultural status, commuting behaviours, high
school and current grades, full-time/part-time attendance, and university transfer status.
Institution size of Canadian universities was defined as the full-time undergraduate enrolment for
each university. “The data indicated no participants between 6,500 and 12,000 full-time students,
and none between 21,000 and 24,500” (p. 46). Therefore, they defined small institutions as (less
than 6,500), medium (12,000 to 21,000) and large (24,500 plus).

72
NSSE research on U.S. institutions indicates a decline in engagement levels for several
benchmarks as the institutional enrolment increases. Conway et al. (2011) reported the same
pattern for Canadian institutions, in which small institutions experience higher average scores for
the first-year SCE, SFI, and ACL benchmark scales. The EEE and LAC benchmark scales were
found to be insensitive to institution size. The first-year mean benchmark scores for participating
Ontario institutions in the 2008 NSSE administration, as well as all of the NSSE 2008
institutions (Canadian and U.S.) are presented in Table 2.
Table 2
First-Year NSSE 2008 Mean Benchmark Scale Scores
First Year
Ontarioa NSSE 2008a
Level of Academic Challenge (LAC) 51.2 52.5
Active and Collaborative Learning (ACL) 35.1 41.4
Student-Faculty Interaction (SFI) 23.6 32.6
Enriching Educational Experiences (EEE) 25.0 27.0
Supportive Campus Environment (SCE) 55.8 60.0
Note. Benchmark scale scores are calculated for each responding student by converting question
responses to a zero to one hundred point scale. a = McMaster University. (2008). Benchmark Comparisons. Retrieved from: http://www.mcmaster.ca/avpira/documents/surveys/NSSE08%20Benchmark%20Comparisons%20Report
%20(McMaster).pdf
Study variables, coding and source of data
As discussed in Chapter two, research on student engagement has identified certain
variables and measures that are associated with effective educational practices. The variables
chosen in this research study were included based on the literature review to be related to student
engagement. This section describes the study variables and the sources of data for each research
question.

73
Student engagement, the response variable, was measured by the five available NSSE
benchmarks of student engagement. These benchmarks included 1) Level of Academic
Challenge (LAC), 2) Active and Collaborative Learning (ACL), 3) Student-Faculty Interaction
(SFI), 4) Enriching Educational Experiences (EEE), and 5) Supportive Campus Environment
(SCE). The specific NSSE test items behind each NSSE scale are given in Appendix A.
Response variable: The response variable, also known as a dependent variable, for Research
Questions 3 and 4 was the students’ scores on the five NSSE engagement scales (LAC, ACL,
SFI, EEE, and SCE). The response variable for Research Question 5 was the students’ self-
reported GPA scores.
Level of academic challenge (LAC): An 11-item scale to assess the extent to which
students engage in academic work. The level of academic challenge was measured by
items 1r, 2b, 2c, 2d, 2e, 3a, 3c, 3d, 3e, 9a, and 10a. The LAC benchmark was denoted as
Y1.
Active and Collaborative Learning (ACL): A 7-item scale to assess the student’s
participation in learning activities designed to promote learning. ACL was measured by
items 1a, 1b, 1g, 1h, 1j, 1k, and 1t. The ACL benchmark was denoted as Y2.
Student-Faculty Interaction (SFI): For the SFI benchmark, 6-items measured the
magnitude and type of students’ interaction with faculty. SFI was be measured by items
1n, 1o, 1p, 1s, 1q, and 7d. The SFI benchmark was denoted as Y3.
Enriching Educational Experience (EEE): A 12-item scale, inclusive of items 1l, 1u, 1v,
7a, 7b, 7c, 7e, 7f, 7g, 7h, 9d, and 10c assessed the extent to which students participated in
academic and social activities to enhance the college experience in and outside of the
classroom. The EEE benchmark was denoted as Y4.

74
Supportive Campus Environment (SCE): A 6-item scale that assessed institutional
support and relationships with faculty members and peers. The SCE benchmark was
measured by items 8a, 8b, 8c, 10b, 10d, and 10e. The SCE benchmark was denoted as Y5.
Self-reported GPA: For research question 5, self-reported GPA, as an indicator of
academic performance, was the response variable, in which case it was denoted as Y6.
The ordinal variable had eight values ranging from a high “A” to a low “C- or less”, for
this question grades were recoded into the percent mid-point for each category (variable
code “pcntgrd”).
Predictor Variables: A predictor variable is also called an independent variable. For the purpose
of this study, the term predictor variable was used as the variables in this study were simply
observed, as a secondary analysis of survey data (Creswell, 2009; Tabachnick & Fidell, 2013).
The predictor variable is one that predicts the values on the dependent or response variable
(Creswell, 2009; Tabachnick & Fidell, 2013). The predictor variables included student
characteristics (demographic, external, and social variables), academic variables, and
institutional variable. The coding of each variable was consistent with the NSSE 2008 Canadian
Codebook. However, with some categorical variables with dichotomous and non-dichotomous
responses that were not truly binary were recoded as suggested by Pedhazur (1982). These
variables are discussed in more detail in the following subsections. These predictor variables
were chosen for this study based on the literature which revealed correlations with the criterion
variable of student engagement in higher education.
Demographic variables: Demographic variables examined included age, gender,
ethnicity, first-generation status and place of residence.

75
Age: Students were asked to enter the year of birth for item 15 in the survey. The birth
year was then recoded to age in years by the NSSE Institute. Age (variable code
“Agebase”) was denoted as X1.
Gender: Item 16 asked students to indicate gender as a categorical response and was
coded male = 1, female = 2. No recoding was necessary. Gender (“gender”) was denoted
X2 as a predictor variable.
Race/Ethnicity: Students indicated their race/ethnicity as a categorical response for item
18 by selecting the option(s) that apply. Prompts included 1= white (Caucasian), 2 =
North American Indian, 3 = Metis, 4 = Inuit, 5 = Chinese, 6 = South Asian (e.g. East
Indian, Pakistani, Sri Lankan, etc.), 7 = Black, 8 = Filipino, 9 = Latin American, 10 =
Southeast Asian (e.g. Cambodian, Indonesian, Laotian, Vietnamese, etc.), 11 = Arab (e.g.
Saudi, Egyptian, etc.), 12 = West Asian (e.g. Afghan, Iranian, etc.), 13 = Japanese, 14 =
Korean, 15 = other. This categorical variable was recoded with 1 = Caucasian (inclusive
of prompt 1 only) and 2 = other ethnic groups (inclusive of prompts 2 to 15). Ethnicity
(variable code “eth_ca1”) was denoted as X3.
First-generation status: An ordinal variable based on the student’s self-report of the
highest level of education completed by his or her father (item 28a) and mother (item
28b). Responses for questions 28a and 28b were combined to create an aggregate
measure for parental education (variable code “First_Gen”). Prompts included: did not
finish high school = 1, graduated from high school = 2, some or completed college or
CEGEP = 3, attended university without earning a degree = 4, completed a bachelor’s
degree (B.A., B.Sc., etc.) = 5, completed a master’s degree (M.A., M.Sc., etc.) = 6,
completed a doctoral degree (PhD., J.D., M.D., etc.) = 7. This variable was recoded using
76
a dummy variable in which a value of 1 is ‘no’, not being representative of first-
generation status (to be inclusive of prompts 5 thru 7) and a value of 2 is ‘yes’
representative of first-generation status (to be inclusive of prompts 1 thru 4). This
variable was denoted as predictor variable X4.
Place of residence: A categorical variable based on the student’s living arrangements
while attending university (item 27 variable code “Residence”). Response values
included: 1 = room or apartment in university residence or campus housing, 2 = off-
campus accommodation within walking distance of campus, 3 = off-campus
accommodation within driving distance of campus, and 4 = fraternity or sorority house.
Residence was recoded to: 1 = on campus (inclusive of prompts 1 and 4), 2 = within
walking distance commute, and 3 = driving distance commute. The type of residence was
denoted as X5.
External variables: Also known as an extraneous variable. An external variable was
operationally defined as a variable that may affect the response. External variables in this
study included the number of hours per week spent working off campus, commuting to
class, and caring for dependents.
Hours per seven-day week spent working for pay off campus: An ordinal-scaled variable
based on the student’s self-report of the number of hours worked for pay off campus
(item 9c variable code “workof01”) per week. Response values included: 1 = 0 or no
hours, 2 = 1-5 hours, 3 = 6-10 hours, 4 = 11-15 hours, 5 = 16-20 hours, 6 = 21-25 hours, 7
= 26-30 hours, 8 = more than 30 hours. No recoding was necessary. This variable was
denoted as X6.

77
Hours per seven-day week spent commuting to class: An ordinal-scaled variable based on
the student’s self-report of the number of hours spent commuting to class per week (item
9g variable code “commute”). Response values included: 1 = 0 or no hours, 2 = 1-5
hours, 3 = 6-10 hours, 4 = 11-15 hours, 5 = 16-20 hours, 6 = 21-25 hours, 7 = 26-30
hours, 8 = more than 30 hours. No recoding was necessary. This predictor variable was
denoted as X7.
Hours per seven-day week spent providing care for dependents living with you: An
ordinal-scaled variable based on the student’s self-report of the number of hours per
seven-day week spent providing care for dependents living with them (parents, children,
spouse, siblings, etc.) (item 9f variable code “carede01”). Response values included: 1 =
0 or no hours, 2 = 1-5 hours, 3 = 6-10 hours, 4 = 11-15 hours, 5 = 16-20 hours, 6 = 21-25
hours, 7 = 26-30 hours, 8 = more than 30 hours. No recoding was necessary. This
predictor variable was denoted as X8.
Academic variables: Academic variables examined in this study included the number of
hours spent preparing for class (studying, reading, writing, doing homework or lab work,
analyzing data, rehearsing, and other academic activities studying) and the self-reported
GPA.
Hours per seven-day week spent preparing for class: An ordinal-scaled variable based on
the student’s self-report of the number of hours per seven-day week spent preparing for
class (item 9a variable code “acadpr01”). Response values included: 1 = 0 or no hours, 2
= 1-5 hours, 3 = 6-10 hours, 4 = 11-15 hours, 5 = 16-20 hours, 6 = 21-25 hours, 7 = 26-30
hours, 8 = more than 30 hours. No recoding was necessary. This predictor variable was
denoted as X9.

78
Self-reported Grade point average (GPA): Academic performance was operationally
defined as the self-reported GPA. An ordinal variable based on the student’s self-reported
grade point average at the institution (item 26). Response values included: 1 = C- or
lower, 2 = C, 3 = C+, 4 = B-, 5 = B, 6 = B+, 7 = A-, 8 = A. Grades were recoded
primarily for the C and C- or lower category representing a failure in nursing courses.
Grades were recoded as follows: 1 = inclusive of prompts 1 and 2, 2 = C+, 3 = B-, 4 = B,
5 = B+, 6 = A- and 7 = A. The recoded variable name was “rcdegrades04”. Although
there is concern about the accuracy of the self-reported GPA, the literature reports high
correlations between self-reported and actual scores. Cassady (2001) examined the
accuracy and deviation of self-reported and actual scores and found correlations between
actual and self-reported scores to be .88 (p=.0001). Kuncel et al. (2005) conducted a
meta-analysis of 91 peer-reviewed studies (total sample N = 61,000) and reported a high
level of validity in self-reported GPA with an overall correlation of .84. Kuncel et al.
(2005) also reported that students with higher cognitive skills and GPAs tend to report
their GPAs more accurately. Other studies have also found high correlations between
self-reported and actual scores (Anaya, 1999; Talento-Miller & Peyton, 2006; Cole &
Gonyea, 2010; Cole, Rocconi, & Gonyea, 2012). In addition, the NSSE has used self-
reported grades in reporting the annual findings of the survey. Furthermore, it may be
assumed that since nursing students have met the rigorous admission criteria to the
program that one would accurately self-report their GPA (Popkess, 2010). The predictor
variable of academic performance was denoted as X10.

79
Social Variables: The social variables examined in this study included the student’s
participation in cocurricular activities and physical fitness activities during the school
year.
Exercised or participated in physical fitness activities: An ordinal-level variable based on
the student’s self-report of exercise or participation in physical fitness activities during
the school year (item 6b variable code “exrcse05”). Prompts included: 1 = never, 2 =
sometimes, 3 = often, and 4 = very often. No recoding for this variable was necessary.
This predictor variable was denoted as X11
Hours per seven-day week spent participating in cocurricular activities (organization,
campus publications, student government, fraternity or sorority, intercollegiate or
intramural sports, etc.): An ordinal-level variable based on the student’s self-report of
participation in cocurricular activities (item 9d variable code “cocurr01”). Prompts
included: 1 = 0 or no hours, 2 = 1-5 hours, 3 = 6-10 hours, 4 = 11-15 hours, 5 = 16-20
hours, 6 = 21-25 hours, 7 = 26-30 hours, and 8 = more than 30 hours. No recoding for this
variable was necessary. This predictor variable was denoted as X12
Institutional variable: The size of an institution was defined by the number of full-time
undergraduate student enrolments for the institution. Using the publicly available data
from the Council of Ontario Universities (COU) website, the 2008 total undergraduate
enrolment numbers by university were retrieved (Appendix C). For each university, the
full-time enrolment (including domestic and international students) was then assigned a
size that was consistent with the definition of university size provided by Conway et al.
(2011). “Small” was defined as less than 6,500 students, “medium” was 12,000 to 21,000
students, and “large” was defined as more than 24,500 students. There were no

80
institutions identified that had nursing programs and with participants between 6,500 and
12,000 full-time students. For coding purposes, a small university size was coded as 1,
medium as 2, and a large size university coded as 3. The three-level institutional variable
of university size were merged with the NSSE 2008 data file for the 2008 first-year
Ontario nursing students by the Indiana University Center for Postsecondary Research to
ensure anonymity and confidentiality of the participating institutions. The predictor
variable of institutional size (variable code “Uni_size”) was denoted X13.
Table 3 presents the research questions of this study and sources of data. The variables were
obtained from the 2008 NSSE data set as provided by the Indiana University Center for
Postsecondary Research.

81
Table 3
Research Questions and Sources of Data
Research Question Sources of Data
1. What are the characteristics of first-
year full-time nursing students in 13
selected Ontario universities?
• 2008 Canadian NSSE items: 6b, 9a, 9c, 9d, 9g, 9f, 15,
16, 18, 26, 27, 28 and an additional variable added
(code “Uni_size”).
2. What is the distribution of scores on
the five NSSE engagement scales for
these students?
• 2008 Canadian NSSE items for Engagement
benchmarks:
• LAC: 1r, 2b, 2c, 2d, 2e, 3a, 3c, 3d, 3e, 9a, 10a
• ACL: 1a, 1b, 1g, 1h, 1j, 1k, 1t
• SFI: 1n, 1o, 1p, 1s, 1q, 7d
• EEE: 1l, 1u, 1v, 7a, 7b, 7c, 7e, 7f, 7g, 7h, 9d, 10c
• SCE: 8a, 8b, 8c, 10b, 10d, 10e
3. What is the relationship between
demographic, external, academic,
social and institutional variables and
student engagement scores on the five
NSSE benchmarks for first-year full-
time nursing students in selected
Ontario universities?
• 2008 Canadian NSSE items:
• Demographic variables: 15, 16, 18, 27, and 28
• External variables: 9c, 9g, and 9f
• Academic variables: 9a, and 26
• Social variables: 6b, and 9d
• Institutional variables: Additional variable added
(code “Uni_size”)
• 2008 Canadian NSSE items for Engagement
benchmarks:
• LAC: 1r, 2b, 2c, 2d, 2e, 3a, 3c, 3d, 3e, 9a, 10a
• ACL: 1a, 1b, 1g, 1h, 1j, 1k, 1t
• SFI: 1n, 1o, 1p, 1s, 1q, 7d
• EEE: 1l, 1u, 1v, 7a, 7b, 7c, 7e, 7f, 7g, 7h, 9d, 10c
• SCE: 8a, 8b, 8c, 10b, 10d, 10e
4. What is the relationship between
student engagement scores on the five
NSSE scales and institutional size for
first-year full-time nursing students in
selected Ontario universities?
• 2008 Canadian NSSE items for Engagement
benchmarks:
• LAC: 1r, 2b, 2c, 2d, 2e, 3a, 3c, 3d, 3e, 9a, 10a
• ACL: 1a, 1b, 1g, 1h, 1j, 1k, 1t
• SFI: 1n, 1o, 1p, 1s, 1q, 7d
• EEE: 1l, 1u, 1v, 7a, 7b, 7c, 7e, 7f, 7g, 7h, 9d
• SCE: 8a, 8b, 8c, 10b, 10d, 10e
• Additional variable of Institutional Size (code
“Uni_size”)
5. What is the relationship between
student and institutional
characteristics and academic
performance of first-year full-time
nursing students in selected Ontario
universities?
• 2008 Canadian NSSE items:
• Student Characteristics
• Demographic variables: 15, 16, 18, 27, and 28
• External variables: 9c, 9g, and 9f
• Social variables: 6b, and 9d
• Institutional variables: Additional variable added (code
“Uni_size”)
• Academic variables: 9a, and 26

82
Sample characteristics
For the purpose of this study, a secondary analysis was conducted on the 2008 NSSE data
subset for baccalaureate first-year full-time nursing students from the participating Ontario
universities. Ontario universities were selected because they have a province-wide somewhat
comparable four-year BNP, which helps make the sample a reasonable sample for study. (Other
Canadian provinces and American states tend to have a variety of different programs).
Inclusion criteria.
Institutions were included in the data set that met the following inclusion criteria for this
study. The institution must:
1) be an Ontario University
2) have participated in the 2008 NSSE
3) have a 4-year Baccalaureate Nursing Program and
4) have first-year full-time nursing students who participated in the 2008 NSSE survey.
Ontario institutions that participated in the NSSE in 2008 were identified and then a
manual search was conducted on each University website to identify the institutions that have a
four-year BNP (See Appendix D). This identified 14 Universities in Ontario with nursing
programs. The NSSE contact at the Indiana University Center for Postsecondary Research had
informed us that 13 of these institutions administered the NSSE to their nursing students in 2008.
The NSSE contact had also informed us that the sample contained data for 944 nursing
students from 13 of the 14 Ontario institutions that have a BNP and participated in the NSSE in
2008. (The 14 institutions are identified in Appendix D.) Of this sample only 293 were full-time
first-year nursing students from 13 Ontario universities.

83
Data Collection and Recording
The data were purchased from the Indiana University Center for Postsecondary Research
by completing a NSSE data sharing agreement (See Appendix E). Once the request was
approved the data were sent through a secure web server connection and downloaded in a
statistical program format. All student and institutional level identifiers were removed by the
Indiana University Center for Postsecondary Research prior to the data being sent. Data were
provided in excel format and was then imported into the Statistical Package for the Social
Sciences (SPSS) software program to be analyzed.
Data Analysis
The data analyses were performed using SPSS Version 21. The 2008 NSSE data file
included data for 5014 first and third year students from 14 Ontario universities across a variety
of different academic programs. As a first step, data integrity was checked by running univariate
analysis on all study variables in the NSSE data file for all 5014 first and third-year students.
Then only the first-year nursing students were extracted from the data set for further analysis.
Descriptive and inferential statistics were then analyzed for only the first-year full-time nursing
students in the 2008 NSSE data file (N=293). All analyses were conducted by the researcher
under the direct supervision and guidance of the thesis supervisor. The analyses conducted for
the research questions in this study are discussed next.
Research Question 1: What are the characteristics of first-year nursing students? This question
was addressed by computing descriptive statistics to summarize all of the demographic, external,
academic, social and institutional variables in the sample, as shown in Table 3. The descriptive
statistics described the frequency of the variable.

84
Research Question 2: What is the distribution of scores on the five NSSE engagement scales for
first-year nursing students? This question was addressed by computing descriptive statistics
(mean, standard deviation, and range) for the five NSSE scale scores. The survey items that
contribute towards each benchmark are identified in Table 3. Graphical displays of the variables
for research question 2 are presented with dot plots or histograms for the continuous NSSE
benchmark scores.
Research Question 3: What is the relationship between demographic, external, academic, social,
and institutional variables and student engagement scores on the five NSSE benchmarks for first-
year full-time nursing students? This question was addressed by using stepwise multiple
regression analysis (Tabachnick & Fidell, 2013) to determine the relationship between each
response variable (i.e., each of the five NSSE measures of engagement) and the available
predictor variables (i.e., demographic, external, academic, social and institutional variables).
Multiple regression analysis was the appropriate statistical test for this question as there was no
direct manipulation of the independent or predictor variables. Instead the predictor variables
were naturally occurring levels of the variables that may help predict the score of each response
variable. Additionally, since there were several predictor variables in the model, multiple
regression analysis is used. The predictor variables were entered into the model using a stepwise
approach. A significant advantage of using stepwise regression analysis with a large pool of
candidate predictor variables was that each predictor variable was entered in sequence one by
one, its value was assessed and then adding or deleting the variable. If the predictor variable
significantly improved the ability of the model to predict the outcome then the predictor variable
was retained. To be retained by the model the predictor variable must contribute to model with
an alpha level (p-value) of .05, also known as PIN in SPSS. The computer program then searched

85
for the second predictor variable. But “all other variables in the model are then re-tested to see if
they are still contributing to the success of the model” (Brace, Kemp, & Snelgar, 2003, p. 210). If
the variable no longer significantly contributed to the model, it was then removed. In order for a
predictor variable to be removed from the model, it must have an associated alpha level (p-value)
of greater than .10, also known as POUT in SPSS. Hence the critical p-value (level of
significance) was set at 0.05 for the analyses. A stepwise method for the regression analysis was
chosen as it should result in the most parsimonious model (Brace et al., 2003) and should result
in the selection of an effective subset of predictors (Gocka, 1973). This approach results in the
minimum number of variables that one would need to measure and to predict values of the
response variable. Studies that have examined relationships between demographic, external,
academic, social and institutional variables, and student engagement have similarly used a
stepwise regression analysis approach (Astin, 1993; Carini et al., 2006; Salamonson et al., 2009;
Conway et al., 2011; Conway & Zhao, 2012).
With a small sample size of 293 students at least 40 subjects per predictor variable were
needed for a reliable equation using stepwise regression analysis (Tabachnick & Fidell, 2013).
Based upon the sample size (N=293) and predictor variable ratio (40:1), each regression equation
should have no more than seven predictor variables. Since minimal studies were found that
examined nursing student engagement, it was difficult to ascertain which variables to examine
with respect to their impact on student engagement. Another limiting factor, as mentioned above,
was that the 2008 NSSE data set for Ontario universities only included a total of 293 full-time
first-year nursing students. Therefore, for research question 3, a two-stage approach was utilized
to identify the predictor variables for the final regression equations. First, each set of predictor
variables (demographic, external, academic, social and institutional variables) was regressed with
each of the five benchmarks to identify which predictor variables were significant. Hence each

86
predictor set had five regression equations (Appendix F). Each equation was examined to
identify possible predictor variables for the final regression equations. Once the statistically
significant predictor variables were identified for each benchmark, these significant predictors
were included in the final regression equations. This two-stage approach facilitated the selection
of an effective subset of predictors (Gocka, 1973). Final regression equations for the second
stage are shown in Appendix F.
Research Question 4: What is the relationship between student engagement scores on the five
NSSE scales and institutional size for first-year nursing students? This question was addressed
using five bivariate Spearman correlation analyses. The Spearman approach was used because
the variable Institution Size was a three-level ordinal variable (small, medium and large). The
five NSSE Engagement benchmark scores were the response variables and the institution size
was the predictor variable.
Research Question 5: What is the relationship between student (demographic, external, academic
and social) and institutional characteristics and academic performance (GPA) of first-year
nursing students? This question was also addressed by using a stepwise multiple regression
analysis approach (Tabachnick & Fidell, 2013) to determine the relationship between academic
performance (GPA) as the response variable and the predictor variables (i.e., demographic,
external, academic, social and institutional variables). Because multiple regressions assume that
the response variable is a continuous variable, GPA scores were recoded to the percent mid-point
for each category. The recoded grades (code ‘pcntgrd’) were the response variable and the
student and institutional characteristics the predictor variables. This question was also answered
using a two-stage approach. For the first stage each set of predictor variables were regressed with
the ‘pcntgrd’. Hence there were a total of six regression equations (Appendix G). Since the stage

87
one analysis only identified two significant predictors, the second stage analysis was not
warranted. Hence, stage two of the analysis was not conducted.
Methodological Assumptions
The methodology chosen for this study was appropriate for a quantitative design that
examined relationships between variables. The critical p-value (level of significance) was set at
0.05 for the analyses. The methodology allowed us to draw tentative conclusions about
relationships between variables although we were not able to draw conclusions about causality.
Limitations
There were several limitations identified for this study. As a secondary analysis, this
study was unable to account for any institutional changes that may have resulted from previous
student engagement results. A limitation of secondary analysis approach was that data were not
collected to analyze the research questions of this study. Thus a key challenge was to ensure that
the data appropriately addressed the research questions (Kiecolt & Nathan, 1985). Other
disadvantages of secondary analysis may include the time required to acquire the data (which
was not a factor in this current study); errors made in the original surveys would be no longer
visible (interviewing, coding, and data entry); the inability to study sub-populations or assess the
impact of an intervention in a particular institution; data quality (survey design and testing); and
inhibition of creativity (Kiecolt & Nathan, 1985). Fortunately, the reliability and validity of the
NSSE survey has been established and noted in Chapters two and three. Thus there were no
obvious problems identified with the reliability or validity of the NSSE scale scores. There
should be no interviewing, coding, or data entry errors because the survey was completed online
by students entering their own responses on the NSSE web site. As self-report measures were

88
used to collect the NSSE data, findings of this study need to be interpreted with caution since
self-report measures have an inherent bias such as recall and social desirability.
For this research study, the advantages of secondary analysis outweighed the
disadvantages. The primary advantage of the secondary analysis approach was the potential for
substantial resource savings. Secondary analyses usually require less time, less money, fewer
personnel, and eliminate the need for the researcher to affiliate with a large organization (Kiecolt
& Nathan, 1985; Stewart & Kamins, 1993). Another advantage was that the approach avoided
data collection problems and presented electronic data sets that were broadly representative,
using standard items (Kiecolt & Nathan, 1985; Stewart & Kamins, 1993). Secondary research is
also “help[ful] to define the agenda for subsequent primary research by suggesting which
questions require answers that have not been obtained in previous research” (Stewart & Kamins,
1993, p. 4). However, the study was limited to the examining the variables that were collected in
the NSSE survey.
For future studies the actual GPA, and course grades as outcome measures should also be
collected along with the self-reported GPA, since engagement has been shown in the literature to
be positively related to GPA (Carini et al., 2006; Kuh, et al., 2006; Kuh et al., 2007b). Also
since this research study used a sample of convenience of Ontario universities that participated in
NSSE in 2008, the conclusions are limited only to those institutions. The findings of this study
cannot be generalized to the broader population of nursing programs. Even though the sample
consisted of 13 of the 14 Ontario universities that participated in the 2008 administration of the
NSSE, the sample size in this study was only 293 first-year students. In 2008, Ontario had 4,212
students admitted to entry to practice Baccalaureate programs (CASN & CNA, 2012)
representing the first-year nursing student population. The number of students in this study
represented only a small fraction of the entire Ontario first-year nursing student population.

89
Hence generalizations of the findings would be cautioned. However, we can draw tentative
conclusions for other Ontario institutions and very tentative conclusions for other institutions in
Canada that offer nursing programs. Furthermore, using a convenience sample may also
introduce bias as this type of sampling strategy usually results in under or overrepresentation of
particular groups in the sample (Burns & Grove, 1997), such as the higher percentage of first-
generation students in this study, limiting generalizability. Another limitation of this study was
that the use of the NSSE did not account for the intense hands on learning done in the clinical
setting by the nursing students. A clear differentiation between time spent in class on campus and
time spent in clinical was not made.
A major advantage of using stepwise regression analysis with a large pool of candidate
predictor variables were that each predictor variable was entered in sequence one by one, its
value was assessed and then adding or deleting the variable. However, a limitation of the
approach was that a large number of statistical tests were performed, which increased the chance
that some of the positive results might reflect false-positive errors. Thus borderline positive
results must be viewed with healthy skepticism until they can be replicated in further
independent research.
Even though the design of this study was appropriate to examine the relationship among
variables, the use of a qualitative or a mixed methods design would have aided in exploring and
understanding the concept of engagement from the perspective of the student. The integration of
a qualitative approach would also complement the quantitative data and provide valuable rich
descriptions of engagement by illuminating the experience of the nursing student (Burns &
Grove, 1997). For a future larger scale trial, a mixed methods approach would be recommended
to help explore the concept of nursing student engagement from different perspectives.
90
Ethical Issues and considerations
Research Ethics Board review for this study was not required as this study relied
exclusively on secondary data that was anonymous, without any identifiers, and pre-coded. This
was in accordance with the policy of University of Toronto’s Office of Research Ethics Board
and Tri-council Policy Statement (2010), article 2.4. Approval from the thesis committee and
authorization from the Indiana University Center for Postsecondary Research was obtained. As
this study was a secondary analysis of an existing data set, written consent from participants was
not needed. There were no known or expected risks with this study as it was a secondary analysis
of the existing data. In addition, the participants in the 2008 NSSE data subset were
unidentifiable at both the student and institutional level to ensure confidentiality and anonymity.
Summary
This chapter described the research design and methodology, and procedures of this study.
Using a descriptive correlational design, a secondary analysis of the pre-existing 2008 NSSE
data for first-year nursing students in Ontario Universities were analysed to examine the extent to
which these students were engaged in effective educational practices. The study also examined
any relationships between nursing student characteristics, academic performance and student
engagement. This chapter also described the instrument, inclusion criteria, variables and coding,
data analysis methods, methodological assumptions, ethical considerations and limitations. The
results of the data analysis are presented in Chapter Four and discussed in Chapter Five.

91
Chapter Four: Results
This chapter presents the results of the data analysis and is presented in sections relative to
the research questions. The purpose of this study was to examine the extent to which first-year
nursing students are engaged in effective educational practices and determine any relationships
between student demographic, external, academic, social and institutional variables, and student
engagement. The main research question of this study was: What nursing student characteristics
are associated with student engagement in Baccalaureate nursing programs in selected Ontario
Universities?
Research Question One
Research Question 1 asks: What are the characteristics of first-year full-time nursing
students in 13 selected Ontario universities?
To answer this question descriptive summary statistics of the first-year full-time nursing
students at the participating 13 Universities in Ontario for the demographic variables (age,
gender, ethnicity, first-generation status, and place of residence), external variables (number of
hours spent per week working off campus, commuting and caring for dependents), social
variables (number of hours spent per week participating in cocurricular activities and exercise or
participation in fitness activity) and academic variables (number of hours spent per week
preparing for class and self-reported GPA) and institutional variable (university size) were
computed.
Demographic variables.
A total of 293 first-year full-time students with a primary major of nursing in the 13
Ontario universities that participated in the 2008 NSSE were analyzed. The average age of the
nursing students was 20.12 years with a standard deviation of 4.58 years. The minimum age was
92
17 and the maximum was 45 years. Most (80.8%) of the students were 20 years or younger, with
more than half (53.4%) of the students being 18 years of age.
Most of the nursing students were female with 90.4% (n =265) of the respondents
compared with 9.6% (n=28) of men. The larger proportion of women was expected as nursing is
a female-dominant profession. Majority of the sample was comprised of 80.5% Caucasian
students (n=236) with students from other ethnic groups constituting 19.1% (n=56) of the
sample. More than three-quarters (76.8%) of the nursing students were first-generation students,
whereas only 22.9% (n=67) of the students had at least one parent that had completed
undergraduate education.
A total of 42.0% (n=123) of the first-year nursing students lived on campus with 8.2%
(n=24) living within walking distance of the university. Less than half (47.1%, n=138) of the
students lived within driving distance to the university.
External variables.
The external variables examined in this study included the number of hours per seven-day
week spent working for pay off campus; hours spent commuting to class, and number of hours
caring for dependents. More than half (57.3%) of the first-year nursing students were not
working during their first-year of study. On the other hand, 42.4% (n=124) of the students were
working off campus. Of the students who were working, 11.3% (n=33) were working 1 to 10
hours per week, 23.2% (n=68) were working 11 to 20 hours per week. Approximately 7.1%
(n=21) of the students worked 21 to 30 hours per week and 0.7% (n=2) working more than 30
hours per week.
A total of 64.5% (n=189) of the students spent 1 to 5 hours per week commuting to class,
with 19.8% (n=58) spending 6 to 10 hours, 6.1% (n=18) spending 11 to 15 hours commuting to

93
class per week. Only 2.0% (n=6) of the students spent more than 16 hours commuting to class
per week. A total of 7.2% (n=21) reported not spending any time commuting to class per week.
Over half (59.4%) of the respondents did not care for dependents on a weekly basis,
whereas 39.6% (n=116) indicated that they did care for dependents. A total of 28.3% (n=83)
students spent 1 to 10 hours providing care for dependents per week, 6.4% (n=19) spent 11 to 20
hours per week, and 4.8% (n=14) students spent more than 21 hours per week caring for
dependents.
Academic variables.
The academic variables examined in this study included the number of hours spent per
seven-day week preparing for class and the student’s self-reported GPA. The number of hours
spent preparing for class varied amongst the first-year nursing students. Approximately 34.9%
(n=102) spent 1 to 10 hours per week preparing for class, 33.5% (n=98) spent 11 to 20 hours,
20.8% (n=61) spent 21 to 30 hours, and 9.9% (n=29) spent more than 30 hours per week
preparing for class. Preparation for class included studying, reading, writing, doing homework or
lab work, analyzing data, rehearsing, and other academic activities.
Less than a quarter (23.9%) of the respondents reported a GPA in the A category
(grades of A and A-). Overall the majority of the grades reported were in the B category
(grades of B+, B and B-) representing 62.8% (n=184) of the sample, with most of the
grades reported as a B. Only 12.6% (n=37) of the students reported a GPA of C+ or less.
Social variables.
Two social variables were examined in this study. The first variable was the student’s
participation in cocurricular activities during the school year. Cocurricular activities included
participation in organizations, campus publications, student government, fraternity or sorority,

94
and intercollegiate or intramural sports. Slightly more than half (50.5%) of the first-year nursing
students participated in cocurricular activities during the school year. Only one-third of the
students participated between 1 to 5 hours per week and 10.6% spent 6 to 10 hours per week in
cocurricular activities during the school year. Slightly less than half (48.1%) of the students did
not participate in any cocurricular activities.
The second social variable examined was if the student exercised or participated in
physical fitness activities. Majority of the first-year nursing students reported participating in
exercise or physical fitness activities. More than one-third (36.9%) of the students only
‘sometimes’ participated in exercise or physical fitness activities, whereas 28.7% reported ‘often’
and 22.5% reported ‘very often’ participation. Only 11.6% (n=34) of the nursing students
reported never exercising or participating in physical fitness activities.
Institutional variable.
A variable representing the university size was added by the NSSE Institute to the
original NSSE 2008 data set for this study. More than half (55.6%) of the first-year nursing
students were attending a small size institution, followed by 28.0% (n=82) attending a medium
size, and only 16.4% (n=48) of the respondents were attending a large size institution.
Research Question Two
Research Question 2 asks: What is the distribution of scores on the five NSSE
engagement scales for these students?
Descriptive statistics were computed for the five NSSE benchmarks for the first-year full-
time nursing students (N=293) attending the 13 participating universities on Ontario. The NSSE
data file provided by Indiana University contained the pre-calculated benchmark scores for each

95
student. The descriptive statistics examining the distribution of scores on each of the five NSSE
engagement benchmarks are presented in Table 4.
Table 4
Distribution of the Five NSSE Benchmark Scores for the Nursing Students
N Minimum Maximum Mean Standard
Deviation
Level of Academic Challenge (LAC) 292 24 93 55.67 12.6
Active and Collaborative Learning (ACL) 293 10 95 42.92 16.8
Student-Faculty Interaction (SFI) 292 0 100 27.43 17.8
Enriching Educational Experiences (EEE) 290 3 79 31.45 13.7
Supportive Campus Environment (SCE) 292 0 100 59.60 19.3
Valid N (listwise) 290
In examining the NSSE benchmark distributions for the nursing students in Table 4, it
can be seen that at the student-level, there is a wide variation in scores from 0 to 100 on some
benchmarks. The benchmark scores in Table 4 are average scores based upon the individual
scores of each first-year nursing student and represent the student-level scores. At the student-
level the engagement scores are a function of the student and institutional characteristics within a
specific program area (i.e. nursing) hence a wide variation is expected (Conway et al., 2011). On
the other hand, at the institutional-level (the average benchmark scores by institution) the
engagement scores are representative of all of the students from various programs and the scores
may only range from 40 to 60 (Conway et al., 2011). “The explanatory power of institution-level
models is likely to be considerably higher than that of student-level models because aggregation
masks a substantial proportion of engagement variability” (Conway et al., 2011, p. 21). Since all
of the participants were pooled to compute the descriptive statistics for the NSSE benchmarks

96
scores, only student-level scores were examined. Furthermore, as the institutions were not
identifiable, an institutional-level examination of the benchmark scores was not feasible. The
distribution of the NSSE benchmark scores present the scores specific to the academic programs
of nursing in Ontario.
The distribution in Table 4 presents the range and average score for each benchmark for
the first-year nursing students in Ontario. A review of the means shows that the scores for three
benchmarks, LAC, ACL and SCE, hovered around the midpoint of 50.0, while for two scales,
SFI and EEE, the mean scores were at the low end of the scale. For the LAC benchmark, the
range indicated that “some schools demand much more of their students than others” (NSSE,
2000, p.13). For the first-year nursing students, 69 points – more than half of the scale –
“separate the most demanding institution from the least demanding” (NSSE, 2000, p.13). This
wide range was indicative of different “cultures of expectation” (NSSE, 2000, p.13) in nursing
programs in Ontario. For the ACL benchmark, the wide range indicated that some of the students
in the sample were more intensely involved in their learning than others. A total of 85 points
separated the most intensely involved students from the least involved. This wide range may be
indicative of the different nursing curricular and related expectations. The scores for the SFI
benchmark ranged from 0 to 100 which indicated that some first-year nursing students had
minimal interaction with faculty and others were interacting with faculty more so. The mean SFI
score was also below the midpoint of the scale indicating that most students did not interact with
faculty members. The EEE benchmark scores ranged from 3 to 79. This wide range indicated
that some students were more intensely involved in complementary learning opportunities to
augment the academic program than others. The mean EEE score was below the midpoint of the
scale indicating that most students were not using complementary learning opportunities to
augment their academic program. The SCE benchmark also had a wide range but the mean score

97
was above the midpoint of the scale “indicating that most students rate their institution
favorably” (NSSE, 2000, p.14).
Dot plots were generated for each of the NSSE benchmark scores distribution for the
first-year nursing students. As indicated in Figures 1 through 5 for each scale, a visual inspection
reveals that most of the scores are in the middle of the distribution (around the mean for each
engagement benchmark) and fewer values at each end of the scale. For each benchmark, the
skewness and kurtosis were also examined to measure the deviation from normality. Both
skewness and kurtosis have a value of zero in a normal distribution (Tabachnick & Fidell, 2013).
The distribution of the LAC benchmark scores (Figure 1) had a skewness of 0.170 (SE = 0.14)
and kurtosis of - 0.389 (SE = 0.28). Since the value of the skewness was closer to zero, the
distribution of LAC scores was approximately symmetric. For the kurtosis, the value was
negative representing a platykurtic distribution, which meant that most of the values in the
distribution had about the same frequency of occurrence and as a result the curve was flat with a
wider peak.
Figure 1. Distribution of the Level of Academic Challenge scores (LAC).
The distribution of the ACL benchmark scores (Figure 2) had a skewness of 0.546 (SE =
0.14) and kurtosis of 0.174 (SE = 0.28). The skewness positive value indicated a slight positive
skewness of the distribution with most of the cases on the left side of the mean with extreme
values to the right. The kurtosis value was positive indicating a leptokurtic distribution, which

98
meant the center peak was higher than a normal distribution with values concentrated around the
mean and thicker tails.
Figure 2. Distribution of the Active and Collaborative Learning scores (ACL).
The distribution of the SFI benchmark scores (Figure 3) had a skewness of 1.154 (SE =
0.14) and kurtosis of 1.940 (SE = 0.28). As the value of the skewness was greater than one, this
indicated highly positively skewed distribution with most of the cases on the left side of the
mean with extreme values to the right. With a kurtosis value greater than zero, this represented a
leptokurtic distribution which meant that the center peak was higher than a normal distribution
with values concentrated around the mean.
Figure 3. Distribution of the Student-Faculty Interaction scores (SFI).

99
The distribution of the EEE benchmark scores (Figure 4) had a skewness of 0.400 (SE =
0.14) and kurtosis was – 0.029 (SE = 0.28). Since the value of the skewness was closer to zero,
the distribution of EEE scores was approximately symmetric. But with a negative kurtosis value,
this indicated a platykurtic or flat distribution which meant that most of the values in the
distribution had about the same frequency of occurrence and as a result the curve was flat with a
wider peak.
Figure 4. Distribution of the Enriching Educational Experiences scores (EEE).
The distribution of the SCE benchmark scores (Figure 5) had a skewness of –0.066 (SE =
0.14) and kurtosis was – 0.112 (SE = 0.28). The negative skewness value indicated a slightly
negatively skewed distribution. But the small skewness value of less than 0.5 indicated an
approximately symmetrical distribution. The negative kurtosis indicated a flat distribution with a
wider spread of values around the mean.
Figure 5. Distribution of the Supportive Campus Environment scores (SCE).

100
Research Question Three
Research Question 3 asks: What is the relationship between demographic, external,
academic, social and institutional variables and student engagement scores on the five NSSE
benchmarks for first-year full-time nursing students in selected Ontario universities?
To examine the relationship between the predictor and response variables, a stepwise
multiple regression analysis was conducted. As suggested by Tabachnick and Fidell (2013), at
least 40 subjects per predictor variable were needed for a reliable equation using stepwise
regression. Since the sample size was 293 nursing students and applying the suggested predictor
variable ratio (40:1), each regression equation was limited to no more than seven predictor
variables. As minimal studies were identified that examined nursing student engagement, it was
difficult to ascertain which variables to examine with respect to their impact on student
engagement. Hence a two-stage approach described in the next section was utilized.
The predictor variables in this question were a combination of categorical and continuous
variables. These predictor variables were coded according to the principles discussed in the
subsection “Study Variables and Coding” in Chapter 3. In order to include the categorical
variables in the regression analysis, the variables were coded using dummy coding as suggested
by Pedhazur (1982). As a first step, correlations were computed between all predictor variables
to assess for multicollinearity. As there were two predictors identified, these were excluded in
the respective regression analysis. The analysis was then conducted using a stepwise regression
approach in two stages as suggested by Gocka (1973). In the first stage, each set of predictor
variables (demographic, external, academic, social and institutional variables) were regressed
separately with each of the five NSSE benchmarks. The first stage aided in identifying and
selecting an effective subset of predictors (Gocka, 1973) specific to the first-year nursing
students. Furthermore, the selection of significant predictors in the data set was important in
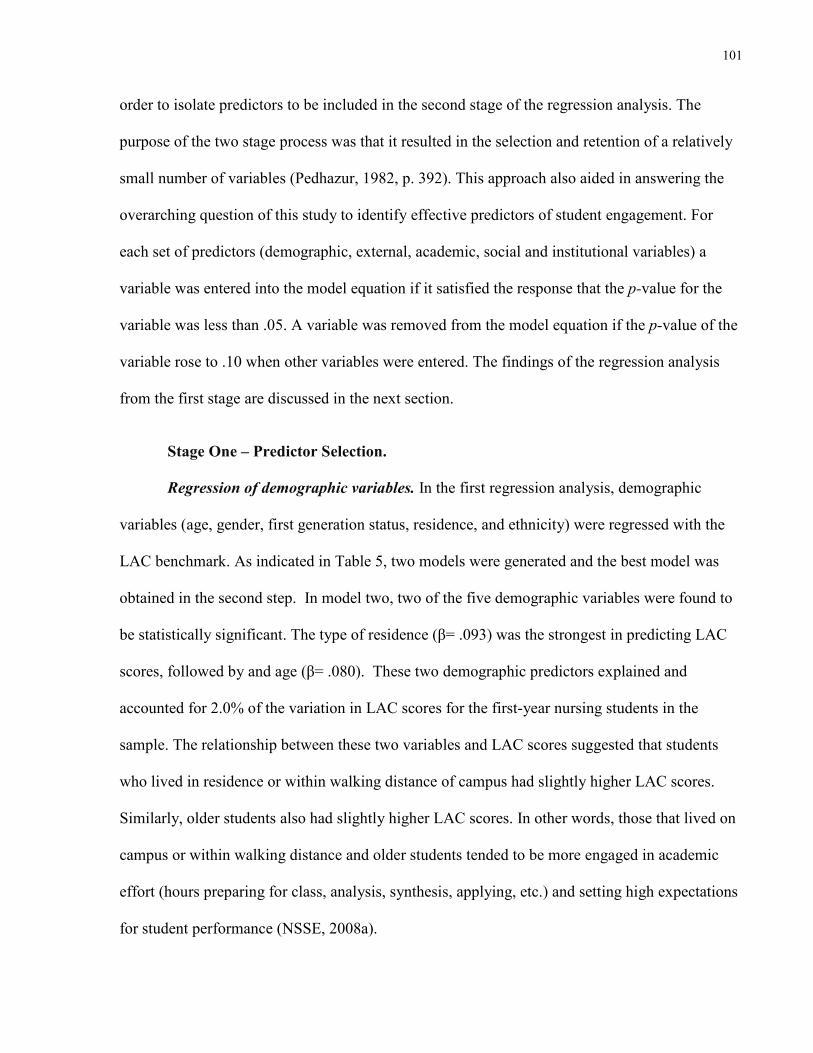
101
order to isolate predictors to be included in the second stage of the regression analysis. The
purpose of the two stage process was that it resulted in the selection and retention of a relatively
small number of variables (Pedhazur, 1982, p. 392). This approach also aided in answering the
overarching question of this study to identify effective predictors of student engagement. For
each set of predictors (demographic, external, academic, social and institutional variables) a
variable was entered into the model equation if it satisfied the response that the p-value for the
variable was less than .05. A variable was removed from the model equation if the p-value of the
variable rose to .10 when other variables were entered. The findings of the regression analysis
from the first stage are discussed in the next section.
Stage One – Predictor Selection.
Regression of demographic variables. In the first regression analysis, demographic
variables (age, gender, first generation status, residence, and ethnicity) were regressed with the
LAC benchmark. As indicated in Table 5, two models were generated and the best model was
obtained in the second step. In model two, two of the five demographic variables were found to
be statistically significant. The type of residence (β= .093) was the strongest in predicting LAC
scores, followed by and age (β= .080). These two demographic predictors explained and
accounted for 2.0% of the variation in LAC scores for the first-year nursing students in the
sample. The relationship between these two variables and LAC scores suggested that students
who lived in residence or within walking distance of campus had slightly higher LAC scores.
Similarly, older students also had slightly higher LAC scores. In other words, those that lived on
campus or within walking distance and older students tended to be more engaged in academic
effort (hours preparing for class, analysis, synthesis, applying, etc.) and setting high expectations
for student performance (NSSE, 2008a).

102
Table 5
Significant Demographic Predictors of Level of Academic Challenge (LAC) Scores
Unstandardized Coefficients
Standardized
Coefficients
Model Term B
Standard
Error Beta t p-Value
1 (Constant) 53.594 1.514 35.391 .000
Type of Residence 1.876 .581 .118 3.227 .001
2a (Constant) 50.708 2.044 24.810 .000
Type of Residence 1.475 .611 .093 2.414 .016
Age .170 .081 .080 2.097 .036
a. R = .140; R2 = .020; p = .036
In the second regression analysis, demographic variables were regressed with the ACL
benchmark scores. This analysis resulted in three models as shown in Table 6. The best model
was obtained in step three. In model three, three of the five demographic variables were
significant in predicting ACL scores. Age (β= .193) was the strongest in predicting ACL scores,
followed by type of residence (β= .130) and then ethnicity (β= .105). These three demographic
predictors explained and accounted for 9.4% of the variation in ACL scores in first-year nursing
students. The relationships between these three predictors and ACL scores suggested that older
students, those that lived off campus within a driving distance and students from other ethnic
groups had higher ACL scores. The higher ACL scores were indicative of these students being
more intensely involved in their education and that they collaborated with their peers in problem-
solving, projects, and discussion of ideas inside and outside of the classroom environment
(NSSE, 2008a).

103
Table 6
Significant Demographic Predictors of Active and Collaborative Learning (ACL) Scores
Unstandardized Coefficients
Standardized
Coefficients
Model Term B
Standard
Error Beta t p-Value
1 (Constant) 33.395 2.602 12.835 .000
Age .773 .110 .251 7.012 .000
2 (Constant) 28.319 2.869 9.872 .000
Age .626 .115 .203 5.435 .000
Type of Residence 3.408 .848 .150 4.018 .000
3a (Constant) 24.822 3.098 8.013 .000
Age .595 .115 .193 5.174 .000
Type of Residence
Ethnicity: Caucasian
2.949
4.056
.859
1.397
.130
.105
3.435
2.903
.001
.004
a. R = .306; R2 = .094; p = .000
In the third regression analysis, demographic variables were regressed with the SFI
benchmark scores. This resulted in two models being generated and the best model was obtained
in the second step. In model two, two of the five demographic predictor variables were found to
be statistically significant (Table 7). The type of residence (β= .099) was the strongest in
predicting SFI scores, followed by ethnicity (β= .075). These two variables accounted for 1.9%
of the variation in the SFI scores in the first-year nursing students in the sample. The relationship
of these two predictors and SFI scores suggested that students who lived off campus within a
driving distance of campus and those that were from other ethnic groups had slightly higher SFI
scores. The higher SFI scores for those that lived off campus and other ethnic group students
meant that these students were more engaged in interactions with faculty members inside and
outside of the classroom environment (NSSE, 2008a).

104
Table 7
Significant Demographic Predictors of Student-Faculty Interaction (SFI) Scores
Unstandardized Coefficients
Standardized
Coefficients
Model Term B
Standard
Error Beta t p-Value
1 (Constant) 26.676 2.347 11.364 .000
Type of Residence 2.838 .902 .115 3.147 .002
2a (Constant) 23.568 2.813 8.379 .000
Type of Residence 2.438 .922 .099 2.644 .008
Ethnicity: Caucasian 3.126 1.565 .075 1.997 .046
a. R = .136; R2 = .019; p = .001
In the fourth regression analysis (Table 8) demographic variables were regressed with the
EEE benchmark scores. Two models were generated with model two resulting in two of the five
demographic predictors as statistically significant. The results indicated that the type of residence
(β= .121) was the strongest in predicting EEE scores followed by first generation student (β= -
.089). These two variables accounted for 2.1% of the variation in the EEE scores. The
relationship between the type of residence and EEE scores indicated that students living within
driving distance and commute to campus tend to have higher EEE scores. The higher EEE scores
indicated that these students were more engaged in complementary learning opportunities to
enhance their academic program. On the other hand, an inverse relationship was seen with first
generation student, as the predictor, and EEE scores suggesting that EEE scores are lower for
first generation students. The lower EEE scores for first generation students indicated that they
were not engaged in other learning opportunities inside and outside of the classroom to enhance
their academic program (NSSE, 2008a).

105
Table 8
Significant Demographic Predictors of Enriching Educational Experience (EEE) Scores
Unstandardized Coefficients
Standardized
Coefficients
Model Term B
Standard
Error Beta t p-Value
1 (Constant) 32.236 1.851 17.418 .000
Type of Residence 2.189 .710 .113 3.084 .002
2a (Constant) 37.861 2.959 12.796 .000
Type of Residence 2.348 .711 .121 3.305 .001
First Generation Student -3.353 1.379 -.089 -2.432 .015
a. R = .144; R2 = .021; p = .000
In the fifth regression analysis demographic variables were regressed with the SCE
benchmark scores which resulted in two models being generated (Table 9). Model two resulted
in two statistically significant demographic predictors. Type of residence (β= -.159) was the
strongest in predicting SCE scores, followed by gender (β= -.088). These variables accounted for
3.1% of the variation in SCE scores in the sample. The relationship between these two
demographic predictors and SCE scores suggest that students living within a driving distance and
commute to campus, and females tend to have lower SCE scores.

106
Table 9
Significant Demographic Predictors of Supportive Campus Environment (SCE) Scores
Unstandardized Coefficients
Standardized
Coefficients
Model Term B
Standard
Error Beta t p-Value
1 (Constant) 64.774 2.268 28.564 .000
Type of Residence -3.639 .871 -.152 -4.180 .000
2a (Constant) 75.459 4.961 15.211 .000
Type of Residence -3.803 .871 -.159 -4.369 .000
Institution reported: Gender -5.421 2.240 -.088 -2.420 .016
a. R = .175; R2 = .031; p = .000
Regression of external variables. There were three candidate predictor external variables
examined, which included the hours per seven-day week spent working for pay off campus,
commuting to class and providing care for dependents. Each of the five NSSE benchmarks was
examined in a separate regression analysis with the external variable set. No statistically
significant variables were identified in all five regression analysis. In other words, external
variables were not found to be statistically significant in each of the relationships examined with
the five NSSE benchmarks.
Regression of academic variables. The two academic variables in this study included
hours per seven-day week spent preparing for class and self-reported GPA. In the first regression
analysis, only self-reported GPA was regressed with the LAC benchmark scores using a stepwise
approach. The number of hours per seven-day spent preparing for class was excluded from this
analysis, as this variable was also an item that contributes to the LAC benchmark. Hence to
avoid the issue of multicollinearity, the number of hours spent preparing for class was not
entered in the analysis. One model (Table 10) was generated and the results indicated that self-
reported GPA (β= .118) was statistically significant and accounted for only 1.4% of the variation

107
in LAC scores in first-year nursing students. However, this finding should be interpreted with
healthy skepticism as the p value was barely significant at p = .045.
Table 10
Significant Academic Predictors of Level of Academic Challenge (LAC) Scores
Unstandardized Coefficients
Standardized
Coefficients
Model Term B
Standard
Error Beta t p-Value
1a (Constant) 51.605 2.125 24.285 .000
Recoded grades .935 .464 .118 2.015 .045
a. R = .118; R2 = .014; p = .045
In the second stepwise regression analysis both academic variables were regressed with the ACL
benchmark. This analysis resulted in one model (Table 11) which found that the number of hours
per seven-day week spent preparing for class (β= .296) was the strongest in predicting ACL
scores and accounted for 8.8% of the variation in ACL scores for first-year nursing students. The
results suggested a direct relationship in that the more hours the student spent preparing for class,
the higher the ACL scores. The higher ACL scores indicated that the more hours that these
students spent preparing for class, the more intensely they were involved in their education and
collaboration with their peers both inside and outside of the classroom environment.
Table 11
Significant Academic Predictors of Active and Collaborative Learning (ACL) Scores
Unstandardized Coefficients
Standardized
Coefficients
Model Term B
Standard
Error Beta t p-Value
1a (Constant) 30.840 2.463 12.521 .000
Hours per seven-day week
spent preparing for class 2.607 .497 .296 5.248 .000
a. R = .296; R2 = .088; p = .000
In the third stepwise regression analysis both academic variables were regressed with the
SFI benchmark scores. In this analysis one model (Table 12) was generated which indicated that

108
the number of hours per seven-day week spent preparing for class (β= .159) was statistically
significant and accounted for 2.5% of the variation in SFI scores. The results suggested that more
time spent by first-year nursing students to prepare for class was associated with higher SFI
scores. In other words, the more they were engaged in interactions with faculty members inside
and outside of the classroom. “As a result, their teachers become role models, mentors, and
guides for continuous, life-long learning (NSSE, 2008a, p.2).
Table 12
Significant Academic Predictors of Student-Faculty Interaction (SFI) Scores
Unstandardized Coefficients
Standardized
Coefficients
Model Term B
Standard
Error Beta t p-Value
1a (Constant) 20.584 2.713 7.586 .000
Hours per seven-day week
spent preparing for class 1.490 .547 .159 2.723 .007
a. R = .159; R2 = .025; p = .007
In the fourth regression analysis both academic variables were regressed with the EEE
benchmark scores which resulted in one model being generated. As seen in Table 13, self-
reported GPA (β= .158) was the strongest in predicting EEE scores. This variable explained and
accounted for 2.5% of the variation in EEE scores for first-year nursing students. The findings
suggested a positive relationship between the two variables in that higher grades were associated
with higher EEE scores. The higher EEE scores meant that these students were more engaged in
complementary learning opportunities to enhance their academic program.

109
Table 13
Significant Academic Predictors of Enriching Educational Experience (EEE) Scores
Unstandardized Coefficients
Standardized
Coefficients
Model Term B
Standard
Error Beta t p-Value
1a (Constant) 25.635 2.311 11.094 .000
Recoded grades 1.357 .504 .158 2.694 .007
a. R = .158; R2 = .025; p = .007
In the fifth stepwise regression analysis, academic variables were regressed with the SCE
benchmark scores which resulted in one model being generated. As displayed in Table 14, the
number of hours per seven-day week spent preparing for class (β=.184) was the strongest in
predicting SCE scores and accounted for 3.4% of the variation in SCE scores for first-year
nursing students. The results suggested that the more time spent preparing for class by first-year
nursing students, the higher the SCE scores. The higher SCE scores were indicative of the
student being satisfied with the institutions commitment to their success; a positive campus
environment and quality of relationships (NSSE, 2008a).
Table 14
Significant Academic Predictors of Supportive Campus Environment (SCE) Scores
Unstandardized Coefficients
Standardized
Coefficients
Model Term B
Standard
Error Beta t p-Value
1a (Constant) 51.081 2.921 17.485 .000
Hours per seven-day week
spent preparing for class 1.868 .589 .184 3.170 .002
a. R = .184; R2 = .034; p = .002
Regression of social variables. In the first stepwise regression analysis both social
variables (exercised or participated in physical fitness activities and hours per seven-day week

110
spent participating in cocurricular activities) were regressed with the LAC benchmark scores.
One model (Table 15) was generated resulting in participating in cocurricular activities (β= .195)
as the strongest social predictor. This variable accounted for 3.8% of the variation in LAC
scores. The findings suggested that the more time first-year nursing students spent participating
in cocurricular activities, the higher the LAC scores or greater the engagement in academic effort
and setting high expectations for performance.
Table 15
Significant Social Predictors of Level of Academic Challenge (LAC) Scores
Unstandardized Coefficients
Standardized
Coefficients
Model Term B
Standard
Error Beta t p-Value
1a (Constant) 50.735 1.584 32.033 .000
Recoded cocurricular activity 2.711 .806 .195 3.364 .001
a. R = .195; R2 = .038; p = .001
In the second stepwise regression analysis both social variables were regressed with the ACL
benchmark scores. This analysis resulted in one model being generated (Table 16). Participating
in cocurricular activities (β= .216) was statistically significant and accounted for 4.7% of the
variation in ACL scores. This finding suggested that students who participated in cocurricular
activities had higher ACL scores meaning that these students were more intensely involved in
their education and collaborated more with their peers.
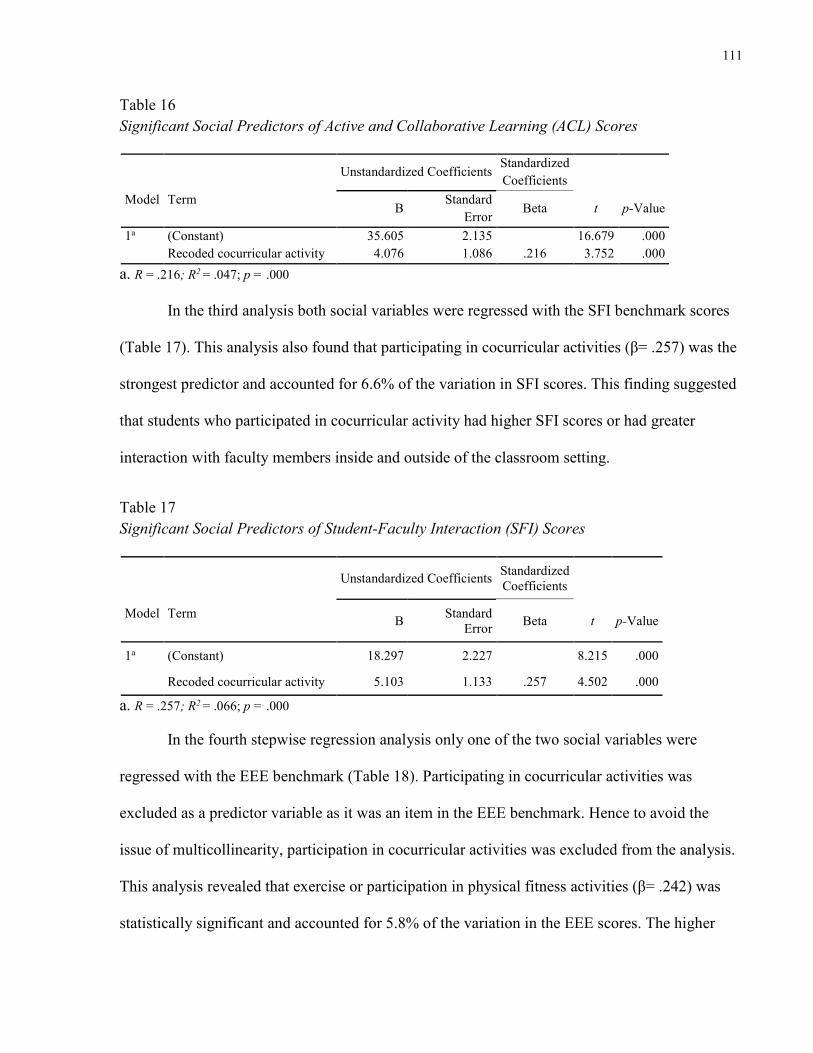
111
Table 16
Significant Social Predictors of Active and Collaborative Learning (ACL) Scores
Unstandardized Coefficients
Standardized
Coefficients
Model Term B
Standard
Error Beta t p-Value
1a (Constant) 35.605 2.135 16.679 .000
Recoded cocurricular activity 4.076 1.086 .216 3.752 .000
a. R = .216; R2 = .047; p = .000
In the third analysis both social variables were regressed with the SFI benchmark scores
(Table 17). This analysis also found that participating in cocurricular activities (β= .257) was the
strongest predictor and accounted for 6.6% of the variation in SFI scores. This finding suggested
that students who participated in cocurricular activity had higher SFI scores or had greater
interaction with faculty members inside and outside of the classroom setting.
Table 17
Significant Social Predictors of Student-Faculty Interaction (SFI) Scores
Unstandardized Coefficients
Standardized
Coefficients
Model Term B
Standard
Error Beta t p-Value
1a (Constant) 18.297 2.227 8.215 .000
Recoded cocurricular activity 5.103 1.133 .257 4.502 .000
a. R = .257; R2 = .066; p = .000
In the fourth stepwise regression analysis only one of the two social variables were
regressed with the EEE benchmark (Table 18). Participating in cocurricular activities was
excluded as a predictor variable as it was an item in the EEE benchmark. Hence to avoid the
issue of multicollinearity, participation in cocurricular activities was excluded from the analysis.
This analysis revealed that exercise or participation in physical fitness activities (β= .242) was
statistically significant and accounted for 5.8% of the variation in the EEE scores. The higher

112
EEE scores indicated that these students engaged more in complementary learning opportunities
to enhance their academic program.
Table 18
Significant Social Predictors of Enriching Educational Experience (EEE) Scores
Unstandardized Coefficients
Standardized
Coefficients
Model Term B
Standard
Error Beta t p-Value
1a (Constant) 22.453 2.268 9.901 .000
Exercised or participated in
physical fitness activities 3.430 .811 .242 4.227 .000
a. R = .242; R2 = .058; p = .000
In the fifth analysis both social variables were regressed with the SCE benchmark scores
which resulted in one model being generated (Table 19). Exercise or participation in physical
fitness activities (β= .172) emerged as the strongest in predicting SCE scores. This variable
explained and accounted for 3.0% of the variation in SCE scores in first-year nursing students.
The finding suggested that students who exercised or participated in physical fitness activities
had higher SCE scores or greater satisfaction with the institutional commitment to their success;
a positive campus environment and the quality of relationships with others.
Table 19
Significant Social Predictors of Supportive Campus Environment (SCE) Scores
Unstandardized Coefficients
Standardized
Coefficients
Model Term B
Standard
Error Beta t p-Value
1a (Constant) 50.414 3.263 15.449 .000
Exercised or participated in
physical fitness activities 3.458 1.167 .172 2.964 .003
a. R = .172; R2 = .030; p = .003

113
Regression of institutional variable. There was one institutional variable examined in
this study, university or institution size. This predictor was regressed in five different regression
equations with each of the NSSE benchmarks. Only three of the five analyses found institutional
size as a significant predictor. In the regression analyses with LAC and SCE as the response
variables, institution size was not found to be a significant predictor. However, institution size
(β= -.303) was found to be statistically significant when regressed with the ACL benchmark
scores accounting for 9.2% variation in ACL scores (Table 20). The findings suggested an
inverse relationship between institution size and ACL scores meaning that as the university size
increased, ACL scores decreased. As the university size increased, students were less intensely
involved in their education and peer collaboration.
Table 20
Significant Institutional Predictor of Active and Collaborative Learning (ACL) Scores
Unstandardized Coefficients
Standardized
Coefficients
Model Term B
Standard
Error Beta t p-Value
1a (Constant) 53.804 2.214 24.307 .000
University Size -6.772 1.247 -.303 -5.430 .000
a. R = .303; R2 = .092; p = .000
When institution size was regressed with the SFI benchmark scores, the results indicated
that university size (β= -.199) was statistically significant and accounted for 4.0% of the
variation in the SFI scores (Table 21). The findings of this analysis also revealed an inverse
relationship between institution size and SFI suggesting that as institution size increased, SFI
scores decreased. In other words, as university size increased the student interaction with faculty
members decreased.

114
Table 21
Significant Institutional Predictor of Student-Faculty Interaction (SFI) Scores
Unstandardized Coefficients
Standardized
Coefficients
Model Term B
Standard
Error Beta t p-Value
1a (Constant) 35.002 2.418 14.475 .000
University Size -4.706 1.361 -.199 -3.458 .001
a. R = .199; R2 = .040; p = .001
The third significant relationship was found with the EEE benchmark. The results
indicated that university size (β= -.126) was statistically significant and accounted for only 1.6%
of the variation in EEE scores (Table 22). This result also indicated an inverse relationship
between university size and EEE scores. In other words, as university size increased, the EEE
scores or the complementary learning opportunities decreased.
Table 22
Significant Institutional Predictor of Enriching Educational Experience (EEE) Scores
Unstandardized Coefficients
Standardized
Coefficients
Model Term B
Standard
Error Beta t p-Value
1a (Constant) 35.119 1.880 18.678 .000
University Size -2.276 1.057 -.126 -2.153 .032
a. R = .126; R2 = .016; p = .032
Overall, institution size was not found to be significant when regressed with LAC and SCE
scores. On the other hand, when institution size was regressed with ACL, SFI and EEE scores, an
inverse relationship was noted.
Stage Two - Regression of significant predictor variables.
For the second stage, predictor variables from each set were used in the stepwise
regression analysis if they were found to be statistically significant in stage one. Following the
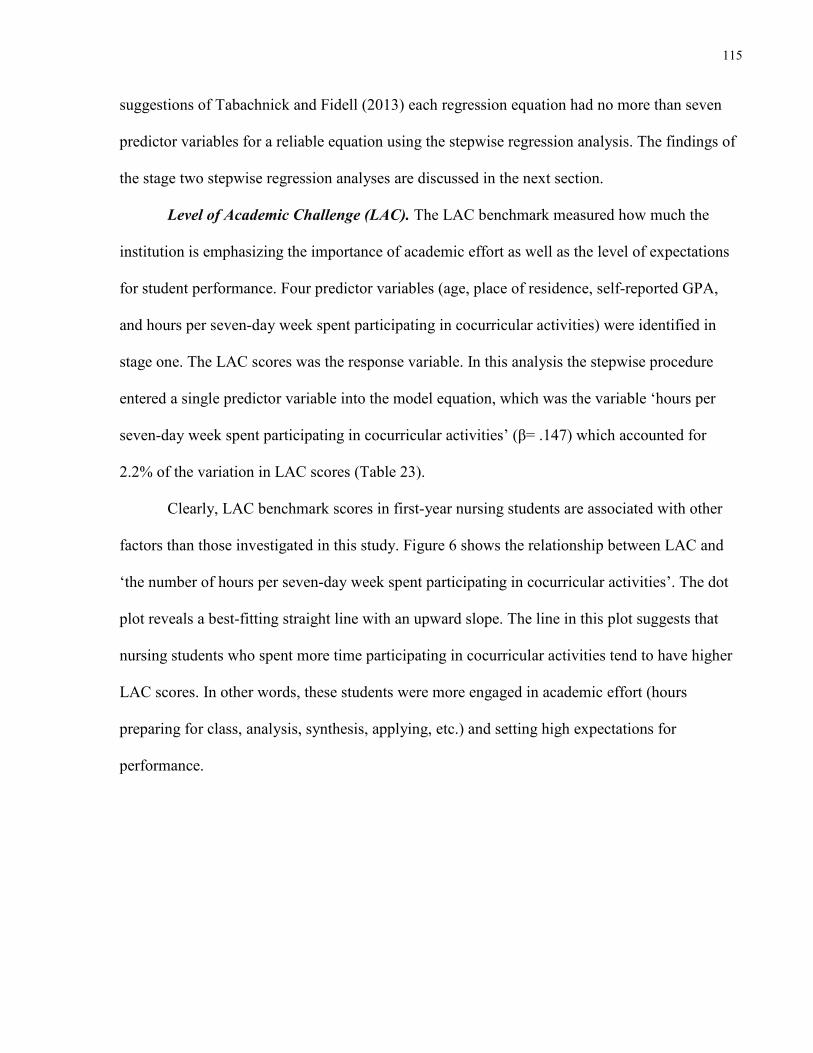
115
suggestions of Tabachnick and Fidell (2013) each regression equation had no more than seven
predictor variables for a reliable equation using the stepwise regression analysis. The findings of
the stage two stepwise regression analyses are discussed in the next section.
Level of Academic Challenge (LAC). The LAC benchmark measured how much the
institution is emphasizing the importance of academic effort as well as the level of expectations
for student performance. Four predictor variables (age, place of residence, self-reported GPA,
and hours per seven-day week spent participating in cocurricular activities) were identified in
stage one. The LAC scores was the response variable. In this analysis the stepwise procedure
entered a single predictor variable into the model equation, which was the variable ‘hours per
seven-day week spent participating in cocurricular activities’ (β= .147) which accounted for
2.2% of the variation in LAC scores (Table 23).
Clearly, LAC benchmark scores in first-year nursing students are associated with other
factors than those investigated in this study. Figure 6 shows the relationship between LAC and
‘the number of hours per seven-day week spent participating in cocurricular activities’. The dot
plot reveals a best-fitting straight line with an upward slope. The line in this plot suggests that
nursing students who spent more time participating in cocurricular activities tend to have higher
LAC scores. In other words, these students were more engaged in academic effort (hours
preparing for class, analysis, synthesis, applying, etc.) and setting high expectations for
performance.

116
Table 23
Significant Predictor Variable of LAC Scores
Unstandardized Coefficients
Standardized
Coefficients
Model Term B
Standard
Error Beta t p-Value
1a (Constant) 52.386 1.412 37.101 .000
Hours per seven-day week spent
participating in cocurricular
activities
1.661 .668 .147 2.485 .014
a. R = .147; R2 = .022; p=.01
Figure 6. A dot plot of the relationship between LAC scores and participating in
cocurricular activities.
Active and Collaborative Learning (ACL). The ACL benchmark measured how intensely
students are involved in their studies. The second regression analysis examined six predictor
variables (age, place of residence, ethnicity, hours per seven-day week spent preparing for class,
hours per seven-day week spent participating in cocurricular activities and institution size)
identified in stage one of the analysis and ACL scores as the response variable. As indicated in
Table 24, five models were generated in this analysis and the best model was obtained in the fifth
step where the significant values were calculated to be lower than p < .05.

117
Table 24
Significant Predictor Variables of ACL Scores
Unstandardized Coefficients
Standardized
Coefficients
Model Term B
Standard
Error Beta t p-Value
1 (Constant) 52.415 2.233 23.469 .000
University Size -6.163 1.263 .280 -4.881 .000
2 (Constant) 41.477 3.135 13.229 .000
University Size -5.858 1.218 -.266 -4.811 .000
Hours per seven-day week spent
preparing for class 2.308 .481 .265 4.794 .000
3 (Constant) 38.368 3.311 11.587 .000
University Size -5.943 1.205 -.270 -4.933 .000
Hours per seven-day week spent
preparing for class
2.095
.483
.241
4.340
.001
Hours per seven-day week spent
participating in cocurricular 2.360 .881 .148 2.679 .008
4 (Constant) 31.392 4.197 7.479 .000
University Size -5.962 1.192 -.271 -5.002 .000
Hours per seven-day week spent
preparing for class 1.991 .479 .229 4.156 .000
Hours per seven-day week spent
participating in cocurricular activities 2.503 .873 .157 2.866 .004
Ethnicity: Caucasian 6.079 2.287 .144 2.658 .008
5a (Constant) 23.932 5.466 4.378 .000
University Size -5.796 1.187 -.263 -4.882 .000
Hours per seven-day week spent
preparing for class 1.883 .479 .216 3.933 .000
Hours per seven-day week spent
participating in cocurricular 2.673 .872 .168 3.067 .002
Ethnicity: Caucasian 5.209 2.309 .124 2.256 .025
Age .418 .198 .117 .117 .036
a. R = .451; R2 = .203; p = .000

118
In model five, five of the six predictor variables were found to be statistically significant.
Institution size (β= -.263) emerged as the strongest predictor of ACL scores, followed by the
number of ‘hours per seven -day week spent preparing for class’ (β= .216), ‘hours per seven-day
week spent participating in cocurricular activities’ (β= .168), ethnicity (β= .124), and age (β=
.117). These five variables explained and accounted for a total of 20.3 % of the variation in ACL
scores.
Figures 7 through 11 show the relationships between the ACL scores and the five
statistically significant predictor variables. The first statistically significant predictor variable
was institution size. In Figure 7, the dot plot reveals a best-fitting straight line with a downward
slope. The line in this plot suggests that nursing students at larger institutions tend to have lower
ACL scores, and students at smaller institutions tend to have higher ACL scores. It appears that
institutional size is a somewhat stronger engagement driver than academic performance and
student characteristics for the ACL benchmark, accounting for most of the variation in ACL
scores. Since the ACL benchmark measures how intensely students are involved in their
education, the smaller institutions tend to have smaller class sizes and student-faculty ratios,
making it easier for faculty to know the names of the students, and for students to be engaged in
dialogue amongst themselves contributing to the social and academic integration to the
institutional environment (Kuh et al., 2006) resulting in higher engagement scores.

119
Figure 7. A dot plot of the relationship between ACL scores and institution size.
The second statistically significant predictor variable was the number ‘hours per seven-
day week spent preparing for class’ per week. The dot plot in Figure 8 shows the best-fitting
straight line that indicates an upward slope suggesting that students who spent more time
preparing for class tend to have higher ACL scores. The higher ACL scores were indicative of
these students being more intensely involved in their education and collaborated more with their
peer in solving problems, working on projects, tutoring and discussion of ideas with others inside
and outside of class.

120
Figure 8. A dot plot of the relationship between ACL scores and hours spent
preparing for class.
The third statistically significant predictor variable was the ‘hours per seven-day week
spent participating in cocurricular activities. Figure 9 plots the direct relationship between ACL
scores and participating in cocurricular activities. The line suggests that students who spent more
time participating in cocurricular activities tend to have higher ACL scores.
Figure 9. A dot plot of the relationship between ACL scores and hours spent
participating in cocurricular activities.

121
The fourth statistically significant predictor variable was ethnicity. Figure 10 presents a
dot plot indicating the relationship with ACL scores and ethnicity. The line suggests that other
ethnic group students tend to have slightly higher Active and Collaborative Learning scores. In
other words, other ethnic group students were more intensely involved in their education and
collaborated more with their peers.
Figure 10. A dot plot of the relationship between ACL scores and ethnicity.
The fifth significant predictor variable for ACL scores was age. Figure 11 plots the
relationship between ACL scores and student age. The line has an upward slope suggesting that
older students tend to have higher ACL scores or were more intensely involved in their education
and collaborated with their peers.

122
Figure 11. A dot plot of the relationship between ACL scores and student age.
Student-Faculty Interaction (SFI). The SFI benchmark measured the quality and
quantity of the student and faculty interactions. The items focus on the number of
interactions and the types of discussions that students have with their faculty. In the third
regression analysis the response variable was the SFI scores and five predictor variables
(place of residence, ethnicity, hours per seven-day week spent preparing for class, hours
per seven-day week spent participating in cocurricular activities, and institution size) were
included as identified in the stage one analysis. In stage two of the stepwise regression
analysis, three models were generated (Table 25). The number of ‘hours per seven-day
week spent participating in cocurricular activities’ (β= .225) was the strongest predictor
variable for SFI scores followed by institution size (β= -.212), and ethnicity (β= .120).
These variables explained and accounted for a total of 10.6% of the variation in SFI scores
in the first-year nursing students in the sample.

123
Table 25
Significant Predictor Variables of SFI Scores
Unstandardized Coefficients
Standardized
Coefficients
Model Term B
Standard
Error Beta t p-Value
1 (Constant) 20.667 2.079 9.942 .000
Hours per seven-day week
spent participating in
cocurricular activities
3.728 1.008 .216 3.698 .000
2 (Constant) 28.687 2.964 9.679 .000
Hours per seven-day week
spent participating in
cocurricular activities
3.792 .986 .219 3.846 .000
University Size -5.074 1.365 -.212 -3.718 .000
3a (Constant) 21.993 4.325 5.085 .000
Hours per seven-day week
spent participating in
cocurricular activities
3.892 .981 .225 3.968 .000
University Size
Ethnicity: Caucasian
-5.078
5.489
1.356
2.597
-.212
.120
-3.744
2.113
.000
.035
a. R = .325; R2 = .106; p = .000
Figures 12 through 14 present the relationships between the SFI scores and the
three statistically significant predictor variables. Figure 12 implies that students who spent
more time participating in cocurricular activities had higher SFI scores than students who
did not participate or participated with fewer hours per seven-day week. The higher SFI
scores indicated that these students interacted with faculty members more so.
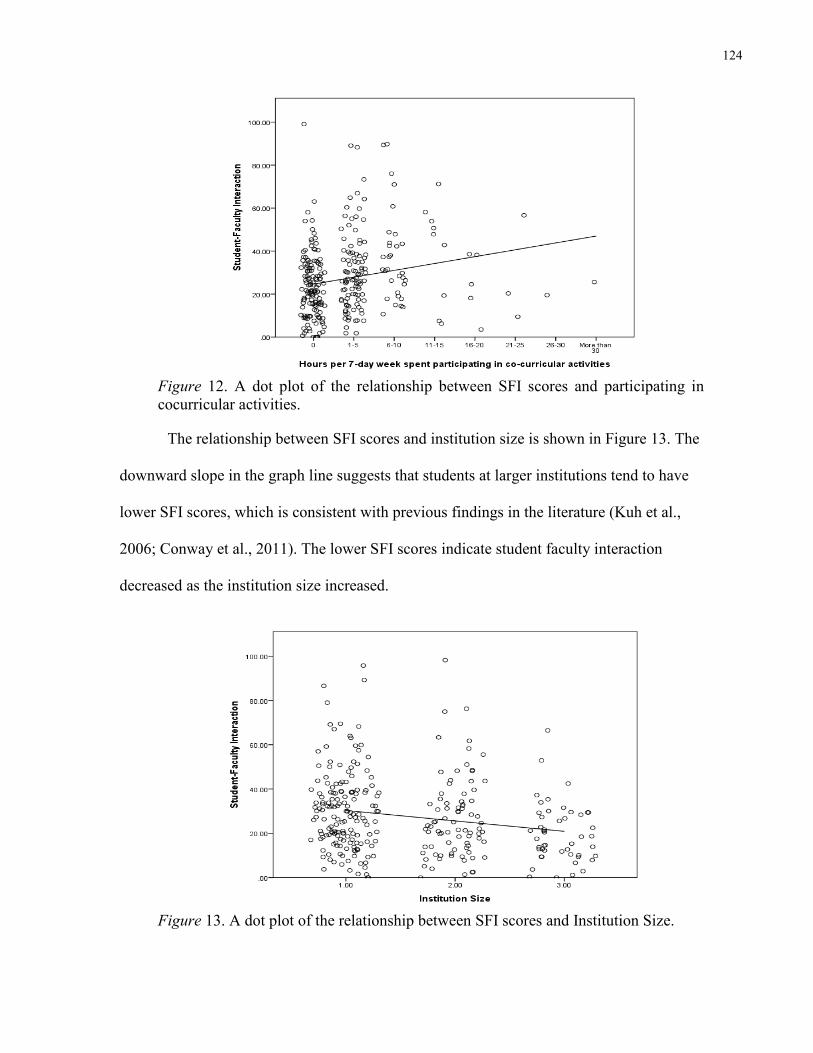
124
Figure 12. A dot plot of the relationship between SFI scores and participating in
cocurricular activities.
The relationship between SFI scores and institution size is shown in Figure 13. The
downward slope in the graph line suggests that students at larger institutions tend to have
lower SFI scores, which is consistent with previous findings in the literature (Kuh et al.,
2006; Conway et al., 2011). The lower SFI scores indicate student faculty interaction
decreased as the institution size increased.
Figure 13. A dot plot of the relationship between SFI scores and Institution Size.

125
The relationship between SFI scores and ethnicity is displayed in Figure 14. The
upward slope suggests that other ethnic group students tend to have higher SFI scores (or
more interaction with faculty members) compared to Caucasian students with lower SFI
scores.
Figure 14. A dot plot of the relationship between SFI scores and ethnicity.
Enriching Educational Experiences (EEE). The EEE benchmark measured the student
experience with respect to diversity, use of technology and other learning opportunities (such as
internships, practicum, etc.). This benchmark measured the student involvement in extra-
academic activities. In the fourth regression analysis the response variable was the EEE
benchmark scores. A total of six predictors were identified in stage one. However, only five
predictors (place of residence, first generation status, self-reported GPA, exercised or
participated in physical fitness activities, and institution size) were used in the analysis since the
sixth variable (hours per seven-day week spent participating in cocurricular activities) was an
item that contributed to the EEE benchmark. In this analysis three models were generated

126
identifying three of the five predictor variables as statistically significant (Table 26). Exercise or
participation in physical fitness activities (β= .251) was the strongest predictor of EEE scores
followed by self-reported GPA (β= .159), and institution size (β= -.152). These variables
explained and accounted for 10.4% of the variation in EEE scores.
Table 26
Significant Predictor Variables of EEE Scores
Unstandardized Coefficients
Standardized
Coefficients
Model Term B
Standard
Error Beta t p-Value
1 (Constant) 22.477 2.277 9.869 .000
Exercised or participated in
physical fitness activities 3.447 .816 .244 4.226 .000
2 (Constant) 17.427 3.010 5.790 .000
Exercised or participated in
physical fitness activities 3.332 .809 .236 4.117 .000
Recoded grades 1.242 .490 .145 2.535 .012
3a (Constant) 20.781 3.233 6.427 .000
Exercised or participated in
physical fitness activities 3.546 .805 .251 4.407 .000
Recoded grades
University Size
1.355
-2.731
.487
1.026
.159
-.152
2.784
-2.663
.006
.008
a. R = .322; R2 = .104; p = .000
Figures 15 through 17 show the relationships between EEE scores and the three
statistically significant predictor variables. The relationship between the predictor variable
exercise or participation in physical fitness activities and EEE as the response variable is
presented in Figure 15.The upward slope in the graph suggests that there is an increasing
relationship between the two variables. So, as exercise or physical fitness activities increase, so
do the EEE benchmark scores.

127
Figure 15. A dot plot of the relationship between EEE scores and exercise or
participation in physical fitness activities.
The relationship between self-reported GPA and EEE as the response variable is
presented in Figure 16. The upward slope suggests that students with higher grades tend to
have higher EEE scores. In other words, these students were more engaged in
complementary learning opportunities to enhance their academic program.
Figure 16. A dot plot of the relationship between EEE scores and self-reported GPA.

128
The relationship between the predictor variable of institution size and EEE as the
response variable is presented in Figure 17. The downward slope in the graph suggests that
there is an inverse relationship between the two variables. As the institutional size
increased, the EEE scores decreased. The lower EEE scores were indicative of the fact that
students at larger institutions were less engaged in complementary learning opportunities.
Figure 17. A dot plot of the relationship between EEE scores and institution size.
Supportive Campus Environment (SCE). The SCE measured institutional commitment to
student learning. In addition, the SCE benchmark also measured the quality of social relations
among different groups on campus. In the fifth stepwise regression analysis the response variable
was the SCE benchmark scores and four predictor variables were included as identified in stage
one. The four predictor variables included gender, place of residence; hours per seven-day week
spent preparing for class, and exercised or participated in physical fitness activities. This analysis
resulted in two models being generated (Table 27). The number of hours per seven-day week
spent preparing for class (β= .192) was the strongest predictor of SCE scores followed by

129
exercised or participated in physical fitness activities (β= .182). These variables explained and
accounted for 7.0% of the variation in SCE scores.
Table 27
Significant Predictor Variables of SCE Scores
Unstandardized Coefficients
Standardized
Coefficients
Model Term B
Standard
Error Beta t p-Value
1 (Constant) 50.878 2.934 17.342 .000
Hours per seven-day spent
preparing for class 1.961 .596 .192 3.292 .001
2a (Constant) 41.272 4.197 9.835 .000
Hours per seven-day spent
preparing for class 1.959 .586 .192 3.341 .001
Exercised or participated in
physical fitness activities 3.675 1.165 .182 3.155 .002
a. R = .264; R2 = .070; p = .000
The relationship between the number of hours per seven-day week spent preparing for
class and SCE as the response variable is presented in Figure 18. The upward slope in the line
suggests that students who spent more time preparing for class had higher SCE scores. The
higher SCE scores indicated that the students were satisfied of the institutions commitment to
their success; there was a positive campus environment; and quality of the relationships with
peers, staff and faculty members was positive.

130
Figure 18. A dot plot of the relationship between SCE scores and hours spent preparing
for class.
The relationship between the students who exercised or participated in physical fitness
activities on a weekly basis and SCE as the response variable is presented in Figure 19. The
upward slope in the line suggests that those that participated more in exercise or physical fitness
activities tend to have higher SCE scores.
Figure 19. A dot plot of the relationship between SCE scores and the participation of the
student in exercise or physical fitness activities.

131
Research Question Four
Research Question 4 asks: What is the relationship between student engagement scores
on the five NSSE scales and institutional size for first-year nursing students in selected Ontario
universities?
This question was addressed as a sub-part of Research Question 3 in the sense that
institution size was a candidate predictor variable for the model equations. However, as another
way of looking at the relationship between institution size and the NSSE benchmark scores the
Spearman nonparametric correlations were computed between the institution size variable and
the five NSSE scores. In other words, five bivariate Spearman correlation analyses were
conducted. The Spearman approach was used because the variable Institution Size is a three-
level ordinal variable (small, medium and large). The five NSSE engagement benchmark scores
were the response variables and institution size was the predictor variable. Table 28 presents the
results of the Spearman analysis.
As indicated in Table 28 only the p-values for ACL, SFI, and EEE variables were
statistically significant. This result was consistent with the analyses pertaining to Research
Question 3 discussed above. The correlation coefficient value of -.292 for the ACL benchmark
indicated a modest but statistically significant (p=.000) inverse relationship with institution size.
Figure 20 shows the jittered dot plot for the relationship between the ACL benchmark and
institution size. The downward slope in the graph suggests that students at larger institutions tend
to have lower ACL scores.

132
Table 28
Spearman Analysis for the Relationship between Institution Size and NSSE Scores
Variable Statistic Value of Statistic
Level of Academic Challenge (LAC)
Correlation Coefficient -.073
p-value (2-tailed) .216
N 292
Active and Collaborative Learning (ACL)
Correlation Coefficient -.292
p-value (2-tailed) .000
N 293
Student-Faculty Interaction (SFI)
Correlation Coefficient -.206
p-value (2-tailed) .000
N 292
Enriching Educational Experiences (EEE)
Correlation Coefficient -.124
p-value (2-tailed) .035
N 290
Supportive Campus Environment (SCE)
Correlation Coefficient -.105
p-value (2-tailed) .075
N 292
Figure 20. A dot plot of the relationship between ACL scores and institution size.

133
The correlation coefficient value of -.206 for the SFI benchmark also indicates a modest
yet statistically significant (p =.000) inverse relationship with institution size. Figure 21 shows
the jittered dot plot for the relationship between SFI benchmark and institution size. The
downward slope in the graph line suggests that students at larger institutions tend to have lower
SFI scores.
Figure 21. A dot plot of the relationship between SFI scores and institution size.
The correlation coefficient of -.124 for the EEE benchmark also indicated a modest but
statistically significant (p =.035) inverse relationship with institution size. Figure 22 shows the
jittered dot plot for the relationship between the EEE benchmark and institution size. The
downward slope in the graph line suggests that students at larger institutions tend to have lower
EEE scores. The Spearman analysis found that institution size had a negative relationship with
all three benchmarks – ACL, SFI and EEE benchmarks. In other words, as institution size
increased, ACL, SFI and EEE scores decreased. The findings of the Spearman analysis are

134
consistent with the regression analysis conducted in Research Question 3. Both analyses affirm
that larger institutions tend to have lower engagement scores.
Figure 22. A dot plot of the relationship between EEE scores and institution size.
Research Question Five
Research Question 5 asks: What is the relationship between student and institutional
characteristics and academic performance of first-year nursing students in selected Ontario
universities?
This question was answered using the same procedure as for Research question 3, a two-
stage approach. In the first stage, each set of predictor variables (demographic, external,
academic, social and institutional variables) were regressed with GPA, as the response variable,
to identify any significant predictors of academic performance in each set. Since GPA was an
ordinal variable that had eight values ranging from a high of “A” to a low of “C- or less”, this
variable was recoded into the percent mid-point for each category (code ‘pcntgrd’). Then the
next step was to identify any significant predictors of academic performance in each predictor
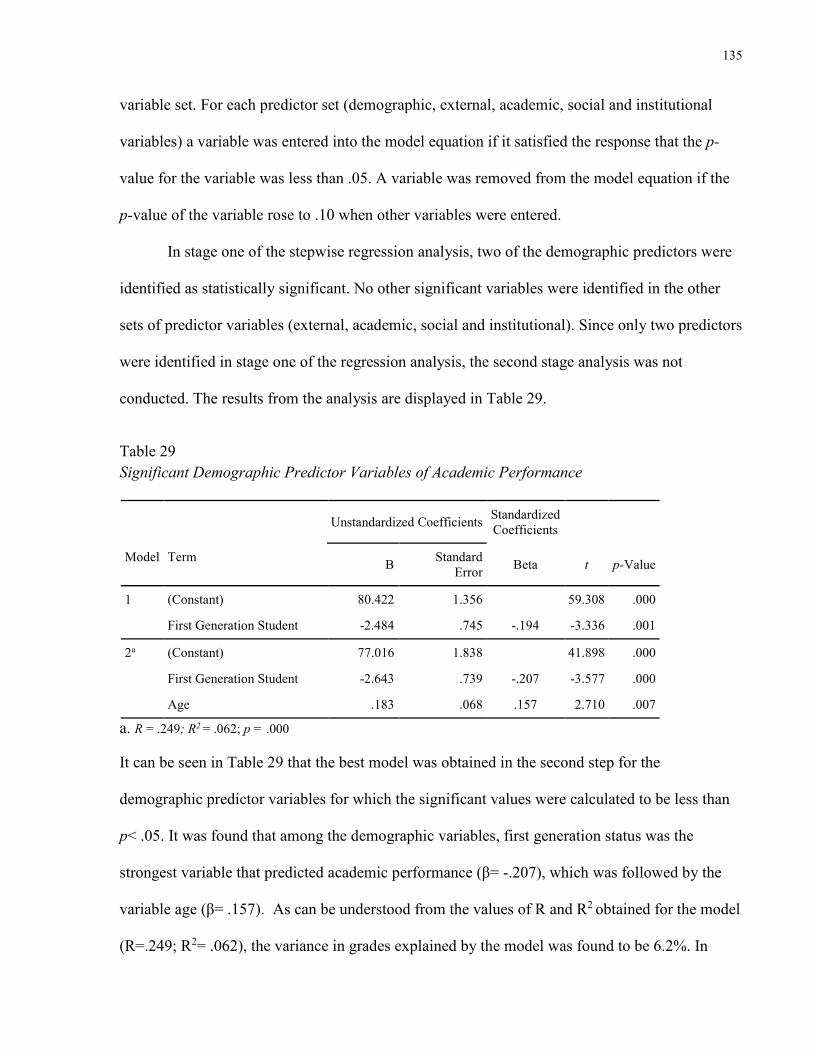
135
variable set. For each predictor set (demographic, external, academic, social and institutional
variables) a variable was entered into the model equation if it satisfied the response that the p-
value for the variable was less than .05. A variable was removed from the model equation if the
p-value of the variable rose to .10 when other variables were entered.
In stage one of the stepwise regression analysis, two of the demographic predictors were
identified as statistically significant. No other significant variables were identified in the other
sets of predictor variables (external, academic, social and institutional). Since only two predictors
were identified in stage one of the regression analysis, the second stage analysis was not
conducted. The results from the analysis are displayed in Table 29.
Table 29
Significant Demographic Predictor Variables of Academic Performance
Unstandardized Coefficients
Standardized
Coefficients
Model Term B
Standard
Error Beta t p-Value
1 (Constant) 80.422 1.356 59.308 .000
First Generation Student -2.484 .745 -.194 -3.336 .001
2a (Constant) 77.016 1.838 41.898 .000
First Generation Student -2.643 .739 -.207 -3.577 .000
Age .183 .068 .157 2.710 .007
a. R = .249; R2 = .062; p = .000
It can be seen in Table 29 that the best model was obtained in the second step for the
demographic predictor variables for which the significant values were calculated to be less than
p< .05. It was found that among the demographic variables, first generation status was the
strongest variable that predicted academic performance (β= -.207), which was followed by the
variable age (β= .157). As can be understood from the values of R and R2 obtained for the model
(R=.249; R2= .062), the variance in grades explained by the model was found to be 6.2%. In

136
other words, demographic variables (first generation student and age) explained and accounted
for 6.2% of the variation in academic performance (percent grades).
As displayed in Figure 23, a downward slope in the best fit line suggests that first
generation students had lower grades compared to students who had either parent with an
undergraduate degree with higher percent grades. In other words, a first generation student had
lower grades which in turn as a predictor may be seen as a negative influence on grades.
Figure 23. A dot plot of the relationship between first generation student and percent
grades.
The relationship between age and percent grades is presented in Figure 24. The
upward slope in the best fit line suggests a positive increasing relationship with age and
academic performance (grades). In other words, as age increased so did the academic
performance of the first-year nursing student.

137
Figure 24. A dot plot of the relationship between age and percent grades.
Summary
This chapter presented the results and analysis of data of this study. The overall purpose
of this study was to examine and describe nursing student characteristics that were associated
with student engagement, as measured by the NSSE benchmark scores. The response variable,
student engagement, was studied to examine any relationships with student and institutional
characteristics, and academic performance, as predictor variables. Several statistically significant
relationships were found between nursing student characteristics, academic performance,
institutional characteristics and engagement benchmark scores. Table 30 presents the findings of
both stage one and two of the regression analysis. Stage one examined each predictor set in a
separate regression with each benchmark. All of the variables in the demographic predictor set
were found to be significant predictors of the five NSSE benchmarks. Interestingly from the
demographic predictor set, place of residence was found to be a significant predictor in stage one
for all of the benchmarks. None of the external variables were found to be significant. From the
academic variable set, hours spent preparing for class was a significant predictor for three of the

138
benchmarks and GPA was significant for the other two benchmarks. From the social variable set,
participation in cocurricular activities was found to be a significant predictor for three of the five
benchmarks and exercise or physical fitness was found to be significant for the other two
benchmarks. Another interesting finding in stage one was that institution size was found to be a
significant predictor for three of the five benchmarks with an inverse relationship with each.
Stage two findings indicated that the number of hours spent participating in cocurricular
activities was the strongest predictor of LAC scores. For the ACL benchmark five predictor
variables were found to be statistically significant and included institution size (inverse
relationship), hours spent preparing for class; hours spent participating in cocurricular activities,
ethnicity, and age. For the SFI benchmark three predictor were found to be statistically
significant and included hours spent participating in cocurricular activities, institution size
(inverse relationship), and ethnicity. For the EEE benchmark three of the predictor variables
including exercised or participation in physical fitness activities, GPA and institution size
(inverse relationship) were found to be statistically significant. For the SCE benchmark two of
the predictor variables were found to be statistically significant and included the number of hours
per seven-day week spent preparing for class and exercised or participating in physical fitness
activities.

139
Table 30
Summary of Significant Predictor Variables of Nursing Student Engagement
STEP 1: PREDICTOR
SETS
NSSE BENCHMARK
LAC ACL SFI EEE SCE
DEMOGRAPHIC
age √ √
gender √
Ethnicity √ √
FGS √
Residence √ √ √ √ √
R2 2% 9.4% 1.9% 2.1% 3.1%
EXTERNAL
Work
Commute
Dependents
ACADEMIC
Hrs prepare class excluded √ √ √
GPA √ √
R2 1.4% 8.8% 2.5% 2.5% 3.4%
SOCIAL
Cocurric √ √ √ excluded
Fitness √ √
R2 3.8% 4.7% 6.6% 5.8% 3.0%
INSTITUTIONAL SIZE -√ -√ -√
R2 0.0% 9.2% 4.0% 1.6% 0.0%
STEP 2: SIGNIFICANT
ONLY
NSSE BENCHMARK
LAC ACL SFI EEE SCE
DEMOGRAPHIC
age √ .117
gender
Ethnicity √ .124 √ .120
FGS
Residence
ACADEMIC
Hrs prepare class excluded √ .216 √ .192
GPA √ .159
SOCIAL
Cocurric √ (.147) √ .168 √ .225 excluded
Fitness √ .251 √ .182
INSTITUTIONAL SIZE -√ -.263 -√ -.212 -√ -.152
R2 2.2% 20.3% 10.6% 10.4% 7.0%

140
Chapter Five: Discussion, Implications, Recommendations and Conclusion
This chapter presents a discussion of the findings in sections relative to the five sub-
research questions. Limitations of the study, implications and recommendations, and conclusions
are also discussed.
Discussion of Findings
The purpose of this descriptive, correlational study was to examine the extent to which
first-year nursing students are engaged in effective educational practices and determine any
relationships that may exist between nursing student demographic, external, academic, social and
institutional variables and student engagement. This study yielded several statistically significant
results. These results are discussed in the following sections respective to each research question
posed by the study.
Research Question One.
Research Question one addressed the descriptive profile of the first-year nursing students
at the 13 participating Ontario Universities in terms of demographic variables (age, gender,
ethnicity, first generation status and place of residence), external variables (number of hours
spent per week working off campus, commuting to class and caring for dependents), social
variables (number of hours spent per week participating in cocurricular activities and exercise or
participation in fitness activity) and academic variables (number of hours spent per week
preparing for class and self-reported GPA) and institutional variable (institution or university
size). According to Astin’s “input-environment-output” model, the demographic, external,
social, and academic variables represent the input measurements or the student characteristics for
first-year nursing students at the time of entry to the institution. The institutional characteristic of
size would be representative of the environment in Astin’s model. The interplay between the

141
inputs and environment (in this case, institutional characteristics) will determine the outcome,
whether or not the student engages in educationally purposeful activities.
Demographic variables. The average age of the first-year nursing students was 20.12
years, ranging from 17 to 45 years of age. These findings are consistent with studies in higher
education, which have found that the average age is between 18 to 23 years defines the
traditional student (Pascarella & Terenzini, 2005; Jeffreys, 2007; NSSE, 2008). Pascarella and
Terenzini (2005) described the traditional student as predominantly Caucasian undergraduates,
enrolled as full-time students in four-year institutions, live on campus, not employed and with
few family responsibilities. The traditional students are typically those that have recently
graduated from high school. A closer examination of Ontario university enrollments revealed
that with the elimination of the fifth year of secondary school in 2003, younger students (22
years or younger) dominate the first-year student population in universities (AUCC, 2007).
Contrary to this, nursing education literature indicated that the trend in enrolment of the older
students entering nursing is increasing (Jeffrey, 2007). This is further supported by the CIHI
Nursing Report (2010), which reported that the average age of entry into the nursing workforce
increased from 22.9 years (1980-1984) to 26.5 years (2005-2009). In other words, for a four-year
nursing program, the average age of a first-year student would have ranged from 18 to 22 years
old. The findings of this study also revealed that even though the average age was 20.12 years
representing most of the students in the sample, the nursing student population still consisted of
older students as well. Similarly the NSSE 2008 results reported that 43% of the students were
between 20-23 years of age representing the largest group, and 39% were 19 years old or
younger. Furthermore, Conway and Zhao (2012) reported that non-traditional age was associated
with generally positive coefficients except for campus support and student interaction. Overall,
age as a student characteristic, has shown wide variation in higher education.

142
The majority of the sample in this study consisted of female students (90.4%). Nursing
has been and remains a female dominant profession. Even though the number of males in nursing
has been increasing slowly, 93.8% of the Canadian RN workforce is female (CIHI, 2010), and
men remain an underrepresented minority. The findings of this study are consistent with gender
trends in the Canadian and global healthcare systems (CNA, 2009; Jeffrey, 2007; Popkess,
2010). Similarly, in a study examining academic engagement in nursing students, Salamonson et
al. (2009) found that 89% of the sample was female and only 11% were male. The proportion of
females in nursing is still quite high compared with the NSSE 2008 results which reported 63%
of the respondents as female (NSSE, 2008). Even though higher education literature also
revealed a greater proportion of female students (AUCC, 2007; Kinzie, et al., 2007; NSSE, 2008)
this may also be due to the fact that women are more likely than men to respond to surveys
(NSSE, 2008), as well as higher education enrolments trends reveal that more women have been
entering postsecondary education (AUCC, 2007).
The majority of the first-year nursing students who provided ethno-cultural information
identified themselves as Caucasian (80.5%) which is similar to the NSSE 2008 Canadian results
that also report a majority of Caucasian students in the sample (71%). However, the percentage
of Caucasian students in this study was higher than the NSSE 2008 results. The higher
percentage of Caucasian students in this study may be attributed to the academic program.
Popkess and McDaniel (2011) conducted a secondary analysis of the 2003 NSSE data to
examine the relationship between student inputs and college environment among baccalaureate
nursing students and non-nursing professions. Of the nursing students in this sample a total of
78.7% identified themselves as Caucasian. Not only is the higher proportion of Caucasian
students evident in Canadian higher education, but also in the nursing student population.
Nursing, being a profession that serves an ethno-culturally diverse population, needs to continue

143
efforts to recruit and retain unrepresented and minority students in order to meet the demands
and needs of the Canadian healthcare system.
Studies have shown that first-generation students differ from second-generation students
in demographic characteristics, personal experiences, educational preparation, degree aspirations,
and knowledge about post-secondary education enrollment and life (Pascarella & Terenzini,
2005). Only 22.9% of the first-year nursing student sample population in this study reported
having at least one parent who had completed undergraduate education representing the second-
generation students. In other words, most of the nursing students in this study were first-
generation students. In a synthesis of the literature, Pascarella and Terenzini (2005) noted that
second-generation students benefit from their parents’ ability to guide their thinking, planning,
and decisions that pertain to post-secondary education. In addition, families can provide the
support and encouragement that students need to persist in their studies (Tinto, 1993). Parental
education has also been found to be positively associated with higher levels of engagement (Hu
& Kuh, 2002). Conway et al. (2011) found that for first-year students in Ontario, parental
educational attainment was a significant student characteristic impacting all five NSSE
benchmarks. First-generation status was found consistently to be negatively correlated with the
outcome measures studied. Furthermore, students with parents who have some college education
are twice as likely as first-generation student to complete a bachelor’s degree, and students with
parents that hold a bachelor’s degree or higher are five times more likely to earn a bachelor’s
degree themselves (Pascarella & Terenzini, 2005). In this study 76.8% of all respondents were
first-generation students, with neither parent having completed an undergraduate degree. In
Ontario, first-generation students constitute between five and 30 percent of the university student
population (Conway & Zhao, 2012). The percentage of first-generation students is much higher
in this study compared to the literature. However, for the purpose of this study, students who had

144
parents with some college or university education but had not completed an undergraduate
degree were coded as first-generation. Therefore a larger portion is observed. Since parental
education is a pre-entry characteristic that influences the student’s ability to integrate into a new
environment, students with parents who have no post-secondary education may struggle because
they may not get the support and encouragement needed to persist in their studies (Tinto, 1993).
A total of 42.0% of the nursing students reported living on campus with 8.2% living
within a walking distance to campus, and 47.1% living within driving distance to campus. Living
on campus creates opportunities for students to interact with faculty and peers more frequently
which in turn contribute to social development. In other words, residence living indirectly
improves student success by enhancing their integration into the post-secondary environment
(Pike et al., 1997). On a similar note, in a synthesis of the literature, Pascarella and Terenzini
(2005) found consistent “evidence that students living on campus are more likely to persist and
graduate than students who commute” (p. 421). Conway et al. (2011) reported that commuter
students reported lower engagement levels than students who lived on-campus. Similarly,
Hughes and Pace (2003) reported that students who lived in campus residences were less likely
to withdraw from their studies than those who lived off-campus. Overall the literature is
consistent in that living on campus is associated with higher engagement levels and persistence.
External variables. The external variables in this study focused on ‘time usage’ of the
first-year nursing students. By examining how students spend their time provided some insight
into potential factors that may influence their time on task. In other words, one is able to examine
the time that these students spent being engaged in educationally purposeful activities. Some of
these additional demands on their time acted as a deterrent for the student as it kept the student
from being able to fully engage in purposeful activities. Approximately 42.4% of the students in
this study were working off-campus during their first-year of study. Working part-time or full-

145
time has been shown to be negatively associated with degree completion (Astin, 1993).
However, working part-time on campus rather than off campus is positively associated with
degree attainment and cognitive and affective growth (Astin, 1993). Similarly, Pascarella and
Terenzini (2005) report a consistency in the literature that when employment is limited in
duration and is on campus, it can enhance student persistence and degree attainment.
Interestingly the review of the literature also found that students who do not work are more likely
to withdraw and as likely to interrupt their studies than those students who worked during their
studies (Pascarella & Terenzini, 2005). Salamonson et al. (2009) examining academic
engagement in nursing students found that time spent in part-time work was a significant
predictor of academic performance. More specifically, 16 hours or more spent in paid work per
week was negatively associated with grades. In comparison, in this study 23.2% of the first-year
nursing students were working 11 to 20 hours per week. These students may be viewed as those
that are potentially at-risk for poor academic performance.
Most of the first-year nursing students (92.5%) spent time commuting to class.
Commuting to class is seen as having similar patterns as working full-time and part-time off
campus. Similarly, commuting is also negatively associated to degree attainment, “self-reported
growth in leadership ability and in interpersonal skills” (Astin, 1993, p. 391). Similarly, Conway
et al. (2011) reported that commuter students, short or long distance, have lower engagement
scores than those who lived on-campus. However, when examining nursing students across
Canada, both short and long distance commuter students had an overall positive engagement
profile relative to those that lived in campus residences, which was different from the other
academic programs examined (Conway & Zhao, 2012). One must also keep in mind when
examining nursing students is that this population spends on average 10 to 12 hours per week in
the clinical practicum setting to which they are assigned to. The clinical setting is usually a

146
hospital or long-term care facility to which students are expected to travel to and most of the
time it is early in the morning for a 7 am arrival. Hence the large proportion (92.5%) of nursing
students who reported commuting in this study can be expected. Of interest is the small
proportion of students who were not commuting. Could it be that the majority of the students
understood this question of commuting to campus to include the clinical placement setting? Or
perhaps the small number of students who indicated that they did not commute to campus is
inclusive of those who answered this question correctly and did not include their class time as
part of the hospital clinical setting?
Likewise, family responsibilities also influence nursing student academic success
(Jeffreys, 2012). About 39.6% of the students in this study spent time per week caring for
dependents. Having more family responsibilities and obligations may interfere with attendance,
study skills, academic performance, faculty and peer interactions, and retention (Jeffreys, 2012).
However, these caring activities may enhance academic success and minimize stress if they are
compatible with the student’s academic responsibilities (Jeffreys, 2012). Conversely, these
caring activities may be seen as a deterrent if the activities are incompatible with academic
responsibilities (Jeffreys, 2012). A decline in the student’s time spent studying may also be
explained by the fact that these students have more responsibilities in the home (McCormick,
2011). A closer future examination of this sub-population may reveal that those that are spending
time caring for dependents are potentially the non-traditional students with children or parents to
take care of. They may be representative of the sandwich generation with multiple roles and
responsibilities to fulfill that take away from time spent on academic activities.
Academic performance. The amount of time and effort a student spends preparing for
class has been found to be related to multiple academic outcomes measures such as retention,
graduating with honors, and pursuing graduate studies (Astin, 1993). Slightly over one-third of

147
the nursing students spent 10 or less hours per week, and another one-third of the students spent
11-20 hours per week preparing for class. The rule of thumb is that for every one hour spent in
class time, the student should be spending two hours studying (McCormick, 2011). As these
were full-time nursing students, the full-time course load should be approximately 15 credit
hours per week, which in turn means that these students should be studying for thirty hours per
week. The NSSE survey findings from the year 2000 to 2010 has repeatedly reported that
students fall short of this number and instead are spending one hour studying for each class time
hour (McCormick, 2011). More specifically, from the year 2009 to 2010, Canadian NSSE
results showed that students were spending an average of 14.3 hours per week preparing for class
(McCormick, 2011). Adhering to this rule, it seems as though that most of the nursing students
in this study were falling short of this standard in higher education. Only 20.8% of the students
reported spending 21-30 hours and 9.9% of the students reported spending more than 30 hours
per week preparing for class. On the other hand, it may also be said that the majority of the
nursing students were no different in the amount spent preparing for class compared with the
NSSE Canadian results for the participating universities.
A students’ grades make statistically significant and often the largest contribution to
student persistence and attainment (Pascarella & Terenzini, 2005). As stated by Kuh et al. (2006)
student engagement and grades go hand in hand. Carini et al. (2006) found that the level of
student engagement is positively related to GPA. Self-reported grades have been used as an
outcome measure in studies examining engagement at the student level in higher education
studies. Less than a quarter of the first-year nursing students reported a GPA in the A category,
with the majority (62.8%) of the self-reported grades in the B category. The higher self-reported
GPA in this study was expected as nursing programs have minimum GPA requirements in order
for students to successfully persist in the program. For most nursing programs in Ontario, the

148
minimum acceptable GPA in nursing courses is a C+. Hence only a small proportion (12.6%) of
the nursing students reported a GPA of C+ or less. The NSSE 2008 survey results for American
institutions revealed that approximately 40% of the first-year respondents reported earning “A”
grades and 5% earned a grade of “C” or less. Some distinct differences between this study and
the 2008 NSSE results are evident as fewer nursing students reported achieving a grade of “A”
and more students reported a grade of “C+” or less. However, the nursing students did respond
similarly to that of the NSSE 2008 results with more than half of the students with grades in the
“B” category. Conway et al. (2011) also reported for Canadian universities that high school and
current grades were strong engagement predictors for first-year students. Overall the NSSE
findings for academic performance indicate that women report higher grades than men;
Caucasian students generally report higher grades than students of other ethnic groups; grade
patterns vary by major fields; and that grades do not vary significantly by institutional type (Kuh
et al., 2006).
Social variables. The first social variable in this study was if the student exercised or
participated in physical fitness activities. More than three-quarters of the nursing students
identified themselves as participating in physical fitness during the school year. This item on the
NSSE survey does not address the exact type and intensity of the fitness activity that the student
engaged in, it only provides some indication of the student’s participation in such an activity or
not. However, it does indicate that these students were taking part in activities that have been
known to improve health (Adams et al., 2007; Astin, 1993; Chan, 2014; FitzGerald, 2015;
Hawker, 2012), academic performance and persistence (Hackett, 2007; Judge et al., 2014).
Interestingly only 11.6% of the nursing students reported never participating in physical fitness
exercise. A meta-analysis examining the benefits of exercise found that the non-participation
rates ranged from 36% to 50% in college students (Keating et al., 2005). Hence the

149
nonparticipation rate in this study was lower than in the literature and more nursing students
were engaged in physical fitness activities. One reason that the nursing students may be
participating might be embedded in the fact that the curriculum is health-based and the pros and
cons of exercise, stress, obesity, and other broad health issues are introduced early in the
program. The impact that the lack of exercise and proper nutrition has on the health status of a
client is repetitive in the theoretical underpinning of basic client care. These student behaviours
and activities can be influenced through the teaching practice in the classroom and clinical
setting, and create an environment that fosters student engagement. Especially in nursing,
repetition instills learning, and learning is applied in practice and lived reality every day!
The second social variable investigated in this study was cocurricular activities which
includes participation in organizations, campus publications, student government, fraternity or
sorority, and intercollegiate or intramural sports. Student involvement in college, such as
cocurricular activities, contributes to student persistence and promotes positive educational
outcomes (Astin, 1984; Tinto, 1993). Peer interactions, such as being a member of a fraternity or
sorority, foster a learning environment and opportunities to be more involved (Astin, 1993; Pike,
2000). Student involvement is positively related to student learning and intellectual development
(Astin, 1993; Pike, 2003; Pascarella & Terenzini, 2005). Approximately half (50.5%) of the
students in this study identified themselves as participating in cocurricular activities during the
school year. Cocurricular activities such as fraternities and sororities have been found to have
positive effects on academic performance during the first-year of college (DeBard & Sacks,
2010). On the other hand, in a dated study, Pascarella et al. (1996) found that Greek affiliation
(fraternities or sororities) had negative effects on students’ learning, intellectual development,
and academic performance on first-year students. These negative effects were found to diminish
in magnitude in the second and third year of study (Pascarella & Terenzini, 2005; Pascarella et

150
al. 2009). Overall, the literature examining the impact of Greek affiliation on student outcomes in
college have presented mixed findings. Similarly, being a member of an athletic team has
positive effects on physical health and degree attainment (Astin, 1993). Student engagement
studies have shown that athletes participate as often or more than their non-athlete peers in
effective educational practices (NSSE, 2005; Umbach et al., 2006). Even though student
involvement in cocurricular activities is linked with positive outcomes, 43% of first-year students
still spend no time on such activities (NSSE, 2005). Similarly, approximately half of the nursing
students in this study also spent no time participating in cocurricular activities. One reason why
the percentage of students is higher in this study is that nursing students spend half of their time
in a clinical placement setting which is usually a hospital and requires for the student to travel to
and from the site. Nursing students also may not be able to commit the time or be present for
cocurricular activities because of their academic schedules on and off the campus setting.
Institutional variable. University or institution size was the only institutional
characteristic that was examined in this study. Institution size has been shown to be inversely
related to student persistence and degree completion (Pascarella & Terenzini, 2005). The
majority of the students in this study were attending either a small (55.6%) or medium (28.0%)
sized institution. Only 16.4% of the first-year nursing students were attending large institutions.
In a Canadian analysis of the 2008 and 2009 NSSE survey results it was revealed that institution
size was a statistically significant predictor variable for LAC scores for nursing students
(Conway & Zhao, 2012). It was found that for larger institutions, nursing students had lower
LAC, ACL, SFI and SCE benchmark scores. But for the LAC benchmark, for larger institutions
the scores were higher. Overall the findings indicated that smaller universities showed mostly
positive correlations and larger universities showed predominantly negative correlations.
Research has shown that smaller institutions engage students more effectively hence the

151
engagement scores are higher (Conway et al., 2011; Kuh, 2003; NSSE, 2002). Engagement
scores decline for several benchmarks as the institutional size increases (Conway et al., 2011;
Kuh, 2003; NSSE, 2002).
Research Question Two.
Research Question two examined the distribution of the five NSSE benchmark scores for
first-year nursing students at the 13 participating Ontario universities. These benchmark scores
are “constructed as the average of the item scores” (Conway & Zhao, 2012, p.10). The mean
score for all five of the NSSE benchmarks was calculated at the student level, hence the scores
varied from 0 to 100 (Conway et al., 2011).
Level of Academic Challenge. The LAC benchmark measured how much the institution
emphasizes the importance of academic effort as well as the level of expectations for student
performance. The LAC benchmark mean score for the first-year nursing students in this study
was 55.67. This score was somewhat higher than the 2008 NSSE LAC mean score (M =51.2) for
the participating Ontario universities (Table 2). Similarly, Popkess and McDaniel (2011)
examining nursing and non-nursing major students also reported a student level mean LAC score
of 54.07 for first-year nursing students. They found differences on nine of the 11 LAC
benchmark items between nursing major students and other health and education major students.
In particular, the mean scores for nursing students were significantly higher on the following
items: course work emphasized synthesizing (p <.01), making judgements (p < .01), applying
theories or concepts (p < .01), and writing papers more than 20 pages in length (p < .001).
Popkess and McDaniel (2011) reported that nursing students spent significantly more time
studying (p < .001) and hours preparing for class (p < .01) than education majors. However, the

152
findings also revealed that other health majors spent significantly more time studying than
nursing major students.
Active and Collaborative Learning. The ACL benchmark measured how intensely
students are involved in their studies. The ACL benchmark mean score for the first-year nursing
students was 42.92. This score was higher than 2008 NSSE ACL mean score of 35.1 for all of
the participating Ontario Universities (Table 2). Popkess and McDaniel (2011) reported the mean
ACL score of 38.43 for first-year nursing students. However, as reported by Popkess and
McDaniel (2011) the mean ACL score for first-year nursing students was significantly lower
than education major students. Popkess and McDaniel also found that nursing students scored
significantly higher than other majors in only one of the seven ACL item, “participated in a
community-based project as part of a regular course” (p < .001). One may expect the nursing
students to score higher in this item as the curriculum includes community health and practicum
experiences in diverse settings. One potential reason why the score in this study may be higher
than the Ontario average is that nursing programs have a clinical component that begins in the
first-year of the program which may in turn engage a student in more ACL activities. On the
other hand, one must keep in mind that the nursing program examined in the Popkess and
McDaniel (2011) study was representative of an American curriculum which may be distinctly
different from the Ontario BNPs examined in this study. Another reason for this benchmark
score to be lower was presented by Popkess and McDaniel (2011). They stated that perhaps the
schools that participated in their NSSE survey did not utilize problem based learning with their
students in order to engage the student in and out of the classroom setting to work with their
peers. Instead these schools may have been utilizing the traditional lecture style approach to
teach. Hence the ACL score in their study was found to be lower for nursing students compared
to education major students. So why is the score higher in this study? The difference in the

153
nursing curriculum between the U.S. and Canada may be a potential reason, as perhaps the
Canadian schools of nursing may be inclusive of problem-based, group work, and case study
approaches as part of the instructional strategy, which are all items that contribute to the ACL
benchmark.
Student-Faculty Interaction. The SFI benchmark measured the quality and quantity of
the student and faculty interactions. The items focus on the number of interactions and the types
of discussions that students have with their faculty. The SFI benchmark mean score for the first-
year nursing students was 27.43. This score was higher than the reported mean score of 23.6 for
the 2008 NSSE mean score for the participating Ontario universities and lower than the SFI
mean score of 33.35 reported by Popkess and McDaniel (2011) for first-year nursing students.
The higher score in this study indicates that nursing students were interacting with faculty more
inside and outside of the classroom. This interaction between the students and faculty in the
nursing program may be a result of the smaller student-faculty ratios in the practicum setting,
allowing more opportunities for students interact, ask questions, and learn hands on from nursing
faculty. Popkess and McDaniel (2011) reported no significant differences for the SFI benchmark
scores between nursing and other disciplines.
Enriching Educational Experiences. The EEE benchmark measured the student
experience with respect to diversity, use of technology and other learning opportunities (such as
internships, and practical experiences). This benchmark measured the student involvement in
extra-academic activities. The EEE benchmark mean score for the first-year nursing students was
31.45. This score was higher than the reported mean score of 25.0 for the 2008 NSSE in Ontario
and lower than the EEE mean score of 43.34 reported by Popkess and McDaniel (2011) for first-
year nursing students in which no statistically significant differences between nursing other
disciplines was found. The higher score in the first-year nursing students may be evident in this

154
sample, as most nursing programs in Ontario have incorporated the use of simulation in the
laboratory setting in addition to the student going into the clinical area for practical experience.
This in turn may result in the students reporting higher scores as technology is integrated in their
learning and then reinforced in the hospital setting and vice versa. The incorporation of
simulation laboratories was also one of the methods that were implemented in Ontario to
“augment traditional methods of teaching practical skills” (CASN & CNA, 2007, p. 3) as an
innovative program design and delivery strategy aimed at increasing the number of graduates
from the educational system (CASN & CNA, 2007). Other innovative methods in nursing
education include fast track programs, distance education, continuing education, and
interdisciplinary programs (CASN & CNA, 2007; CASN & CNA, 2012). These “[i]nnovations
in nursing education …have allowed schools to increase the number of graduates without
altering…the program’s quality” (CASN, 2010, p.6). Innovative approaches in nursing education
introduce diversity in learning and experiences for these students, which in turn may also lead to
higher EEE scores for nursing students. NSSE (2000) states that as a result of these EEE related
activities, learning is deeper, more meaningful, and more useful for these students.
Supportive Campus Environment. The SCE measured institutional commitment to
student learning. In addition, the SCE benchmark also measures the quality of social relations
among different groups on campus. The SCE benchmark mean score for the first-year nursing
students in this study was 59.60. This score was higher than the reported mean score of 55.8 for
the 2008 NSSE in Ontario and slightly lower than the SCE mean score of 61.67 reported by
Popkess and McDaniel (2011) for first-year nursing students. The SCE score for first-year
nursing students in this study may be higher as majority of the students reported living on
campus or within walking distance of their university. This in turn created opportunities for
students to interact with other students and faculty more frequently contributing to social

155
development (Pike et al., 1997). Additionally, these students may report that they feel well-
supported by the institution or program area.
Are nursing students engaged in effective educational practices? The current research
literature suggests the five NSSE benchmarks are indicators of effective educational practices.
They reflect the current institutional or academic program practices as reported by the first-year
students (NSSE, 2000). These measures provide a baseline for measuring improvement and
stimulating quality discussions (for policy makers, accreditors) so that “administrators, faculty
members, and others can see how their students stack up against those at institutions with similar
missions and academic programs” (NSSE, 2000, p.7). Furthermore, these benchmarks of
effective educational practice frame and direct discussions about how to improve institutional or
program quality and student learning (NSSE, 2000). As shown in Table 31, the results of this
study indicated that first-year nursing students scored above the Ontario average benchmark
scores for all five of the NSSE metrics. Similarly, the first-year nursing students in this study
also scored above the NSSE 2008 average benchmark scores for all, except two benchmarks,
Student-Faculty Interaction and Supportive Campus Environment. According to NSSE (2000),
“…educationally effective colleges and universities score above average on all five benchmarks
in a manner that is consistent with their mission and students’ aspirations and educational goals”
(p.10). Since the students in this study scored above the provincial benchmark averages for 2008,
the nursing academic programs may be seen as engaging their first-year students in effective
educational practices across Ontario. However, this study did not address any institutional
differences that may have existed between the different academic nursing programs.

156
Table 31
A Comparison of First-Year NSSE 2008 Mean Benchmark Scale Scores
First Year
Ontarioa NSSE
2008a
Nursing
Students
Level of Academic Challenge (LAC) 51.2 52.5 55.67
Active and Collaborative Learning (ACL) 35.1 41.4 42.92
Student-Faculty Interaction (SFI) 23.6 32.6 27.43
Enriching Educational Experiences (EEE) 25.0 27.0 31.45
Supportive Campus Environment (SCE) 55.8 60.0 59.60
Note. Benchmark scale scores are calculated for each responding student by
converting question responses to a zero to one hundred point scale. a = McMaster University. (2008). Benchmark Comparisons. Retrieved from:
http://www.mcmaster.ca/avpira/documents/surveys/NSSE08%20Benchmark
%20Comparisons%20Report%20(McMaster).pdf
Research Question Three.
Research Question three examined any potential relationships between selected student
characteristics and the five NSSE scales for the sample of first-year nursing students. This
question was answered using a two-stage approach. The following sections discuss the findings
of stage two which identified the significant predictor variables for each benchmark.
Level of Academic Challenge. In the first regression analysis LAC was the response
variable. The LAC benchmark measured how much the institution emphasizes the importance of
academic effort as well as the level of expectations for student performance. The four predictor
variables identified in stage one to significantly impact LAC benchmark scores were age, place
of residence, self-reported GPA, and the number of hours spent participating in cocurricular
activities. In stage two of the regression analysis only one of the three variables was found to be
statistically significant. The analysis found that the number of hours per seven-day week spent
participating in cocurricular activities was statistically significant and accounted for 2.2% of the

157
variation in LAC scores. Cocurricular experiences have not only been known to shape student
development (Pascarella & Terenzini, 2005) but student involvement is known to impact student
academic performance (Kuh et al., 2008). The results of this study revealed that those students
who participated in cocurricular activities had higher LAC scores. This finding is consistent with
previous research that has shown that participation in cocurriculars has a positive relationship
with academic engagement (Zacherman & Foubert, 2014). They reported that academic
performance improved with up to 10 hours per week of involvement in cocurricular activities.
Participating in cocurricular activities provides opportunities for peer interactions that foster
learning (Astin, 1993) and for one to be more involved (Astin, 1993; Pike, 2000). Interestingly,
Fuller et al. (2011) reported that LAC scores were related to GPA. However, this relationship
between LAC scores and GPA was not seen in this study.
From a Canadian perspective, Conway and Zhao (2012) presented findings of the 2008
and 2009 NSSE report for Canadian institutions, in which 27 Nursing Programs across the nation
were included in the program level benchmark analysis. The benchmark scores were aggregated
to the program level in this analysis. The Level of Academic Challenge regression model for
Nursing found student (traditional age, male, French speaking, first generation, visible minority,
long distance commute, full-time enrolment status) and institutional characteristics (institution
size) to be statistically significant (p < .05) and accounting for nearly 90% of the variation in
LAC scores. Nursing programs that had a higher proportion of fulltime students were found to
have higher engagement in every LAC item. However, Conway and Zhao (2012) only included
senior students in the analysis while this study examined first-year nursing students only.
According to NSSE (2011), comparisons between first-year and senior students from the same
year are discouraged as they represent different educational contexts and engagement patterns
making the comparisons challenging. Nonetheless, the findings of Conway and Zhao (2012) add

158
to the discussion that LAC scores in first-year nursing students are associated with factors other
than those investigated in this study. Differences between the results of this study and Conway
and Zhao (2012) may be related to the sample size and potentially geographical as their sample
included all participating Universities across Canada.
Active and Collaborative Learning. In the second regression analysis, the response
variable was ACL. The ACL benchmark measured how intensely students are involved in their
studies. The six predictor variables identified in stage one to significantly impact the ACL
benchmark were age, place of residence, ethnicity, hours per seven-day week spent preparing for
class, hours per seven-day week spent participating in cocurricular activities and institution size.
In stage two five of the six predictor variables were found to be statistically significant. The first
significant predictor variable was institution size. The findings suggest that students at larger
institutions tend to have lower ACL scores and students at smaller institutions tend to have
higher ACL scores. A previous review of the literature revealed inconclusive results examining
the effect of institutional characteristics on student success (Pascarella & Terenzini, 2005).
However, more recent studies have shown that smaller institutions experience higher ACL scores
for first-year students (Kuh et al., 2006; Conway et al., 2011). The finding in this study is
consistent with current research examining institution size and engagement. One reason for this
finding may be that smaller institutions have smaller class sizes and student-faculty ratios which
allow students an opportunity to be engaged and integrate to the institutional environment (Kuh
et al. 2006). On the other hand, Kuh et al. (2007b) note that some larger institutions are more
engaging than smaller institutions. Hence one needs to probe deeper when examining student
engagement because institutions vary in the type and size and may not all be comparable (Kuh et
al., 2007b).

159
The second significant predictor variable was the number of hours per seven-day week
spent preparing for class. The findings suggest that students who spend more time preparing for
class have higher ACL scores. Students who engage in academic activities such as attending
class, studying, or working on assignments will succeed and persist in higher education (Astin,
1993). This notion is also supported by Dietsche (1989) and his findings which revealed that the
amount of time spent by the student in academic activities contributed significantly to persistence
in the college setting. Furthermore, the amount of time spent studying for class is also related to
academic outcomes such as grades. Kuh et al (2007b) reported that students who spent more time
studying per week tend to have higher grades. The findings of nursing students are consistent
with the literature. As these students studied more, their intensity of involvement in their studies
also increased. Overall, it is the quality of effort (Pace, 1984) by the student and their
involvement (Astin, 1984) that will determine successful outcomes.
The third significant predictor variable was the number of hours per seven-day week
spent participating in cocurricular activities. The findings of this study suggest that first-year
nursing students who participated in cocurricular activities tend to have higher ACL scores. In
other words, those that participated in cocurricular activities were more intensely involved in
their studies. Even though cocurricular activity has been shown to impact academic performance
(Kuh et al., 2008; Zacherman & Foubert, 2014), the caveat lies in the number of hours spent per
week. According to Zacherman and Foubert (2014), up to 10 hours per week of cocurricular
activity, academic performance shows improvement. However more than 30 hours per week
revealed declining grades. Other researchers have found that student participation in more than 5
hours per week in cocurriculars resulted in a lower GPA (Kuh et al., 2008). Cocurricular
activities also include student organizations such as fraternities or sororities. Research has
presented mixed findings when examining fraternities. Some research has shown that student
160
involvement in fraternities leads to a lower GPA (Astin, 1993; Pascarella et al., 1996; Pascarella
& Terenzini, 2005), while other studies have found a positive relationship (DeBard & Sacks,
2010; Kuh et al., 2008; Zacherman & Foubert, 2014).
The fourth significant predictor variable was ethnicity. The findings suggest that in this
study students from other ethnic groups tend to have higher ACL scores. This finding is
interesting because the sample of first-year nursing students was predominantly Caucasian
students (80.5%) and only 19.1% (n=56) identified themselves as representative of other ethnic
groups. The higher ACL scores were evident in students of other ethnic groups. Even though
students from different backgrounds engage in educational practices at comparable levels (Kuh
et al., 2006) some exceptions have been noted. According to Kuh et al. (2008) involvement in
educationally effective activities benefits all students, but the effects are greater for students of
other ethnic groups. They found that African American students benefited more than Caucasian
students from increasing their engagement in educationally effective activities. Furthermore the
findings revealed that for Hispanic students, for every one standard deviation increase in the
involvement in educationally effective activities resulted in a .11 increase in first-year GPA,
which was higher than the gain by Caucasian students. Moreover, African Americans reported
higher ACL activities than their peers (Kuh et al., 2006). In this study similar results were noted
in that students of other ethnic groups were found to have statistically significant higher ACL
scores than their Caucasian peers indicating that first-year nursing students of other ethnic groups
were more intensely involved in their studies. On the other hand, a peer group influence may be a
force at play. According to Astin (1993) “peer group is the single most potent source of influence
on growth and development during the undergraduate years” (p. 398). One may speculate that
students of other ethnic groups may have formed peer groups and worked collaboratively and in
turn reported higher ACL activity. The literature also indicated that attrition has been reported to

161
be higher in nursing students of other ethnic groups (Hines, 2002; Leroy, 2008). Overall
enrollment trends in nursing education suggest a steady increase in students of other ethnic
groups, and this trend is expected to continue to persist (Jeffreys, 2012).
The fifth significant predictor variable was age. The findings suggest that the non-
traditional or older students tend to have higher ACL scores. Older students tend to have better
study habits, more goal-directed, and tend to have higher grades than the traditional younger
student (Jeffreys, 2012). These students have more family responsibilities, work, and commute to
school as well. As they have more role responsibilities these extra activities may impact their
retention in the higher education setting (Jeffreys, 2012). On the other hand, these
responsibilities also act as a catalyst for these students to achieve as long as education attainment
and goal achievement are aligned. However, some studies have also reported that older students
are at higher risk of attrition because of their additional responsibilities (Jeffreys, 2007; Pence,
2011). Conversely, Beeson and Kissling (2001) found that older students who were successful in
their nursing programs had higher pass rates on the national licensure examination. The older
non-traditional student has been found to be more likely to be successful (Salamonson &
Andrew, 2006) and to be more engaged in educationally purposeful activities compared with the
traditional student (Gibson & Slate, 2010). Conway et al. (2011) found that the older students
had higher levels of engagement for the ACL benchmark. The finding of this research study was
consistent with the literature in that the first-year nursing students were also found to exhibit
higher intensity of involvement in their studies.
Student-Faculty Interaction. In the third regression analysis Student-Faculty Interaction
was the response variable. The SFI benchmark measures the quality and quantity of the student
and faculty interactions. The items focus on the number of interactions and the types of
discussions that students have with their faculty. The five predictor variables identified in stage

162
one to significantly impact SFI scores were place of residence, ethnicity, hours per seven-day
week spent preparing for class, hours per seven-day week spent participating in cocurricular
activities, and institution size. In stage two three predictor variables were found to be statistically
significant. The first significant predictor variable was the number of hours per seven-day week
spent participating in cocurricular activities. Literature examining the effects of Greek affiliation
(fraternity or sorority) on student outcomes presents mixed results. Some researchers suggest
that fraternity and sorority affiliation has positive effects on various measures of academic
performance during the first-year of college (DeBard & Sacks, 2010). Greek affiliation has been
shown to have a weak positive relationship with engagement and gains in learning (Pike, 2003).
Students with Greek affiliation report significantly higher levels of social involvement and gains
than non-Greek students (Pike, 2000); and are more involved and engaged in their educational
experience (Astin, 1984). Similarly, the results of this study suggest that students who
participated in cocurricular activities had an average SFI score that was 30.2 units higher than
non-members. As posited by Astin’s theory of involvement, students who are affiliated to a
fraternity or sorority should report greater learning outcomes as a result of their greater
involvement.
The second significant predictor variable was Institution size. Conway et al. (2011)
reported that smaller institutions have higher engagement scores for the first-year SFI
benchmark. The findings of this study also suggest that first-year nursing students at smaller
institutions tend to have higher SFI scores. The higher SFI scores may be seen as smaller
institutions may be geographically isolated; have smaller class sizes and student-faculty ratios;
and more opportunities for students to engage in dialogue amongst themselves and faculty (Kuh
et al., 2006). The findings of this study are also consistent with other research in higher education

163
examining institutional characteristics. Similarly, American institutions also report a decline in
engagement for several benchmarks as institutional size increases (Kuh, 2003; NSSE, 2002).
The third significant predictor variable was ethnicity. The findings revealed that students
of other ethnic groups tend to have higher SFI scores compared with Caucasian students.
Research has shown that students from diverse backgrounds engaged at similar and comparable
levels (Kuh et al., 2006; Kuh et al., 2008) but note some exceptions to this. Even though all
students, regardless of their ethnic background, engage in educationally effective practice the
same, the benefits are greater for students of other ethnic groups (Kuh et al., 2006). One potential
reason for the higher score for these students may be that they discussed their grades, course
content, or received feedback on academic performance from their faculty member more so than
their Caucasian peers. Nursing students have scored higher on the SFI benchmark (Popkess &
McDaniel, 2011) compared with the mean SFI score. Yet studies have reported that attrition is
also higher amongst nursing students of other ethnic groups (Hines, 2002; Leroy, 2008).
However, the higher SFI score in this study indicated that these first-year nursing students were
interacting with faculty members more in and outside of the classroom environment.
Even though this study only found only two student characteristics to be statistically
significant for first-year students, Conway and Zhao (2012) found that student characteristics
explained a higher proportion of SFI variation in senior students in Nursing Programs in
comparison with other program areas. Traditional age (negative relationship) and male gender
(positive relationship) were strong predictors of the SFI scores (Conway & Zhao, 2012).
Educational Enriching Experiences. The EEE benchmark measures the student
experience with respect to diversity, use of technology and other learning opportunities (such as
internships, practicum, etc.). This benchmark measures the student involvement in extra-

164
academic activities. The complementary learning opportunities, inside and outside of the
classroom, augment the academic program. “…[T]he most important is exposure to diversity,
from which students learn valuable things about themselves and gain an appreciation for other
cultures and ways of living” (NSSE, 2000, p.10). The five predictor variables identified in stage
one to significantly impact EEE scores were place of residence, first generation status, self-
reported GPA, exercised or participated in physical fitness activities, and institution size. In stage
two only three of the predictor variables were found to be statistically significant. The first
significant variable was exercise or participation in physical fitness activities. The findings of
this study suggest that those students who exercised or participated more in fitness activities had
higher EEE scores. Similarly Conway et al. (2011) found that EEE scores were the highest
amongst the health sciences discipline for the first and senior year students. Studies have shown
that participating in exercise or fitness activities has been found to have health benefits such as
the reduction of stress and weight gain (Chan, 2014; FitzGerald, 2015; Hawker, 2012), and
improve mental well-being (Hawker, 2012). Since the EEE benchmark measures the student’s
experience with diversity and interaction with other students, participating in fitness activities
also creates opportunities for students to interact and develop a sense of belonging (Buccholz,
1993). As nursing students are exposed to a learning environment with on-going assessment that
creates high stress levels (Gibbons et al., 2007) compared with other professions, participation in
exercise is one stress reduction strategy identified in the literature. The higher EEE scores may
be an indication that those students who were exercising were also taking part in other diversity
experiences inside and outside of the classroom. “As a result, learning is deeper, more
meaningful, and ultimately more useful because what students know becomes part of who they
are” (NSSE, 2000, p.10).

165
The second significant predictor variable was self-reported GPA. The findings of this
study suggest that first-year nursing students who had higher grades tended to have higher EEE
scores. In fact, studies have shown that engagement and grades go hand-in-hand. As reported in
the literature, GPA is positively related to all of the effective educational practices measured by
NSSE (Carini et al., 2006; Kuh et al., 2006). Similarly, Conway et al. (2011) reported for
Canadian universities that current grades were strong engagement predictors for first-year
students. A students’ grades make statistically significant and often the largest contribution to
student persistence and attainment (Pascarella & Terenzini, 2005). Popkess (2010) had an
interesting finding that nursing students who reported a ‘C’ GPA had higher engagement levels.
One may assume that in an effort to improve their grades and progress in the nursing program,
these students may have increased their engagement levels. Student GPA has been found to be a
strong engagement predictor for first-year students (Carini et al., 2006; Kuh et al., 2006; Kuh et
al., 2007b; Conway et al., 2011) but the effects of student engagement on GPA are modest
(Fuller et al., 2011).
The third significant predictor variable was Institution size. The results suggest that
nursing students at smaller institutions tend to have higher EEE scores. The findings of this study
are consistent with current research that has examined institutions and engagement. As reported
by Conway et al. (2011) and Kuh et al. (2006) students at smaller institutions report higher
engagement levels. Higher EEE scores may be reported by students at smaller institutions as they
have more opportunities to engage in cocurricular activities, use electronic medium for course
related work, and participate in a learning community and the opportunity to have conversations
with students of diverse backgrounds. Even though these opportunities also exist in larger

166
institutions, being at a smaller institution fosters an educationally enriched experience as the
class sizes and student-faculty ratios may be smaller (Kuh et al., 2006, p.53).
Supportive Campus Environment. The SCE measures institutional commitment to
student learning. In addition, the SCE benchmark also measures the quality of social relations
among different groups on campus. The four predictor variables identified in stage one to
significantly impact the SCE benchmark were gender, place of residence; hours per seven-day
week spent preparing for class, and exercised or participated in physical fitness activities. In
stage two of the analysis two predictor variables were found to be statistically significant. The
first predictor variable was the number of hours per seven-day week spent preparing for class.
The findings suggest that students who spent more time preparing for class had higher SCE
scores. Time spent preparing for class has been shown to be related to multiple outcome
measures (Astin, 1993). As most of the first-year nursing students reported living on campus or
within walking distance of campus, the closer proximity to campus resources, peers, and faculty
create opportunities for these students to interact more frequently and in turn integrate into the
college environment (Pike et al., 1997). Interestingly, in a Canadian study by Conway et al.
(2011) found that a small university size was a significant predictor that showed a positive effect
on SCE scores for nursing students. A relationship as such between institution size and SCE was
not seen in this study rather hours spent preparing for class emerged as significant in this study.
The second variable was participation in exercise or physical fitness activities. The
findings suggested that students who participated more in exercise or physical fitness activities
had higher SCE scores. Since nursing students experience higher stress levels compared with
other professionals (Gibbons et al., 2007; Hallin & Danielson, 2007), exercise or physical fitness
activities have been reported to be effective in stress reduction (Chan, 2014; FitzGerald, 2015;
Hawker, 2012). One potential reason for the higher SCE scores may be that these first-year

167
nursing students are involved in the physical fitness activity on campus, and perhaps even using
the campus recreational facilities. In such cases the students would be interacting and socializing
with their peers in an out-of-class setting. For the SCE benchmark, Conway and Zhao (2012)
reported that for senior students in nursing programs, small university size had a positive effect
on SCE scores, whereas being an international student had a negative association with SCE
scores. The SCE benchmark was also driven disproportionately by the quality of student and
faculty relationships.
Research Question Four.
Research Question four examined any potential relationships between the five NSSE
scales and institution size. In examining the relationship between Institution size and the five
NSSE benchmarks, three of the five benchmarks were found to be statistically significant. In the
first relationship between Institution size and Active and Collaborative Learning (ACL) scores,
the results indicated that students at larger institutions tend to have lower ACL scores. In the
second relationship between Institution size and Student-Faculty Interaction (SFI), the results
indicated that first-year nursing students at larger institutions tend to have lower SFI scores. In
the third relationship between Institution size and Enriching Educational Environment (EEE), the
results showed that students at larger institutions tend to have lower EEE scores. These
statistically significant finding are similar to the results in Research question three, in that three
of these NSSE benchmarks were also found to have an inverse relationship with Institution size.
The findings of this study are consistent with the literature examining institutional
characteristics. Likewise, recent studies examining relationships between Institution size and
NSSE benchmarks have shown that smaller institutions experience higher average scores for
first-year SCE, ACL and SFI benchmarks compared to larger institutions (Kuh et al., 2006;

168
Conway et al., 2011). Similarly Kezar (2006) reviewed the results from an in-depth multisite
study of 20 institutions to examine approaches to student engagement exploring the differences
by institutional type. Four of the five NSSE benchmarks (LAC, ACL, SFI, and SCE) were found
to be related to institution size. Size appeared to have the most significant impact on Student-
Faculty Interaction. However, a disparity between the findings of this study and the literature
exists with the EEE benchmark in that Conway et al. (2011) found that EEE scores were
insensitive to institutional size whereas this study found an inverse relationship between EEE
scores and institution size.
The results in this study found that EEE scores were related to Institution size. Conway et
al. (2011) reported that for Canadian Universities, the EEE and LAC benchmarks were
insensitive to Institutional size for first-year students. The reason behind this disparity may be
rooted in the nursing program curriculum. Nursing students spend at least two-fifths of their time
practicing “hands-on” in the clinical practice setting. This experience not only enhances their
theoretical knowledge attained but also engages the student in inquiry-based thinking. As part of
their first-year nursing curriculum, most programs focus on building relationships with clients of
diverse backgrounds and needs, communicating with multidisciplinary team members, collecting
client data (interviews, charts, and electronic charts), and learning to work and function as a
student team or cohort. These first-year nursing program objectives and outcomes included most
of the items that contribute towards the creation of the EEE benchmark score. Hence for nursing
students a program level difference may be seen.
Overall, as institution size increases, engagement for several NSSE benchmarks tend to
decline (Kuh, 2003; NSSE, 2002). Research indicates those institutions that are large and
impersonal or those that have passive learning environments are less likely to initiate a learning
environment (Astin, 1993; Chickering & Gamson, 1987). To create a learning environment,

169
student engagement is critical (Astin, 1993; Kezar, 2006). The literature presented several
reasons why smaller institutions would have higher scores. First, smaller institutions may be
geographically isolated so students would have more opportunities to engage in dialogue
amongst themselves and with faculty. Second, smaller institutions have smaller class sizes and
hence lower student-faculty ratios providing more opportunities for interaction (Kuh et al.,
2006).
Research Question Five.
Research Question five examined the relationship between student and institutional
characteristics, and academic performance for the first-year nursing students at the 13
participating Ontario universities. The regression analyses for question five resulted in two
statistically significant predictor variables, being a first generation student and age, with
academic performance as the response variable. Together they accounted for 6.2% of the
variation in first-year nursing student grades. Being a first generation student was the strongest
predictor of academic performance. The results of this study suggest that first generation students
tend to have a lower GPA. Studies have shown that these students experience some level of
disadvantage as they have no one to guide their educational planning, a role model, or someone
the share the experiences and expectations associated with higher education (Pascarella &
Terenzini, 2005). The first generation student is not privy to the importance that is placed on
taking part in educational activities that may actually benefit the student in the successful
integration to the college environment (Pike & Kuh, 2005) and in turn their success
academically. Nursing programs are not immune to the issues faced by other disciplines or to
simply some of the trends seen in higher education. As more and more first generation students
are entering higher education, this trend is also evident in nursing programs (Jeffreys, 2012).

170
Nursing programs in the U.S are noting an increase in the first generation student population
especially among those groups that have been traditionally underrepresented. Typically the
attrition rate is the highest in the first year of the nursing program (Jeffreys, 2012). In Canadian
nursing schools, students tend to leave mainly in the first two years of study (Day et al., 2004).
Hence being a first generation and a first year nursing student, places this group of students at
greater risk of attrition. In light of the literature, it can be seen that the first generation student
must overcome challenges and potential obstacles in addition to their full-time program course
load. But when family expectations are in conflict with the student’s expectations, this diverging
goal may affect the student’s academic performance (Jeffreys, 2012).
The second statistically significant predictor of academic performance was age. The
results of this study suggested that grades tend to be slightly higher for older students. Similarly,
Gibson and Slate (2010) found that non-traditional students (ages 25 years and above) engage
more in educationally purposeful activities than traditional students (younger students). These
findings are also consistent with nursing education literature in which the older students have
been found to have higher grades than the traditional student (Jeffreys, 2013). Furthermore, as
the non-traditional student has also been linked with additional role responsibilities, they have
better time management and study habits, higher motivation, and are more self-directed (Jeffreys,
2012), hence they may be more apt to persist in their studies and succeed. Older or mature
students have a higher level of academic integration consistent with those that are more certain of
their goals, committed and work harder (Dietsche, 1989).
Other predictor relationships with GPA have been noted in the literature. Interestingly,
Haas et al. (2004) found that ethnicity also plays a critical role in identifying nursing student
success rates. They reported that students of other ethnic groups had higher failure rates on the
national nursing exam compared to Caucasian students. Some studies have reported positive

171
correlations with physical activity and academic performance (Hackett, 2007; Judge et al., 2014).
Overall student inputs including demographic characteristics, pre-college experiences, and prior
academic achievement have been found to account for 29% of the variance in first-year GPA,
with prior academic achievement having the strongest influence on GPA (Kuh et al., 2008).
However from the pool of predictors examined in this study only two variables (first-generation
status and age) were found to explain a small amount of variation in academic performance.
Implications and Recommendations
While this study was specific to 13 selected Baccalaureate Nursing Programs in Ontario
universities, there are also implications that may be of interest to other nursing programs across
Canada. Findings of this study are relevant for faculty and nursing administrators involved in
program admission decisions, and for those who are in positions to identify and assist at-risk
students. This study examined student and institutional characteristics that are related to
engagement behaviours and in turn academic success and persistence. The findings of this study
can be used as benchmarking or profiling first-year nursing students and to provide an
understanding of some of the drivers of engagement. As reported by CASN (2015), Canadian
students had lower pass rates in comparison with their American counterparts on the NCLEX-
RN. A closer examination of the predictors of success and engagement are warranted as
Canadian schools of nursing have no standardized reliable benchmarks that measure nursing
student success and engagement in today’s changing environment. In understanding these
drivers, in the Canadian context, one can then focus on interventions and strategies to improve
academic success of these nursing students and in turn increase graduation rates to have more
nurses enter the workforce.

172
For future research there are a number of different options that can be examined. First of
all, all BNPs need to be included in the sample. This would allow for a holistic view of the first-
year nursing student population across Ontario. Furthermore, as a quality assurance measure, this
would allow for comparisons between BNPs provincially and nationally. However, this can only
be possible if there was a survey that would allow one to capture students in both the college and
university sectors. Just as other student engagement surveys have been customized for certain
program areas or countries (such as the Law Survey of Student Engagement and Australasian
Survey of Student Engagement), a customized survey needs to be developed that would meet the
needs of nursing programs in Canada. For example, the Australian version has questions that
pertain to active and work integrated learning that would provide valuable information related to
nursing students and the clinical placement setting. This proposed customized survey to examine
student engagement in the Canadian context can be created using existing, valid and reliable
items from other leading surveys that examine engagement behaviours. In addition, as the NSSE
does not capture the engagement of students in the clinical practicum area, a Canadian survey
would be inclusive of this experience. Another reason to consider a revised engagement survey
for nursing is that the using the current NSSE survey as a measure of engagement also presents a
caveat, as not all of the measures may be relevant for a particular institution (Gordon et al., 2008)
or program area. Furthermore, a survey customized to the Canadian context of higher education
is needed, as the NSSE items tend to be representative of American context.
For a larger scale trial by adding other BNPs in the sample would not only increase the
sample size but the power in the study. The increase in the sample size would also contribute to
the reliability and generalizability of the findings. Another benefit of adding other BNPs is that
one can examine the sample at provincial and national levels. Future surveys should also be

173
inclusive of additional variables to assess academic performance (high school grades, actual
course or term GPA, and nursing licensure examination results) and institutional characteristics
(sector, mission, geography, student-faculty ratio, to name a few). Canadian nursing literature
revealed that nursing programs have a high attrition rate within the first two years of the
program. This is a crucial factor to consider, along with the fact that the complex courses usually
start in the second year of the nursing program. NSSE only captures the first and senior year
nursing students. During the first year of the nursing program, students are only being exposed to
introductory courses. The hard-core medical surgical courses and concepts are usually in the
second year of the program. So, the question arises: “Do engagement levels increase or decrease
in second year nursing students as the level of difficulty increases?” and “Does the number of
hours spent in academic activities change between first and second year students?” A customized
nursing student engagement survey would be able to assess students at different levels of the
program and capture not only the direct and indirect effects of the institution and its environment
but would also include aspects of the clinical setting, a place where students spend almost half of
their time during each semester training.
As a postpositivist researcher, the first-step in examining nursing student engagement in
this study utilized a stepwise regression approach to examine correlations between the predictor
and criterion variables. Even though this approach results in the most parsimonious model, the
results of this study would need to be cross-validated with a second sample (Tabachnick &
Fidell, 2013). Once again a larger scale trial would be recommended. Furthermore, the use of a
triangulated method inclusive of qualitative strategies (observations and group sessions) would
need to be incorporated into the design of the study as this would allow myself as the
postpositivist researcher to explore and understand the concept of engagement from the

174
perspective of the student and would provide the ability to compare and validate the findings of
the study.
As institutions continue to use the NSSE, the survey results should be shared with faculty
at the departmental level so that they are able to see which areas their students are reporting as
challenging and others that they are doing well. This in turn will allow faculty to delve into and
utilize new strategies and practices in the classroom and clinical setting and have a better
understanding of students in the nursing program. Furthermore, using focus groups, faculty
members would be able to share best practices and challenges with first-year nursing students.
I did not find any standardized questionnaire at this point in time to conduct student,
faculty and/or program evaluations that are currently used by nursing programs in Ontario.
Nursing programs need to standardize academic assessment and allow self-reports of student
learning and engagement. The responses would not only allow individual nursing programs to
assess themselves but in turn it will create an accountability measure, that may be utilized by the
Canadian Schools of Nursing (CASN) in the accreditation process across Canada. The CASN
Accreditation Standards Framework has four overarching quality dimensions which include
relevance, accountability, relatedness, and uniqueness (CASN, 2014). Also, given the recent shift
in the nursing postsecondary environment, with the introduction of a new national examination
in January 2015, a standardized measure may be seen as one source of evidence “to develop
data-driven plans to improve educational experiences for students at all levels” (Banta et al.,
2009, p. 33) nationally. Benchmarking will provide a consistent method of collecting and
reporting data that would enable comparisons of different programs. Since the four purposes of
NSSE include accreditation, accountability, strategic planning and program assessment (Banta et
al., 2009), a customized survey of Canadian nursing student engagement would provide CASN a
quantitative measure to assess nursing programs across Canada; a measure that would be

175
generated by the user of the academic program - the student! The customized survey would also
establish “realistic and academically sound benchmarks” (Robertson et al., 2010, p. 100) for
nursing education in Canada.
This study has identified several significant predictors of student engagement for first-
year nursing students in Ontario. At the institutional level, universities need to incorporate
practices and interventions in order to increase NSSE benchmark scores as indicators of effective
educational practice. Year-to-year comparisons can also be used as indicators of success or to
identify areas of improvement. For example, in large institutions, intentional efforts need to be
made to promote student participation in cocurricular activities as it was found to be impacting
three of the five benchmarks. Overall the significant predictors in this study have accounted for
50.5% of the variance in student engagement scores for first-year nursing students (Table 30).
However, a large proportion of this variance remains unaccounted for and clearly student
engagement is associated with other factors than those investigated in this study. This study has
taken the first step in examining engagement in the nursing student population, but BNPs and
educational leaders in post-secondary institutions need to take the next step in implementing and
incorporating practices that have been found to positively impact student engagement.
Conclusion
This study examined and described nursing student characteristics that are associated
with student engagement, as measured by the National Survey of Student Engagement (NSSE)
benchmark scores. These benchmark scores have been used as indicators of effective educational
practices by institutions across Canada and the U.S. The first-year nursing student NSSE
benchmark scores were above the 2008 Ontario average scores indicating that nursing students in
Ontario are engaged in effective educational practices. Student engagement was studied to

176
examine any relationships with student and institutional characteristics, and academic
performance. Several statistically significant relationships were found between nursing student
characteristics, academic performance, institutional characteristics and the engagement
benchmark scores.
The number of hours spent participating in cocurricular activities emerged as the
strongest predictor of LAC scores. For the ACL benchmark five predictor variables were found
to be statistically significant including institution size, the number of hours per seven-day week
spent preparing for class, the number of hours per seven-day week spent participating in
cocurricular activities, ethnicity, and age were all statistically significant predictors of ACL
scores. For the SFI benchmark three statistically significant predictors emerged including the
number of hours per seven-day week spent participating in cocurricular activities, institution
size, and ethnicity. For the EEE benchmark three of the predictor variables were significant
including exercise or participation in physical fitness activities, GPA and institution size. For the
SCE benchmark two of the predictor variables emerged as statistically significant including the
number of hours per seven-day week spent preparing for class and exercise or participating in
physical fitness activities.
In summary, the findings of this study have added to the robust data that already exists in
the realm of student engagement but takes a closer look at the nursing student population in the
Canadian context. Since this study can only speak to the 2008 NSSE data sample of the 13
selected BNPs in Ontario, findings cannot be generalized beyond these institutions. However,
they will be of interest to other nursing programs that struggle with similar challenges. Several
relationships between engagement and study variables were identified that accounted for the
variation in engagement scores. However, a large portion of the variation in student engagement
scores still remains to be explained by factors that are yet to be discovered and not examined in

177
this study. This study provides a glimpse of the nursing student characteristics that are associated
with engagement behaviours, and identifies possible relationships that may exist between
variables. Finally, this study sets the stage to open the dialogue between schools of nursing,
policy makers, and nursing governing bodies to institute further research in this area to increase
graduation rates so that current and future workforce demands may be met.

178
References
Abbott, A., Schwartz, M., Hercinger, M., Miller, C., & Foyt, M. (2008). Predictors of success on
National Council Licensure Examination for registered nurses for accelerated
baccalaureate nursing graduates. Nurse Educator, 33(1), pp. 5-6.
Adams, T., Moore, M., & Dye, J. (2007). The relationship between physical activity and mental
health in national sample of college females. Women Health, 45(1), p. 69-85.
Alameida, M., Davis, H., & Renwanz-Boyle, A. (2011). Predicting NCLEX-RN success in a
diverse student population. Journal of Nursing Education, 50(5), pp. 261-267.
Anaya, G. (1999). Accuracy of self-reported test scores. College and University, 75(2), pp. 13-
19.
Association of Canadian Community Colleges. (2007). Pan-Canadian Study of First Year
College Students: Report 1 Student characteristics and the college experience. Retrieved
from: http://www.accc.ca/wp-
content/uploads/archive/pubs/studies/200708StudentStudy.pdf
Association of Universities and Colleges of Canada. (2007). Trends in higher education: Volume
1 – Enrolment. Retrieved from: www.aucc.ca
Astin, A .W. (1984). Student Involvement: A Developmental Theory for Higher Education.
Journal of College Student Development. 25, pp. 297–308.
Astin, A. (1993). What matters in college? Four Critical years revisited. San Francisco: Jossey-
Bass.
Astin, A. (1999). Student involvement: A developmental theory for higher education. Journal of
College Student Development, 40(5), p. 518-529.
Arathuzik, D., & Aber, C. (1998). Factors associated with National Council Licensure
exam registered nurse success. Journal of Professional Nursing, 14(2), p. 119-126.
Bean, J. (2005). A conceptual model of college student engagement. Paper presented at the
Association for the Study of Higher Education, Philadelphia, PA.
Beers, G. & Bowden, S. (2005). The effect of teaching method on long term knowledge
retention. Journal of Nursing Education, 44(11), p. 511-514.
Beeson, V.J., & Kissling, G. (2001). Predicting success for baccalaureate graduates on the
NCLEX-RN. Journal of Professional Nursing, 17, 121-127.
Berger, J. & Milem, J. (1999). The role of student involvement and perceptions of integration in
a casual model of student persistence. Research in Higher Education, 40(6), p. 641-662.
Berg, C. L., & Lindseth, G. (2004). Students' perspectives of effective and ineffective

179
nursing instructors. Journal of nursing education, 43(12), 565-568.
Bowen, S. (2005). Engaged Learning: Are we all on the same page? Peer Review, 7(2), p. 4-8.
Brace, N., Kemp, R. & Snelgar, R. (2003). SPSS for psychologists: A guide to data analysis
using SPSS for windows. Psychology Press.
Bridges, B., Cambridge, B., Kuh, G., & Leegwater, L. (2005). Student engagement at minority
serving institutions: Emerging lessons from the BEAMS project. In G. H. Gaither (Ed.),
What works: Achieving success in minority retention. New Directions for Institutional
Research. San Francisco: Jossey-Bass.
Bruce, M., Omne-Ponten, M. & Gustavsson, P. (2010). Active emotional engagement: A
nationwide, prospective, longitudinal study of Swedish nursing students. International
Journal of Nursing Education Scholarship, 7(1), p. 1-18. doi: 10.2202/1548-923X.1886.
Buccholz, D. (1993). Evaluation of recreation sports facilities and programs at Arizona State
University. Unpublished master’s thesis, Arizona State University.
Burns, N. & Grove, S. (1997). The practice of nursing research: conduct, critique, &
utilization.3rd edition. Philadelphia: W.B. Saunders.
Cameron, J., Roxburgh, M., Taylor, J., & Lauder, W. (2011). An integrative literature review of
student retention in programmes of nursing and midwifery: who do students stay?
Journal of Clinical Nursing, 20, p. 1372-1382.
Campbell, C., & Cabrera, A. (2011). How sound is NSSE?: Investigating the psychometric
properties of NSSE at a public, research-extensive institution. The Review of Higher
Education, 35(1), p. 77-103.
Campbell, A. R., & Dickson, C. J. (1996). Predicting student success: A 10-year review
using integrative review and meta-analysis. Journal of Professional Nursing,
12(1), p. 47-59.
Canadian Association of Schools of Nursing. (2010). The Case for Healthier Canadian: Nursing
Workforce Education for the 21st Century. Retrieved from: http://casn.ca/wp-
content/uploads/2014/12/CASN2010draftJune1.pdf
Canadian Association of Schools of Nursing. (2014). CASN Accreditation Program Standards.
Retrieved from: http://www.casn.ca/wp-content/uploads/2014/12/2014-FINAL-EN-
Accred-standards-March-311.pdf
Canadian Association of Schools of Nursing. (2015). Press Release: New American Entry-to-
Practice Exam a Failure for Canadian Nursing Students and for Canada. Retrieved
from: http://www.casn.ca/wp-content/uploads /2015/11/New-CASNWebsitepic-3.png

180
Canadian Association of Schools of Nursing & Canadian Nurses Association (2007). Policy
Brief: Meeting future health-care needs through innovations to nursing education.
Retrieved from: https://www.cna-aiic.ca/~/media/cna/page-content/pdf-
en/hhr_policy_brief2_2007_e.pdf?la=en
Canadian Association of Schools of Nursing & Canadian Nurses Association (2009). Nursing
education in Canada statistics: 2007-2008 Registered nurse workforce, Canadian
production: potential new supply. Ottawa.
Canadian Association of Schools of Nursing & Canadian Nurses Association (2012). Registered
Nurses Education in Canada Statistics 2010-2011: Registered nurse workforce,
Canadian production: potential new supply. Ottawa.
Canadian Council on Learning. (2009). Factors affecting attrition at a Canadian College.
Retrieved from:
http://www.fanshawec.ca/sites/default/files/file_attachments/fisher2009.pdf
Canadian Institute for Health Information, (2010). Regulated Nurses: Canadian Trends, 2005 to
2009. Retrieved May 8, 2012 from:
http://secure.cihi.ca/cihiweb/products/nursing_report_2005-2009_en.pdf
Canadian Institute for Health Information. (2014). Regulated Nurses, 2013 Report. Retrieved
from: https://secure.cihi.ca/free_products/Nursing-Workforce-2013_EN.pdf
Canadian Institute for Health Information, (2015). Regulated Nurses, 2014 Report. Retrieved
from: https://secure.cihi.ca/free_products/RegulatedNurses2014_Report_EN.pdf
Canadian Nurses Association. (2009). Tested Solutions for Eliminating Canada’s Registered
Nurse Shortage. Retrieved May 8, 2012 from: http://www2.cna-aiic.ca/CNA/
documents/pdf/publications/RN_Highlights_e.pdf.
Carini, R., Kuh, G. & Klein, S. (2006). Student engagement and student learning: Testing the
linkages. Research in Higher Education, 47(1), p.1 -32.
Cassady, J. (2001). Self-reported GPA and SAT: A methodological note. Practical Assessment,
Research, & Evaluation, 7. Retrieved from: http://PAREonline.net/getvn.asp?v=7&n=12.
CCI Research Inc. (2009). Measures of student engagement in postsecondary education:
theoretical basis and applicability to Ontario’s colleges. Toronto: Higher Education
Quality Council of Ontario.
Center for Community College Student Engagement, (2009). Making connections: dimensions of
student engagement (2009 CCSSE Findings). Austin, TX: The University of Texas at
Austin, Community College Leadership Program.
Chan, J. (2014). Psychological determinants of exercise behaviour of nursing students.
Contemporary Nurse, 49(1), p. 60-67.
Chickering, A. (1974). Commuting vs. residential students: Overcoming educational inequities
of living off campus. San Francisco: Jossey-Bass Inc.

181
Chickering, A. & Gamson, Z. ( Fall, 1987). Seven principles for good practice in undergraduate
education, Washington Center News. Retrieved from http://learningcommons.evergreen.
edu/pdf/f all1987.pdf
Cole, J., & Gonyea, R. (2010). Accuracy of self-reported SAT and ACT test scores: Implications
for research. Research in Higher Education, 51, pp. 305-319.
Cole, J., Rocconi, L., & Gonyea, R. (2012). Accuracy of self-reported grades: Implications for
research. Paper presented at the annual meeting of the Association for Institutional
Research.
College of Nurses of Ontario. (2015). Membership Statistics Highlights 2014. Retrieved from:
http://www.cno.org/globalassets/docs/general/43069_stats/43069_membershipstatistics-
highlights.pdf
Colleges Ontario. (2010). Opening doors to nursing degrees: A proposal from Ontario’s
colleges. Retrieved from: http://www.collegesontario.org/policy-positions/position-
papers/opening_doors_to_nursing_degrees.pdf
Comerford, S. (2005). Engaging through learning – learning through engaging: an alternative
approach to professional learning about human diversity. Social Work Education, 24(1),
p. 113-135.
Conway, C. (2010). Implementing Engagement Improvements through Targeted Interventions:
Final Report: Intervention Processes, Impacts, and Implications. Toronto: Higher
Education Quality Council of Ontario.
Conway, C., & Zhao, H. (2012). The NSSE National Data Project: Phase Two Report. Toronto:
Higher Education Quality Council of Ontario.
Conway, C., Zhao, H., & Montgomery, S. (2011). The NSSE National Data Project Report.
Toronto: Higher Education Quality Council of Ontario.
Council of Ontario Universities. (2010). Council of Ontario Universities Position Paper on
Collaborative Nursing Programs in Ontario. Retrieved from: http://cou.on.ca/wp-
content/uploads/2015/05/COU-Position-Paper-on-Collaborative-Nursing-Programs-in-
Ontario.pdf
Creswell, J. (2009). Research Design: qualitative, quantitative, and mixed methods approaches.
California, U.S.: Sage Publications.
Day, R., Paul, P., Boman, J., McBride, W., & Idriss, D. (2004). Proposal to support the strategic
plan to implement the Canadian nursing advisory committee recommendations –
educational objective b: student attrition. Ottawa: Canadian Nurses Association.
DeBard. R., & Sacks, C. (2010). Fraternity/Sorority membership: good news about first-year
impact. Oracle: The Research Journal of the Association of Fraternity/Sorority Advisors,
5(1), p. 12-23.

182
Diekelmann, N. (2005). Engaging students and the teacher: Co-creating substantive reform with
narrative pedagogy. Journal of Nursing Education, 44(6), p. 249-252.
Dietsche, P. (1989). Describing and predicting freshman attrition in c college of applied arts and
technology of Ontario (Doctoral dissertation). Retrieved from:
http://search.proquest.com.ezproxy.lib.ryerson.ca/docview/303796624/abstract
Dietsche, P. (1990). Freshman attrition in a college of applied arts and technology of Ontario.
The Canadian Journal of Higher Education, XX (3), p. 64-85.
Feingold, C., Cobb, M., Hernandez, R., Arnold, J., Joslin, S. & Keller, J. (2008). Student
perceptions of team learning in nursing education. Journal of Nursing Education, 47(5),
p. 214-222.
FitzGerald, L. (2015). Categorization and determinants of physical activity among nursing
students. Journal of Nursing Education and Practice, 5(5), p. 10-20.
Fuller, M., Wilson, M., & Tobin, R. (2011). The national survey of student engagement as a
predictor of undergraduate GPA: a cross-sectional and longitudinal examination.
Assessment & Evaluation in Higher Education, 36 (6), p. 735-748.
Gibbons, C., Dempster, M. & Moutray, M. (2007). Stress and eustress in nursing students.
Journal of Advanced Nursing, 61, p. 282-290.
Gibson, A., & Slate, J. (2010). Student engagement at two-year institutions: age and generational
status differences. Community College Journal of Research and Practice, 34, p. 371-385.
Gocka, E. (1973). Stepwise regression for mixed mode predictor variables. Educational and
Psychological measurement, 33, p. 319-325. Retrieved from:
http://journals1.scholarsportal.info.myaccess.library.utoronto.ca/pdf/00131644/v33i0002/
319_srfmmpv.xml
Gordon, J., Ludlum, J., & Hoey, J. (2008). Validating NSSE against student outcomes: Are they
related? Research in Higher Education, 49, p. 19-39.
Haas, R., Nugent, K., & Rule, R. (2004). The use of discriminant function analysis to predict
student success on the NCLEX-RN. Journal of Nursing Education, 44, p.85-89.
Hackett, M. (2007). Exploring the relationship between recreational sports employment and
academic success. Recreational Sports, 31(1), p. 69-74.
Hallin, K. & Danielson, E. (2007) Registered nurses’ experiences of daily work, a balance
between strain and stimulation: a qualitative study. International Journal of Nursing
Studies, 44, p. 1221-1230.
Hawker, C. (2012). Physical activity and mental well-being in student nurses. Nurse Education
Today, 32, p. 325-331.

183
Hayes, L. (2007). Recruitment strategies for Baccalaureate nursing students in Ontario. Journal
of Nursing Education, 46(6), p. 261-268.
Higgins, B. (2005). Strategies for lowering attrition rates and raising NCLEX-RN pass rates.
Journal of Nursing Education, 44 (12), p. 541- 547.
Hines, D. (2002). Factors that contribute to attrition of associate degree nursing students.
Unpublished manuscript, Department of Education and Psychology, Pepperdine
University, US.
Hu, S. & Kuh, G. (2002). Being (dis)engaged in educationally purposeful activities: the
influences of student and institutional characteristics. Research in Higher Education,
43(5), p. 555-575.
Hughes, R. & Pace, R. (2003). Using NSSE to study student retention and withdrawal.
Assessment Update, 15(4), p. 13-15.
Indiana University Center for Postsecondary Research. (2008). National Survey of Student
Engagement. 2008: Canadian web version. Available from:
http://nsse.iub.edu/pdf/NSSE2008_Canadian_English_Web.pdf
Jeffreys, M. (2006). Tracking students through program entry, progression, graduation, and
licensure: assessing undergraduate nursing student retention and success. Nurse
Education Today, 27, p. 406-419.
Jeffreys, M. (2007). Nontraditional student’s perceptions of variables influencing retention: A
multisite study. Nurse Educator, 32(4), p. 161-167.
Jeffreys, M. (2012). Nursing student retention: understanding the process and making a
difference. New York, NY: Springer Publishing Company, LLC.
Judge, L., Bellar, D., Petersen, J., Bryan, C., Ferkel, R., & Wanless, E. (2014). Physical activity
patterns and academic performance of college students. Research Quarterly for Exercise
and Sport, supplement, p. A-73.
Keating, X., Guan, J., Pinero, J., & Bridges, D. (2005). A meta-analysis of college students’
physical activity behaviors. Journal of American College Health, 54(2), p. 116-125.
Kezar, A. (2006). The impact of institutional size on student engagement. NASPA Journal, 43(1),
p. 87-114.
Kiecolt, K., & Nathan, L. (1985). Secondary analysis of survey data: series: quantitative
analysis in the social sciences. Retrieved from:
https://books.google.ca/books?id=auXQVnwT9CkC&printsec=frontcover&dq=Kiecolt,+
K.,+%26+Nathan,+L.+%281985%29.+Secondary+analysis+of+survey+data:+series:+qu

184
antitative+analysis+in+the+social+sciences.+California:+Sage+Publications.&hl=en&sa
=X&ei=rCp2VfryItSryASE-rzQDQ&redir_esc=y#v=onepage&q&f=false .
Kinzie, J., Gonyea, R., Kuh, G. D., Umbach, P., Blaich, C., & Korkmaz, A. (2007). The
relationship between gender and student engagement in college. Paper presented at the
32 annual conference of the Association for the Study of Higher Education, Louisville,
KY.
Krause, K., & Coates, H. (2008). Students’ engagement in first-year University. Assessment &
Evaluation in Higher Education, 33 (5), p. 493-505.
Kuh, G. (2001). Assessing what really matters to student learning: Inside the National Survey of
Student Engagement. Change, 33(3), p. 10-17.
Kuh, G. (2002). The National Survey of Student Engagement: Conceptual Framework and
Overview of Psychometric Properties. Bloomington, IN: Indiana University, Center for
Postsecondary Research.
Kuh, G. (2003). What we’re learning about student engagement from NSSE. Change, 35(2), p.
24-32.
Kuh, G. (2009). The National survey of student engagement: conceptual and empirical
foundations. New Directions for Institutional Research, (141), p.5-20.
Kuh, G.D., & Vesper, N. (1997). A comparison of student experiences with good practices in
undergraduate education between 1990 and 1994. Review of Higher Education, 21, p. 43-
61.
Kuh, G., Gonyea, R., & Palmer, M. (2001). The Disengaged commuter student: Fact or fiction?
Commuter Perspectives, 27(1), p. 2-5.
Kuh, G. D., Kinzie, J., Buckley, J.A., Bridges, B. K., & Hayek, J. C. (2006). What matters to
student success: A review of the literature. National Postsecondary Education Cooperative
(NPEC) Commissioned Paper.
Kuh, G., Kinzie, J., Buckley, J., Bridges, B., & Hayek, J. (2007a). Piecing together the
student success puzzle: Research, propositions and recommendations, ASHE Higher
Education Report, 32(5), p. 1-5. doi: 10.1002/aehe.3205
Kuh. G., Kinzie, J., Cruce, T., Shoup, R., & Gonyea, R. (2007b). Connecting the Dots: Multi-
Faceted analyses of the relationships between student engagement results from the NSSE,
and the Institutional practices and conditions that foster student success: Final report
prepared for Lumina Foundation for Education. Bloomington, IN: Indiana University,
Center for Postsecondary Research.

185
Kuh, G., Cruce, T., Shoup, R., & Kinzie, J. (2008). Unmasking the effects of student engagement
on first-year college grades and persistence. The Journal of Higher Education, 79(5), p.
540-563.
Kuncel, N. R., Crede, M., & Thomas, L. (2005). The validity of self-reported grade point
averages, class ranks and test scores: A meta-analysis and review of the literature.
Review of Educational Research, 75(1), p. 63-82.
Lackland, A.C. & De Lisi, R. (2001). Students' choices of college majors that are gender
traditional and nontraditional. Journal of College Student Development, 42 (1), 39-48.
Laird, T., Chen, D. & Kuh, G. (2008). Classroom practices at institutions with Higher-than-
expected persistence rates: What student engagement data tell us. New Directions for
Teaching and Learning. (115), p. 85-99. Doi: 10.1002/tl.327.
Leroy, M. (2008). African American nursing students' perspectives on faculty strategies to
promote retention and academic success. (Doctoral dissertation). School of Nursing,
Widener University, US.
McCormick, A. (2011). It’s about time: What to make of reported declines in how much college
students study. Liberal Education, 97(1), p. 30-39.
Merwin, J. (1969). “Historical Review of Changing Concepts of Evaluation.” In R. L. Tyler
(ed.), Educational Evaluation: New Roles, New Methods: The Sixty-Eighth Yearbook of
the National Society for the Study of Education, Part II. Chicago: University of Chicago
Press.
National Survey of Student Engagement. (2000). National Benchmarks of Effective Educational
Practice. Bloomington, IN: Indiana University, Center for Postsecondary Research.
National Survey of Student Engagement. (2002). From Promise to Progress: How Colleges and
Universities Are Using Student Engagement Results to Improve Collegiate Quality.
Bloomington, IN: Indiana University, Center for Postsecondary Research.
National Survey of Student Engagement. (2005). Student Engagement: Exploring Different
Dimensions of Student Engagement. Bloomington, IN: Indiana University Center for
Postsecondary Research.
National Survey of Student Engagement. (2006). Engaged Learning: Fostering Success for All
Students. Bloomington, IN: Indiana University, Center for Postsecondary Research.
National Survey of Student Engagement. (2007). Reliability 2007 Internal Consistency.
Retrieved from:
http://nsse.iub.edu/pdf/psychometric_portfolio/Reliability_InternalConsistency_2007.pdf

186
National Survey of Student Engagement. (2008a). Benchmarks for effective educational practice.
Bloomington, IN: Indiana University, Center for Postsecondary Research. Retrieved from:
www.nsse.iub.edu/pdf/nsse_benchmarks.pdf
National Survey of Student Engagement. (2008b). NSSE 2008 Overview. Retrieved from:
http://nsse.iub.edu/pdf/2008_Institutional_Report/NSSE%202008%20Overview.pdf
National Survey of Student Engagement. (2010). Working with NSSE Data: A Facilitator’s
guide. Retrieved from: http://nsse.iub.edu/_2010/img/NewNI/Facilitators_Guide.pdf
National Survey of Student Engagement (2011). Multi-year data analysis guide. Retrieved from:
http://www.nsse.iub.edu/2011_Institutional_Report/pdf/NSSE%20mydag.pdf
National Survey of Student Engagement (2012). Promoting student learning and institutional
improvement: Lessons from NSSE at 13: Annual results 2012. Retrieved from:
http://nsse.iub.edu/NSSE_2012_Results/pdf/NSSE_2012_Annual_Results.pdf
National Survey of Student Engagement. (2014). Response Rate FAQ. Retrieved from:
http://nsse.indiana.edu/pdf/Resp_Rate_FAQ.pdf
Nulty, D. (2008). The adequacy of response rates to online and paper surveys: what can be done?
Assessment & Evaluation in Higher Education, 33(3), p. 301-314.
Nunnally, J. C. (1978). Psychometric theory (2nd edition.). New York: McGraw-Hill.
Ouimet, J., Bunnage, J., Carini, R., Kuh, G., and Kennedy, J. (2004). Using focus groups, expert
advice, and cognitive interviews to establish the validity of a college student survey.
Research in Higher Education, 45(3), p. 233-250.
Pace, C. (1984). Measuring the quality of college student experiences: An account of the
development and use of the College Student Experience Questionnaire. Graduate School
of Education, University of California, U.S. Retrieved from:
http://files.eric.ed.gov/fulltext/ED255099.pdf
Pascarella, E. T. (1985). College environmental influences on learning and cognitive
development: A critical review and synthesis. In J. Smart (Ed.), Higher Education:
Handbook of theory and research (Vol. 1, pp. 1-61). New York: Agathon Press.
Pascarella, E., Whitt, E., Nora, A., Edison, M., Hagedorn, L., & Terenzini, P. (1996). What have
we learned from the first-year of the National Study of Student Learning? Journal of
College Student Development, 37, 182-192.
Pascarella, E., & Terenzini, P. (1991). How College affects students: Findings and insights from
twenty years of research. San Francisco, CA: Jossey-Bass.
Pascarella, E. & Terenzini, P. (2005). How College affects students, Volume 2, A Third Decade
of Research. San Francisco, CA: Jossey-Bass.

187
Pascarella, E., Flowers, L., & Whitt, E. (2009). Cognitive effects of Greek affiliation in college:
Additional evidence. NASPA Journal, 46, 3, p. 447-468.
Patterson-Johnson, J. & Mighten, A. (2005). A comparison of teaching strategies: Lecture notes
combined with structured group discussions versus lecture only. Journal of Nursing
Education, 44(7), p. 319-322.
Pedhazur, E. (1982). Multiple regression in behavioral research 2nd edition. New York: CBS
College Publishing.
Pence, P. (2011). Predictors of retention among undergraduate students attending associate-
degree nursing programs in Illinois. Teaching and Learning in Nursing, 6, p. 131-138.
Peterson, V. (2009). Predictors of academic success in first semester Baccalaureate nursing
students. Social Behavior and Personality, 37(3), 411-418.
Pike, G. (2000). The influence of fraternity or sorority membership on students’ college
experiences and cognitive development. Research in Higher Education, 41 (1), p.117-139.
Pike, G. (2003). Membership in a fraternity or sorority, student engagement, and educational
outcomes at AAU public research universities. Journal of College Student Development,
44 (3), p. 369-382.
Pike, G.R., Schroeder, C.C., & Berry, T.R. (1997). Enhancing the educational impact of
residence halls: The relationship between learning communities and first-year college
experiences and persistence. Journal of College Student Development, 38, p. 609-621.
Pike, G. R., Kuh, G. D., & Gonyea, R. M. (2003). The relationship between institutional mission
and students’ involvement and educational outcomes. Research in Higher Education, 44
(2), p. 241-261.
Pike, G. & Kuh, G. (2005). First and second generation college student: A comparison of their
engagement and intellectual development. The Journal of Higher Education, 76(3), p.
276-300.
Popkess, A. (2010). The relationship between undergraduate, baccalaureate nursing student
engagement and use of active learning strategies in the classroom. (Doctoral dissertation).
Retrieved from http://proquest.umi.com.myaccess.library.utoronto.ca/pqdlink?index=
0&did=2003827821&SrchMode=2&sid=3&Fmt=2&VInst=PROD&VType=PQD&RQT=
309&VName=PQD&TS=1294233127&clientId=12520
Popkess, A. & McDaniel, A. (2011). Are nursing students engaged in learning? A secondary
analysis of data from National Survey of Student Engagement. Nursing Education
Research, 32(2), p. 13-18.
Porter, S. (2011). Do college student surveys have any validity? The Review of Higher
Education, 35(1), p. 45-76.

188
Rae, B. (2005). Ontario A Leader in Learning: Report & Recommendations. Retrieved from:
http://www.tcu.gov.on.ca/eng/document/reports/postsec.pdf
Rassool, G. H., & Rawaf, S. (2007). Learning style preferences of undergraduate nursing
students. Nursing Standard, 21(32), 35-41.
Reyes, H. (2007). The relationship between university nursing student classroom engagement
activities and academic performance. (Doctoral dissertation). Retrieved from
http://proquest.umi.com.myaccess.library.utoronto.ca/pqdlink?index=10&did=140434198
1&SrchMode=2&sid=7&Fmt=2&VInst=PROD&VType=PQD&RQT=309&VName=PQ
D&TS=1294233304&clientId=12520
Robertson, S., Canary, C., Orr, M., Herberg, P., & Rutledge, D. (2010). Factors related to
progression and graduation rates for RN to Bachelor of science in nursing programs:
searching for realistic benchmarks. Journal of Professional Nursing, 26 (2), p. 99-107.
Ross-Kerr, J.C. (2003). The origins of nursing education in Canada: Emergence and growth of
diploma programs. In J.C. Ross-Kerr & M.J. Wood (Eds.), Canadian nursing: Issues and
perspectives (4th ed., p. 329-348). Toronto, Ontario, Canada: Mosby.
Salamonson, Y., & Andrew, S. (2006). Academic performance in nursing students: influence of
part-time employment, age and ethnicity. Journal of Advanced Nursing, 55(3), p. 342-
351.
Salamonson, Y., Andrew, S. & Everett, B. (2009). Academic engagement and disengagement as
predictors in pathophysiology among nursing students. Contemporary Nurse, 32(1-2), p.
123-132.
Sayles, S., Shelton, D., & Powell, H. (2003). Predictors of success in nursing education. The
ABNF Journal, 14(6), 116-120.
Sears, N., Othman, M., & Mahoney, K. (2015). Examining the relationship between NCLEX-RN
performance and nursing student factors, including undergraduate nursing program
performance: A systematic review. Journal of Nursing Education and Practice, 5(11), p.
10-15.
Seifert, T., Pascarella, E., Salisbury, M. & Blaich, C. (2010). Liberal arts colleges and good
practices in undergraduate education: additional evidence. Journal of College Student
Development, 51(1), p. 1-22.
Stewart, D. & Kamins, M. (1993). Secondary research: information sources and methods 2nd
edition. Retrieved from:
https://books.google.ca/books?id=Oe3MrNsOjkkC&printsec=frontcover&dq=Stewart,+D
.+%26+Kamins,+M.+%281993%29.+Secondary+research:+information+sources+and+m
ethods+2nd+edition.+California:+Sage+Publications.&hl=en&sa=X&ei=vSt2VcfcM8ud
ygTl3KP4BQ&ved=0CCEQuwUwAA#v=onepage&q&f=false .

189
Stickney, M. (2008). Factors affecting practical nursing student attrition. Journal of Nursing
Education, 47(9), p. 422-425.
Symes, L. Tart. K., & Travis, L. (2005). An evaluation of the nursing success program: Reading
comprehension, graduation rates, and diversity. Nurse Educator, 30(5), 217-220. Doi:
10.1097/00006223-200509000-00010
Tabachnick, B. & Fidell, L. (2013). Using multivariate statistics 6th edition. New Jersey: Pearson
Education Inc.
Talento-Miller, E. & Peyton, J. (2006). Moderators of the accuracy of self-report grade point
average. GMAC Research Reports. Retrieved from: http://www.gmac.com/~/media/
Files/gmac/Research/research-report-series/RR0610_SRUGPA.pdf
Tinto, V. (1988). Stages of student departure reflections on the longitudinal character of student
leaving. The Journal of Higher Education, 59(4), Retrieved August 21, 2010 from
http://www.jstor.org/stable/1981920
Tinto, V. (1993). Leaving College: Rethinking the Causes and Cures of Student Attrition. 2nd
edition . Chicago, IL: University of Chicago Press.
Tinto, V. (1998). Colleges as communities: Taking research on student persistence seriously. The
Review of Higher Education, 21(2), p. 167-177.
Umbach, P., Palmer, M., Kuh, G, & Hannah, S. (2006). Intercollegiate athletes and effective
educational practices: Winning combination or losing effort? Research in Higher
Education, 47 (6), p. 709-733.
Walker, J. T., Martin, T., White, J., Elliott, R., Norwood, A., Mangum, C., et al. (2006).
Generational (age) differences in nursing students' preferences for teaching
methods. Journal of Nursing Education, 45(9), 371-374.
Wells, M. (2003). An epidemiologic approach to addressing student attrition in nursing
programs. Journal of Professional Nursing, 19 (3), p. 230-236.
Williams, M. (2010). Attrition and retention in the nursing major: understanding persistence in
beginning nursing students. Nursing Education Perspectives, 31 (6), p. 362-367.
Wong, I., & Wong, S. (1999). Contribution of basic sciences to academic success in
nursing education. International Journal of Nursing Studies, 36(4), p. 345-354.
Zacherman, A., & Foubert, J. (2014). The relationship between engagement in cocurricular
activities and academic performance: exploring gender differences. Journal of Student
Affairs Research and Practice, 51(2), p. 157-169.

190
Appendix A
The National Survey of Student Engagement (NSSE)
2008 Canadian Survey Questions
Listed below are the questions contained in the Canadian edition of NSSE 2008 web‐based
survey. Forty one of these questions provide the basis of NSSE’s five benchmark scales of
effective educational practice, and are noted by the appropriate acronym: Level of Academic
Challenge (LAC); Active and Collaborative Learning (ACL); Student‐Faculty Orientation (SFI);
Enriching Educational Experiences (EEE); and Supportive Campus Environment (SCE).
1. Academic and Intellectual Experiences
In your experience at your institution during the current school year, about how often have
you done each of the following? (Very often, Often, Sometimes, Never)
a. Asked questions in class or contributed to class discussions (ACL)
b. Made a class presentation (ACL)
c. Prepared two or more drafts of a paper or assignment before turning it in
d. Worked on a paper or project that required integrating ideas or information from various
sources
e. Included diverse perspectives (different races, religions, genders, political beliefs, etc.) in
class discussions or writing assignments
f. Come to class without completing readings or assignments (LAC – related items)
g. Worked with other students on projects during class (ACL)
h. Worked with classmates outside of class to prepare class assignments (ACL)
i. Put together ideas or concepts from different courses when completing assignments or
during class discussions
j. Tutored or taught other students (paid or voluntary) (ACL)
k. Participated in a community‐based project (e.g., service learning) as part of a regular
course (ACL)
l. Used an electronic medium (listserv, chat group, Internet, instant messaging, etc.) to
discuss or complete an assignment (EEE)
m. Used e‐mail to communicate with an instructor
n. Discussed grades or assignments with an instructor (SFI)

191
o. Talked about career plans with a faculty member or advisor (SFI)
p. Discussed ideas from your readings or classes with faculty members outside of class
(SFI)
q. Received prompt written or oral feedback from faculty on your academic performance
(SFI)
r. Worked harder than you thought you could to meet an instructor's standards or
expectations (LAC)
s. Worked with faculty members on activities other than coursework (committees,
orientation, student life activities, etc.) (SFI)
t. Discussed ideas from your readings or classes with others outside of class (students,
family members, co‐workers, etc.) (ACL)
u. Had serious conversations with students of a different race or ethnicity than your own
(EEE)
v. Had serious conversations with students who are very different from you in terms of their
religious beliefs, political opinions, or personal values (EEE)
2. Mental Activities
During the current school year, how much has your coursework emphasized the following
mental activities? (Very much, Quite a bit, Some, Very little)
a. Memorizing facts, ideas, or methods from your courses and readings so you can repeat
them in pretty much the same form
b. Analyzing the basic elements of an idea, experience, or theory, such as examining a
particular case or situation in depth and considering its components (LAC)
c. Synthesizing and organizing ideas, information, or experiences into new, more complex
interpretations and relationships (LAC)
d. Making judgments about the value of information, arguments, or methods, such as
examining how others gathered and interpreted data and assessing the soundness of their
conclusions (LAC)
e. Applying theories or concepts to practical problems or in new situations (LAC)

192
3. Reading and Writing
During the current school year, about how much reading and writing have you done?
(None, 1‐4, 5‐10, 11‐20, More than 20)
a. Number of assigned textbooks, books, or book‐length packs of course readings (LAC)
b. Number of books read on your own (not assigned) for personal enjoyment or academic
enrichment
c. Number of written papers or reports of 20 pages or more (LAC)
d. Number of written papers or reports between 5 and 19 pages (LAC)
e. Number of written papers or reports of fewer than 5 pages (LAC)
4. Problem Sets
In a typical week, how many homework problem sets or problem-based homework
assignments do you complete? (None, 1‐2, 3‐4, 5‐6, More than 6)
a. Number of problem sets or problem-based homework assignments that take you more
than an hour to complete (LAC – related items)
b. Number of problem sets or problem-based homework assignments that take you less than
an hour to complete (LAC – related items)
5. Examinations
Select the value that best represents the extent to which your examinations during the
current school year have challenged you to do your best work.
(Scale = 1 Very little, 2, 3, 4, 5, 6, 7 Very much)
6. Additional Collegiate Experiences
During the current school year, about how often have you done each of the following?
(Very often, Often, Sometimes, Never)
a. Attended an art exhibit, play, dance, music, theater, or other performance
b. Exercised or participated in physical fitness activities
c. Participated in activities to enhance your spirituality (worship, meditation, prayer, etc.)
d. Examined the strengths and weaknesses of your own views on a topic or issue
e. Tried to better understand someone else's views by imagining how an issue looks from
his or her perspective
f. Learned something that changed the way you understand an issue or concept

193
7. Enriching Educational Experiences
Which of the following have you done or do you plan to do before you graduate from your
institution? (Done, Plan to do, Do not plan to do, Have not decided)
a. Practicum, internship, field experience, co‐op experience, or clinical assignment (EEE)
b. Community service or volunteer work (EEE)
c. Participate in a learning community or some other formal program where groups of
students take two or more classes together (EEE)
d. Work on a research project with a faculty member outside of course or program
requirements (SFI)
e. Foreign language coursework (EEE)
f. Study abroad (EEE)
g. Independent study or self‐designed major (EEE)
h. Culminating senior experience (capstone course, senior project or thesis, comprehensive
exam, etc.) (EEE)
8. Quality of Relationships
Select the value that best represents the quality of your relationships with people at your
institution.
a. Relationships with other students
(Scale = 1 Unfriendly, Unsupportive, Sense of alienation; 2; 3; 4; 5; 6; 7 Friendly,
Supportive, Sense of belonging) (SCE)
b. Relationships with faculty members
(Scale = 1 Unavailable, Unhelpful, Unsympathetic; 2; 3; 4; 5; 6; 7 Available, Helpful,
Sympathetic) (SCE)
c. Relationships with administrative personnel and offices
(Scale = 1 Unhelpful, Inconsiderate, Rigid ; 2; 3; 4; 5; 6; 7 Helpful, Considerate,
Flexible) (SCE)
9. Time Usage
About how many hours do you spend in a typical 7‐day week doing each of the following?
(0, 1‐5, 6‐10, 11‐15, 16‐20, 21‐25, 26‐30, More than 30)
a. Preparing for class (studying, reading, writing, doing homework or lab work, analyzing
data, rehearsing, and other academic activities) (LAC)
b. Working for pay on campus

194
c. Working for pay off campus
d. Participating in co‐curricular activities (organizations, campus publications, student
government, fraternity or sorority, intercollegiate or intramural sports, etc.) (EEE)
e. Relaxing and socializing (watching TV, partying, etc.)
f. Providing care for dependents living with you (parents, children, spouse, etc.)
g. Commuting to class (driving, walking, etc.)
10. Institutional Environment
To what extent does your institution emphasize each of the following?
(Very much, Quite a bit, Some, Very little)
a. Spending significant amounts of time studying and on academic work (LAC)
b. Providing the support you need to help you succeed academically (SCE)
c. Encouraging contact among students from different economic, social, and racial or ethnic
backgrounds (EEE)
d. Helping you cope with your non‐academic responsibilities (work, family, etc.) (SCE)
e. Providing the support you need to thrive socially (SCE)
f. Attending campus events and activities (special speakers, cultural performances, athletic
events, etc.)
g. Using computers in academic work
11. Educational and Personal Growth (Self-reported gains)
To what extent has your experience at this institution contributed to your knowledge, skills,
and personal development in the following areas? (Very much, Quite a bit, Some, Very little)
a. Acquiring a broad general education
b. Acquiring job or work‐related knowledge and skills
c. Writing clearly and effectively
b. Speaking clearly and effectively
c. Thinking critically and analytically
d. Analyzing quantitative problems
e. Using computing and information technology
f. Working effectively with others
g. Voting in local, state, or national elections
h. Learning effectively on your own
i. Understanding yourself
j. Understanding people of other racial and ethnic backgrounds

195
k. Solving complex real‐world problems
l. Developing a personal code of values and ethics
m. Contributing to the welfare of your community
n. Developing a deepened sense of spirituality
12. Academic Advising
Overall, how would you evaluate the quality of academic advising you have received at your
institution? (Excellent, Good, Fair, Poor)
13. Satisfaction
How would you evaluate your entire educational experience at this institution?
(Excellent, Good, Fair, Poor)
14. If you could start over again, would you go to the same institution you are now attending?
(Definitely yes, Probably yes, Probably no, Definitely no)
BACKGROUND ITEMS
15. Year of birth
16. Sex
17. Are you a Canadian citizen? (Yes or No)
18. What is your racial or ethnic identification? (Mark only one)
19. To which ethnic or cultural group(s) did your ancestors belong?
20. What is your current classification in university?
(1st year, 2nd year, 3rd year, 4th year, unclassified)
21. Did you begin university at your current institution or elsewhere?
(Started here, Started elsewhere)
22. Since graduating from high school, which of the following types of schools have you
attended other than the one you are attending now? (Select all that apply.)
(Community college – vocational or technical courses not at university level, Community
college – university credit/transfer courses, CEGEP – general or pre-university program,
CEGEP – professional or technical program, private training institution, None, Other)
23. Thinking about this current academic term, how would you characterize your enrollment?
(Full‐time or Less than full‐time)
24. Are you a member of a social fraternity or sorority? (Yes or No)

196
25. Are you a student‐athlete on a team sponsored by your institution's athletics department?
(Yes or No)
On what team(s) sponsored by your institution’s athletics department are you an athlete
(Select all that apply.)
(Baseball, Basketball, Bowling, Cross Country, Fencing, Field Hockey, Football, Golf,
Gymnastics, Ice Hockey, Track & Field, Lacrosse, Rifle, Rowing, Skiing, Soccer, Softball,
Swimming & Diving, Tennis, Volleyball, Water Polo, Wrestling, Other)
26. What have most of your grades been up to now at this institution? (academic performance as
per self-reported GPA)
(A, A-, B+, B, B-, C+, C, C- or lower)
27. Which of the following best describes where you are living now while attending college?
(Room or apartment in university residences or campus housing, Off-campus
accommodation within walking distance of campus, Off-campus accommodation within
driving distance of campus, Fraternity or sorority house)
28. What is the highest level of education that your father completed?
(Did not finish high school, Graduated from high school, Some or completed college or
CEGEP, Attended university without earning degree, Completed a bachelor’s degree (B.A.,
BSc., etc.), Completed a master’s degree (M.A., MSc., etc.), Completed a doctoral degree
(Ph.D., J.D., M.D., etc.)
What is the highest level of education that your mother completed?
(Did not finish high school, Graduated from high school, Some or completed college or
CEGEP, Attended university without earning degree, Completed a bachelor’s degree (B.A.,
BSc., etc.), Completed a master’s degree (M.A., MSc., etc.), Completed a doctoral degree
(Ph.D., J.D., M.D., etc.)
29. Please enter your primary major (Enter only one):
If applicable, second major (not minor, concentrations, etc.):
If you have any additional comments or feedback that you’ll like to share on the quality of your
educational experience, please type them below.

197
Source:
Indiana University Center for Postsecondary Research. (2008). National Survey of Student
Engagement. 2008: Canadian web version. Available from:
http://nsse.iub.edu/pdf/NSSE2008_Canadian_English_Web.pdf
Indiana University Center for Postsecondary Research (2008). The College Student Report:
NSSE 2008 Canadian Codebook. Available from:
http://nsse.iub.edu/pdf/USCan_Codebooks/NSSE%202008%20Canadian%20Codebook.pdf

198
Appendix B
Benchmark Sources of Data
4b During a typical week, how many problem sets do you complete that take you less than
an hour to complete ‘probsetb’
Active and Collaborative Learning
1a Asked questions in class or contributed to class discussions ‘clquest’
1b Made a class presentation ‘clpresen’
1g Worked with other students on projects during class ‘classgrp’
1h Worked with classmates outside of class to prepare class assignments ‘occgrp’
1j Tutored or taught other students ‘tutor’
Level of Academic Challenge
9a Hours students spend in a typical seven-day week preparing for class ‘acadpr01’
3a Number of assigned textbooks, books, or book-length packs of course reading ‘readasgn’
3c Number of written papers or reports of 20 pages or more ‘writemor’
3d Number of written papers or reports between 5 and 19 pages ‘writemid’
3e Number of written papers or reports of fewer than 5 pages ‘writesml’
2b
Coursework emphasizing analyzing the basic elements of an idea, experience, or theory
‘analyze’ 2c Coursework emphasizing synthesizing and organizing ideas, information, or experiences
into new, more complex interpretations and relationships ‘synthesz’
2d Coursework emphasizing making judgments about the value of information, arguments, or
methods ‘evaluate’
2e Coursework emphasizing applying theories or concepts to practical problems or in new
situations ‘applying’
10a Campus environment emphasizing spending significant amounts of time studying and on
academic work ‘envschol’
1r Working harder than you thought you could to meet an instructor’s standards or
expectations ‘workhard’
Academic Challenge–Related Items
1f Come to class without completing readings or assignments ‘clunprep’
4a During a typical week, how many problem sets do you complete that take you more
than an hour to complete ‘probseta’

199
1k Participated in a community-based project as part of a regular course ‘commproj’
1t Discussed ideas from readings or classes with others outside of class (students, family
members, co-workers, etc.) ‘oocideas’
Student-Faculty Interaction
1n Discussed grades or assignments with an instructor ‘’facgrade’
1o Talked about career plans with a faculty member or advisor ‘facplans’
1p Discussed ideas from your readings or classes with faculty members outside of class
‘facideas’
1s Worked with a faculty member on activities other than coursework (committees,
orientation, student-life activities) ‘facother’
1q Received prompt written or oral feedback from faculty on your academic performance
‘facfeed’ 7d Worked with a faculty member on a research project outside of course or program
requirements ‘resrch04’
Enriching Educational Experience
9d Participating in cocurricular activities (organizations, student publications, student
government, fraternity or sorority, intercollegiate or intramural sports) ‘cocurr01’
7a Practicum, internship, field experience, co-op experience, or clinical assignment
‘intern04’ 7b Community service or volunteer work ‘volntr04’
7e Foreign language coursework ‘forlng04’
7f Study abroad ‘stdabr04’
7g Independent study or self-designed major ‘indstd04’
7h Culminating senior experience (capstone course, senior project or thesis, comprehensive
exam, etc) ‘snrx04’
1l Using an electronic medium (listserv, chat group, Internet, instant messaging, etc.) to
discuss or complete an assignment ‘itacadem’
7c Participating in a learning community or some other formal program where groups of
students take two or more classes together ‘lrncom04’
1u Had serious conversations with students of a different race or ethnicity than your own
‘divrstud’
1v Had serious conversations with students who are very different from you in terms of their
religious beliefs, political opinions, or personal values ‘diffstu2’
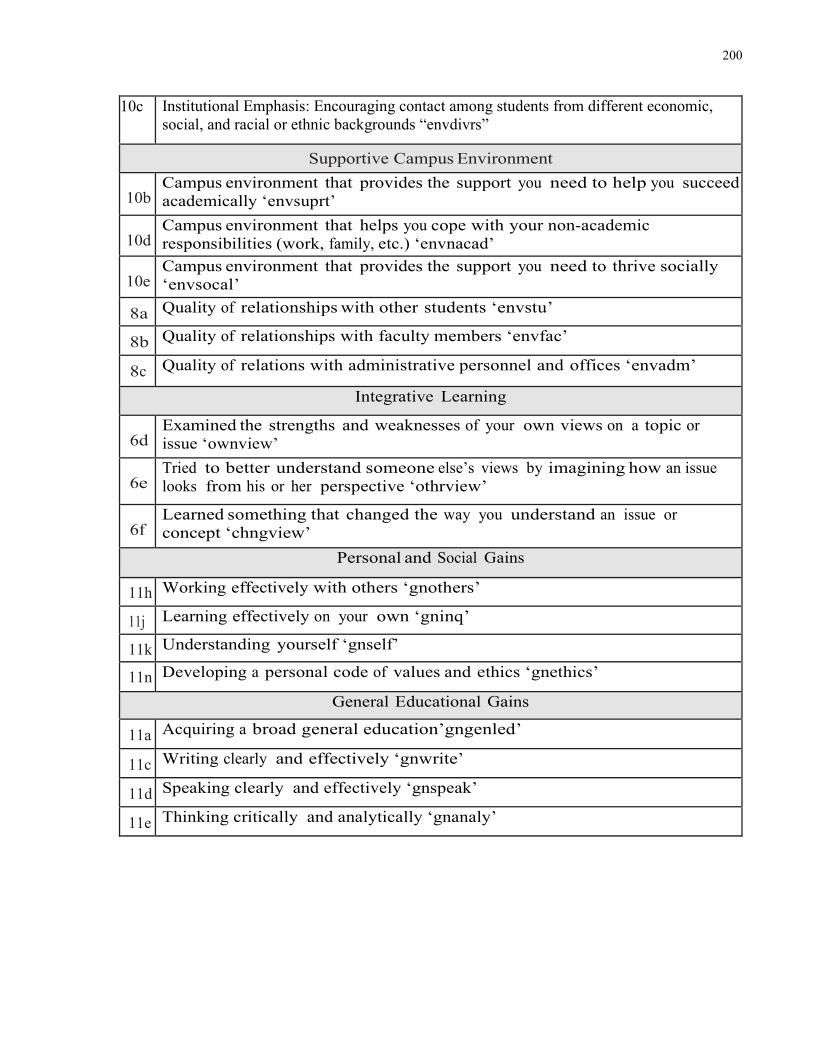
200
10c Institutional Emphasis: Encouraging contact among students from different economic,
social, and racial or ethnic backgrounds “envdivrs”
Supportive Campus Environment
10b
Campus environment that provides the support you need to help you succeed
academically ‘envsuprt’
10d
Campus environment that helps you cope with your non-academic
responsibilities (work, family, etc.) ‘envnacad’
10e
Campus environment that provides the support you need to thrive socially
‘envsocal’
8a Quality of relationships with other students ‘envstu’
8b Quality of relationships with faculty members ‘envfac’
8c Quality of relations with administrative personnel and offices ‘envadm’
Integrative Learning
6d
Examined the strengths and weaknesses of your own views on a topic or
issue ‘ownview’
6e
Tried to better understand someone else’s views by imagining how an issue
looks from his or her perspective ‘othrview’
6f
Learned something that changed the way you understand an issue or
concept ‘chngview’
Personal and Social Gains
11h Working effectively with others ‘gnothers’
11j Learning effectively on your own ‘gninq’
11k Understanding yourself ‘gnself’
11n Developing a personal code of values and ethics ‘gnethics’
General Educational Gains
11a Acquiring a broad general education’gngenled’
11c Writing clearly and effectively ‘gnwrite’
11d Speaking clearly and effectively ‘gnspeak’
11e Thinking critically and analytically ‘gnanaly’

201
Practical Competence Gains
11b Acquiring job or work-related knowledge and skills ‘gnwork’
11f Analyzing quantitative problems ‘gnquant’
11g Using computers and information technology ‘gncmpts’
11m Solving complex real-world problems ‘gnprobsv’
Student Satisfaction
13
An evaluation of the student’s entire educational experience at this
institution ‘entirexp’
14 If starting over would the student attend the same institution ‘samecoll’
Time Usage and Demands
9b Working for pay on campus ‘workon01’
9c Working for pay off campus ‘workof01’
9e Relaxing and socializing (watching TV, partying, etc.) ‘social05’
9f Providing care for dependents living with you
(parents, children, spouse, etc.) ‘carede01’
9g Commuting to class ‘commute’
Source: National Survey of Student Engagement. (2011). Multi-year data analysis guide.
Retrieved from: http://www.nsse.iub.edu/2011_Institutional_Report/pdf/NSSE%20mydag.pdf
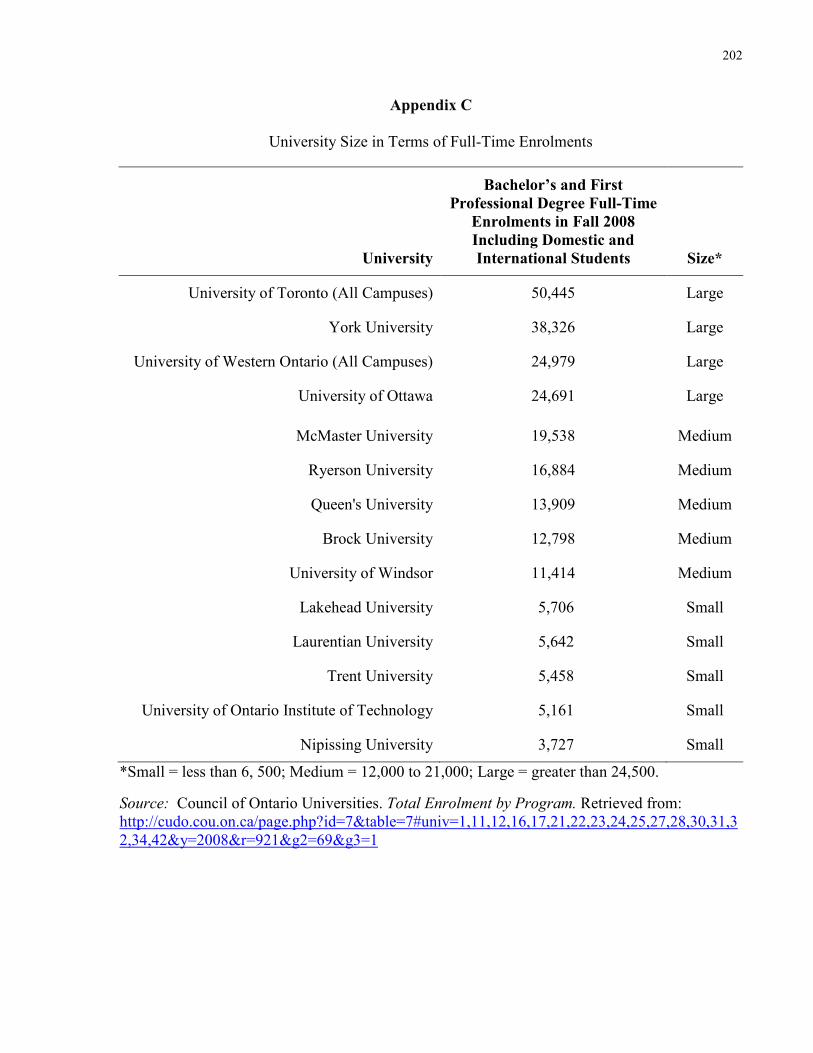
202
Appendix C
University Size in Terms of Full-Time Enrolments
University
Bachelor’s and First
Professional Degree Full-Time
Enrolments in Fall 2008
Including Domestic and
International Students Size*
University of Toronto (All Campuses) 50,445 Large
York University 38,326 Large
University of Western Ontario (All Campuses) 24,979 Large
University of Ottawa 24,691 Large
McMaster University 19,538 Medium
Ryerson University 16,884 Medium
Queen's University 13,909 Medium
Brock University 12,798 Medium
University of Windsor 11,414 Medium
Lakehead University 5,706 Small
Laurentian University 5,642 Small
Trent University 5,458 Small
University of Ontario Institute of Technology 5,161 Small
Nipissing University 3,727 Small
*Small = less than 6, 500; Medium = 12,000 to 21,000; Large = greater than 24,500.
Source: Council of Ontario Universities. Total Enrolment by Program. Retrieved from:
http://cudo.cou.on.ca/page.php?id=7&table=7#univ=1,11,12,16,17,21,22,23,24,25,27,28,30,31,3
2,34,42&y=2008&r=921&g2=69&g3=1

203
Appendix D
Ontario Universities that Participated in NSSE 2008
ONTARIO UNIVERSITIES
PARTICIPATED IN NSSE 2008
HAS A BACCALAUREATE
NURSING PROGRAM
Brock University YES
Carleton University NO
Lakehead University YES
Laurentian University YES
McMaster University YES
Nipissing University YES
OCAD University NO
Queen’s University YES
Ryerson University YES
Trent University YES
University of Ottawa YES
University of Guelph NO
University of Toronto YES
University of Waterloo NO
University of Ontario Institute of
Technology YES
University of Western Ontario YES
University of Windsor YES
Wilfred Laurier University NO
York University YES
Source:

204
NSSE 2008 Ontario Institutions:
http://nsse.iub.edu/html/participants.cfm?include_surveys=NSSE&min_year=2008&max_year=
2008&state=ON&name_keyword=&governance=&orderby=State&aButton=Collect+Results&a
ction=Collect+Results
Nursing Programs in Ontario: http://www.cno.org/become-a-nurse/about-registration/approved-
nursing-programs/rn-programs/

205
Appendix E
Requests for NSSE Data
While the National Survey of Student Engagement is available on a limited basis as a source of
data for researchers, we hold a primary obligation to protect our participation agreements with
NSSE users. Under these agreements, NSSE may:
“…make data, in which individual institutions or students cannot be identified, available to
researchers interested in studying the undergraduate experience... NSSE results specific to each
institution and identified as such will not be made public except by mutual agreement between
NSSE and the institution.”
This means taking strict measures to protect the identities of the students and institutions that
participate in the program. We have a duty to make certain schools do not have their data used in
ways they did not intend.
In addition, as a non-subsidized, cost-recovery project, the NSSE program may ask researchers
who wish to purchase slices of the data to pay a fair price for the time and effort the NSSE staff
put into collecting and managing the database, and for preparing the data set for purchase.
Policies Regarding the Sharing of NSSE Data
1. NSSE data are made available no sooner than three years after institutional reports are mailed
to participating institutions, typically the first week of August each year. This means that August
of 2009 is the earliest date data from the NSSE 2006 administration will be released.
2. To protect the integrity of the database and the confidentiality of our users, we strip all
student and institutional identifiers from any data set that we share externally.
3. We can include institution-level information (e.g. Carnegie types) but not in a way that
individual schools can be identified directly or indirectly. This includes data provided by the
researchers to be matched with NSSE data before removal of school identifiers. Continuous
variables (e.g., enrollment sizes) must be collapsed into categories so that specific values cannot
be linked back to school names.
4. Data sets provided will be random samples, in a portion not to exceed 1/5 of the existing data
set. Under no circumstance is the entire data set provided to researchers, nor entire sets of
specified subsections of the data (e.g., HBCU’s or selective liberal arts institutions).
5. Researchers are required to acknowledge that NSSE data were used by permission of the
Indiana University Center for Postsecondary Research, and to provide a copy of all papers and
publications utilizing NSSE data to the Center.

206
NSSE Data Sharing Proposal Form
Principal investigator contact information:
__________________________________________________________________ Last Name First Name
___________________________________________________________________________________________ Title
____________________________________________________________________________________________ Institution
____________________________________________________________________________________________ Office
____________________________________________________________________________________________ Address
____________________________________________________________________________________________ City State/Province Zip or Postal Code Country
____________________________________________________________________________________________ Phone Fax
_____________________________________________________________________________________________ Email Date
Please provide the following information in as much detail as possible. Feel free to attach
additional documents in support of the proposal.
1. The purpose and research questions that guide your study.
2. Description of the data file you propose to borrow (items, cases, years, etc.)
3. Other data that you propose to merge or match with the NSSE data.
4. Expected start and end dates for the analysis.
5. The name, title, organization, email, and phone numbers of all researchers that you propose to
have access to the data.

207
Appendix F
Regression Equations for Research Question Three
Stage One Regression Equations
Demographic Variables
Level of Academic Challenge
Y1(LAC) = b0,1 + b1,1X1 + b2,1X2 + b3,1X3 + b4,1X4 + b5,1X5
Active and Collaborative Learning
Y2(ACL) = b0,2 + b1,2X1 + b2,2X2 + b3,2X3 + b4,2X4 + b5,2X5
Student -Faculty Interaction
Y3(SFI) = b0,3 + b1,3X1 + b2,3X2 + b3,3X3 + b4,3X4 + b5,3X5
Enriching Educational Experiences
Y4(EEE) = b0,4 + b1,4X1 + b2,4X2 + b3,4X3 + b4,4X4 + b5,4X5
Supportive Campus Environment
Y5(SCE) = b0,5 + b1,5X1 + b2,5X2 + b3,5X3 + b4,5X4 + b5,5X5
External Variables
Level of Academic Challenge
Y1(LAC) = b0,1 + b6,1X6 + b7,1X7 + b8,1X8
Active and Collaborative Learning
Y2(ACL) = b0,2 + b6,2X6 + b7,2X7 + b8,2X8
Student -Faculty Interaction
Y3(SFI) = b0,3 + b6,3X6 + b7,3X7 + b8,3X8
Enriching Educational Experiences
Y4(EEE) = b0,4 + b6,4X6 + b7,4X7 + b8,4X8
Supportive Campus Environment
Y5(SCE) = b0,5 + b6,5X6 + b7,5X7 + b8,5X8

208
Academic Variables
Level of Academic Challenge
Y1(LAC) = b0,1 + b9,1X9 + b10,1X10
Active and Collaborative Learning
Y2(ACL) = b0,2 + b9,2X9 + b10,2X10
Student -Faculty Interaction
Y3(SFI) = b0,3 + b9,3X9 + b10,3X10
Enriching Educational Experiences
Y4(EEE) = b0,4 + b9,4X9 + b10,4X10
Supportive Campus Environment
Y5(SCE) = b0,5 + b9,5X9 + b10,5X10
Social Variables
Level of Academic Challenge
Y1(LAC) = b0,1 + b11,1X11 + b12,1X12
Active and Collaborative Learning
Y2(ACL) = b0,2 + b11,2X11 + b12,2X12
Student -Faculty Interaction
Y3(SFI) = b0,3 + b11,3X11 + b12,3X12
Enriching Educational Experiences
Y4(EEE) = b0,4 + b11,4X11
Supportive Campus Environment
Y5(SCE) = b0,5 + b11,5X11 + b12,5X12

209
Institutional Variable
Level of Academic Challenge
Y1(LAC) = b0,1 + b13,1X13
Active and Collaborative Learning
Y2(ACL) = b0,2 + b13,2X13
Student -Faculty Interaction
Y3(SFI) = b0,3 + b13,3X13
Enriching Educational Experiences
Y4(EEE) = b0,4 + b13,4X13
Supportive Campus Environment
Y5(SCE) = b0,5 + b13,5X13
Stage Two (Final) Regression Equations
Level of Academic Challenge
Y1(LAC) = b0,1 + b1,1X1 + b5,1X5 + b9,1X9 + b12,1X12
Active and Collaborative Learning
Y2(ACL) = b0,2 + b1,2X1 + b3,2X3 + b5,2X5 + b9,2X9 + b12,2X12 + b13,2X13
Student -Faculty Interaction
Y3(SFI) = b0,3 + b3,3X3 + b5,3X5 + b9,3X9 + b12,3X12 + b13,3X13
Enriching Educational Experiences
Y4(EEE) = b0,4 + b4,4X4 + b5,4X5 + b10,4X10 + b11,4X11 + b12,4X12 + b13,4X13
Supportive Campus Environment
Y5(SCE) = b0,5 + b2,5X2 + b5,5X5 + b9,5X9 + b11,5X11

210
Appendix G
Regression Equations for Research Question Five
Stage One Regression Equations
Demographic variables
Y6(PCNTGRD) = b0,6 + b1,6X1 + b2,6X2 + b3,6X3 + b4,6X4 + b5,6X5
External variables
Y6(PCNTGRD) = b0,6 + b6,6X6 + b7,6X7 + b8,6X8
Academic variables
Y6(PCNTGRD) = b0,6 + b9,6X9
Social variables
Y6(PCNTGRD) = b0,6 + b11,6X11 + b12,6X12
Institutional variable
Y6(PCNTGRD) = b0,6 + b13,6X13