Characteristics and Performance of Existing Load ... · PDF fileCharacteristics and...
50
PNNL-24230 Characteristics and Performance of Existing Load Disaggregation Technologies April 2015 ET Mayhorn GP Sullivan RS Butner H Hao MC Baechler
Transcript of Characteristics and Performance of Existing Load ... · PDF fileCharacteristics and...

PNNL-24230
Characteristics and Performance of Existing Load Disaggregation Technologies
April 2015
ET Mayhorn GP Sullivan
RS Butner H Hao
MC Baechler

PNNL-24230
Characteristics and Performance of Existing Load Disaggregation Technologies
ET Mayhorn GP Sullivan
RS Butner H Hao
MC Baechler
April 2015
Prepared for
the U.S. Department of Energy
under Contract DE-AC05-76RL01830
Pacific Northwest National Laboratory
Richland, Washington 99352


iii
Summary
Non-intrusive load monitoring (NILM) or non-intrusive appliance load monitoring (NIALM) is an
analytic approach used to disaggregate building loads based on a single metering point. This advanced
load monitoring and disaggregation technique has the potential to provide an alternative solution to high-
priced traditional sub-metering and enable innovative approaches for energy conservation, energy
efficiency, and demand response. However, since the inception of the concept in the 1980s, evaluations
of these technologies have focused on reporting performance accuracy without investigating sources of
inaccuracies or fully understanding and articulating the meaning of the metrics used to quantify
performance. As a result, the market for, as well as advances in, these technologies have been maturing
slowly. So far, 18 active companies operating in the United States, United Kingdom, Ireland, and Canada
have been identified to have commercially available or advanced prototypes of NILM devices.
To improve the market for these NILM technologies there has to be confidence that the deployment
will lead to benefits. In reality, every end-user and application that this technology may enable does not
require the highest levels of performance accuracy to produce benefits. Also, other important
characteristics need to be considered, which may affect the appeal of NILM products to certain market
targets (i.e., residential and commercial building consumers) and their suitability for particular
applications. These characteristics include the following: 1) ease of use, that is, the level of
expertise/bandwidth required to properly use the product; 2) ease of installation, that is, the level of
expertise required to install the products along with hardware needs that affect product cost; and 3) ability
to inform decisions and actions, that is, whether the energy outputs received by end-users (e.g., third-party
applications, residential users, building operators, etc.) empower decisions and actions to be taken at time
frames required for certain applications. Therefore, stakeholders, researchers, and other interested parties
should be kept abreast of the evolving capabilities, uses, and characteristics of NILM technologies that
make them attractive for certain building environments and different classes of end-users.
This report describes the performance of a few existing technologies that were evaluated as part of the
Residential Building Stock Assessment (RBSA) owner-occupied test bed operated by the Northwest
Energy Efficiency Alliance (NEEA) to understand the performance accuracy of current NILM products
under realistic conditions. Based on this field study experience, the characteristics exhibited by the NILM
products included in the assessment are also discussed in this report in terms of their ease of use, ease of
installation, and ability to inform decisions and actions. The results of the analysis performed to
investigate the accuracy of the participating NILM products in estimating energy use of individual
appliances are also presented.
Evaluating the performance of disaggregation technologies is not trivial because the performance can
be misunderstood and misinterpreted if objective metrics and protocols are not used. This became very
apparent when examining real-world consumer data versus laboratory-generated or formulated data sets.
Many of the loads being disaggregated by these technologies tend to be diverse and have unique
characteristics. Moreover, vendors tend to have different methods of labeling, identifying, and reporting
energy use for individual loads. After evaluating several candidate metrics, the “percent standard
deviation explained” was finally selected to represent the accuracy of NILM energy estimates because it
is able to quantify how well a NILM device is able to track the energy profiles of the individual loads.
Performance evaluations were then divided into several stages to investigate the sources of inaccuracies
caused by the labeling processes employed by each NILM device and the method used to estimate energy

iv
use. For example, through the process followed, it became evident that if the labeling and identification
were improved in one of the technologies evaluated, the NILM device would do reasonably well (>70%
on average) in estimating the energy use of major appliances that are considered resistive loads and have
simple ON/OFF states. In addition, there are challenges related to recognizing multi-state loads (e.g.,
freezers and refrigerators) as a single load, resulting in lowered performance accuracy in estimating the
energy use of these appliances (<30% on average).
The NEEA field study of existing NILM products has helped to highlight challenges associated with
characterizing the performance of NILM technologies, the sources of inaccuracy, as well as development
opportunities that should be explored help to enable useful applications. However, to eliminate the need
for performing expensive large-scale field demonstrations to evaluate and verify NILM product
performance, common test protocols and metrics are needed. But first, industry and researchers in the
NILM field must converge on performance expectations for NILM. Once the expectations are clear,
metrics and protocols can be developed that 1) are meaningful and of value to potential stakeholders, 2)
empower researchers and developers to advance these technologies to desired levels, and 3) increase
confidence in the product capabilities. As part of this project, Pacific Northwest National Laboratory
intends to address these needs. The next steps are to engage industry stakeholders and an advisory board
to reach agreement on common protocols and metrics that can be used to objectively evaluate
performance and consistently compare appliance disaggregation technologies for different applications or
uses.

v
Acknowledgments
Pacific Northwest National Laboratory’s work with NILMs has been funded by the U.S. Department
of Energy Building America Program, The DOE Emerging Technology Program, the Bonneville Power
Administration, and the State of Washington. We are grateful to these organizations for providing
funding and guidance. The Northwest Energy Efficiency Alliance, and its contractor, Ecotope, provided
access to the Residential Building Stock Assessment data and have helped to identify and resolve data
issues. NILM manufacturers were identified to participate in the study. PNNL thanks them for their
pioneering spirit and willingness to provide data and help in resolving operating and data issues
throughout the study.

vii
Acronyms and Abbreviations
BPA Bonneville Power Administration
CT current transformer
DR Demand Response
ELCAP End-Use Load and Consumer Assessment
kHz kilohertz
MTU measuring transmitting unit
NEEA Northwest Energy Efficiency Alliance
NIALM non-intrusive appliance load monitoring
NILM non-intrusive load monitoring
PLC power-line carrier
PNNL Pacific Northwest National Laboratory
PT potential transformer
RBSA Residential Building Stock Assessment
TED The Energy Detective


ix
Contents
Summary ............................................................................................................................................... iii
Acknowledgments ................................................................................................................................. v
Acronyms and Abbreviations ............................................................................................................... vii
1.0 Introduction .................................................................................................................................. 1.1
2.0 Overview of Disaggregation Approaches ..................................................................................... 2.1
2.1 Signal Acquisition ................................................................................................................ 2.1
2.2 Feature Extraction ................................................................................................................ 2.2
2.3 Appliance Classification ...................................................................................................... 2.2
3.0 Field Study Approach ................................................................................................................... 3.1
3.1 Background on NEEA RBSA Field Homes ......................................................................... 3.1
3.2 Study Homes for NILM Evaluation ..................................................................................... 3.2
3.3 Data Collection ..................................................................................................................... 3.2
4.0 Important NILM Characteristics................................................................................................... 4.1
4.1 Ease of Use ........................................................................................................................... 4.1
4.1.1 Interpreting Outputs .................................................................................................. 4.1
4.1.2 NILM Configuration ................................................................................................. 4.2
4.2 Ease of Installation ............................................................................................................... 4.3
4.2.1 CT Sensors Installed in an Electrical Panel ............................................................... 4.3
4.2.2 Socket Sensors Installed on a Traditional Utility Meter ........................................... 4.4
4.2.3 Smart Meter Data ...................................................................................................... 4.5
4.3 Reporting Frequency ............................................................................................................ 4.5
5.0 Performance Accuracy ................................................................................................................. 5.1
5.1 Performance Accuracy Metrics ............................................................................................ 5.1
5.2 Evaluation of Accuracy and Results .................................................................................... 5.3
6.0 Conclusions and Next Steps ......................................................................................................... 6.1
7.0 References .................................................................................................................................... 7.3
Appendix A − List of Active NILM Vendors ....................................................................................... A.1

x
Figures
2.1 Process of Appliance Disaggregation Using NILM ................................................................ 2.1
4.1 Typical Panel-Based Sensor Installation in Residential Electrical Panel (TED). .................... 4.4
5.1 Refrigerator Energy Profile (over 1 day) for Home 12063. ..................................................... 5.2
5.2 NILM A Home 12063: NILM/Baseline Appliance Correlation Matrices. ............................. 5.5
5.3 NILM A Home 13248: NILM/Baseline Appliance Correlation Matrices. ............................. 5.6
5.4 NILM Furnace/Baseline Refrigerator Energy Profile for Home 12063 .................................. 5.7
5.5 NILM Furnace Blower/Baseline Refrigerator Hourly Energy Profile for Home 12063 ......... 5.8
5.6 NILM Oven/Baseline Dryer Energy Profile for Home 14560 ................................................. 5.9
5.7 NILM Dishwasher/Baseline Electric Resistance Heating Energy Profile for Home 13248 .. 5.10

xi
Tables
5.1 NILM A: Accuracy of Energy Estimates for “As-Labeled” Appliance Pairs ............................. 5.4
5.2 NILM B: Accuracy of Energy Estimates for “As-Identified” Appliance Pairs .......................... 5.4
5.3 NILM A: Accuracy of Energy Estimates for “Relabeled” Appliance Pairs ............................... 5.7


1.1
1.0 Introduction
With the widespread deployment of advanced metering infrastructure, 50 million smart meters were
installed by July 2014, covering approximately 43% of the total households in the United States
(Greentechgrid 2015a). With these smart meters, electricity service providers are able to obtain hourly
and/or 15-minute whole-house−level energy-consumption data from customers. On average, each smart
meter costs about $200 and requires a specialized technician to install it (Hao et al. 2015). Moreover, the
obtained metered data are mostly used for billing purposes, with few additional benefits offered to
residential customers. However, the ability to disaggregate real-time appliance-level power consumption
could have many additional benefits for consumers, electricity service providers, and society for energy
conservation, energy efficiency, and demand response (DR) purposes if it were feasible and cost-
effective. Some example benefits include 1) increased awareness of energy use to empower consumers to
make better decisions; 2) new options for automated commissioning, diagnosis, and fault detection of
residential and small commercial buildings; 3) improved and simplified load studies leading to
identification of specific end-use equipment, facilities, and locations that are candidates for DR and
energy-efficiency programs; and 4) more efficient, cost-effective, and comprehensive quality assurance
programs to verify savings from energy-efficiency measures and DR.
To obtain disaggregated appliance load data, the current practice is to sub-meter by installing a smart
plug or power meter on each major appliance in the residence. However, the typical cost of a smart plug
is about $50 (Hao et al. 2015). In a typical home with 5−10 major appliances, the sub-metering cost is up
to $500, not including the additional cost of other hardware (e.g., gateway), software needed for providing
services (e.g., data analytics), or labor necessary to install the meters. For this reason, the cost of
traditional sub-metering is economically untenable for residential and commercial buildings. A more
cost-effective monitoring approach is needed to capture the aforementioned benefits associated with such
a widespread metering infrastructure. In addition to reduced cost, a viable metering device should be
user-friendly, easy to install, and informative based on the specific application(s) for which it is being
used. In this context, informative means whether disaggregated energy use reported to users (e.g., third-
party applications, residential users, building operators, etc.) is frequent and accurate enough to empower
reasonable decisions and actions to be taken.
Non-intrusive load monitoring (NILM) or non-intrusive appliance load monitoring (NIALM) is an
analytic approach used to discern individual loads based on a single metering point as opposed to using
traditional metering infrastructure at each appliance. NILM technologies have the potential to be cost-
effective, because of the reduced need for physical metering infrastructure. These technologies also have
the potential to exhibit all of the aforementioned characteristics, which makes them a viable alternative to
sub-metering. However, since the inception of the NILM concept in the 1980s, evaluations of these
technologies have focused on reporting performance accuracy without investigating sources of
inaccuracies or fully understanding and articulating the meaning of the metrics used to quantify
performance. As a result, the market for, as well as, advances in these technologies have been slowly
maturing. At this time, 18 active companies operating in the United States, United Kingdom, Ireland, and
Canada have been identified to have commercially available or advanced prototypes of NILM (see
Appendix A). Although a number of NILM products are now commercially available to homeowners and
facility managers, their capabilities in terms of performance accuracy and suitability for specific
applications are not yet understood. To stimulate the market for NILM as well as technological

1.2
advancements, stakeholders and other interested parties should be kept aware of the evolving capabilities
of NILM products and their readiness to be used for specific applications.
In 2013, Pacific Northwest National Laboratory (PNNL) and Northwest Energy Efficiency Alliance
(NEEA) initiated a field study to evaluate the performance of existing NILM products in residential
settings. The study was conducted by leveraging existing sub-metering infrastructure in the Residential
Building Stock Assessment (RBSA) owner-occupied testbed that is located in the Pacific Northwest and
operated by NEEA. At the time, the six candidate NILM products identified and acquired for the study
were available for sale or at an advanced stage of development, capable of having their hardware safely
installed within the field homes, and could return disaggregation results in a format needed for analysis.
As a result of the field testing experience, PNNL and NEEA gained important insights into the
performance accuracy of the studied NILM technologies and the NILM characteristics that appeal to
stakeholders.
The purpose of this report is to present data and information about the characteristics and
performance accuracy of commercially available NILM products included in the field study. But first, an
overview of NILM disaggregation approaches is given in Section 2.0. Section 3.0 summarizes the field
study conducted to evaluate the performance accuracy of the acquired NILM products. The
characteristics of the NILM technologies evaluated in the assessment are then discussed in Sections 4.0,
in terms of their ease of use, ease of installation, and reporting frequency. Performance accuracy results,
based on the field study are presented in Section 5.0. Conclusions and next steps are presented in Section
6.0.
2.1
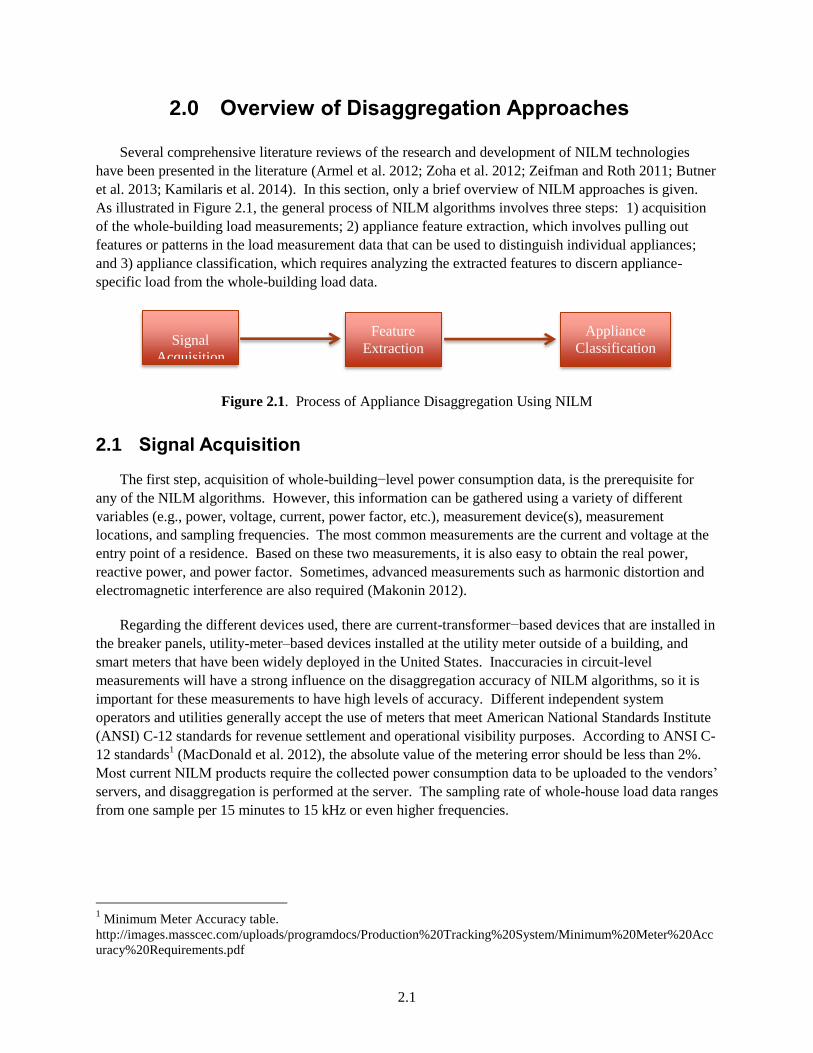
2.0 Overview of Disaggregation Approaches
Several comprehensive literature reviews of the research and development of NILM technologies
have been presented in the literature (Armel et al. 2012; Zoha et al. 2012; Zeifman and Roth 2011; Butner
et al. 2013; Kamilaris et al. 2014). In this section, only a brief overview of NILM approaches is given.
As illustrated in Figure 2.1, the general process of NILM algorithms involves three steps: 1) acquisition
of the whole-building load measurements; 2) appliance feature extraction, which involves pulling out
features or patterns in the load measurement data that can be used to distinguish individual appliances;
and 3) appliance classification, which requires analyzing the extracted features to discern appliance-
specific load from the whole-building load data.
Figure 2.1. Process of Appliance Disaggregation Using NILM
2.1 Signal Acquisition
The first step, acquisition of whole-building−level power consumption data, is the prerequisite for
any of the NILM algorithms. However, this information can be gathered using a variety of different
variables (e.g., power, voltage, current, power factor, etc.), measurement device(s), measurement
locations, and sampling frequencies. The most common measurements are the current and voltage at the
entry point of a residence. Based on these two measurements, it is also easy to obtain the real power,
reactive power, and power factor. Sometimes, advanced measurements such as harmonic distortion and
electromagnetic interference are also required (Makonin 2012).
Regarding the different devices used, there are current-transformer−based devices that are installed in
the breaker panels, utility-meter–based devices installed at the utility meter outside of a building, and
smart meters that have been widely deployed in the United States. Inaccuracies in circuit-level
measurements will have a strong influence on the disaggregation accuracy of NILM algorithms, so it is
important for these measurements to have high levels of accuracy. Different independent system
operators and utilities generally accept the use of meters that meet American National Standards Institute
(ANSI) C-12 standards for revenue settlement and operational visibility purposes. According to ANSI C-
12 standards1 (MacDonald et al. 2012), the absolute value of the metering error should be less than 2%.
Most current NILM products require the collected power consumption data to be uploaded to the vendors’
servers, and disaggregation is performed at the server. The sampling rate of whole-house load data ranges
from one sample per 15 minutes to 15 kHz or even higher frequencies.
1 Minimum Meter Accuracy table.
http://images.masscec.com/uploads/programdocs/Production%20Tracking%20System/Minimum%20Meter%20Acc
uracy%20Requirements.pdf
Signal
Acquisition
Feature
Extraction
Appliance
Classification

2.2
2.2 Feature Extraction
Step two, feature extraction, is a process of extracting features or signatures from the received signal.
There are two main classes of appliance power signatures or features, steady-state and transient. Both
approaches refer to identifying changes in the operation when an appliance modulates from one
operational state or level to another, but the two approaches differ in what data they focus on. The
steady-state appliance signature is one of the most widely used signatures in literature (Hart 1992; Wong
et al. 2013). It refers to step changes in steady-state active and/or reactive power consumption levels. It
is easy to use, does not require fast sampling data, and works well on large ON/OFF appliances such as
water heaters and air-conditioners. The transient appliance signature refers to unique features such as the
shape, duration, size, and harmonics of transient power fluctuations of appliances that can be used to
distinguish different appliances. These short-term, transient fluctuations in power consumption occur
immediately after changes in an appliance’s operating state (e.g., from the OFF to ON state) and before a
new steady-state is reached. Although the transient analysis gives more precise information, extracting
this type of signature requires high-frequency data sampling. As a result, more resources are needed to
construct and maintain a complex transient signature database. Besides the aforementioned two
signature-based approaches, hybrid approaches have been proposed, which use a combination the steady-
state and transient signatures for appliance disaggregation.
2.3 Appliance Classification
The final step, appliance classification, refers to analyzing features extracted from the whole-building
load data to categorize specific appliances. In general, the NILM algorithms can be categorized as either
event-based or non-event-based. Event-based NILM algorithms refer to approaches that rely on edge
detection algorithms to detect occurrences of events, such as an appliance turning ON/OFF or a change in
operating mode. The extracted features around the neighborhood of the event points are then classified
using supervised machine learning algorithms such as support vector machines, artificial neural networks,
Bayes classifier, and k-nearest neighbor clustering (Wong et al. 2013). Event-based algorithms typically
require online or offline training processes to build a library for appliances from a priori labeled appliance
power consumption data to train the appliance classifier. The training processes could need sub-metering
or sophisticatedly designed experiments that might be labor-intensive and costly.
The unsupervised learning techniques, commonly used by non-event-based methods, have recently
become popular in the NILM field and are more appealing and scalable than the supervised machine
learning techniques from a practical point of view. However, unsupervised learning classifiers have not
been implemented in a standard way in the literature (Makonin 2012). These algorithms do not rely on
edge detection algorithms, but take every sample of the aggregate power signal received into account to
infer individual loads (Wong et al. 2013). This causes the non-event-based method to be more
computationally intensive than event-based methods. Although the algorithms are less computationally
efficient, unsupervised machine learning methods (e.g., Hidden Markov Model) do not require prior
knowledge of load behavior or patterns, so the process involving load libraries can be avoided. This
makes them less labor-intensive and more cost-effective. Instead, the appliance loads are directly
clustered and disaggregated based on whole-house power data collected.

3.1
3.0 Field Study Approach
In 2013, PNNL and NEEA initiated a field study to characterize the performance of NILM
technologies under “real-world” conditions. The study was conducted by leveraging existing sub-
metering infrastructure in the Residential Building Stock Assessment (RBSA) owner-occupied testbed
located in the Pacific Northwest and operated by NEEA. For the evaluation, PNNL and NEEA initially
identified six candidate NILM products that were either already available for sale or at a sufficiently
advanced stage of development, capable of having their hardware safely installed within the RBSA field
homes, able to collect data over the internet, and able to return the disaggregation results for analysis.
Four to six of each of the six identified NILM technologies were acquired and installed in a total of 30
homes.
As mentioned before, the NILM field is highly volatile as vendors continue to search for new ways to
improve the technology and product configurations, expand market targets, and enable new applications.
In addition, many of the companies are small startups with limited resources that require focus and
direction. During the field study period, three of the six NILM companies found it necessary to focus on
revamping and implementing major upgrades to their product or change company direction to expand
their market base. Because many commercial products are set up to output summaries to the users
through a dashboard, arrangements were initially made with the participating vendors to gain access to
NILM disaggregation outputs. This meant some of the NILM vendors needed to invest time and
resources in converting the data from their software package to a usable format. Therefore, when the
three companies made a decision to change directions, they also found it necessary to withdraw from the
field assessment, because they were unable to continue providing support.
Three vendors remained throughout the entire study and are denoted as Vendors A, B, and C herein.
Their corresponding NILM products are denoted as NILM A, NILM B, and NILM C, respectively.
Vendor A provided disaggregation results for four homes at 5-minute intervals over the course of the field
study. Vendor B provided results for five homes, but declined to provide outputs at less than 24-hour
intervals. Therefore, it was only possible to perform a partial analysis of its product. Vendor C
participated using a developmental technology and did not have a process in place to quickly disaggregate
and return the necessary results for the analysis. Consequently, a complete set of results could only be
provided for one home and partial results for another. Also, data could only be provided at 24-hour
intervals given the time constraints. Given the limited data obtained, the developmental product was not
evaluated. The subsequent sections provide additional background on the NEEA RBSA field homes, the
specific homes that were selected for participation in this NILM evaluation, and the characteristics of the
data and data collection process.
3.1 Background on NEEA RBSA Field Homes
The End-Use Load and Consumer Assessment (ELCAP) project, which ran from 1983 to 1990, was a
major end-use data collection project undertaken by Bonneville Power Administration (BPA) to support
data needs for end-use load research, load management program planning and applications, load
forecasting, and to identify resource conservation potential from new demand-side technologies or
programs. ELCAP data sets, now more than 20 years old, are becoming increasingly dated, and
consequently may no longer be as representative as they once were. To better understand new and
emerging residential load profiles in the Pacific Northwest, the NEEA conducted the RBSA research
3.2
study from 2011 to late 2014 to expand the existing ELCAP data set. In addition, RBSA collected data
about the individual, appliance-specific load shapes, the occupant characteristics of residences, and fuel
choices in the Pacific Northwest. The RBSA included billing analysis and field survey information for
more than 1,400 homes that represent the diverse climates, building practices, and housing types across
the Pacific Northwest region. As part of the RBSA, a representative sample of 100 homes, chosen
throughout the region, were equipped with energy sub-metering equipment and equipment necessary to
measure water flows, interior temperature and relative humidity, and lighting levels (Baylon et al. 2011).
These homes had their energy use monitored on a 5-minute basis over a 2-year period between 2012 and
2014.
3.2 Study Homes for NILM Evaluation
Of the 100 monitored homes from the RBSA NEEA testbed, 30 homes were selected to receive
NILM technologies as part of this NILM evaluation. NEEA chose the 30 homes because their
demographics, building characteristics, and appliance inventories were representative of homes found in
the Pacific Northwest region. Because the intention of this NILM study was to assess technology
performance under “real-world” conditions with the homeowners behaving as they normally would,
homeowners received no instructions, cues, or incentives to alter their behavior following the installation
of a NILM technology. Detailed descriptions of each home, including occupant(s), appliance, and
structure details, are available for each of the field homes in the report by (Baylon et al. 2011).
Each individual NILM technology was installed in approximately four to six individual homes
between late 2013 and early 2014, and left in place to collect data until the RBSA homes were
decommissioned in September 2014. Each home in the field study received only one NILM technology
during installation to ensure that there were no interactions between technologies. Consequently, the
official study period for some technologies began as early as late October 2013, while others were not
installed until mid-January 2014. This resulted in some of the sites having data from an earlier date than
others. In a few rare instances it was necessary to take both the NILM and the sub-metering equipment in
individual field homes offline for one or more days. The dates of any outages were excluded from the
study analysis, including days that may have only had a partial outage.
3.3 Data Collection
Within each home most electrical loads were equipped with metering equipment. The sub-metered
data recorded average power consumption (in watts) for electrical loads present within each home over a
5-minute interval. These loads typically included heating, ventilation, and air-conditioning systems, hot-
water heaters, appliances, televisions and television accessories, and computers and computer accessories,
and may also have included other loads when present. Loads that were not included in the metering (but
are included in the home’s overall load) include small consumer electronics (i.e., hair dryers),
infrequently used devices (i.e., portable electric space heaters), and other portable, miscellaneous loads.
While lighting electrical data were collected during the RBSA, they were collected separately from the
rest of the home’s appliances and were not available at the time of this study. Home electrical use data
collected by the sub-metering equipment were gathered remotely by NEEA’s contractor, Ecotope, over a
wireless 3G cellular network over the course of the study. These data for the 30 homes included in the
NILM evaluation were provided to PNNL to use as baseline data.
3.3
Data collected by the NILM devices were initially gathered by the respective hardware at each site
and uploaded to the company’s respective cloud-based server over the RBSA 3G network. Once the data
from the homes were received, the server-based algorithms attempted to both identify what appliance
loads were present in each home, as well as disaggregate the electricity consumed by each respective load
(in kilowatt hours). The whole-house and appliance-level energy-consumption data were then provided to
PNNL by each of the NILM vendors in comma-separated values (.csv) formatted files. Of the three
NILM technologies in the study, disaggregation results for two of them were reported at 24-hour intervals
(despite collecting the data at 1-minute intervals). Only one company reported results at 5-minute
intervals. In instances where the NILM results were reported at 24-hour intervals, the 5-minute baseline
data were aggregated up to the 24-hour period to facilitate comparison and analysis.

4.1
4.0 Important NILM Characteristics
To accelerate the market for NILM technologies, there has to be confidence that the deployment will
lead to benefits. This technology is still maturing and we need to be able to identify applications and
environments where existing NILM technologies are useful now, as well as, areas of research and
development that can help advance capabilities even further for future use. As mentioned previously, a
number of characteristics are important to consider when evaluating the efficacy or appropriateness of a
given NILM technology for a given application. These characteristics are ease of use, ease of installation,
and reporting frequency. For example, a residential, consumer-based NILM should be easy to use and
install, whereas a residential NILM that is operated by and intended primarily for a utility audience, can
potentially have more complicated installation and use requirements.
4.1 Ease of Use
There are several ways an end-user may be required to interact with a NILM technology. End-users
may include, but are not limited to, homeowners, commercial building owners, commercial building
occupants, commercial building operators, energy managers, electricity service providers, and other third-
party applications (i.e., building automation systems, diagnostic applications). These different types of
end-users will have different capacities for interacting with the product and different capabilities for
interpreting the disaggregated appliance-level energy use data in order to determine actions to be taken.
In the following subsections, the necessary interactions with each technology involved in the NEEA field
study and end-users are discussed, in addition to, possible pros and cons for different end-users.
4.1.1 Interpreting Outputs
All three technologies included in the NEEA field study were designed for residential users and
feature web-based dashboards for NILM configuration and displaying disaggregation results. Through
these dashboard interfaces, a user is presented with disaggregation information at a broad and generic
level. Examples include daily power use of appliances being tracked, historical trends for individual
appliances or the home’s overall energy consumption, and the cost in dollars for appliance and home
energy use over a day, week, or month. Such information is significantly more informative and
actionable than the information that is typically presented to consumers on a monthly utility bill. By
presenting more granular appliance-level data and historical information, users can be kept cognizant of
the relative energy use of different appliances and actions having the biggest impact on their overall
utility bill. As a result, homeowners can make more conscious decisions regarding the operation of their
homes. In addition, homeowners can compare current appliance energy usage with historical information
to understand how changes in behavior or appliance age may be affecting energy use and take corrective
action. With this type of granular feedback alone, residential consumers have the potential to achieve
energy savings of up to 12% according to some studies (Ehrhardt-Martinez et al. 2010; Armel et al. 2013;
Greentechgrid 2015b). It is also projected that energy savings of greater than 20% could be obtained if
more insightful and actionable information were provided to the homeowners, such as alerting them to a
particularly energy-intensive appliance, identifying appliances that may be faulty or failing, and
identifying specific energy-saving steps.

4.2
The NILM A product was designed with both the average homeowner and more sophisticated users in
mind. The users of this product have the option to export disaggregated appliance data to standard file
types (e.g., ASCII, Excel, etc.), as well as view graphical and summary reports via a user interface. The
added capability to export the disaggregated results as time-stamped energy-use data files is of greater
interest for commercial building operators or other parties responsible for managing multiple buildings.
Exportable data, made available in such a flexible format, may allow for the data to be used by existing
building automation control systems to better manage building efficiency. Also, the data may be easy to
use and leveraged for more in-depth analysis by third-party energy managers and applications for
purposes of reducing energy use. However, the raw disaggregated appliance data are beyond what typical
single-family homeowners are willing or able to analyze and interpret. Because the software is loaded
and run locally, the users themselves are also responsible for storing these data, which may also be
beyond the capabilities of most individual homeowners, especially if records are kept over a prolonged
period of time.
4.1.2 NILM Configuration
Appliance-level disaggregation requires a method to assist the algorithm in identifying loads and
distinguishing individual appliances, which can be quite diverse from one building to another. Several
approaches can be used to configure the algorithms for detecting and labeling loads. One example
approach includes requesting the user to input limited information so that the loads in the building can be
inferred by the NILM algorithm. Another approach is manual user training where a user is required to
follow a sequence of steps to train the algorithm to identify each specific load and load signature.
Another approach is to assume a certain level of user understanding of the loads in a building and rely on
the users to identify specific loads by having them observe load profiles displayed through a dashboard.
Depending on the configuration setup requirements of a user, the average homeowner may or may not
have the time, interest, or necessary expertise to configure such a device to identify the loads correctly. In
addition, some commercial building operators or managers of multiple buildings may find it cost-
prohibitive to assign one or more workers to the task.
All three of the NILM technologies examined in the NEEA field study were generally designed to
minimally engage with end-users, so they were set up to automatically recognize load features or patterns
to disaggregate and label loads with little or no information requested from the user. This avoids
requiring the users to conduct time-intensive training sessions and makes it more likely that the NILM
will actually be installed and used. The NILM C device incorporates a web-based interface for presenting
load disaggregation results to end-users with no configuration needs beyond those necessary to set up and
connect the data gateway with the central cloud server. NILM B device also included web-based
services, where the end-users are expected to respond to a brief survey to provide initial high-level details
about their building and how it is typically used (e.g., number of people living in it, age of the building,
etc.) to infer the loads that might exist on the premises. The NILM A technology offered a locally
installed software program, which was designed for commercial and residential users. For configuration
purposes, the user was requested to specify the building type (commercial, residential: single-family, or
residential: multi-family) and to select appliances that exist in the facility from a list after being presented
with the probabilities of certain appliances being present based on the building type selected. This
information is likely requested to assist the NILM devices in labeling and classifying loads by precluding
loads that are not present within the facility. For this product, the user has to confirm the list of
appliances present, otherwise defaults are chosen. Selecting the wrong appliances or having a set of

4.3
appliances or patterns not represented in the NILM load library could cause degradation in the
performance of this NILM device.
At present, the NILM A and B devices examined in this report requested high-level information from
users at the time of installation. While neither of these products included required manual user training
during initial setup of the technology, this method of engaging the user for training disaggregation
algorithms may also be most useful and acceptable as long as the instructions given are simple for
targeted users to follow.
4.2 Ease of Installation
The whole-building load consumption data used for load disaggregation mainly come from one of
three measurement sources: 1) current transformer (CT) sensors installed within the electrical breaker
panel inside the home, 2) socket sensors installed on traditional utility meter outside the premise, or 3)
cloud-based smart meter data. Each source would need to be connected to a gateway device (or data-
logging device) for data collection and transmission. Depending on the measurement source the NILM
technology relies on, the devices needed to obtain real/reactive power measurements may or may not be
already installed at appropriate locations. This metering hardware may also be included with the NILM
or may need to be purchased from a third-party vendor. For these reasons, the additional hardware needs
and installation requirements for each case are two key factors that affect the cost of these NILM
products, and in turn influence the consumers’ willingness to purchase them. The NILM A device,
included in the NEEA field study, relies on measurement source 1. The NILM B device is a software-
only solution; options are offered to allow measurements to be obtained from source 1 or 3. This allows
whole-house power consumption data to be collected from either a panel-installed meter purchased from a
third-party vendor or a pre-existing electric-utility smart meter. The NILM C device collects
measurements based on source 2. The following sections provide a detailed description of the hardware
needs and installation requirements for each of the three types of NILM measurement sources.
4.2.1 CT Sensors Installed in an Electrical Panel
Most of the NILM vendors rely on electrical metering hardware that is installed in the electrical
panel. This type of NILM product requires installation of properly sized CTs around the two service
feeds to electrical panel, where the electrical mains connect to the breaker bus bars. In addition to the
CTs, a voltage measurement device is needed to make phase-accurate power measurements. This voltage
measurement device is sometimes referred to as a potential transformer (PT). A photograph of the CT
sensors as installed in a home, are included as Figure 4.1. For this type of NILM device, a certified
electrician is required to install the CTs at the power mains of the breaker panel and a measuring
transmitting unit (MTU) or gateway that also contains the PTs needed. The MTU is used to transmit
measurements collected to a communication hub in the building, through a building’s electrical wiring,
using power-line carrier (PLC) communication. This allows for measurement data to be collected and
uploaded by the NILM platform.

4.4
Figure 4.1. Typical Panel-Based Sensor Installation in Residential Electrical Panel (TED). CTs are
installed at top on service feed; the MTU resides in the bottom right of panel.
4.2.2 Socket Sensors Installed on a Traditional Utility Meter
Some of the NILM vendors employ a meter-base or “socket” type sensor. The advantage of this type
of NILM device is that metering is done outside the home on the “utility-side” of the meter and does not
require access to the customer’s electrical breaker panel. However, the installation of the socket sensor
requires the serving electric utility to be engaged in the process. The socket sensor is designed to reside
in between the utility meter and the meter base. This device contains all necessary components and
electronics (CTs, PTs, and gateway) to measure and convey active/reactive power measurements. The
installation process is initiated by the utility’s metering staff to remove the existing meter and then
confirm proper configuration of the socket sensor with that of the meter base. Of concern, is making
certain the connection jaws in the meter base are compatible with the socket sensor. Once confirmed, the
NILM socket meter is installed followed by the existing electrical utility meter. The utility representative
then verifies successful installation by ensuring the existing meter is powered properly and is recording
the expected readings.
Once the hardware is installed, the NILM devices that depend on CT sensors installed at the breaker
panel or on socket sensors placed at the utility meter have similar configurations for data collection and
access. In most cases, these NILM products have a means to connect to an existing wireless network

4.5
within the home for data uploading and eventual customer access. Such a wireless network is required for
data collection and transmission on these devices. Therefore, if the home does not have an existing
wireless network that can be used for such a purpose, a dedicated wireless network may need to be set up.
In some cases, this connection is through a direct wireless interface with the home’s wireless router, while
in other cases data are transferred from the socket sensor via the home’s electrical wiring (a technology
known as power-line carrier) to a gateway, from which the router is accessed. A properly connected
sensor enables data to be uploaded at predetermined frequencies, from once a minute or hour, to once a
day. As these data are uploaded, they are typically warehoused in remote data servers from which NILM
software or cloud-based platforms can access the data to perform appliance disaggregation and report
findings to end-users.
4.2.3 Smart Meter Data
With the advent of electric-utility smart meters, utility-derived interval data have become a source of
whole-building power consumption data for NILM products. Typically, these smart meters are the
property of the serving electric utility and thus are installed according to their specifications by their staff.
The data collected by the utilities are generally hourly or 15-minute sampled energy-consumption data.
Access to data is authorized based on an agreement between the utility, the utility account holder, and/or
the NILM vendor. Data security, privacy, and access portals have all come under greater scrutiny in
recent years because of increased cyber-attack activities. As such, this path to full customer data access
for third-party NILM analysis can be a challenge. On the other hand, if smart meter data can be used no
additional metering infrastructure is required, which makes such an approach attractive from a cost-
effectiveness and simplicity perspective.
Some NILM products employ another approach that relies on the utility smart meter, but utility-
collected meter data are not used. Instead, a gateway is used to enable frequent communication between
smart meters, which are typically compatible with ZigBee communication protocols, and a cloud-based
NILM platform. Currently, NILM platforms can also be permitted to access a consumer’s utility smart
meter through an agreement between the utility, the utility account holder, and/or the NILM vendor.
Using such an intermediate device enables direct sampling of the meter readings at a faster rate than the
utility-collected data (as fast as once every second). For this reason, this approach may be suitable for
more applications requiring more granular measurement data.
Compared to the above two types of NILM products, the advantage of smart meter approaches is that
there is no need to install extra sensors for load disaggregation. Therefore, it is much less labor-intensive,
and does not require coordination with a certified electrician or utility metering electrician for installation
if the smart meter is already installed on the home. Because of the minimal equipment and installation
cost, the cost of these types of NILM devices will most likely be lower than the other products using CT
or socket sensors.
4.3 Reporting Frequency
Another key characteristic that needs to be considered when deciding whether a disaggregation
technology is appropriate for a particular application is the reporting frequency or the time interval at
which data results are available from the NILM device. Current NILM vendors offer solutions with
output rates of 1 second or slower. However, most are limited to 5- to 15-minute outputs.

4.6
Because all applications do not demand the highly granular energy-use data, these technologies are
not expected to report estimates at the highest possible granularity. Therefore, NILM technologies can be
mapped to a particular range of applications depending on the limitations on output rate of energy-
consumption estimates, in addition to performance accuracy and the other aforementioned important
characteristics. For example, data analytics, for providing energy conservation advice to consumers, may
only need 15-minute to hourly energy outputs of disaggregation algorithms. DR applications for
delivering grid services at very short-term time scales (e.g., seconds) and long-term time scales (e.g.,
hours) may require 1-second and minute-by-minute energy information, respectively, for measurement
and verification and/or automated control feedback needs. Providing outputs at multiple time frames
could increase the practicality of a single NILM device being applied to a wide range of applications to
inform decisions and monitor and verify performance. Or different NILM devices could be developed to
meet these specialized needs at more appropriate price points for the given market segment.

5.1
5.0 Performance Accuracy
Evaluating the performance of NILM technologies is not trivial because the performance could be
misunderstood and misinterpreted if objective metrics and protocols are not used. Many of the loads
being disaggregated by these technologies tend to be diverse and have unique characteristics. For
example, multi-state loads such as refrigerator/freezers operate with compressors that cycle ON and OFF
frequently to regulate compartment temperature. In addition, the defrost mechanism included draws more
than two times the power of the compressor, but the defrost mechanism cycles less frequently (i.e., once
every 6 to 24 hours depending on the design). There is a chance that a NILM device could label and
represent the defrost mechanism and the compressor of a typical residential refrigerator/freezer in one of
the following ways: 1) as a composite appliance, 2) as two separate appliances, 3) as a part of another
appliance profile, or 4) not at all. In scenarios 2 and 3, it is possible that the NILM device has accurately
represented the energy consumption of both appliances but just mislabeled them. In scenario 4, the NILM
device is unable to isolate either function. This example illustrates that there are many factors that should
be considered when describing the “accuracy” of NILM, and multiple protocols may be required to
evaluate performance. To effectively identify the appropriate evaluation protocols, industry and other
researchers in the field must first converge on performance expectations for NILM devices, because any
defined protocols should evaluate the NILM device performance against an ideal or expected outcome.
For example, should disaggregation performance be penalized if scenarios 2 and 3 occur? If so, then
how? After the expectations are defined, a set of standardized metrics and protocols for characterizing
NILM device performance can be developed to objectively compare the technologies. Recognizing the
expectations will allow us to develop metrics and protocols that are meaningful and of value. In addition,
researchers and NILM developers will have specific goals and objectives for advancing technologies in a
unified way. In evaluating the NILM technologies included in the NEEA field study, the goal was to
understand how well these products are able to track and estimate the energy use of individual appliances
and identify sources of inaccuracy in performance. The specific metrics used in this evaluation and the
results are presented in the ensuing sections.
5.1 Performance Accuracy Metrics
Because of the nascent nature of NILM technologies, at the time of this assessment there was not yet
any consensus or broadly recognized methodology for measuring the accuracy of load disaggregation
produced by these technologies. An initial literature review (Butner et al. 2013) found that a consistent
set of NILM metrics for performance evaluation had not been previously documented in the existing
literature. Additional interviews with product manufacturers also indicated that industry members had not
yet converged upon a single set of methodologies for evaluating the performance of NILM technologies,
nor had they disclosed any ongoing efforts to develop one. To conduct the analysis proposed under this
study, it was necessary to develop a preliminary set of metrics that could be used to gauge the accuracy of
load disaggregation. These metrics needed to be compatible with the nature and structure of the data
outputs generated by the NILM products.
PNNL had previously developed a set of candidate metrics based on its literature review (Butner et al.
2013). However, when applying these metrics to the NILM and baseline (measured) energy-use data
obtained from the field study, it was discovered that the metrics were unable to capture real-world

5.2
performance attributes that were rather obvious visually. For example, the following candidate metric
(from Butner et al 2013) was tested to determine NILM accuracy in estimating energy use:
1
measured energy NILM energyenergy accuracy
measured energy
(5.1)
where measured energy is the energy measured by meter (watt-hours) over the defined study period and
NILM energy is energy estimated by NILM (watt-hours) over the defined study period
For one home (12063), the energy accuracy of the NILM was computed to be 72.4% for a
refrigerator, based on a 24-week study period. Figure 5.1 shows the NILM and baseline energy-use
profiles for the refrigerator in the home over a 24-hour period. From this figure, it is clear that the NILM
device is not tracking the energy use of a refrigerator even though the energy accuracy was determined to
be very high. In this case, the NILM device was actually reasonably tracking the energy-use profile of a
hot-water heater. Because the water heater has large energy draws over a short duration that are
comparable to the total energy consumption of a refrigerator over a longer term, the energy accuracy
metric in Equation (5.1) could be misinterpreted if it were used to convey the NILM device performance.
Therefore, the energy accuracy metric is an unsuitable metric for describing NILM device performance in
accurately representing energy use of individual appliances.
Figure 5.1. Refrigerator Energy Profile (over 1 day) for Home 12063.
After considering several metrics, the percent (%) standard deviation explained by Nau (2015) was
chosen to represent the accuracy of energy estimation,
2% standard deviation explained = 1 1 r
(5.2)
and
5.3
2
2
21
ii
i
Y Yr
Y Y
(5.3)
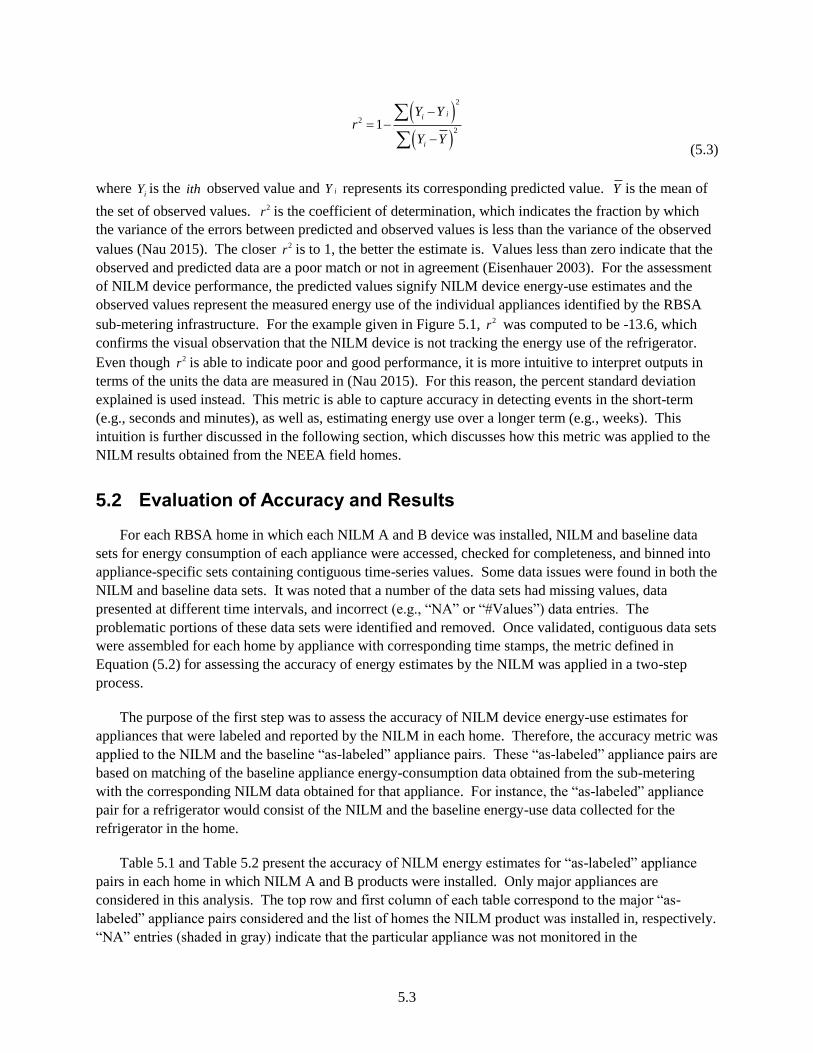
where iY is the ith observed value and iY represents its corresponding predicted value. Y is the mean of
the set of observed values. 2r is the coefficient of determination, which indicates the fraction by which
the variance of the errors between predicted and observed values is less than the variance of the observed
values (Nau 2015). The closer 2r is to 1, the better the estimate is. Values less than zero indicate that the
observed and predicted data are a poor match or not in agreement (Eisenhauer 2003). For the assessment
of NILM device performance, the predicted values signify NILM device energy-use estimates and the
observed values represent the measured energy use of the individual appliances identified by the RBSA
sub-metering infrastructure. For the example given in Figure 5.1, 2r was computed to be -13.6, which
confirms the visual observation that the NILM device is not tracking the energy use of the refrigerator.
Even though 2r is able to indicate poor and good performance, it is more intuitive to interpret outputs in
terms of the units the data are measured in (Nau 2015). For this reason, the percent standard deviation
explained is used instead. This metric is able to capture accuracy in detecting events in the short-term
(e.g., seconds and minutes), as well as, estimating energy use over a longer term (e.g., weeks). This
intuition is further discussed in the following section, which discusses how this metric was applied to the
NILM results obtained from the NEEA field homes.
5.2 Evaluation of Accuracy and Results
For each RBSA home in which each NILM A and B device was installed, NILM and baseline data
sets for energy consumption of each appliance were accessed, checked for completeness, and binned into
appliance-specific sets containing contiguous time-series values. Some data issues were found in both the
NILM and baseline data sets. It was noted that a number of the data sets had missing values, data
presented at different time intervals, and incorrect (e.g., “NA” or “#Values”) data entries. The
problematic portions of these data sets were identified and removed. Once validated, contiguous data sets
were assembled for each home by appliance with corresponding time stamps, the metric defined in
Equation (5.2) for assessing the accuracy of energy estimates by the NILM was applied in a two-step
process.
The purpose of the first step was to assess the accuracy of NILM device energy-use estimates for
appliances that were labeled and reported by the NILM in each home. Therefore, the accuracy metric was
applied to the NILM and the baseline “as-labeled” appliance pairs. These “as-labeled” appliance pairs are
based on matching of the baseline appliance energy-consumption data obtained from the sub-metering
with the corresponding NILM data obtained for that appliance. For instance, the “as-labeled” appliance
pair for a refrigerator would consist of the NILM and the baseline energy-use data collected for the
refrigerator in the home.
Table 5.1 and Table 5.2 present the accuracy of NILM energy estimates for “as-labeled” appliance
pairs in each home in which NILM A and B products were installed. Only major appliances are
considered in this analysis. The top row and first column of each table correspond to the major “as-
labeled” appliance pairs considered and the list of homes the NILM product was installed in, respectively.
“NA” entries (shaded in gray) indicate that the particular appliance was not monitored in the

5.4
corresponding home. “ND” entries (shaded in yellow) denote cases where the particular appliance was
monitored in the home, but was not detected by the NILM. As mentioned previously in Section 5.1, 2r
and hence the (%) standard deviation explained metric used, can be negative if the observed (baseline
data) and predicted (NILM data) are poorly correlated. The negative values computed for the appliance
pairs in each home are reported as 0% in Table 5.1 and Table 5.2 and are in a red font. All other entries
are the computed accuracy values for the appliance pairs in each home.
Table 5.1. NILM A: Accuracy of Energy Estimates for “As-Labeled” Appliance Pairs (4/19/14 to
10/29/14)
Clothes
Dryer
Water
Heater Refrigerator Furnace Dishwasher
Clothes
Washer Oven Freezer ER Heat
Home
12063 0% 85.1% 0% 0% 0% ND NA NA ND
Home
23384 12.5% 0% 0% NA ND 0% 5.6% NA ND
Home
13248 77.1% ND 0% NA NA ND 0% NA ND
Home
14560 ND ND 24.9% ND 0% ND NA 9.7% NA
ER = electric resistance; ND = appliance was not detected by the NILM in the home; NA = appliance was not
available in the home.
Table 5.2. NILM B: Accuracy of Energy Estimates for “As-Identified” Appliance Pairs (12/25/13 to
7/23/14)
Clothes
Dryer
Water
Heater Refrigerator Dishwasher
Clothes
Washer Oven Freezer
ER
Heat
Home
10040 ND 0% 0% NA NA ND NA 13.0%
Home
12507 NA 0% 0% NA NA NA NA 25.7%
Home
12994 0% NA 0% NA NA NA NA NA
Home
14284 NA 0% 0% NA NA NA NA NA
Home
14577 NA 48.3% 0% NA NA NA NA NA
ER = electric resistance; ND = appliance was not detected by the NILM in the home; NA = appliance was not
available in the home.
Evident in these tables, are several poor correlations in “as-labeled” appliance pairs, signifying that
both NILM technologies are poorly tracking the energy use of most of the actual appliances they labeled.
In addition, the NILM A device was unable to label or detect at least two major appliances in each home
as indicated by the “ND” entries. There were not many major appliances monitored or available in the
homes in which the NILM B device was installed. Across all of the homes and appliances available in the
homes in which the NILM B device was installed, only two appliances were not detected by the NILM B
device. However, the low-accuracy results obtained for the “as-labeled” appliance pairs for both NILM A
devices, as shown in Table 5.1 and Table 5.2, primarily led the research team to review the data and
search for missed correlations and errors in analysis. When visually inspecting the NILM energy outputs
5.5
compared to the baseline sub-metered data, it was discovered that the NILM devices could possibly be
reasonably estimating the energy use of another load that they mislabeled. However, to confirm this
observation, a series of correlation matrices were generated for each home to help identify mislabeled
loads by measuring the Pearson’s R-square correlation coefficient (see Equation (5.3) in Section 0)
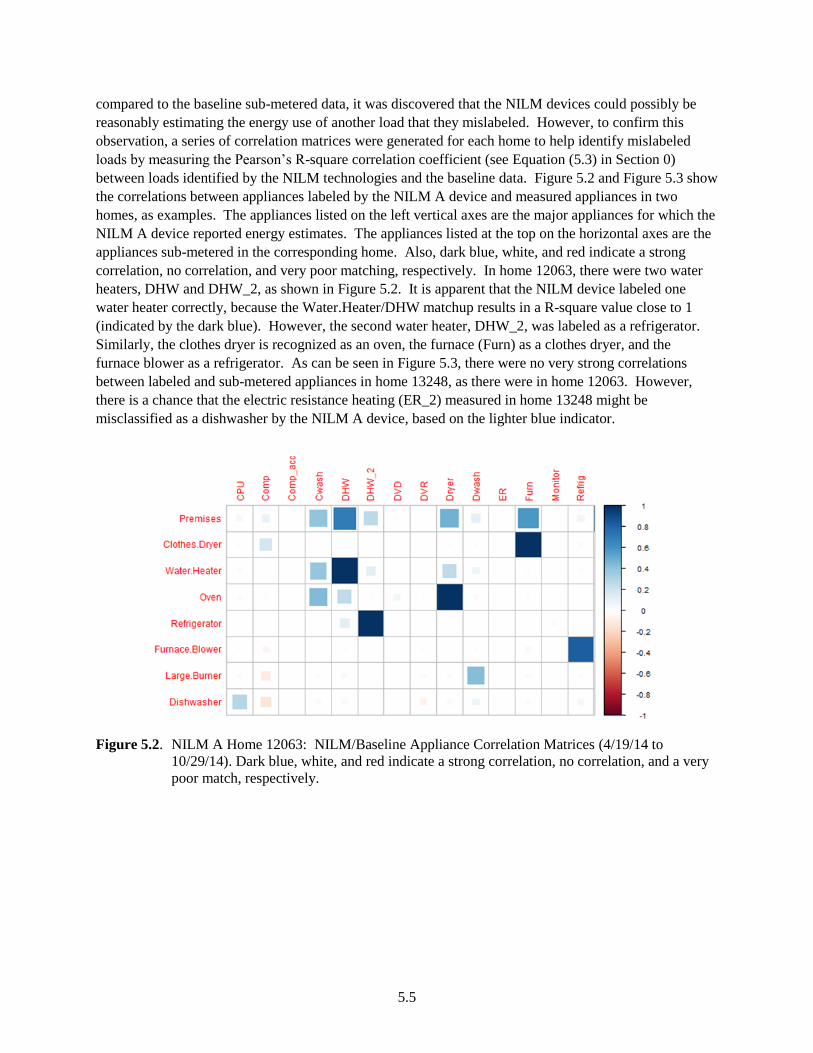
between loads identified by the NILM technologies and the baseline data. Figure 5.2 and Figure 5.3 show
the correlations between appliances labeled by the NILM A device and measured appliances in two
homes, as examples. The appliances listed on the left vertical axes are the major appliances for which the
NILM A device reported energy estimates. The appliances listed at the top on the horizontal axes are the
appliances sub-metered in the corresponding home. Also, dark blue, white, and red indicate a strong
correlation, no correlation, and very poor matching, respectively. In home 12063, there were two water
heaters, DHW and DHW_2, as shown in Figure 5.2. It is apparent that the NILM device labeled one
water heater correctly, because the Water.Heater/DHW matchup results in a R-square value close to 1
(indicated by the dark blue). However, the second water heater, DHW_2, was labeled as a refrigerator.
Similarly, the clothes dryer is recognized as an oven, the furnace (Furn) as a clothes dryer, and the
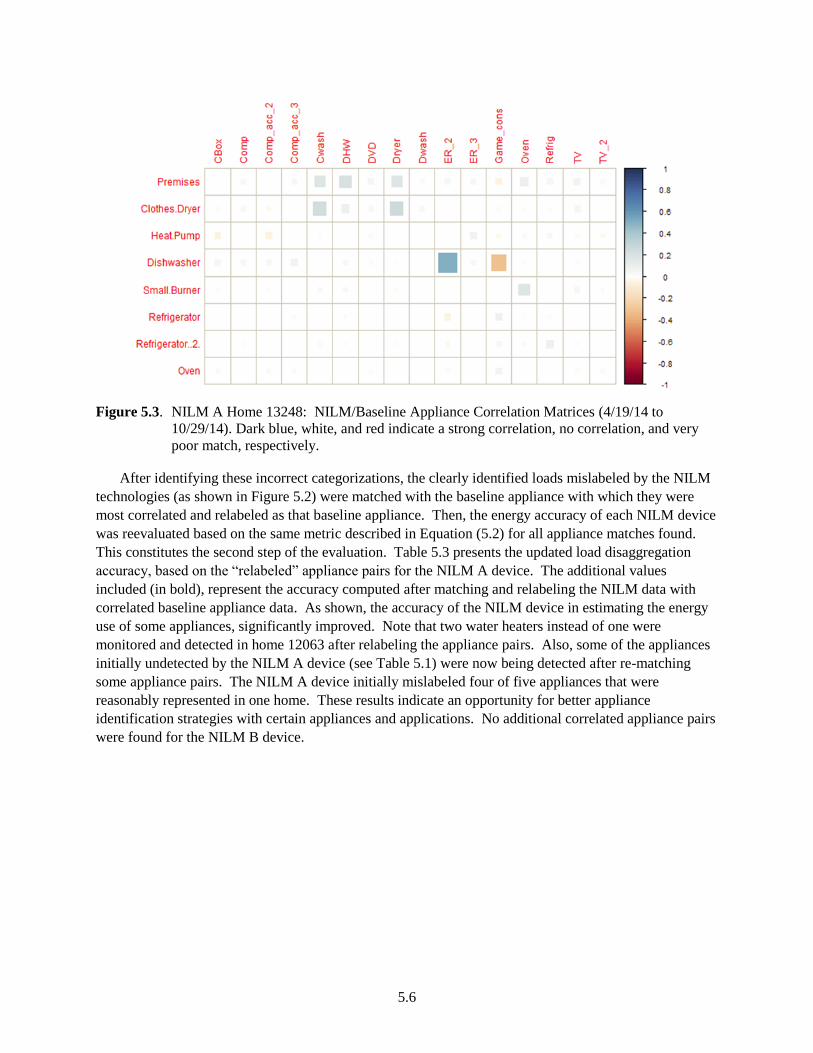
furnace blower as a refrigerator. As can be seen in Figure 5.3, there were no very strong correlations
between labeled and sub-metered appliances in home 13248, as there were in home 12063. However,
there is a chance that the electric resistance heating (ER_2) measured in home 13248 might be
misclassified as a dishwasher by the NILM A device, based on the lighter blue indicator.
Figure 5.2. NILM A Home 12063: NILM/Baseline Appliance Correlation Matrices (4/19/14 to
10/29/14). Dark blue, white, and red indicate a strong correlation, no correlation, and a very
poor match, respectively.
5.6
Figure 5.3. NILM A Home 13248: NILM/Baseline Appliance Correlation Matrices (4/19/14 to
10/29/14). Dark blue, white, and red indicate a strong correlation, no correlation, and very
poor match, respectively.
After identifying these incorrect categorizations, the clearly identified loads mislabeled by the NILM
technologies (as shown in Figure 5.2) were matched with the baseline appliance with which they were
most correlated and relabeled as that baseline appliance. Then, the energy accuracy of each NILM device
was reevaluated based on the same metric described in Equation (5.2) for all appliance matches found.
This constitutes the second step of the evaluation. Table 5.3 presents the updated load disaggregation
accuracy, based on the “relabeled” appliance pairs for the NILM A device. The additional values
included (in bold), represent the accuracy computed after matching and relabeling the NILM data with
correlated baseline appliance data. As shown, the accuracy of the NILM device in estimating the energy
use of some appliances, significantly improved. Note that two water heaters instead of one were
monitored and detected in home 12063 after relabeling the appliance pairs. Also, some of the appliances
initially undetected by the NILM A device (see Table 5.1) were now being detected after re-matching
some appliance pairs. The NILM A device initially mislabeled four of five appliances that were
reasonably represented in one home. These results indicate an opportunity for better appliance
identification strategies with certain appliances and applications. No additional correlated appliance pairs
were found for the NILM B device.
5.7
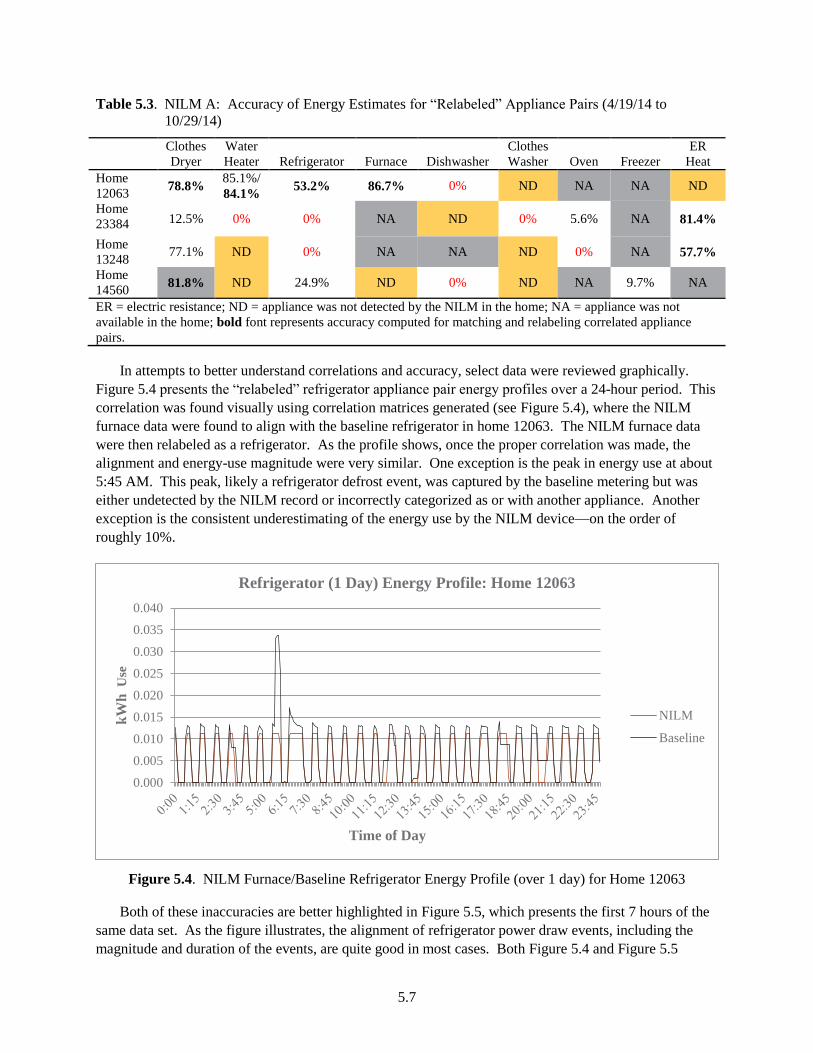
Table 5.3. NILM A: Accuracy of Energy Estimates for “Relabeled” Appliance Pairs (4/19/14 to
10/29/14)
Clothes
Dryer
Water
Heater Refrigerator Furnace Dishwasher
Clothes
Washer Oven Freezer
ER
Heat
Home
12063 78.8%
85.1%/
84.1% 53.2% 86.7% 0% ND NA NA ND
Home
23384 12.5% 0% 0% NA ND 0% 5.6% NA 81.4%
Home
13248 77.1% ND 0% NA NA ND 0% NA 57.7%
Home
14560 81.8% ND 24.9% ND 0% ND NA 9.7% NA
ER = electric resistance; ND = appliance was not detected by the NILM in the home; NA = appliance was not
available in the home; bold font represents accuracy computed for matching and relabeling correlated appliance
pairs.
In attempts to better understand correlations and accuracy, select data were reviewed graphically.
Figure 5.4 presents the “relabeled” refrigerator appliance pair energy profiles over a 24-hour period. This
correlation was found visually using correlation matrices generated (see Figure 5.4), where the NILM
furnace data were found to align with the baseline refrigerator in home 12063. The NILM furnace data
were then relabeled as a refrigerator. As the profile shows, once the proper correlation was made, the
alignment and energy-use magnitude were very similar. One exception is the peak in energy use at about
5:45 AM. This peak, likely a refrigerator defrost event, was captured by the baseline metering but was
either undetected by the NILM record or incorrectly categorized as or with another appliance. Another
exception is the consistent underestimating of the energy use by the NILM device—on the order of
roughly 10%.
Figure 5.4. NILM Furnace/Baseline Refrigerator Energy Profile (over 1 day) for Home 12063
Both of these inaccuracies are better highlighted in Figure 5.5, which presents the first 7 hours of the
same data set. As the figure illustrates, the alignment of refrigerator power draw events, including the
magnitude and duration of the events, are quite good in most cases. Both Figure 5.4 and Figure 5.5
0.000
0.005
0.010
0.015
0.020
0.025
0.030
0.035
0.040
kW
h
Use
Time of Day
Refrigerator (1 Day) Energy Profile: Home 12063
NILM
Baseline

5.8
highlight where these errors may be occurring and how they may be propagating through the data set due
to consistent underestimation of the load and the missed defrost events that occur at least one time daily
and consume relatively high levels of energy over 10- to 15- minute periods. Note also that the daily
profile contains slight start and stop time offsets and, while they do not occur often, their presence is
evident. After reclassifying the misidentified furnace blower as a refrigerator, the calculated energy
accuracy was 51.2% for the 24-week period of study between 4/19/2014 and 10/4/2014. This result
appears to be reasonable due to consistent underestimation of the load, missed defrost events that occur at
least one time daily and consume relatively high levels of energy over 10- to 15-minute periods, and
offsets in runtimes between the NILM device estimates and the measured energy use. For the case of the
refrigerator, both of these issues offer opportunities for future study about classifying loads and
improving energy estimates.
Another visual example is shown, in Figure 5.6, which depicts a “relabeled” dryer appliance pair
pairing over 1 day. For this case, the NILM device energy data for an oven were found to be highly
correlated with the baseline dryer in home 14560. The profile shows that all events were detected, but the
NILM device again underreports, especially peak energy consumptions (at 9:00 AM). For this situation,
the energy accuracy was calculated to be ~82% over the 24-week period of study, which makes sense
because the error between the NILM and baseline data for the dryer varies and propagates throughout the
period of study.
Figure 5.5. NILM Furnace Blower/Baseline Refrigerator Hourly Energy Profile (over 7.5 hours) for
Home 12063
0.000
0.005
0.010
0.015
0.020
0.025
0.030
0.035
0.040
kW
h
Use
Time of Day
Refrigerator Hourly Energy Profile: Home 12063
NILM
Baseline

5.9
Figure 5.6. NILM Oven/Baseline Dryer Energy Profile (over 1 day) for Home 14560
In summary, the NILM A device was reasonably accurate at estimating energy consumption and
event identification of resistive loads (i.e., electric resistance water heaters, heating, clothes dryers, etc.),
but initially struggled with load identification. This NILM technology mislabeled at least one appliance
in each home in which it was installed. In addition, it was unable to detect or track the energy use of at
least three of the major appliances considered in every home in which it was installed. However, once the
correct appliances were identified via re-matching and relabeling correlated appliance pairs, NILM device
energy-consumption accuracy improved significantly. NILM A was more successful with ON/OFF type
loads, such as the electric resistance water heaters, clothes dryer, and furnace; it had an overall energy
estimate accuracy of ~70% across all homes (after correction and excluding the uncorrelated appliance
pairs where the NILM labeled appliances could not be re-matched with other correlated baseline
appliances).
For multi-state loads, such as refrigerators and freezers, the average accuracy of the NILM A device
was only ~30% (after correction), indicating that some improvement is possible in better classifying
appliances with multiple energy-consumption states. In this assessment, the NILM device was penalized
for not recognizing the defrost cycles and consistently underestimating compressor cycles and offsets in
ON/OFF runtimes of the compressor. The NILM A device also appeared to sometimes identify multiple
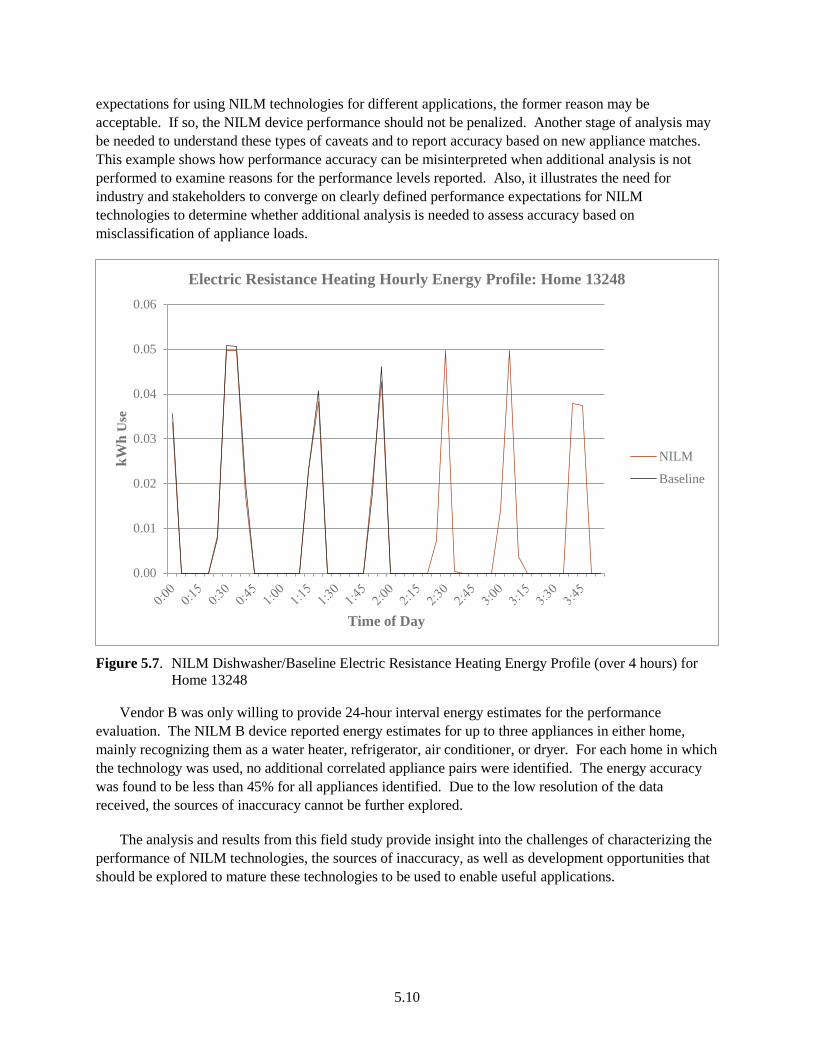
loads as one appliance or report erroneous loads, which drastically decreased accuracy in those cases. For
example, Figure 5.6 shows the energy-use profiles for a “relabeled” appliance pair between the NILM
device’s originally labeled dishwasher and an electric resistance heating load in home 13248. It is clear
that the NILM device is tracking energy use of the actual load at some periods and estimating significant
load at times when electric resistance heating is observed to be on. In this case, energy accuracy was
observed to be ~58%, based on the 24-week period of study. Based on the two stages of analysis
performed so far, it is unclear whether the reason for degradation in performance is due to an actual or
erroneous load being categorized with the freezer by the NILM device. Depending on the performance
0.000
0.100
0.200
0.300
0.400
0.500
0.600
kW
h U
se
Time of Day
Dryer (1Day) Energy Profile: Home 14560
NILM
Baseline
5.10
expectations for using NILM technologies for different applications, the former reason may be
acceptable. If so, the NILM device performance should not be penalized. Another stage of analysis may
be needed to understand these types of caveats and to report accuracy based on new appliance matches.
This example shows how performance accuracy can be misinterpreted when additional analysis is not
performed to examine reasons for the performance levels reported. Also, it illustrates the need for
industry and stakeholders to converge on clearly defined performance expectations for NILM
technologies to determine whether additional analysis is needed to assess accuracy based on
misclassification of appliance loads.
Figure 5.7. NILM Dishwasher/Baseline Electric Resistance Heating Energy Profile (over 4 hours) for
Home 13248
Vendor B was only willing to provide 24-hour interval energy estimates for the performance
evaluation. The NILM B device reported energy estimates for up to three appliances in either home,
mainly recognizing them as a water heater, refrigerator, air conditioner, or dryer. For each home in which
the technology was used, no additional correlated appliance pairs were identified. The energy accuracy
was found to be less than 45% for all appliances identified. Due to the low resolution of the data
received, the sources of inaccuracy cannot be further explored.
The analysis and results from this field study provide insight into the challenges of characterizing the
performance of NILM technologies, the sources of inaccuracy, as well as development opportunities that
should be explored to mature these technologies to be used to enable useful applications.
0.00
0.01
0.02
0.03
0.04
0.05
0.06
kW
h U
se
Time of Day
Electric Resistance Heating Hourly Energy Profile: Home 13248
NILM
Baseline

6.1
6.0 Conclusions and Next Steps
Every NILM end-user and application does not require the same level of accuracy, power/energy-use
output resolution, ease of use, and ease of installation (which impacts costs). Likely, in the future, a
variety of unique NILM technologies will be developed and customized with a suite of characteristics that
are acceptable for particular applications.
From the NEEA field test evaluation of a few existing NILM technologies, several insights were
gained regarding the ease of use, installation requirements, and reporting frequency of available NILM
technologies. The ease of use will likely affect the market adoption of such technologies, particularly in
the residential consumer market, while the ease of installation has important considerations for the overall
cost of the product. The reporting frequency influences the ability of the NILM data to be useful for
particular applications.
While different levels of accuracy may be acceptable depending on the application, performance
accuracy will continue to be a key consideration when considering and comparing different NILM
technologies. However, evaluating the performance of NILM technologies is not trivial because the
performance is easily misunderstood and misinterpreted. Previous performance studies have discouraged
market uptake and decreased confidence in the potential value of NILM technologies because meaningful
and objective metrics and protocols were not used to convey the suitability of the technologies for certain
applications. In addition, the reasons for inaccuracy are not typically reported, so they cannot be used to
guide and focus innovation in this area to enable a wide range of applications.
To evaluate technology performance, PNNL evaluated existing metrics that were previously proposed
in the literature. PNNL found that selection of new metrics was warranted because candidate metrics
were inflexible and unable to capture NILM device performance in a robust and meaningful way. After
selecting a more comprehensive metric, the results were analyzed and some sources of performance
inaccuracies in estimating energy use for these technologies were explored. For instance, for one NILM
product, it was evident that the appliance classification process, used to identify individual loads, could be
improved to significantly increase the accuracy of energy estimates of individual loads. Also, in some
cases there was consistent underestimation of appliance energy use, which indicates the need to enhance
the methods used to calculate energy use for certain appliances. More investigation is needed to identify
other significant sources of inaccuracies and potential opportunities for improvement.
This report describes the preliminary evaluation of several commercially available NILM
technologies. To encourage innovation in NILM technologies, researchers and stakeholders need to
continue to be kept aware of their evolving performance capabilities and key characteristics that make
them suitable for certain applications and market segments. Roughly 18 currently active NILM
companies have advanced prototypes or commercially available products across the United States, United
Kingdom, Ireland, and Canada. The market for these NILM technologies is slowly maturing. Further
development of a robust set of performance metrics that is vetted with industry, communication about
performance capabilities based on these metrics, and demonstration of other important characteristics are
meaningful activities to pursue. They will help further the development of this new and emerging field by
identifying applications where existing NILM technologies may be of benefit now, and by emphasizing
areas of research that can help to advance NILM capabilities to a level that is appropriate for other
applications. To accomplish these goals, industry and researchers in the field must first converge on a set

6.2
of performance expectations for NILM devices. Clearly articulated and unambiguous expectations will
then allow for development of metrics and protocols that 1) are meaningful and of value to the industry,
2) empower researchers and developers to advance these technologies to desired levels, and 3) increase
confidence in the product capabilities. As part of an ongoing project, primarily sponsored by BPA1,
PNNL plans to engage stakeholders and an advisory board to reach agreement on common protocols and
metrics that are intended to be voluntary and used to objectively evaluate and compare appliance
disaggregation technologies for different applications and uses.
1 BPA TIP 327: NILM Accuracy Test Standard Development and Measurement Improvement

7.3
7.0 References
Armel KC, G Dupta, G Shrimali, et al. 2013. “Is disaggregation the holy grail of energy efficiency?
The case of electricity.” Energy Policy 52:213−234.
Baylon D, P Storm, K Geraghty, et al. 2011. Residential Building Stock Assessment: Single-Family
Characteristics and Energy Use. URL: http://neea.org/docs/reports/residential-building-stock-
assessment-single-family-characteristics-and-energy-use.pdf?sfvrsn=8
Berges ME, E Goldman, HS Matthews, et al. 2010. “Enhancing Electricity Audits in Residential
Buildings with Nonintrusive Load Monitoring.” Journal of Industrial Ecology 14(5):844−858.
Butner RS, DJ Reid, M Hoffman, et al. 2013. Non-Intrusive Load Monitoring Assessment: Literature
Review and Laboratory Protocol. PNNL-22635, Pacific Northwest National Laboratory, Richland,
Washington.
Ehrhardt-Martinez K, KA Donnelly, and JA Laitner. 2010. “Advanced metering initiatives and
residential feedback programs: a meta-review for household electricity-saving opportunities.” American
Council for an Energy-Efficient Economy, Washington, D.C.
Eisenhauer JG. 2003. "Regression Through the Origin." Teaching Statistics 25(3):76−80.
Greentechgrid. 2015a (accessed). “50 Million US Smart Meters and Counting.” URL:
http://www.greentechmedia.com/articles/read/50-million-u.s.-smart-meters-and-counting
Greentechgrid. 2015b (accessed). “Startup Smappee Goes Deep With Its Energy Disaggregation.” URL:
http://www.greentechmedia.com/articles/read/startup-smappee-goes-deep-with-its-energy-
disaggregation?utm_source=feedburner&utm_medium=feed&utm_campaign=Feed%3A+GreentechMedi
a+(Greentech+Media)
Hart GW. 1992. “Nonintrusive appliance load monitoring.” Proceedings of the IEEE 80.12:1870−1891.
Hao H, BM Sanandaji, K Poolla, et al. 2015. "Potentials and Economics of Residential Thermal Loads
Providing Regulation Reserve." Energy Policy 79:115−126.
Kamilaris A, B Kalluri, S Kondepudi, et al. 2014. “A literature survey on measuring energy usage for
miscellaneous electric loads in offices and commercial buildings.” Renewable and Sustainable Energy
Reviews 34:536−550.
MacDonald J, P Cappers, D Callaway, et al. 2012. “Demand Response Providing Ancillary Services A
Comparison of Opportunities and Challenges in the US Wholesale Markets.” Grid-Interop Forum 2012.
Makonin S. 2012. “Approaches to Non-Intrusive Load Monitoring (NILM) in the Home.” PhD
dissertation, Simon Fraser University, Burnaby, British Columbia.
Nau RF. 2015 (accessed). “Percent of standard deviation explained.” URL:
http://people.duke.edu/~rnau/rsquared.htm
7.4
Wong YF, YA Sekercioglu, T Drummond, et al. 2013. “Recent approaches to non-intrusive load
monitoring techniques in residential settings.” IEEE Symposium on Computational Intelligence
Applications In Smart Grid (CIASG).
Zeifman M and K Roth. 2011. “Nonintrusive appliance load monitoring: Review and outlook.” IEEE
Transactions on Consumer Electronics 57 (1):76−84.
Zoha A, A Gluhak, MA Imran, et al. 2012. “Non-intrusive load monitoring approaches for disaggregated
energy sensing: A survey.” Sensors 12 (12):16838−16866.

A.1
Appendix A
List of Active NILM Vendors
Several non-intrusive load monitoring (NILM) products are commercially available for residential
and/or commercial building segments. Table A.1 lists some active NILM vendors and their products, as
well as the applications, current market targets, and the costs quoted from the vendors (if available).
Table A.2 lists active NILM vendors and the specific measurement devices, measurement sampling rates
and reporting frequency limits for their NILM products. Yellow highlights represent prototypes and
ongoing research institutions where the products have not yet been made commercially available.
Table A.1. List of Active NILM Vendors and Their Products
Vendor
Product
Name Applications
Current Market Targets
and Users Cost
AlertMe AlertMe Energy analytics,
appliance control, and
home automation
Utilities, service
providers, retailers,
appliance
manufacturers, and
residential customers
NA
Belkin NA -
prototype
Appliance
disaggregation
NA Target at $200 range
Bidgley HomeBeat
Energy
Monitor
Appliance itemization,
solar disaggregation,
event notification and
reminders, targeted
marketing, social
sharing, measurement
and verification,
energy-efficiency
programs, and
customer services
Utilities, and residential
customers
TED 5000: $200,
Rainforest EAGLE:
$100, Digi
ConnectPort: $120
Blue Line
Innovations
PowerCost
Monitor
Appliance
disaggregation
Homeowners, small
business owners,
utilities
$115
Energy Aware
Technology
Inc.
Neurio Appliance
disaggregation
Residential customers $250
Enetics SPEED Appliance
disaggregation
Residential customers $1,300
EEme EEme virtual home energy
audit analytics for
demand side
Utilities and residential
consumers
NA

A.2
management
Fraunhofer
CSE
NA Load disaggregation
for energy
management
Residential and
commercial customers
NA
Load IQ Enable.EI Energy disaggregation
and energy efficiency
Commercial buildings
as well as industrial
facilities
It is in pre-commercial
stage, one year rental
price of $2,000
Navetas
Energy
Management
Loop Energy monitoring and
smart data analytics
Residential customers.
However, the
disaggregation
technique has not been
implemented in the
current Loop system
£35 for Loop energy
savings kit, Service fee:
first year free, then £5
annually
ONZO ONZO Customer value
discovery from smart
meter data: energy
efficiency, customer
engagement, improved
targeting of sales and
marketing
Residential customers NA
Plotwatt Plotwatt Data analysis, activity
alerts, and
recommendations on
rate plan selection, and
peak energy use
Residential customers
and restaurants
Free for residential
customers, $99 capital
cost plus $99 monthly
service charge for
restaurants
Powersavvy Powersavvy Energy saving Residential customers
and business owners
Monitoring a typical
home for a week, giving
an analyzed report costs
€50
Qualisteo Lynx
Wattseeker
Appliance
disaggregation
Supermarkets, train
station, industrial site,
restaurants, offices,
shopping center, etc.
NA
Smappee Smappee Appliance
disaggregation
Residential customers $250
Verdigris Verdigris Appliance
disaggregation
Residential customers NA
Verlitics Energy
Insight
Cloud
Service
Appliance
disaggregation
Home owners, business
owners, facility
managers, utilities, and
device manufacturers
NA
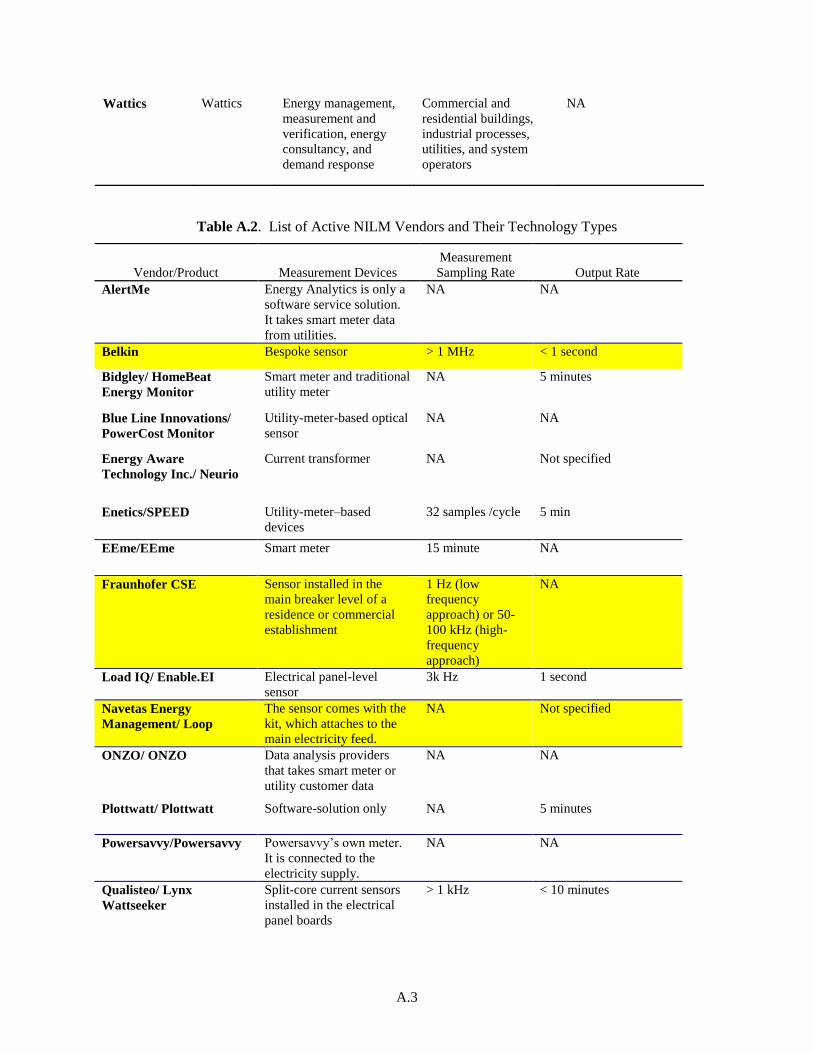
A.3
Table A.2. List of Active NILM Vendors and Their Technology Types
Wattics Wattics Energy management,
measurement and
verification, energy
consultancy, and
demand response
Commercial and
residential buildings,
industrial processes,
utilities, and system
operators
NA
Vendor/Product Measurement Devices
Measurement
Sampling Rate Output Rate
AlertMe Energy Analytics is only a
software service solution.
It takes smart meter data
from utilities.
NA NA
Belkin Bespoke sensor > 1 MHz < 1 second
Bidgley/ HomeBeat
Energy Monitor
Smart meter and traditional
utility meter
NA 5 minutes
Blue Line Innovations/
PowerCost Monitor
Utility-meter-based optical
sensor
NA NA
Energy Aware
Technology Inc./ Neurio
Current transformer NA Not specified
Enetics/SPEED Utility-meter–based
devices
32 samples /cycle 5 min
EEme/EEme Smart meter 15 minute NA
Fraunhofer CSE Sensor installed in the
main breaker level of a
residence or commercial
establishment
1 Hz (low
frequency
approach) or 50-
100 kHz (high-
frequency
approach)
NA
Load IQ/ Enable.EI Electrical panel-level
sensor
3k Hz 1 second
Navetas Energy
Management/ Loop
The sensor comes with the
kit, which attaches to the
main electricity feed.
NA Not specified
ONZO/ ONZO Data analysis providers
that takes smart meter or
utility customer data
NA NA
Plottwatt/ Plottwatt Software-solution only NA 5 minutes
Powersavvy/Powersavvy Powersavvy’s own meter.
It is connected to the
electricity supply.
NA NA
Qualisteo/ Lynx
Wattseeker
Split-core current sensors
installed in the electrical
panel boards
> 1 kHz < 10 minutes

A.4
Smappee/ Smappee Current transformer 1 kHz 1 minute
Verdigris/ Verdigris Current transformer NA NA
Verlitics/EICS Bespoke sensor NA NA
Wattics A 12-channel meter
installed on large
distribution boards
NA NA

PNNL-24230
Distribution
No. of No. of
Copies Copies
Distr.1
# Name
Organization
Address
City, State and ZIP Code
# Organization
Address
City, State and ZIP Code
Name
Name
Name
Name
Name (#)
# Name
Organization
Address
City, State and ZIP Code
# Foreign Distribution # Name
Organization
Address
Address line 2
COUNTRY
# Local Distribution
Pacific Northwest National Laboratory
Name Mailstop
Name Mailstop
Name Mailstop
Name Mailstop
Name (PDF)