CHARACTERISING MACROEVOLUTIONARY PATTERNS WITHIN...
269
CHARACTERISING MACROEVOLUTIONARY PATTERNS WITHIN CROCODYLOMORPHA by PEDRO LORENA GODOY A thesis submitted to the University of Birmingham for the degree of DOCTOR OF PHILOSOPHY School of Geography, Earth and Environmental Sciences College of Life and Environmental Sciences University of Birmingham September 2018
Transcript of CHARACTERISING MACROEVOLUTIONARY PATTERNS WITHIN...
CHARACTERISING MACROEVOLUTIONARY PATTERNS WITHIN
CROCODYLOMORPHA
by
PEDRO LORENA GODOY
A thesis submitted to the University of Birmingham for the degree of DOCTOR OF
PHILOSOPHY
School of Geography, Earth and Environmental Sciences
College of Life and Environmental Sciences
University of Birmingham
September 2018

University of Birmingham Research Archive
e-theses repository This unpublished thesis/dissertation is copyright of the author and/or third parties. The intellectual property rights of the author or third parties in respect of this work are as defined by The Copyright Designs and Patents Act 1988 or as modified by any successor legislation. Any use made of information contained in this thesis/dissertation must be in accordance with that legislation and must be properly acknowledged. Further distribution or reproduction in any format is prohibited without the permission of the copyright holder.


Abstract
Crocodylians today comprise only 24 recognised species, and are often regarded as
morphologically conservative. However, the fossil record of crocodylomorphs, which
includes the extinct relatives of crocodylians, is much richer and extends over the last ~220
million years. This great biodiversity is reflected in their morphological disparity, with
crocodylomorph species occupying a much wider range of ecological niches. Research effort
has concentrated mostly on the description of new taxa and on placing them within the
crocodylomorph evolutionary tree, and has greatly contributed to our understanding of
crocodylomorph phylogeny and diversity. Nevertheless, another fundamental aspect of
crocodylomorph macroevolution, morphological disparity, has only recently been the subject
of quantitative scrutiny, with the focus often limited to specific subgroups rather than the
entire clade. In this thesis, crocodylomorph morphological disparity is quantitatively assessed
using distinct types of data. Body size patterns, characterised via a model-fitting approach,
provide new insights into the adaptive landscape of crocodylomorphs. Patterns of cranial
shape variation suggest an important link between ecological diversification and
morphological disparity. Finally, the action of heterochrony, underlying remarkable cranial
modifications in the crocodylomorph clade Notosuchia, is tested using geometric
morphometrics. Together, these results represent a significant contribution to better
understanding crocodylomorph phenotypic evolution.

Aos meus pais.

Acknowledgements
I am deeply grateful to my supervisor Richard Butler, who offered me the opportunity to
develop a project on the research field I always dreamed of, and was a constant source of
support, advice and insights throughout my entire PhD. Richard will certainly be my
inspiration if I am to become a supervisor in the future. I also thank my internal co-
supervisors, Ivan Sansom and James Bendle, and especially my external co-supervisor, Roger
Benson, for their ideas, discussions and comments on parts of this thesis.
I am thankful to CAPES (Coordenação de Aperfeiçoamento de Pessoal em Nível
Superior) and the University of Birmingham for jointly funding my PhD project. I also thank
the financial support from Universitas 21, the Palaeontological Association, and the “Doris O.
and Samuel P. Welles Research Fund”, from the University of California's Museum of
Paleontology.
I acknowledge the access to fossil specimens provided by Lorna Steel (NHMUK,
London, UK), Zoltán Szentesi (MTM, Budapest, Hungary), Attila Ősi (MTM), Eliza Howlett
(OUMNH, Oxford, UK), Matthew Riley (CAMSM, Cambridge, UK), Ronan Allain (MNHN,
Paris, France), Rainer Schoch (SMNS, Stuttgart, Germany), Erin Maxwell (SMNS), Marisa
Blume (HLMD, Darmstadt, Germany), Eberhard Frey (SMNK, Karlsruhe, Germany), Oliver
Rauhut (BSPG, Munich, Germany), Max Langer (LPRP/USP, Ribeirão Preto, Brazil), Sandra
Tavares (MPMA, Monte Alto, Brazil), Fabiano Iori (MPMA), Thiago Marinho (CPP,
Peirópolis, Brazil), Jaime Powel (PVL, San Miguel de Tucumán, Argentina), Rodrigo
Gonzáles (PVL), Martín Ezcurra (MACN, Buenos Aires, Argentina), Stella Alvarez (MACN),
Alejandro Kramarz (MACN), Patricia Holroyd (UCMP, Berkeley, USA), Kevin Padian
(UCMP), William Simpson (FMNH, Chicago, USA), Akiko Shinya (FMNH), Paul Sereno

(UCRC, Chicago, USA), Tayler Keillor (UCRC), Mark Norell (AMNH, New York, USA),
Carl Mehling (AMNH), Judy Galkin (AMNH), Alan Turner (SUNY, Stony Brook, USA), Liu
Jun (IVPP, Beijing, China), Corwin Sullivan (IVPP), Zheng Fang (IVPP), Amanda Millhouse
(USNM, Washington, D. C., USA).
I thank all my colleagues from the Paleobiology research theme of the University of
Birmingham, specially Dan Cashmore, Emma Dunne, Andy Jones and Juan Benito Moreno,
for their help, assistance, and friendship. Further thanks to my Brazilian palaeontologist
colleagues Julio Marsola, Gabriel Ferreira, Mario Bronzati, Felipe Montefeltro, Bruno Vila
Nova, and Max Langer, who not only have been friends for many years, but also contributed
to parts of this thesis. I also thank Trina Du, Louise Meunier and Hans Larsson, who provided
me with an enjoyable and fruitful period at the Redpath Museum (McGill University).
I express special appreciation to the many Brazilian friends that lived or are still living
in Birmingham, including Carlos, Carol, Lais, Tupá, Julio, Dalila, Camila, Douglas, Jamila,
José Carlos, Pedro, Tati, Mario, Mari, Samara, Vítor, Elis, Valter, Giana, Ravenna, David,
Renata, Willians, Emily, Serginho, Paula, Walter, Rubens, and Glauco, as well as those living
in London (Giu, Tarso and Victor) and Sheffield (Ligia and Matheus). Special thanks to my
dearest friend Matheus, for his incredible companionship over more than 10 years.
Finally, my sincere and immense gratitude to my family, Solange, João and Lucas,
whose unconditional love and support were surely crucial for my engagement in research and
ultimately led me to finish this thesis. And I extend my gratitude to Mariana, the most recent
member of the family, for her affection and (intense) support, particularly during the last
months before handing the thesis. Thank you, my love.

Table of Contents
Chapter 1: Introduction _____________________________________________________ 1
1.1. Taxonomic diversity versus morphological disparity in macroevolutionary studies _______ 2
1.2. The study group: Crocodylomorpha ____________________________________________ 4
1.3. Objectives ________________________________________________________________ 8
Chapter 2: Crocodylomorph body size evolution ________________________________ 9
2.1. Background _______________________________________________________________ 9
2.2. Material and Methods ______________________________________________________ 14
2.2.1. Proxy for body size ____________________________________________________ 14
2.2.2. Phylogenetic framework ________________________________________________ 17
2.2.3. Time-calibration ______________________________________________________ 21
2.2.4. Macroevolutionary analyses _____________________________________________ 23
2.2.5. Correlation with abiotic factors ___________________________________________ 29
2.3. Results __________________________________________________________________ 31
2.3.1. Comparative model-fitting analyses _______________________________________ 31
2.3.2. Appraising the SURFACE model fits ______________________________________ 33
2.3.3. Describing the body size macroevolutionary patterns in Crocodylomorpha _________ 39
2.3.4. Investigating the modes of body size evolution within Notosuchia and Crocodylia___ 48
2.3.5. The influence of palaeolatitude and palaeotemperature ________________________ 51
2.4. Discussion _______________________________________________________________ 56
2.4.1. The adaptive landscape of crocodylomorph body size evolution _________________ 56
2.4.2. Ecological diversification and its implications for crocodylomorph body size
distribution _______________________________________________________________ 61
2.4.3. Cope’s rule cannot explain the evolution of larger sizes in Crocodylomorpha _______ 65

2.4.4. Correlation of crocodylian body size with global cooling ______________________ 68
2.4.5. Body size selectivity and diversification across Mesozoic boundaries _____________ 69
2.5. Conclusions ______________________________________________________________ 73
Chapter 3: Crocodylomorph cranial shape disparity _______________________________ 75
3.1. Background ______________________________________________________________ 75
3.2. Material and Methods ______________________________________________________ 78
3.2.1. Sampling and data collection_____________________________________________ 78
3.2.2. Phylogenetic framework ________________________________________________ 80
3.2.3. Geometric morphometric analyses ________________________________________ 82
3.2.4. Estimating disparity ____________________________________________________ 88
3.3. Results __________________________________________________________________ 91
3.3.1. Geometric morphometric analyses ________________________________________ 91
3.3.2. Disparity through time and between groups ________________________________ 105
3.4. Discussion ______________________________________________________________ 113
3.4.1. Assessing the different methods to minimise the effects of interobserver error _____ 113
3.4.2. Crocodylomorph cranial shape variation ___________________________________ 115
3.4.3. Crocodylomorph cranial shape disparity ___________________________________ 117
3.4.4. Ecological diversity and crocodylomorph skull shape ________________________ 121
3.5. Conclusions _____________________________________________________________ 123
Chapter 4: Heterochrony in the cranial evolution of notosuchians __________________ 125
4.1. Background _____________________________________________________________ 125
4.1.1. Heterochrony terminology______________________________________________ 128
4.2. Material and Methods _____________________________________________________ 131
4.2.1. Systematic Palaeontology ______________________________________________ 131
4.2.2. Sampling and data collection____________________________________________ 133

4.2.3. Phylogenetic framework _______________________________________________ 135
4.2.4. Geometric morphometric analyses _______________________________________ 137
4.3. Results _________________________________________________________________ 141
4.4. Discussion ______________________________________________________________ 147
4.4.1. Peramorphosis in Baurusuchidae ________________________________________ 147
4.4.2. Acceleration, predisplacement or hypermorphosis ___________________________ 150
4.4.3. Heterochrony explains hypercarnivory ____________________________________ 153
4.5. Conclusions _____________________________________________________________ 154
Chapter 5: Summary and perspectives __________________________________________ 156
5.1. General conclusions _______________________________________________________ 156
5.2. Prospects and future work __________________________________________________ 158
Appendices ___________________________________________________________________ 160
Appendix A: Supplementary information for Chapter 2 ______________________________ 160
Appendix B: List of specimens sampled for the geometric morphometric analyses of Chapter 3
__________________________________________________________________________ 161
Appendix C: Example R script of the geometric morphometric analyses performed in Chapter 3
__________________________________________________________________________ 171
Appendix D: Supplementary results of the disparity-through-time analyses of Chapter 3 ____ 176
Appendix E: Supplementary information for Chapter 4_______________________________ 194
References ____________________________________________________________________ 195
List of Abbreviations
Institutional abbreviations
ACAP, Association Culturelle, Archéologique et Paléontologique de l’Ouest Biterrois, Cruzy,
Hérault, France. AMNH, American Museum of Natural History, New York, United States of
America. CAS, Sirindhorn Museum, Kalasin Province, Sahatsakhan, Thailand. CNM,
Chongqing Natural Museum, Sichuan, China. BHI, Black Hills Institute, Hill City, United
States of America. BHN2R, Muséum d’Histoire Naturelle de Boulogne-sur-Mer, France. BP,
Bernard Price Institute for Palaeontological Research, Johannesburg, South Africa. BRLSI,
Bath Royal Literary and Scientific Institute, Bath, United Kingdom. BSPG, Bayerische
Staatssammlung für Paläontologie und Geologie, Munich, Germany. BYU, Brigham Young
University, Provo, United States of America. ChM, Charleston Museum, Charleston, United
States of America. CM, Carnegie Museum of Natural History, Pittsburgh, United States of
America. CPP, Centro de Pesquisas Paleontológicas Llewellyn Ivor Price, Peirópolis, Brazil.
DFMMh, Dinosaurier-Freilichtmuseum Münchehagen, Münchehagen, Germany. DG-CTG-
UFPE, Centro de Tecnologia e Geociências, Universidade Federal de Pernambuco, Recife,
Brazil. DGM, Museu de Ciências da Terra, Departamento Nacional de Produção Mineral
(DNPM), Rio de Janeiro, Brazil. DORCM, Dorset County Museum, Dorchester, United
Kingdom. DM, Darwin Museum, Keelung, Taipei. FMNH, Field Museum of Natural
History, Chicago, United States of America. GM, Geiseltalmuseum, Martin Luther
Universitat Halle, Halle, Germany. HLMD, Hessisches Landesmuseum Darmstadt,
Darmstadt, Germany. HUE, Lo Hueco Collection, Museo de las Ciencias de Castilla-La
Mancha, Cuenca, Spain. IGM, Mongolian Institute of Geology, Ulaan Bataar, Mongolia.
IGV, Geological Institute of the Chinese Academy of Geological Sciences, Beijing, China.

IRSNB, Institut Royal des Sciences Naturelles de Bruxelles, Belgium. IVPP, Institute of
Vertebrate Paleontology and Paleoanthropology, Beijing, China. KM, Krahuletz Museum,
Eggenburg, Austria. KNM, Kenya National Museums, Nairobi, Kenya. LACM, Los Angeles
County Museum of Natural History, Los Angeles, United States of America. LO, Lund
University, Lund, Sweden. LPRP/USP, Laboratório de Paleontologia, Universidade de São
Paulo, Ribeirão Preto, Brazil. MACN, Museo Argentino de Ciencias Naturales "Bernardino
Rivadavia", Buenos Aires, Argentina. Mal, Malawi Department of Antiquities, Malawi.
MBLUZ, Museo de Biologia de la Universidad del Zulia, Maracaibo, Venezuela. MCNC,
Museo de Ciencias Naturales de Caracas, Venezuela. MCSNT, Museo Civico di Storia
Naturale di Trieste, Italy. MGHF, Museo Geológico H. Fuenzalida, Universidad Católica del
Norte, Antofagasta, Chile. MHNH, Muséum d’Histoire Naturelle du Havre, Havre, France.
MJCM, Museo de Ciencias Naturales y Antropológicas ‘Juan Cornelio Moyano’, Mendoza,
Argentina. MLP, Museo de La Plata, La Plata, Argentina. MNHN, Museum National
d’Histoire Naturelle, Paris, France. MNK, Museo Noel Kempff Mercado, Santa Cruz de la
Sierra, Bolivia. MNN, Musée National du Niger, Niamey, Republic of Niger. MOR, Museum
of the Rockies, Bozeman, United States of America. MOU, Museum of Osaka University,
Japan. MOZ, Museo Provincial de Ciencias Naturales “Profesor Dr. Juan A. Olsacher”,
Zapala, Neuquén, Argentina. MPMA, Museu de Paleontologia de Monte Alto, Monte Alto,
Brazil. MPZ, Museo Paleontológico de la Universidad de Zaragoza, Spain. MSU, Dunn-
Seiler Museum, Mississippi State University, Starkville, United States of America. MTM,
Hungarian Natural History Museum, Budapest, Hungary. MZSP, Museu de Zoologia da
Universidade de São Paulo, São Paulo, Brazil. NHM, Natural History Museum, London,
United Kingdom. NMC, Canadian Museum of Nature, Ottawa, Ontario, Canada. OMNH,
Oxford University Museum of Natural History, Oxford, United Kingdom. PC, Museo di

Paleontologia del Centro Museale dell'Università di Napoli Federico II University, Naples,
Italy. PETMG, Peterborough Museum, Peterborough, United Kingdom. PIN, Paleontological
Institute Moscow, Russia. PVL, Museo de Ciencias Naturales, Fundación Miguel Lillo, San
Miguel de Tucumán, Argentina. QM, Queensland Museum, Brisbane, Australia. ROM,
Royal Ontario Museum, Toronto, Canada. RMBR, Raffles Museum of Biodiversity
Research, Singapore. RRBP, Rukwa Rift Basin Project (Tanzanian Antiquities Unit),
Tanzania. RTMP, Royal Tyrrell Museum of Palaeontology, Drumheller, Canada. SAM, Iziko
South African Museum, Cape Town, South Africa. SMM, Science Museum of Minnesota, St.
Paul, United States of America. SMNK, Staatliches Museum für Naturkunde, Karlsruhe,
Germany. SMNS, Staatliches Museum für Naturkunde, Stuttgart, Germany. TMM, Texas
Memorial Museum, The University of Texas, Austin, United States of America. UA, UA,
Université d’Antananarivo, Antananarivo, Madagascar. UCMP, University of California
Museum of Paleontology, Berkeley, United States of America. UF, University of Florida,
Gainesville, United States of America. UFAC, Universidade Federal do Acre, Rio Branco,
Brazil. UFRJ, Coleção de Paleontologia de Vertebrados da Universidade Federal do Rio de
Janeiro, Rio de Janeiro, Brazil. UNC, Department of Geological Sciences, University of
North Carolina at Chapel Hill, United States of America. UNEFM, Universidad Nacional
Experimental Francisco de Miranda, Coro, Venezuela. USNM, Smithsonian National
Museum of Natural History, Washington , United States of America. YPM, Yale Peabody
Museum of Natural History, New Haven, United States of America. ZDM, Zigong Dinosaur
Museum, Zigong, Sichuan, China.

Measurements
DCL, dorsal cranial length.
ODCL, orbito-cranial length.
TL, total length.
Evolutionary models
BM, Brownian motion.
EB, Early burst model.
OU, Ornstein-Uhlenbeck.
BMS, multi-regime BM model that allows parameter σ2 to vary.
OUMV, multi-regime OU model that allows θ and σ2 to vary.
OUMA, multi-regime OU model in which θ and α can vary.
OUMVA, OU model in which all three parameters (θ, α and σ2) can vary.
Model parameters
θ, trait optimum of OU-based models.
α, attraction parameter of OU-based models.
σ2, Brownian variance or rate parameter of BM or OU-based models.
μ, evolutionary trend parameter of BM-based models.
Z0, estimated trait value at the root of the tree of OU-based models.

Optimality criteria
AIC, Akaike’s information criterion.
AICc, Akaike’s information criterion for finite sample sizes.
BIC, Bayesian information criterion.
pBIC, Phylogenetic Bayesian information criterion.
Geometric morphometric methods
GPA, Generalised Procrustes analysis.
RWA, Relative Warp analysis.
SS, sum of squares
PC, Principal components.
PCA, Principal components analysis.
Other methodological implementations
OLS, Ordinary least squares.
GLS, Generalised least squares.
PGLS, Phylogenetic generalised least squares.
ANOVA, Analysis of variance.
PhyloANOVA, Phylogenetic Analysis of variance.
MANOVA, Multivariate analysis of variance.
npMANOVA, Non-parametric multivariate analysis of variance.


Chapter 1: Introduction
1
Chapter 1: Introduction
The main goal of palaeontology is to understand the history of life on Earth, which is
documented by fossils of organisms that have been inhabiting the planet for at least 3.7 billion
years (Awramik 1992; Bell et al. 2015; Dodd et al. 2017). The attempt to comprehend the
past is driven not only by curiosity in uncovering the mysteries of ancient life, but also by the
possibility of predicting the future transformations of the planet. In studying past animals,
plants and environments we provide ourselves with crucial tools that help us to identify
patterns and trends of changes that happened repeatedly in the past and that may be mirrored
today (Benton and Harper 2013; Cowen 2013).
As opposed to experimental sciences, hypotheses formulated within the scope of
historical sciences, such as palaeontology, cannot usually be tested via laboratory experiments
(which does not make historical science epistemologically inferior to experimental science
Cleland 2001; 2002). Within experimental sciences, the “traditional” approach of the
scientific method seeks to explore the causal relationship between present and future events,
which is ultimately assessed by testing hypotheses in controlled laboratory settings.
Alternatively, historical scientists use a parallel route of evidential reasoning, looking for
correlations between present and past events, which creates a time asymmetry between
historical and experimental research. In other words, historical hypotheses are formulated to
explain effects of long-past events, and multiple hypotheses can be tested by evidence that
unambiguously discriminates one hypothesis from a set of other available ones (Cleland
2002). Accordingly, better hypotheses emerge and evolve from the accumulation of more and
more diverse evidence (including those arising from Kuhnian paradigm shifts; Cleland 2002;
Benton and Harper 2013). Numerous examples illustrate this pattern of evidential reasoning,

Chapter 1: Introduction
2
from Wegener’s hypothesis of continental drift (Cleland 2002) to the extinction of the
dinosaurs as the result of an asteroid impact (Brusatte et al. 2015).
Recent advances in many methodological techniques have provided palaeontologists
with tools to more quantitatively assess the evidence yielded by the fossil record, allowing
palaeontological research to flourish (Benton and Harper 2013). Although the basis of
palaeontology remains the discovery and description of new specimens or species, additional
steps and approaches to better understand the history of life are now common in
palaeontological studies, such as investigating how closely related those species are (with
systematic phylogenetic analyses) or if there were periods in geological time with greater or
lower biodiversity (by estimating diversity in statistically appropriate ways). This “new era”
of palaeobiology (the subfield of palaeontology created in the first half of the 20th century to
better integrate the emerging concepts of evolutionary biology; Sepkoski 2012), driven by
abundant data derived from quantitative approaches, has permitted more frequent and
comprehensive investigations of macroevolutionary patterns (i.e., evolutionary changes that
occurred over long geological time scales, usually above the species level).
1.1. Taxonomic diversity versus morphological disparity in macroevolutionary studies
During the modern synthesis, the concepts introduced by G. G. Simpson’s Tempo and Mode
in Evolution (1944), such as that of adaptive radiation, were key for the consolidation of
macroevolutionary studies and the marriage between palaeontological evidence and that from
other subfields of evolutionary biology (e.g., molecular data) (Benton 2015). Since Simpson’s
days, palaeontologists have engaged in the characterisation of macroevolutionary temporal
patterns from different types of data. Perhaps the most classical way of recognising
macroevolutionary patterns is by estimating taxonomic diversity. Although species richness in

Chapter 1: Introduction
3
the past has long been the subject of studies by naturalists (Mayr 1982), the modern concept
of diversity estimation was arguably founded by the prominent work of Raup and Sepkoski
(e.g., Raup 1972; Sepkoski 1978; 1979; 1981; Sepkoski et al. 1981; Raup and Sepkoski 1982;
Sepkoski 1984), which has been subsequently improved by statistical approaches that more
adequately account for biases in the fossil record (e.g., Alroy 2010).
However, another important branch of macroevolutionary studies focuses on the long-
term variation of organisms’ morphologies, rather than changes in taxic biodiversity (Gould
1991). The distinction between morphological disparity (i.e., the amount of morphological
variation among species) and taxonomic diversity was greatly clarified by the work of Foote
(e.g., Foote 1993; 1997), which showed that the signals from these two distinct types of data
are not always consistent, as changes in the number of species do not necessarily translate into
changes in the morphological differences among them (Foote 1993; Hopkins and Gerber
2017). For instance, many studies have indicated that even though morphological variation
patterns seem to track those of biodiversity curves during the early evolution of clades (e.g.,
Foote 1993; Hughes et al. 2013), subsequent discordant signals are frequently observed.
There are different approaches for quantifying morphological variation, also known as
phenotypic variation, which usually include data from continuous characters (using traditional
or geometric morphometrics) or discrete (i.e., cladistic) characters (Benton 2015; Hopkins and
Gerber 2017). Continuous characters require measurements of specimens and are often
associated with more restricted morphologies (e.g. a specific part of the skeleton). The use of
discrete characters potentially allows the examination of many aspects of morphology
simultaneously, but with the drawback that realistic descriptions of the morphologies are
usually lost (i.e., it is more difficult to objectively visualise which parts of morphology are
varying) (Hopkins and Gerber 2017). Furthermore, some linear measurements, such as those

Chapter 1: Introduction
4
used as proxies for body size, can summarise successfully information from complex traits,
and modern geometric morphometric techniques (e.g., using three-dimensional data) can
detect extremely nuanced morphological variation.
1.2. The study group: Crocodylomorpha
Crocodylomorpha, the group that includes extant crocodylians and their extinct relatives,
represents an excellent system for studying phenotypic macroevolutionary patterns. In
particular, crocodylomorphs are one of two archosaur lineages that, together with birds,
survived until the present day. Living representatives are important as they serve as analogues
for inferring many biological features (such as physiology and behaviour). Additionally, the
more than 200-million-year-old evolutionary history of the group has a rich fossil record, with
more than 500 species described, which exhibit remarkable morphological variation (Fig.
1.1).
Another crucial characteristic of Crocodylomorpha, which helps make the group a
useful model for studying macroevolution, is the ongoing effort to establish clearer
phylogenetic relationships between its members. A plethora of phylogenetic studies on
crocodylomorphs have been published over the last three decades, from the pioneering work
of Benton and Clark (1988), which introduced the classification of crocodylians and their
fossil relatives within a cladistic framework, to more recent studies that aimed at reconciling
phylogenetic signals from both molecular and morphological data (e.g., Lee and Yates 2018).
This allows the employment of phylogenetic comparative methods (i.e., the use of
information from phylogenies to test evolutionary hypotheses; Harvey and Pagel 1991;
Martins and Hansen 1997), essential for more accurately characterising macroevolutionary
patterns.

Chapter 1: Introduction
5
Figure 1.1. Skulls of some crocodylomorph representatives in dorsal view, illustrating the
morphological and size variation exhibited by the group. A, Sarcosuchus imperator (MNHN.F 1973-9
GDF 662), Early Cretaceous. B, Steneosaurus bollensis (SMNS 54063), Early Jurassic. C, Voay
robustus (NHMUK R 36685), Pleistocene. D, Ikanogavialis gameroi (MCNC unnumbered), Miocene.
E, Dibothrosuchus elpahros (IVPP V7907), Early Jurassic. F, Simosuchus clarki (cast of UA8679
housed at Stony Brook University, USA), Late Cretaceous. G, Purussaurus neivensis (UCMP 39704),
Miocene. Scale bar = 15 cm.

Chapter 1: Introduction
6
Although some major uncertainties remain, recent discoveries and phylogenetic works
have successfully established a near consensus on the “backbone” of the crocodylomorph tree,
and most major subgroups are currently supported by phylogenetic definitions (Table 1.1).
The most prominent of these studies include Andrade et al. (2010; 2011), Brochu (1997;
1999; 2003; 2006; 2010; 2011; 2012), Brochu and Storrs (2012), Brochu et al. (2012),
Bronzati et al. (2012), Buckley and Brochu (1999), Buckley et al. (2000), Buscalioni (2017),
Buscalioni et al. (2001; 2011), Carvalho et al. (2004), Clark (2011), Clark and Sues (2002),
Clark et al. (2000; 2004), Delfino et al. (2005; 2008a, b), Fiorelli and Calvo (2007; 2008),
Fiorelli et al. (2016), Foffa and Young (2014), Foffa et al. (2018), Fortier and Schultz (2009),
Fortier et al. (2011; 2014), Gasparini et al. (2006), Hastings et al. (2010; 2011; 2013; 2015),
Herrera et al. (2013; 2015), Hua and Jouve (2004), Hua et al. (2007), Irmis et al. (2013),
Jouve (2005; 2009; 2016), Jouve et al. (2005; 2006; 2008; 2015), Larsson and Sues (2007),
Martin (2007; 2010); Martin and de Lapparent de Broin (2016), Martin et al. (2013; 2016),
Montefeltro et al. (2011; 2013), Narváez et al. (2015; 2016), Novas et al. (2009), O'Connor et
al. (2010), Ortega et al. (2000), Ősi et al. (2007), Piras et al. (2007; 2010), Pol (2003; 2005)
Pol and Gasparini (2009), Pol and Norell (2004) Pol et al. (2004; 2009; 2012; 2013; 2014),
Salas-Gismondi et al. (2015), Salisbury et al. (2006), Scheyer et al. (2013), Sereno and
Larsson (2009), Sereno et al. (2001; 2003), Tennant et al. (2016a); Turner (2006; 2015),
Turner and Buckley (2008), Turner and Sertich (2010), Tykoski et al. (2002), Wilberg (2015),
Young (2014), Young and Andrade (2009), and Young et al. (2012; 2013; 2014).

Chapter 1: Introduction
7
Table 1.1. Phylogenetic definitions of major crocodylomorph subclades, which are frequently referred
to in this thesis.
Clade Definition Source
Archosauria The least inclusive clade containing Crocodylus niloticus
and Passer domesticus. Sereno (2005)
Crocodylomorpha
The most inclusive clade containing Crocodylus niloticus,
but not Rauisuchus tiradentes, Poposaurus gracilis,
Gracilisuchus stipanicicorum, Prestosuchus chiniquensis,
or Aetosaurus ferratus.
Nesbitt (2011)
Crocodyliformes Last common ancestor of Protosuchus richardsoni,
Crocodylus niloticus and all of its descendants.
Sereno et al.
(2001)
Mesoeucrocodylia All crocodyliforms more closely related
to Crocodylus niloticus than to Protosuchus richardsoni.
Sereno et al.
(2001)
Notosuchia All crocodyliforms more closely related to
Notosuchus terrestris than to Crocodylus niloticus.
Sereno et al.
(2001)
Neosuchia All crocodyliforms more closely related to Crocodylus
niloticus than to Notosuchus terrestris.
Sereno et al.
(2001)
Thalattosuchia
The most inclusive clade consisting of Teleosaurus
cadomensis and Metriorhynchus geoffroyii, but not
Pholidosaurus schaumburgensis, Goniopholis crassidens,
or Dyrosaurus phosphaticus.
Young and
Andrade
(2009)
Tethysuchia Last common ancestor of Pholidosaurus purbeckensis and
Dyrosaurus phosphaticus and all of its descendants.
Andrade et al.
(2011)
Eusuchia
Last common ancestor of Hylaeochampsa vectiana,
Crocodylus niloticus, Gavialis gangeticus, and Alligator
mississippiensis and all of its descendants.
Brochu (2003)
Crocodylia
Last common ancestor of Gavialis gangeticus, Alligator
mississippiensis, and Crocodylus niloticus and all of its
descendants.
Brochu (2003)
Gavialoidea Gavialis gangeticus and all crocodylians closer to it than to
Alligator mississippiensis or Crocodylus niloticus. Brochu (2003)
Alligatoroidea Alligator mississippiensis and all crocodylians closer to it
than to Crocodylus niloticus or Gavialis gangeticus. Brochu (2003)
Crocodyloidea Crocodylus niloticus and all crocodylians closer to it than to
Alligator mississippiensis or Gavialis gangeticus. Brochu (2003)

Chapter 1: Introduction
8
1.3. Objectives
The main goal of this thesis is to quantitatively assess morphological variation within
Crocodylomorpha, characterising phenotypic macroevolutionary patterns using different
sources of information.
Chapter 2 investigates body size evolution across the entire crocodylomorph tree. A
model-fitting approach is applied to explore the modes of evolution that underlie observed
body size patterns. Furthermore, possible evolutionary drivers are assessed by testing for
correlations with biotic and abiotic factors.
Chapter 3 explores crocodylomorph cranial shape variation using a taxonomically
comprehensive approach. Landmark-based geometric morphometrics is used to assess the
morphospace occupation of different crocodylomorph subgroups, as well as to estimate
morphological disparity (through-time and between groups).
Finally, Chapter 4 focuses on Notosuchia, an extremely disparate group of
crocodylomorphs, and tests the hypothesis that heterochronic processes underpin cranial
shape modifications seen in the hypercarnivorous baurusuchids. Geometric morphometric
techniques are once more employed to quantify notosuchian cranial shape variation, and
allometric and ontogenetic changes are assessed using specific protocols.

Chapter 2: Crocodylomorph body size evolution
9
Chapter 2: Crocodylomorph body size evolution
This chapter is a modified version of a manuscript submitted for publication in BMC
Evolutionary Biology, which is currently under review. Additionally, the same manuscript
was submitted as a preprint to bioRxiv, and can be found online as:
GODOY, P. L., BENSON, R. B. J., BRONZATI, M. and BUTLER, R. J. 2018a. The multi-
peak adaptive landscape of crocodylomorph body size evolution. bioRxiv, 405621,
https://doi.org/10.1101/405621
My contribution to this manuscript involved conducting all parts of the research, including co-
co-designing the project, collecting the data, analysing it and interpreting the results, as well
as writing the manuscript. My colleagues collaborated by co-designing parts of the research
project and providing crucial feedback on interpretation of results and drafts of the
manuscript.
2.1. Background
Body size influences many aspects of ecology, physiology and evolutionary history
(Hutchinson and MacArthur 1959; Peters 1983; Calder 1984; Schmidt-Nielsen 1984;
McKinney 1990a; McClain and Boyer 2009), and patterns of animal body size evolution are a
long-standing subject of macroevolutionary investigation (e.g., Cope 1887; 1896; Depéret
1909; Newell 1949; Stanley 1973). As a major focus of natural selection, it is expected that
significant variation should occur in the body size of animals, although confined within
biological constraints, such as skeletal structure, thermoregulation and resource availability
(Schmidt-Nielsen 1984; McKinney 1990a; Price and Hopkins 2015). Furthermore, body size

Chapter 2: Crocodylomorph body size evolution
10
can often be easily measured or estimated from both fossil and modern specimens, and has
therefore been widely used in phenotypic macroevolutionary studies (Cope 1887; 1896;
Depéret 1909; Stanley 1973; Raup 1988; McKinney 1990a; Alroy 1998; Smith et al. 2010;
Venditti et al. 2011; Heim et al. 2015).
With few exceptions (e.g., Laurin 2004; Benson et al. 2014a), previous studies of
tetrapod body size evolution have focused on mammals (e.g., Alberdi et al. 1995; Alroy 1998;
Smith et al. 2010; Smith and Lyons 2011; Venditti et al. 2011; Saarinen et al. 2014; Churchill
et al. 2015; Gearty et al. 2018) and dinosaurs or birds (e.g., Burness et al. 2001; Hone et al.
2005; Carrano 2006; Turner et al. 2007; Butler and Goswami 2008; Lee et al. 2014; Benson
et al. 2014b; Carballido et al. 2017; Benson et al. 2018). Little is known, however, about
other diverse and morphologically disparate clades. Among those, Crocodylomorpha
represents an excellent group for studying large-scale evolutionary patterns, with a rich and
well-studied fossil record covering more than 200 million years, as well as living
representatives (Bronzati et al. 2012; 2015; Mannion et al. 2015). Previous work has
investigated multiple aspects of crocodylomorph macroevolution, including spatial and
temporal patterns of diversity (Markwick 1998a; Bronzati et al. 2015; Mannion et al. 2015),
as well as morphological variation, disparity, and evolution, with a particular focus on the
skull (Langston 1973; Brochu 2001; Sadleir and Makovicky 2008; Stubbs et al. 2013;
Toljagić and Butler 2013; Wilberg 2017; Chapter 4).
Nevertheless, studies quantitatively investigating macroevolutionary patterns of body
size in crocodylomorphs have been restricted to particular time periods (e.g., Triassic-Jurassic
body size disparity; Turner and Nesbitt 2013) or clades (e.g., metriorhynchids; Young et al.
2011), limiting broader interpretations. For instance, the influence of environmental
temperature on the growth and adult body size of animals has long been acknowledged as an

Chapter 2: Crocodylomorph body size evolution
11
important phenomenon (Schmidt-Nielsen 1984), and has been considered of significant
influence on the physiology and distribution of crocodylians (Allsteadt and Lang 1995;
Markwick 1998b). There is also strong evidence for climate-driven biodiversity patterns in the
group (e.g., Markwick 1998a; Mannion et al. 2015). Nevertheless, it remains unclear whether
extrinsic factors, such as temperature and geographic distribution, have impacted long-term
patterns of crocodylomorph body size evolution (Delfino and de Vos 2014).
Most of the earliest crocodylomorphs, such as Litargosuchus and Hesperosuchus,
were small-bodied animals (with estimated total lengths of less than 1 metre; Clark et al.
2000; Clark and Sues 2002), contrasting with some giant forms that appeared later, such as
Sarcosuchus and Deinosuchus (possibly more than 10 metres long; Erickson and Brochu
1999; Sereno et al. 2001), as well as with the intermediate to large sizes of extant
crocodylians (1.5–7 m; Ross 1998; Grigg et al. 2001). The absence of small-bodied forms
among extant species indicates a long-term pattern of body size increase in crocodylomorphs.
Directional trends of increasing body size through time (see McShea 1994), differential
extinction of small bodied taxa, or other factors, such as climate-driven evolutionary change
could explain this observation. However, because patterns of body size evolution along
phylogenetic lineages of crocodylomorphs have not been characterised, its causes are
unaddressed.
Since the end of the last century, palaeontologists have more frequently used
quantitative comparative methods to investigate the tempo and mode of evolution along
phylogenetic lineages (Felsenstein 1985; Hansen 1997; Pennell and Harmon 2013), including
studies of body size evolution (MacFadden 1986; McKinney 1990a; Alroy 1998; Carrano
2006; Butler and Goswami 2008; Smith et al. 2010). More recently, numerous studies have
employed a phylogeny-based model-fitting approach, using maximum likelihood or Bayesian

Chapter 2: Crocodylomorph body size evolution
12
framework to identify the best-fitting statistical macroevolutionary model for a given
phylogenetic comparative (Butler and King 2004; Hunt and Carrano 2010; Hunt 2012; Slater
2013; Benson et al. 2014a, b; Slater 2015; Benson et al. 2018).
Many of these works have tested the fit of a uniform macroevolutionary model, with a
single set of parameters applied across all branches of a phylogeny (e.g., Cooper and Purvis
2010; Young et al. 2011; Sookias et al. 2012a; Slater 2013). This approach can be
problematic as the dynamics of evolutionary trends vary through time, space and among
clades (Hunt 2008a, b; Mahler and Ingram 2014; Hunt et al. 2015; Khabbazian et al. 2016).
Therefore, uniform models are incompatible with the complexity of the natural world. In the
present Chapter, this is approached in the context of the Simpsonian Adaptive Landscape
(Simpson 1944; 1953), which have proved to be a fruitful conceptual framework for
characterizing macroevolutionary changes, encompassing ideas such as adaptive zone
invasion and quantum evolution (Hansen 2012; Arnold 2014; Mahler and Ingram 2014).
Macroevolutionary landscapes provide a conceptual bridge for dialogues between studies of
micro- and macroevolution, and have benefitted from the subsequent advancements of
molecular biology and genetics (Arnold et al. 2001). Within this paradigm, uniform models
primarily represent static macroevolutionary landscapes, with unchanged peaks (or maximum
adaptive zones; Stanley 1973) persisting through long time intervals and across the phylogeny
(Simpson 1953; Hansen 2012; Mahler and Ingram 2014).
Incorporating biological realism into statistical models of evolution is challenging
(Uyeda and Harmon 2014). Many existing models are based on a Brownian motion (BM)
process resulting from random walks of trait values along phylogenetic lineages (Felsenstein
1985; Hansen and Martins 1996; Hansen 2012). Uniform Brownian motion has many
interpretations. For example, it can be used as a model of drift, or of adaptive evolution

Chapter 2: Crocodylomorph body size evolution
13
towards lineage-specific selective optima that undergo random walks through time, and seems
reasonable for describing undirected stochastic change (Felsenstein 1985). Elaborations of
BM models were subsequently proposed. Among these, the BM model with a tendency for
directional evolution was formulated by adding a parameter μ (Pagel 2002), similar to the
slope of trait values through time. “Trend-shift” models have also been proposed, in which the
trend parameter (μ) undergoes clade-specific or time-specific shifts (Benson et al. 2018).
Several evolutionary models also describe trait evolution under an Ornstein–
Uhlenbeck (OU) process (Felsenstein 1988; Hansen 1997; Butler and King 2004; Beaulieu et
al. 2012; Slater 2013), which describes the evolution of a trait towards or around a stationary
peak or optimum value, at a given evolutionary rate. Thus, multi-regime OU models can
account for the existence of multiple macroevolutionary regimes (or adaptive zones, in the
Simpsonian Adaptive Landscape paradigm). Even though many OU-based models typically
require a priori adaptive hypotheses for inferring the trait optima of regimes (Butler King
2004), more recent methods attempt to solve this problem by estimating location, values and
magnitudes of regime shifts without a priori designation of selective regimes (Ingram and
Mahler 2013; Mahler and Ingram 2014; Uyeda and Harmon 2014). In particular, the
SURFACE method (Ingram and Mahler 2013) aims to identify convergent adaptive zones by
allowing regime shifts to occur and identifying convergent regimes using AICc (Akaike’s
information criterion for finite sample sizes; Akaike 1974). Originally designated to identify
convergent trait evolution across phylogenetic lineages, the SURFACE algorithm makes use
of a multi-peak OU-model and can be a tool to determine heterogeneity of macroevolutionary
landscapes (Mahler et al. 2013; Davis et al. 2014; Benson et al. 2018). In this Chapter, a
model-fitting approach is employed to characterize the adaptive landscape of body size

Chapter 2: Crocodylomorph body size evolution
14
evolution in Crocodylomorpha. This represents the first comprehensive investigation of major
body size evolutionary patterns across the entire evolutionary history of crocodylomorphs.
2.2. Material and Methods
2.2.1. Proxy for body size
Extinct Crocodylomorpha are morphologically diverse, and frequently known from
incomplete remains. Therefore, precise estimation of their body sizes, and those of
comparable fossil groups, can be challenging (see Brocklehurst [2016] and Young et al.
[2016a] for related considerations). There are many methods and equations for estimating
crocodylomorph body size (either body mass or length) available in the literature. The most
frequently used equations are derived from linear regressions based on specimens of modern
species, using both cranial (Webb and Messel 1978; Hall and Portier 1994; Sereno et al.
2001; Hurlburt et al. 2003; Platt et al. 2009; 2011) and postcranial (Bustard and Singh 1977;
Farlow et al. 2005) measurements as proxies. Although some of these approaches have been
claimed to work well when applied to extinct taxa (e.g., Farlow et al. 2005), they are expected
to be less accurate for extinct species that have different body proportions to those of extant
species (Young et al. 2011; Pol et al. 2012; Godoy et al. 2016; Young et al. 2016a). An
alternative approach that has been suggested is to use clade-specific equations that are derived
from regressions using fossil specimens with complete skeletons preserved, such as the
recently proposed equations for estimating body length in the highly specialised marine clade
Thalattosuchia (Young et al. 2011; 2016a). Nevertheless, using this approach for the entire
Crocodylomorpha would require numerous different equations and, consequently, complete
specimens for all desired subclades.

Chapter 2: Crocodylomorph body size evolution
15
Campione and Evans (2012) demonstrated a universal scaling relationship between
proximal (stylopodial) limb bone circumferences and the body masses of terrestrial tetrapods.
For instance, their equations, using both femur and humerus circumference, have been applied
to estimate body mass of fossil dinosaurs (e.g., Campione and Evans 2012; Campione et al.
2014; Benson et al. 2014b; Carballido et al. 2017; Benson et al. 2018). However, due to a
historical neglect of crocodylomorph postcranial anatomy, especially for Mesozoic taxa
(Godoy et al. 2016), relatively less information is available on this part of the skeleton. Based
on data collected for the present study, total or partial skull lengths (i.e., complete skulls or
lacking only the snouts) can be measured in fossil specimens of approximately 50% of
crocodylomorph species, whereas femoral and humeral shaft circumferences or lengths can
only be measured in 35% of species. This greatly reduces the number of taxa that can be
sampled and limits the utility of using postcranial elements as a proxy for body size. Similar
problems exist for other methods, such as the “Orthometric Linear Unit” proposed by Romer
and Price (1940) that uses dorsal centrum cross section (Currie 1978), as well as volumetric
reconstructions (e.g., Colbert 1962; Hurlburt 1999; Motani 2001; Bates et al. 2009; Sellers et
al. 2012), since relatively complete postcranial specimens are required.
For studying body size across all crocodylomorph evolutionary history, it was
necessary to find an appropriate body size proxy, allowing the sampling to be as
comprehensive as possible. Thus, two cranial measurements were used as proxies for total
body length: total dorsal cranial length (DCL) and dorsal orbito-cranial length (ODCL), which
is measured from the anterior margin of the orbit to the posterior margin of the skull.
Ultimately, using cranial measurements results in a study of the patterns of cranial size
evolution in crocodylomorphs (instead of patterns of body size evolution). Nevertheless, by
doing this, the addition of potential errors to the model-fitting analyses is avoided, since

Chapter 2: Crocodylomorph body size evolution
16
previous works have reported problems when estimating total body length from cranial
measurements, particularly skull length (Fig. 2.1), as the equations were formulated using
modern species and different crocodylomorph clades are likely to have body proportions
distinct from those of living taxa (e.g., Young et al. 2011; Godoy et al. 2016; Young et al.
2016a). Furthermore, the range of body sizes among living and extinct crocodylomorphs is
considerably greater than variation among size estimates for single species. Therefore, it is
expected that the analyses will recover the most important macroevolutionary body size
changes even when using only cranial measurements. The use of ODCL, in addition to DCL,
is justified as it allows to examine the sensitivity of the results to changes in proportional
snout length, as a major aspect of length change in crocodylomorph skulls results from
proportional elongation or shortening of the snout (Clark 1994; Pol and Gasparini 2009;
Wilberg 2015). Also, more taxa could be included in the analyses when doing so, because
ODCL can be measured from some incomplete skulls.
The DCL dataset includes 219 specimens (representing 178 taxa), whereas the ODCL
dataset includes 240 specimens (195 taxa). In total, measurements from 118 specimens (83
taxa) were collected via first-hand examination from specimens, using callipers and
measuring tape. The remaining information was collected from the literature (98 specimens)
or photographs (21 specimens) supplied by other researchers, and measurements were
estimated using the software ImageJ (for the complete list of sampled specimens see
information in Appendix A). Mean values were used in those cases where cranial
measurements were collected for multiple specimens of the same taxon. For both the model-
fitting and correlation tests, skull measurements (in millimetres) were log-transformed prior to
the analyses. However, to help with the further interpretation and discussion of the results,

Chapter 2: Crocodylomorph body size evolution
17
total body length was subsequently estimated using the equations presented by Hurlburt et al.
(2003).
Figure 2.1. Real total body length (measured from some complete fossil crocodylomorph specimens)
plotted against total length estimated from the cranial measurements DCL (A) and ODCL (B)
(equations from Hurlburt et al. [2003]), exemplifying the amount of error expected when using the
two measurements to estimate total body length of crocodylomorphs. R2 value illustrates the strength
of the correlation between real and estimated total lengths. Colours represent different mono- or
paraphyletic crocodylomorph groups. See Appendix A for information on the specimens used to
construct these plots.
2.2.2. Phylogenetic framework
For the phylogenetic framework of Crocodylomorpha, the aim was to maximise taxon
inclusion and to use a phylogenetic hypothesis that best represents the current consensus.
Thus, an updated version of the supertree presented by Bronzati et al. (2015) was primarily
used. This supertree, which originally contained 245 taxa, was manually modified (“informal
approach”) using the software Mesquite version 3.51 (Maddison and Maddison 2018). Apart
from modifications seeking to maximise congruence of the tree with the current
understanding of the phylogeny of the group, some recently published species were also

Chapter 2: Crocodylomorph body size evolution
18
added, and taxa that have not yet received a formal description and designation were
removed. Species not previously included in phylogenetic studies but for which body size
data was available were also added to the supertree.
The supertree presented by Bronzati et al. (2015) is restricted to Crocodyliformes,
which is less inclusive than Crocodylomorpha. Thus, non-crocodyliform crocodylomorphs
taxa were added, following the phylogenetic hypotheses presented by Pol et al. (2013) and
Leardi et al. (2017). Within Crocodyliformes, as in Bronzati et al. (2015) and other recent
studies (e.g., Andrade et al. 2011; Montefeltro et al. 2013; Pol et al. 2014; Turner and
Pritchard 2015; Buscalioni 2017), taxa classically associated to “Protosuchia” are
paraphyletically arranged in relation to Mesoeucrocodylia, with less inclusive subgroups
displayed following Bronzati et al. (2015). Accordingly, Hsisosuchus is the sister-group of
Mesoeucrocodylia (as in Clark 2011; Pol et al. 2014; Buscalioni 2017) and the following
groups represent taxa successively more distant from Mesoeucrocodylia: Shartegosuchidae
(Clark 2011); an unnamed clade composed by taxa such as Sichuanosuchus and
Shantungosuchus; an unnamed clade composed by Zaraasuchus and Gobiosuchus (Pol et al.
2014); Protosuchidae (Clark 2011; Pol et al. 2014; Turner and Pritchard 2015).
Within Mesoeucrocodylia, Notosuchia corresponds to the sister group of all the other
mesoeucrocodylians (= Neosuchia in our topology), similar to what is presented by Andrade
et al. (2011), Pol et al. (2014), and Turner and Pritchard (2015). Yet, Notosuchia comprises
forms such as baurusuchids, sebecosuchians, peirosaurids, sphagesaurids, uruguaysuchids,
and Araripesuchus. The relationships among taxa within Notosuchia follow the general
arrangement presented by Pol et al. (2014).
One of the branches at the basal split of Neosuchia leads to a clade composed by
longirostrine forms, which includes Thalattosuchia and Tethysuchia (i.e., Dyrosauridae and

Chapter 2: Crocodylomorph body size evolution
19
“pholidosaurids”). The sister-group relationship between Thalattosuchia and Tethysuchia
follows what was recovered in the supertree of Bronzati et al. (2015). Within Tethysuchia,
“pholidosaurids” are paraphyletic in relation to Dyrosauridae (also found in Pol et al. 2014;
Meunier and Larsson 2017; Young et al. 2017). Relationships among Dyrosauridae follow
Hastings et al. (2015). Relationships among thalattosuchians follow Young (2014) and
Herrera et al. (2015).
The sister-group of the longirostrine clade mentioned above contains Eusuchia and its
closest relatives such as Atoposauridae and Goniopholididae. The latter is depicted as the
sister group of Eusuchia, whereas the former corresponds to the sister group of Eusuchia +
Goniopholididae. This arrangement follows that recovered in Pol et al. (2014) and Bronzati et
al. (2015). Regarding the internal relationships of Goniopholididae, the hypotheses of Martin
et al. (2016) and Ristevski et al. (2018) were followed. For Atoposauridae, the arrangements
presented by Tennant et al. (2016a) and Schwarz et al. (2017) were followed. For
Paralligatoridae and Susisuchidae, the phylogenetic hypotheses of Turner (2015) and Turner
and Pritchard (2015) were followed.
In relation to non-crocodylian eusuchians, the topology of Bronzati et al. (2015) was
primarily followed, with modifications to accommodate the arrangements proposed by Turner
(2015) and Turner and Pritchard (2015) within Paralligatoridae and Susisuchidae. The
topology of Narváez et al. (2015) was followed regarding the interrelationships of the crown-
group, as well as the position of Hylaeochampsidae + Allodaposuchidae as the sister group of
Crocodylia. For the relationships within the crown-group, Brochu (2012), Brochu et al.
(2012), Scheyer et al. (2013), and Narváez et al. (2015) were followed.
The final updated version of this supertree contains 296 crocodylomorph species, as
well as nine closely related taxa used as outgroups for time-scaling the trees (see below).

Chapter 2: Crocodylomorph body size evolution
20
Additionally, to accommodate major uncertainties in the crocodylomorph phylogeny, two
other supertrees were constructed, with alternative positions of Thalattosuchia.
Thalattosuchians are Jurassic–Early Cretaceous aquatic crocodylomorphs, some of which
were probably fully marine (Herrera et al. 2017). They have classically been placed within
Neosuchia, as the sister taxon of Tethysuchia (Pol and Gasparini 2009). Nevertheless, some
authors have argued that this close relationship may result from the convergent acquisition of
longirostrine snouts in both groups (Clark 1994; Jouve et al. 2006), and some recent works
have suggested alternative positions for Thalattosuchia, within or as the sister group of
Crocodyliformes (i.e., only distantly related to Neosuchia; Young and Andrade 2009;
Montefeltro et al. 2013; Turner 2015; Wilberg 2015).
Accordingly, to test the influence of uncertainty over the phylogenetic position of
Thalattosuchia, the macroevolutionary analyses were performed using three distinct
topologies of Crocodylomorpha (Fig. 2.2). In the first topology, the more classic position of
Thalattosuchia was maintained (Thalattosuchia as the sister taxon of Tethysuchia and within
Neosuchia; as in the original supertrees of Bronzati et al. (2012; 2015). In the two alternative
topologies, Thalattosuchia was placed as the sister group of either Crocodyliformes (as non-
crocodyliform crocodylomorphs), following the position proposed by Wilberg (2015), or
Mesoeucrocodylia, following Larsson and Sues (2007) and Montefeltro et al. (2013). It is
worth stressing that discrepancies among competing phylogenetic hypotheses do not concern
only the “longirostrine problem” described above. However, the decision to further
investigate only the impact of the different positions of Thalattosuchia is based on its high
taxic diversity and the impact that its phylogenetic position has on branch lengths across
multiple parts of the tree, factors that can substantially alter macroevolutionary patterns
detected by the analyses.

Chapter 2: Crocodylomorph body size evolution
21
Figure 2.2. Simplified cladogram showing the phylogenetic relationships among crocodylomorphs
and the alternative positions of Thalattosuchia (dashed red lines), following Larsson and Sues (2007),
Bronzati et al. (2012; 2015), Montefeltro et al. (2013), and Wilberg (2015). Silhouettes of
crocodylomorph representatives in figures are from illustrations by Dmitry Bogdanov, Smokeybjb,
and Nobumichi Tamura, hosted at Phylopic (http://phylopic.org), where license information is
available.
2.2.3. Time-calibration
To perform the macroevolutionary analyses, it was necessary to time-calibrate the
phylogenies, assigning ages to both terminal taxa and nodes (Bapst 2014a). This is a crucial
step in comparative analyses of trait evolution, as the use of different methods may impact
upon the inference of evolutionary models and the interpretation of results (Bapst 2013;
2014b). As such, three different time-scaling methods were used, each one with benefits and
drawbacks. For these methods, ages (first and last occurrence dates) were initially obtained

Chapter 2: Crocodylomorph body size evolution
22
from the Paleobiology Database (PBDB), but were then checked using primary sources in the
literature. To accommodate uncertainties related to the ages of terminal taxa (i.e., most taxon
ages are based on single occurrences, known only within rather imprecise bounds), first and
last occurrence dates were treated as maximum and minimum possible ages and drew terminal
dates for time-calibration from a uniform distribution between these.
The first time-scaling method used was the minimum branch length method (mbl;
Laurin 2004), in which a minimum branch duration is set a priori, to avoid the presence of
undesirable and unrealistic zero-length branches (Bapst 2014a, b). For the analyses within this
Chapter, the minimum of 1 Myr was set. Additionally, two recently introduced probabilistic
time-scaling methods were also used. The cal3 is a stochastic calibration method that requires
estimates of sampling and diversification (branching and extinction) rates to draw likely
divergence dates under a birth–death-sampling model (Bapst 2013; Lloyd et al. 2016). The
fact that most crocodylomorph taxa are singletons (i.e., very few genera or species have
multiple occurrences in different time intervals) prevented the direct calculation of speciation,
extinction and sampling rates needed as inputs to the cal3 method. Thus, when using this
time-scaling method for the analyses within this Chapter, the same rates estimated for
dinosaurs in Lloyd et al. (2016) were adopted (i.e., extinction and speciation rates = 0.935;
sampling rate = 0.018), which used the apparent range-frequency distribution of dinosaurs in
the PBDB for these estimates. Although essentially different from that of dinosaurs, the
crocodylomorph fossil record is arguably comparable enough to result in similar rates, and a
posteriori comparison to other time-scaling methods demonstrated that results were
reasonable. The last time-scaling method used was the extended Hedman method, proposed
by Lloyd et al. (2016), which is an expansion of the Bayesian approach presented by Hedman
(2010), that uses the ages of successive outgroup taxa relative to the age of the node of

Chapter 2: Crocodylomorph body size evolution
23
interest to date this node by sampling from uniform distributions (Lloyd et al. 2016;
Brocklehurst 2017).
Since the input phylogenies were not completely resolved (i.e., the three alternative
topologies of the supertree), the polytomies were randomly resolved, generating 20
completely resolved trees for each alternative phylogenetic scenario (i.e., with different
positions of Thalattosuchia). These trees were then time-scaled using the three time-
calibration methods. Time-scaling with the mbl and cal3 methods were performed using the
package paleotree (Bapst 2012) in R version 3.5.1 (R Core Team 2018), whilst the Hedman
method was implemented also in R, using the protocol published by Lloyd et al. (2016).
2.2.4. Macroevolutionary analyses
A model-fitting approach was applied to characterize patterns of body size evolution in
Crocodylomorpha, with an emphasis on evolutionary models based on the Ornstein-
Uhlenbeck (OU) process (Hansen 1997; Butler and King 2004; Ingram and Mahler 2013;
Slater 2013; Benson et al. 2018). The first formulation of an OU-based model was proposed
by Hansen (1997), to incorporate Felsenstein’s (1988) suggestion of using the Ornstein-
Uhlenbeck (OU) process as a basis for comparative studies (Butler and King 2004; Beaulieu
et al. 2012). OU-based models (also known as “Hansen” models) express the dynamics of a
quantitative trait evolving along the branches of a phylogeny as the result of stochastic
variation around a trait “optimum” (expressed as theta: θ), towards which trait values are
deterministically attracted (the strength of attraction is given by alpha: α). The constant σ2,
describes the stochastic spread of the trait values over time (i.e., under a Brownian motion
process). Accordingly, the OU model can be formulated as:

Chapter 2: Crocodylomorph body size evolution
24
dX(t)= α [θ − X(t)] dt + σdB(t)
This equation expresses the amount of change in trait X during the infinitesimal time
interval from t to t + dt. As expressed above, the formulation includes a term describing trait
attraction towards θ, which is the product of α and the difference between X(t) and θ. The
term σdB(t) describes stochastic evolution in the form of Brownian motion (BM), with
random variables of mean zero and variance of dt (thus, σ2 is the rate of stochastic evolution).
In this sense, if α is zero, the attraction term becomes zero, and the result is evolution by BM
as a special case of OU (Butler and King 2004; Slater 2013; Benson et al. 2018). The OU
model can also simulate trait evolution patterns similar to that observed under other
evolutionary models, such as BM with a trend incorporated, and “white noise” or stasis
(Hansen 1997; Slater 2013; Benson et al. 2018). Thus, the parameters of the OU model are
crucial for interpreting the mode of evolution (Hansen 1997; Butler and King 2004). For
example, the estimated ancestral trait value (i.e., the value of θ at the root of the tree) is given
by the parameter Z0. Also, the time taken for a new macroevolutionary regime to become
more influential than the ancestral regime (i.e., how long it takes to θ to be more influential
than Z0) can be obtained by calculating ln(2)/α. This parameter is often called the
phylogenetic half-life (or t0.5).
Among the methods that attempt to model adaptive evolution under the framework of
an Ornstein-Uhlenbeck process (e.g., Harmon et al. 2008; Beaulieu et al. 2012; Uyeda and
Harmon 2014), the SURFACE algorithm (Ingram and Mahler 2013) estimates the fit of a
non-uniform OU-based model by allowing shifts in trait optima (θ) among macroevolutionary
regimes. SURFACE locates regime shifts using stepwise AICc (Akaike’s information
criterion for finite sample sizes; Akaike 1974; Sugiura 1978; Burnham and Anderson 2003),

Chapter 2: Crocodylomorph body size evolution
25
with a forward phase (that searches for all regime shifts in the phylogeny) and a backward
phase (in which improvements of AICc scores merge similar regimes, detecting convergent
evolution). Although it allows θ to vary among regimes, SURFACE assumes fixed whole-tree
values of σ2 and α (Ingram and Mahler 2013).
The performance of two different OU-based models was compared, one with a single
trait optimum or a single macroevolutionary regime (“OU model”) and another non-uniform
model with multiple regimes (“SURFACE model”). To test if other macroevolutionary
models could provide a better description of the observed patterns of crocodylomorph body
size evolution, these OU-based models were also compared to other BM-based models. First,
the diffusion by Brownian motion (BM model), which assumes evolution via random walks,
with a constant normally distributed deviation from the observed morphology, resulting in no
directional trend in trait mean, but with increasing trait variance through time (Felsenstein
1985; Hunt and Carrano 2010; Hunt 2012; Slater 2013). Second, the “early burst” (EB model;
also known as “ACDC model”; Blomberg et al. 2003), in which the lineages experience an
initial maximum in evolutionary rate of change, that decreases exponentially through time
according to the parameter r (Harmon et al. 2010). This results in a rapid increase of trait
variance in the early evolution of the lineages, followed by a deceleration (Blomberg et al.
2003; Harmon et al. 2010).
Finally, a set of uniform and non-uniform trend-like models were also fitted to the
data. In the uniform “trend” model (i.e., with a single regime), the parameter μ is incorporated
into the BM model to describe directional multi-lineage increase or decrease in trait values
through time, in the entire clade (Pagel 2002; Hunt and Carrano 2010; Hunt 2012). Non-
uniform “trend” models allow for shifts in the parameter μ, which can be explored in two
different ways according to the formulations of non-uniform trend models formulated by G.

Chapter 2: Crocodylomorph body size evolution
26
Hunt and presented in Benson et al. (2018): temporal shifts in μ (“time-shift trend models”) or
shifts in μ at specific nodes of the tree (“node-shift trend models”). In time-shift trend models,
evolutionary dynamics are uniform across all branches alive during each interval. Shifts to a
new value of μ occurs at time-horizons and are applied to all lineages alive at that time. In
node-shift trend models, values of μ can vary among lineages. In a similar approach to the
forward phase of SURFACE, the shifts in these non-uniform trend-like models are detected
via stepwise AICc. In both time-shift and node-shift models, the Brownian variance (σ2) is
constant across all regimes (Benson et al. 2018). For the macroevolutionary analyses with the
entire crocodylomorph phylogeny, trend-like models allowing up to three time-shifts and ten
node-shifts to occur were fitted.
Then, a set of exploratory analyses were performed to test which of these evolutionary
models (SURFACE, OU, BM, EB and trend-like models) offered the best fit to the data, using
the different time-scaling methods (mbl, cal3 and Hedman methods) and both log-transformed
cranial measurements (DCL and ODCL). To reduce the computational demands, only 20
randomly resolved trees of the original supertree topology were used (with Thalattosuchia
positioned traditionally within Neosuchia). The aim was to compare the performance of the
OU-based models, particularly the SURFACE model, against the other evolutionary models,
but also to evaluate possible influences of the different time-scaling methods and body size
proxies. Maximum-likelihood was employed to fit these models to body size data and the
phylogeny of Crocodylomorpha, and AICc scores were used to compare the performance of
each model.
Previous works suggested caution when fitting OU models in comparative analyses
(e.g., Ho and Ané 2014; Cooper et al. 2016). The issue of “large p small n” when using multi-
regime OU models, demonstrated by Ho and Ané (2014), can result in false positives and

Chapter 2: Crocodylomorph body size evolution
27
spurious support to more complex models (Khabbazian et al. 2016; Benson et al. 2018). This
issue may be reduced when using non-ultrametric trees (as done here), as this improves
identifiability of the parameters of OU models (Slater 2013; Ho and Ané 2014). Another
approach would be using the phylogenetic Bayesian information criterion (“pBIC”), proposed
by Khabbazian et al. (2016), as an alternative to using AICc for selecting the best fit. Ho and
Ané (2014) demonstrated that AICc is biased towards model overfit and suggested using
pBIC, a modified Bayesian information criterion (mBIC; Zhang and Siegmund 2007), which
is more conservative and has low rates of false positive identification of OU model regime
shifts (Khabbazian et al. 2016; Benson et al. 2018). The pBIC criterion is still not
implemented for all evolutionary models used in this Chapter, which prevents its usage for the
comparative model-fitting analyses. However, pBIC was used during the backward phases of
SURFACE model searches, to ensure that artefactually complex models were not returned.
Following these exploratory analyses, the analyses focused on the SURFACE model,
as the AICc scores indicated that this evolutionary model outperforms the others (see the
“Results” section of this Chapter). This second phase of analyses made use of all three
alternative phylogenetic scenarios (varying the position of Thalattosuchia) to test the
influence of phylogeny in interpretations of evolutionary regimes for body size in
Crocodylomorpha. SURFACE models were fitted to 20 randomly resolved trees from each of
these alternative topologies, using three different time-scaling methods (mbl, cal3 and
Hedman methods) and two log-transformed cranial measurements (DCL and ODCL). As
before, a conservative backward-phase of SURFACE was implemented, with pBIC searches
instead of AICc.
Two well-recognized crocodylomorph subclades, Notosuchia and Crocodylia, returned
a high frequency of macroevolutionary regime shifts, representing an apparently complex

Chapter 2: Crocodylomorph body size evolution
28
evolutionary history under the SURFACE paradigm. However, SURFACE fits a single value
of α to all regimes, and therefore could overestimate the strength of evolutionary constraint
within regimes, and consequently miscalculate the number of distinct regimes within clades
showing more relaxed patterns of trait evolution. This possibility was investigated by fitting
the initial set of evolutionary models (SURFACE, OU, BM, EB and trend-like models) to the
phylogenies of these two subclades (using 100 randomly resolved trees of each group, time-
scaled with the mbl method) and their body size data (using only the ODCL dataset, since it
includes more species). Differently from what was done for the entire crocodylomorph
phylogeny, trend-like models fitted to Notosuchia allowed up to 2 time-shifts and 5 node-
shifts to occur, whereas for Crocodylia 3 time-shifts and 7 node-shifts were allowed to occur
(given that these two clades include fewer species and fewer shifts are expected, and that
models with an exceeding number of shifts usually receive weaker support). In addition, for
these same clades, the OUwie model-fitting algorithm was also employed (Beaulieu et al.
2012), fitting different BM and OU-based models which allow all key parameters to vary
freely (since SURFACE allows only θ to vary, whereas it assumes fixed values of σ2 and α for
the entire tree). However, differently from SURFACE, OUwie needs a priori information on
the location of regime shifts in order to be implemented. Thus, the same regime shifts
identified by SURFACE were incorporated into the data (phylogenetic and body size data) to
fit four additional evolutionary models using the OUwie algorithm: BMS, which is a multi-
regime BM model that allows the rate parameter σ2 to vary; OUMV, a multi-regime OU-
based model that allows σ2 and the trait optimum θ to vary; OUMA, also a multi-regime OU
model, in which θ and the constraint parameter α can vary; and OUMVA, in which all three
parameters (θ, α and σ2) can vary. Since computing all these parameters estimates can be an
intensively demanding task (Beaulieu et al. 2012), some of the model fits returned

Chapter 2: Crocodylomorph body size evolution
29
nonsensical values and were, therefore, discarded. Nonsensical values were identified by
searching for extremely disparate parameter estimates, among all 100 model fits (e.g., some
model fits found σ2 values higher than 100,000,000 and α lower than 0.00000001).
All macroevolutionary analyses were performed in R version 3.5.1 (R Core Team
2018). Macroevolutionary models BM, trend, EB, and OU with a single regime were fitted
using the R package geiger (Harmon et al. 2008). The SURFACE model fits were performed
with package surface (Ingram and Mahler 2013). Implementation of pBIC functions in the
backward-phase of SURFACE model fits, as well as the functions for fitting non-uniform
trend-like models, were possible with scripts presented by Benson et al. (2018). The
additional model-fitting analyses, using the OUwie algorithm, were implemented with the
package OUwie (Beaulieu and O'Meara 2016).
2.2.5. Correlation with abiotic factors
To test whether abiotic environmental factors could be driving the evolution and distribution
of body sizes in crocodylomorphs, environmental information was extracted from the
literature. As a proxy for palaeotemperature, δ18O data from two different sources was used.
The dataset from Zachos et al. (2008) assembles benthic foraminifera isotopic values from the
Late Cretaceous (Maastrichtian) to the Recent. The work of Prokoph et al. (2008) compiled
sea surface isotopic values from a range of marine organisms. Their dataset is divided into
subsets representing palaeolatitudinal bands. For the analyses in this Chapter, two subsets
were used: the temperate palaeolatitudinal subset, which extends from the Jurassic to the
Recent, as well as the tropical palaeolatitudinal subset, which extends back to the Cambrian.
For the correlation analyses, 10 Myr time bins were used (see Appendix A for information
about the time bins), by taking the time-weighted mean δ18O for data points that fall within

Chapter 2: Crocodylomorph body size evolution
30
each time bin. For the body size data used in the correlation tests, maximum and mean size
values were calculated for each time bin, using both DCL and ODCL datasets. Correlations
between the body size data and the proxies for palaeotemperature were first assessed using
ordinary least squares (OLS) regressions. Then, to avoid potential inflation of correlation
coefficients created by temporal autocorrelation (the correlation of a variable with itself
through successive data points), a first-order autoregressive model was incorporated to
generalised least squares (GLS) regressions (see e.g., Hunt et al. 2005; Marx and Uhen 2010;
Benson and Butler 2011; Mannion et al. 2015). Furthermore, to test the possible differential
influence of temperature on marine versus continental (terrestrial and freshwater) animals,
two additional body size data subsets were created, one with only marine and another with
only non-marine crocodylomorphs.
Additionally, palaeolatitudinal data was collected, from the PBDB and the literature,
for every specimen in the datasets (DCL and ODCL datasets). The correlation between this
palaeolatitudinal data and the body size data was first tested by applying OLS regressions to
untransformed data. Then, to deal with possible biases generated by phylogenetic
dependency, phylogenetic generalized least squares regressions (PGLS; Martins and Hansen
1997) were used. For this, branch length transformations were optimised between bounds
with maximum likelihood using Pagel’s λ (Pagel 1999), by setting the argument λ = “ML”
within in the function pgls() of the R package caper (Orme et al. 2018). As for the correlation
analyses between body size data and palaeotemperature, the datasets were also divided into
two subsets each (only marine and only non-marine taxa).
Finally, to explore the effects of these two abiotic factors on the distribution of body
sizes at more restricted levels (temporal and phylogenetic), all these regression analyses were
repeated using subsets including only species of Crocodylia, Notosuchia, Thalattosuchia, and

Chapter 2: Crocodylomorph body size evolution
31
Tethysuchia. For crocodylians, correlations with paleotemperature were restricted to the
Maastrichtian until the Recent (i.e., data from Zachos et al. 2008). All correlation analyses
used log-transformed cranial measurements (DCL and ODCL) in millimetres and were
performed in R version 3.5.1 (R Core Team 2018). GLS regressions with an autoregressive
model were carried out using the package nlme (Pinheiro et al. 2017), whereas PGLS
regressions used the package caper (Orme et al. 2018).
2.3. Results
2.3.1. Comparative model-fitting analyses
Comparisons between the AICc scores for all the evolutionary models fitted to the
crocodylomorph body size data (Fig. 2.3) show extremely strong support for the SURFACE
model (note that lower AICc values indicate higher support). This is observed for all time-
scaling methods (mbl, cal3 and Hedman methods) and both body size proxies (DCL and
ODCL). All uniform models exhibit relatively similar AICc scores, including the OU model
with a single macroevolutionary regime, and all of these have poor support compared to the
SURFACE model. Node-shift trend models received higher support than both uniform and
time-shift trend models for most phylogenies, but have AICc values that are more similar to
the set of uniform models than to the SURFACE models. Single-regime OU models only
have better AICc scores than multi-trend models when trees are time-scaled with the mbl
method. Even the best trend-like model (usually the models with six or seven node-shifts)
have significantly weaker support than SURFACE, regardless of the time-calibration method
(see Appendix A for a complete list of AICc scores, including for all trend-like models).
Based on the extremely strong support found for the SURFACE model, as well as on the
capability of the SURFACE algorithm to locate the regime shifts across the phylogeny

Chapter 2: Crocodylomorph body size evolution
32
(Ingram and Mahler 2013), the subsequent analyses focused on the SURFACE model fits, to
characterize in more detail the patterns of crocodylomorph body size macroevolution.
Figure 2.3. AICc scores of the evolutionary models fitted to crocodylomorph phylogeny and body size
data. Results shown for two cranial measurement datasets (ODCL in the left column and DCL in the
right one), as well as using three different methods to time-calibrate 20 randomly resolved phylogenies
of Crocodylomorpha: (A) mbl, (B) Hedman, and (C) cal3 methods. For the trend-like models, only the
AICc of the best model (“best trend”) is shown.
Chapter 2: Crocodylomorph body size evolution
33
2.3.2. Appraising the SURFACE model fits
Aiming to minimise the problem of biased AICc support for more complex models (see Ho
and Ané 2014; Khabbazian et al. 2016), two rounds of SURFACE model fits were
implemented: one using the original algorithm (Ingram and Mahler 2013), with stepwise
AICc searches in the two phases of SURFACE; and another using a modified version of the
SURFACE algorithm presented by Benson et al. (2018), which uses pBIC searches in the
backward-phase. This latter approach is more conservative and potentially should be able to
indicate when overly complex models are being inappropriately supported, since the input
trees used for this alternative implementation of SURFACE were the same as those used for
the model fits with the original algorithm (i.e., with AICc searches only). Comparisons
between the SURFACE results using pBIC and only AICc show that, in almost all cases,
identical model fits are found for the same trees, with the same parameter estimates (Table
2.1). For the very few trees in which this is not true, the models are still very similar, with
only minimal differences in the parameter values, mainly in θ values. This pattern was
maintained when using any time-scaling method, cranial measurement or tree topology,
indicating that the SURFACE model fits are not erroneously complex.

Chapter 2: Crocodylomorph body size evolution
34
Table 2.1. Parameter estimates from some of the SURFACE model fits, using both stepwise search
algorithms: full-AICc searches and backward-phase of SURFACE with pBIC searches. Model fits of
the first ten trees (using the ODCL dataset, the mbl time-scaling method and with Thalattosuchia
within Neosuchia). Z0 values in log10 millimetres. “Number of regimes” represents the number of main
(“convergent”) regimes for each model fit. See Appendix A for plots of all SURFACE model fits,
containing information about parameter estimates.
Tree
number
Parameter estimates
full-AICc searches pBIC in the backward-phase
α σ2 Z0 Number of
regimes α σ2 Z0
Number of
regimes
1 0.217 0.005 1.642 10 0.217 0.005 1.642 10
2 16.06 0.418 1.648 8 16.06 0.418 1.648 8
3 0.162 0.004 1.647 10 0.162 0.004 1.647 10
4 0.148 0.004 1.653 10 0.148 0.004 1.653 10
5 0.128 0.003 1.639 10 0.128 0.003 1.639 10
6 0.055 0.002 1.696 9 0.055 0.002 1.696 9
7 0.058 0.002 1.704 10 0.058 0.002 1.704 10
8 0.08 0.003 1.657 9 0.08 0.003 1.657 9
9 0.148 0.003 1.641 9 0.148 0.003 1.641 9
10 0.523 0.012 1.648 8 0.523 0.012 1.648 8
The SURFACE model fits exhibit a strong correlation between AICc/pBIC scores and
the number of macroevolutionary regime shifts (Fig. 2.4; see Appendix A for plots of all
SURFACE model fits). In general, model fits with lower (i.e., better) AICc/pBIC values tend
to have more regime shifts. In other words, more complex models seem to be favoured by
better AICc/pBIC values. Additionally, apart from higher (i.e., worse) AICc/pBIC values,
simpler SURFACE model fits also tend to exhibit lower α values. Thus, simpler model fits are

Chapter 2: Crocodylomorph body size evolution
35
characterised by high-AICc/pBIC scores and low values of α. Because the same randomly
resolved tree topologies were used for each of the time-scaling methods (mbl, cal3 and
Hedman), it was possible to compare the SURFACE model fits of these same trees obtained
across different branch-length calibration methods, by calculating pBIC scores (e.g.,
calculating the pBIC score the regime configuration obtained from analysis of the cal3-
calibrated tree on the mbl-calibrated tree; see Appendix A for all cross plotting of SURFACE
model fits on trees using different time-scaling methods). This shows that many of the
simplest SURFACE model fits are suboptimal (i.e., received worse pBIC scores) compared to
more complex regime configurations obtained during searches on trees with different branch-
lengths (Table 2.2). The simple models returned by some searches therefore represent failure
of the stepwise-AICc search to find the best regime configuration and are consequently not
considered when the macroevolutionary patterns of body size in crocodylomorphs are
described. Suboptimal model fits were more frequent on topologies with Thalattosuchia
placed as the sister group of Crocodyliformes, particularly when time-scaled using mbl and
cal3 methods. Although a full explanation cannot be provided for why the frequency of
suboptimal model fits varied among topologies with alternative positions of Thalattosuchia, it
is expected that AIC procedures face difficulties when finding the best fits for complex
datasets (Burnham et al. 2011), even when using pBIC. However, the SURFACE model fits
represent a useful simplification of major patterns of body size evolution in a group, and
particularly the shifts of average body sizes among clades on the phylogeny. In this respect,
they provide an overview of crocodylomorph body size evolution that is otherwise lacking
from current literature.

Chapter 2: Crocodylomorph body size evolution
36
Figure 2.4. AICc (left) and pBIC (right) plotted against the number of regime shifts of SURFACE
model fits, using crocodylomorph topologies with alternative positions of Thalattosuchia: A and B,
Thalattosuchia within Neosuchia; C and D, Thalattosuchia as the sister group of Crocodyliformes; E
and F, Thalattosuchia as the sister group of Mesoeucrocodylia. Numbers represent the 20 randomly
resolved trees (time-calibrated using the mbl method) used for each model fit. Body size data from the
ODCL dataset only.

Chapter 2: Crocodylomorph body size evolution
37
Table 2.2. Examples of comparisons between simpler and more complex SURFACE model fits for the
same trees. pBIC scores were obtained for regime configuration mapped onto trees with the same
topology but using different time-calibration methods. By doing this, it was possible to compare the
pBIC scores between simpler and more complex SURFACE model fits. Model fits shown are for trees
with Thalattosuchia as the sister group of Crocodyliformes and using body size data from the ODCL
dataset only. See Appendix A for all cross plotting of regime configurations.
Tree number and original
time-scaling method
pBIC scores
Simple model Complex model
Tree 3 (mbl-calibrated)
mbl fit on mbl tree Hedman fit on mbl tree
-130.2 -158.9*
Tree 3 (cal3-calibrated)
cal3 fit on cal3 tree Hedman fit on cal3 tree
-139.1 -157*
Tree 4 (cal3-calibrated)
cal3 fit on cal3 tree Hedman fit on cal3 tree
-132.6 -133.8*
Tree 5 (mbl-calibrated)
mbl fit on mbl tree cal3 fit on mbl tree
-105.7 -133.5*
Tree 6 (mbl-calibrated)
mbl fit on mbl tree Hedman fit on mbl tree
-130.1 -160.4*
Tree 7 (Hedman-calibrated)
Hedman fit on Hedman tree mbl fit on Hedman tree
−164.9* -152.8
The SURFACE analyses using different body size proxies (DCL and ODCL) and
time-scaling methods (mbl, cal3 and Hedman methods) enabled the assessment of the
influence of these factors on the SURFACE results. First, in general, alternative time-scaling
methods did not cause substantial modifications to the SURFACE model fits in terms of

Chapter 2: Crocodylomorph body size evolution
38
numbers of regimes or parameter values. However, as these methods generate different
divergence times, branch lengths and ages estimated for the origin of subclades are expected
to be distinct. Comparatively, while the Hedman method tended to estimate arguably too old
ages for the origins of some clades (estimating, for example, the origin of the crown-group to
be as old as the Late Jurassic compared to the Late Cretaceous ages of the oldest known
unequivocal crocodylians), trees that used the cal3 method often included branches with
lengths very close to zero. Furthermore, trees that were time-scaled using cal3 recovered
comparatively more suboptimal SURFACE model fits than those that used the other two
methods. Thus, the SURFACE model fits with trees calibrated using the mbl method were
favoured when describing and discussing the SURFACE results (even though those model fits
generated using the other two methods were not completely discarded).
Second, comparable results are found across model fits with different cranial
measurements (DCL and ODCL) when using the same time-scaling methods and tree
topologies. Although there are slightly more suboptimal model fits when using the DCL
dataset, there is not enough evidence to support the idea that the use of a different cranial
measurement is causing this pattern, as due to taxon sampling the phylogenetic trees used for
fitting models using DCL and ODCL are different. However, in order to minimise the number
of model fits used to characterise crocodylomorph body size evolution, the results obtained
from the ODCL dataset were favoured for the description of the macroevolutionary patterns,
as this dataset includes more species than the DCL, and it usually provides more realistic
estimated body size values (for θ and Z0) when using the equations presented by Hurlburt et
al. (2003).
The position of Thalattosuchia had an influence on the range of the attraction
parameter (α), which is a whole-tree, fixed parameter in the SURFACE model fits. When

Chapter 2: Crocodylomorph body size evolution
39
Thalattosuchia is placed as the sister taxon of Crocodyliformes, the lowest values of α were
obtained (ranging from 0.0072 to 0.1399), perhaps reflecting the more frequent suboptimal
model fits for this scenario, and consequently the highest phylogenetic half-lives (t0.5 = 4.95 to
95.99 Myr). In the other two alternative scenarios (i.e., Thalattosuchia either within
Neosuchia or as the sister group of Mesoeucrocodylia), comparable values of α were found,
ranging from 0.0136 to 0.6595, with considerably shorter phylogenetic half-lives (t0.5 = 1.05
to 50.89 Myr).
2.3.3. Describing the body size macroevolutionary patterns in Crocodylomorpha
The SURFACE model fits were used to describe patterns of crocodylomorph body size
evolution, focusing on the best model fits from the analyses implemented with pBIC searches
(i.e., the low-pBIC/high-α model class), using body size data from the ODCL dataset and
trees time-calibrated mainly (but not only) with the mbl method (see Appendix A for plots of
all SURFACE model fits). Most SURFACE model fits identified more than four main
macroevolutionary regimes (with different θ values). These are distributed along
crocodylomorph phylogeny by means of numerous regime shifts, usually more than 15,
independently of the position of Thalattosuchia. Trait optima values for these regimes varied
significantly among different crocodylomorph subclades and are described in detail below.
Overall, regime shifts are frequently detected at the bases of well-recognised clades, such as
Thalattosuchia, Notosuchia and Crocodylia. Nevertheless, shifts to new regimes are not
restricted to the origins of these diverse clades, since many other regime shifts are observed
across crocodylomorph phylogeny, including regimes containing only a single species.
The SURFACE results indicate an ancestral regime of small body sizes for
Crocodylomorpha, regardless of the topology or time-scaling method used (Figs. 2.5, 2.6, and

Chapter 2: Crocodylomorph body size evolution
40
2.7). This is consistent with the small body sizes of most non-crocodyliform crocodylomorphs
such as Litargosuchus leptorhynchus and Hesperosuchus agilis (Clark et al. 2000; Clark and
Sues 2002). Trait optima for this initial regime (Z0) ranged from 66 to 100 cm (total body
length was estimated only after the SURFACE model fits, based on the equation from
Hurlburt et al. [2003]; see the “Material and Methods” section of this Chapter). Very few or
no regime shifts are observed among non-crocodyliform crocodylomorphs (Figs. 2.5, 2.6 and
2.7B), except for when Thalattosuchia is placed outside Crocodyliformes (Fig. 2.7A). But
even in this latter case, shifts are seen only within or at the base of Thalattosuchia. For
example, some trees time-scaled with mbl (tree number 11; Fig. 2.7B) and cal3 (trees number
13 and 15) methods show a Late Triassic regime shift towards much larger body lengths (θ =
560–880 cm) at the base of Thalattosuchia, but many model fits that used these methods also
exhibit much simpler models, with very few regime shifts. When using the Hedman method,
however, a shift at the base of Thalattosuchia is more frequently observed, in many cases
representing the oldest regime shift in the evolutionary history of Crocodylomorpha, and the
only one to occur before the Triassic-Jurassic boundary (although the oldest thalattosuchian
fossils only occur in the Early Jurassic). Regardless of the position of Thalattosuchia, the
ancestral regime of all crocodylomorphs (Z0) was inherited by protosuchids (such as
Protosuchus, Orthosuchus, and Edentosuchus) and some other non-mesoeucrocodylian
crocodyliforms (e.g., Shantungosuchus, Fruitachampsa, Sichuanosuchus and Gobiosuchus).

Chapter 2: Crocodylomorph body size evolution
41
Figure 2.5. SURFACE model fit (using pBIC searches in the backward-phase) of tree number 10
among crocodylomorph topologies with Thalattosuchia placed within Neosuchia, using the ODCL
dataset and time-calibrated with the mbl method. Attraction to unrealized low or high trait optima are
highlighted in blue and red, respectively. Model fits of trees sharing the same position of
Thalattosuchia show very similar regime configurations, regardless of the dataset used (ODCL or
DCL) and the time-calibration method (see Appendix A for all SURFACE plots).

Chapter 2: Crocodylomorph body size evolution
42
Patterns of body size evolution at the base of Mesoeucrocodylia are influenced by the
position of Thalattosuchia. In nearly all model fits with Thalattosuchia within Neosuchia
(Figs. 2.5 and 2.6), a regime of smaller body sizes (θ = 130–230 cm) is observed at the base of
the branch leading to Mesoeucrocodylia, with the same regime frequently inherited by the
branches leading to both Notosuchia and Neosuchia. When thalattosuchians are placed as the
sister group of Crocodyliformes, a similar pattern is observed in most trees time-scaled with
the Hedman method, but also in trees number 13 and 15 with the cal3 method, and number 11
(Fig. 2.7A) with the mbl method. With Thalattosuchia as the sister group of all the other
mesoeucrocodylians (i.e., Notosuchia + Neosuchia), most trees exhibit a change to a regime
of larger sizes (θ = 210–490 cm) occurring at the branch leading to Mesoeucrocodylia (Fig.
2.7B), although some model fits (e.g., trees number 5, 8, 10, and 16 using all time-scaling
methods) show no shift at the base Mesoeucrocodylia (i.e., inheriting the same regime as non-
mesoeucrocodylian crocodyliforms). When a change at the base of Mesoeucrocodylia is
observed, this same regime is usually inherited by Neosuchia, and shifts to regimes of smaller
sizes (θ = 66–140 cm) are subsequently seen either at the base of or within Notosuchia.

Chapter 2: Crocodylomorph body size evolution
43
Figure 2.6. A, SURFACE model fit (using pBIC searches in the backward-phase) of tree number 16
among crocodylomorph topologies with Thalattosuchia placed within Neosuchia, using the ODCL
dataset and time-calibrated with the mbl method. Attraction to unrealized low or high trait optima are
highlighted in blue and red, respectively. B, Simplified version of (A) with independent multi-taxon
regimes collapsed to single branches.

Chapter 2: Crocodylomorph body size evolution
44
The position of Thalattosuchia also has an impact on the configuration of regime shifts
among non-eusuchian neosuchians. The regime of relatively smaller sizes at the base of
Mesoeucrocodylia is maintained at the base of Neosuchia in most model fits of trees with
Thalattosuchia within Neosuchia (Fig. 2.5 and 2.6). Subsequently, regime shifts towards
larger sizes (θ = 210–500 cm) are seen among some taxa such as goniopholidids, Agaresuchus
and Allodaposuchus, whereas shifts to regimes of smaller θ values (41–140 cm) are also
detected in branches associated with small taxa (e.g., atoposaurids, susisuchids and
Pietraroiasuchus). More complex models of trees with Thalattosuchia placed as the sister
group of Crocodyliformes (e.g., tree 11, using the mbl method; Fig. 2.7A) show the same
pattern. Comparatively, when Thalattosuchia is placed as the sister taxon of
Mesoeucrocodylia (Fig. 2.7B), the regime of larger sizes seen at the base of Neosuchia is
frequently inherited by most non-eusuchian neosuchians (except for some of the smallest taxa,
such as atoposaurids and susisuchids), resulting in fewer regime shifts amongst non-eusuchian
neosuchians than in the other two alternative scenarios.

Chapter 2: Crocodylomorph body size evolution
45
Figure 2.7. SURFACE model fits of trees time-calibrated with the mbl method, using the ODCL
dataset. A, Model fit of tree number 14 with Thalattosuchia as the sister group of Crocodyliformes.
However, many model fits of trees sharing this same position of Thalattosuchia show simpler model
configurations, with significantly fewer regimes (see text for details). B, Model fit of tree number 11
with Thalattosuchia as the sister group of Mesoeucrocodylia. A few model fits of other trees with
Thalattosuchia in the same position are simpler, particularly when using the cal3 time-scaling method
(see Appendix A for all SURFACE plots). C and D are simplified versions of (A) and (B),
respectively, with independent multi-taxon regimes collapsed to single branches.

Chapter 2: Crocodylomorph body size evolution
46
Within Notosuchia, most model fits show many taxa inheriting the same regime of
smaller sizes present at the base of the clade (θ = 66–140 cm), regardless of the position of
Thalattosuchia and the time-scaling method used. Nevertheless, the group is also
characterised by many additional regimes, with considerably variable trait optima, usually
ranging from 66 to 460 cm. Shifts to regimes of smaller sizes are often seen in
uruguaysuchids, Anatosuchus, Pakasuchus and Malawisuchus, with θ values very similar to
or the same as the ancestral crocodylomorph regime (Z0). Furthermore, shifts towards larger
sizes are seen among peirosaurids (θ = 210–250 cm), and, more dramatically, in
sebecosuchids and in the armoured sphagesaurid Armadillosuchus arrudai (θ = 320–850 cm).
Tethysuchia and Thalattosuchia are characterised by a dominance of
macroevolutionary regimes of large body sizes (θ = 320–980 cm), usually with lower body
size disparity than Notosuchia. When Thalattosuchia is placed as sister taxa of either
Tethysuchia, within Neosuchia (Figs. 2.5 and 2.6), or Mesoeucrocodylia (Fig. 2.7B), both
Tethysuchia and Thalattosuchia share the same regime of large sizes (θ = 460–610 cm), which
is subsequently inherited by many of their members. In the first scenario, the shift to this
regime takes place during the Early Jurassic, in the neosuchian branch that leads to the
dichotomy Thalattosuchia + Tethysuchia. In the second case, most model fits show the shift
regime occurring earlier in time, during the Late Triassic, at the base of Mesoeucrocodylia or
among non-mesoeucrocodylian crocodyliforms. In the last alternative phylogenetic scenario,
when Thalattosuchia is placed as the sister taxon of Crocodyliformes (Fig. 2.7A), even though
Tethysuchia and Thalattosuchia do not share the same inherited regime, the model fits
indicate that independent regime shifts to larger sizes occur at the bases of both clades,
usually with very similar (or the same) trait optima values (also around 500 cm).

Chapter 2: Crocodylomorph body size evolution
47
Within Tethysuchia, many trees exhibit a regime shift towards even larger sizes in a
clade formed by the giant forms Sarcosuchus imperator and Chalawan thailandicus (θ = 840–
980 cm). Among thalattosuchians, a shift to a regime with the same trait optimum (i.e.,
convergent) as that of the largest tethysuchians is usually observed in the teleosaurid clade
formed by Machimosaurus and Steneosaurus. Despite the dominance of regimes of larger
sizes, there are regimes of smaller sizes within Tethysuchia and Thalattosuchia, exemplified
by some trees with isolated shifts in Pelagosaurus typus, Teleosaurus cadomensis and
Platysuchus multiscrobiculatus, in Thalattosuchia, and Vectisuchus leptognathus and
Hyposaurus rogersii, in Tethysuchia.
Crocodylia is also characterized by a dominance of macroevolutionary regimes of
relatively large sizes, as in Thalattosuchia and Tethysuchia. Indeed, regimes towards larges
sizes are frequently associated with clades of predominantly aquatic or semi-aquatic forms,
although not strictly restricted to them. Regarding Crocodylia, a Cretaceous regime shift is
usually detected at the base of the clade (Figs. 2.5, 2.6, and 2.7), changing from the
macroevolutionary regime of smaller sizes (θ = 110–210 cm) found for non-crocodylian
eusuchians (such as hylaeochampsids and some allodaposuchids) to a regime of larger trait
optima (θ = 320–340 cm). This same ancestral regime for all crocodylians is inherited by
many members of the clade, particularly within Crocodyloidea and Gavialoidea. Although
some model fits show Crocodylia inheriting the same regime as closely related non-
crocodylian eusuchians, these trees are less common in general. In these trees, shifts towards
larger body sizes are seen in members of Crocodyloidea and Gavialoidea, but they only occur
later in time and arise independently. In comparison to the other two main lineages of
Crocodylia, Alligatoroidea is characterized by a regime of lower trait optima values (θ = 210–
230 cm), which frequently occurs as a Late Cretaceous shift at the base of the clade. But

Chapter 2: Crocodylomorph body size evolution
48
Alligatoroidea is also distinct from the other two clades by exhibiting more regime shifts,
reflecting its great ecological diversity and body size disparity (ranging from very small taxa,
such as the caimanine Tsoabichi greenriverensis, to the huge Purussaurus and Mourasuchus).
2.3.4. Investigating the modes of body size evolution within Notosuchia and Crocodylia
The significant number of regime shifts that occur within both Notosuchia and Crocodylia led
to deeper scrutiny of the modes of body size evolution in these two clades. For that, another
round of model-fitting analyses was conducted, initially fitting the same evolutionary models
(SURFACE, OU, BM, EB and trend-like models) to subtrees representing both groups. In
addition, the same regime shifts identified by the SURFACE algorithm were used to fit four
additional models using the OUwie algorithm (BMS, OUMV, OUMA and OUMVA), which
allow more parameters to vary, but need regime shifts to be set a priori.
The results of these analyses indicate different modes of body size evolution during
the evolutionary histories of these two groups. In Crocodylia (Fig. 2.8A; see Appendix A for a
complete list of AICc scores), AICc scores indicate a clear preference for OU-based models,
with highest support found for the SURFACE model, but also strong support for the uniform
OU model, as well as OUMA and OUMVA models. The SURFACE algorithm frequently
identified three main macroevolutionary regimes for crocodylians (with θ values around 200,
350 and 750 cm, respectively), with α ranging from 0.053 to 0.247 and σ2 between 0.0014 and
0.0054. When allowed to vary among regimes (i.e., in models OUMA and OUMVA), ranges
of both parameters increase significantly, with some model fits displaying extremely
unrealistic parameter values, which might explain the stronger support found for SURFACE
compared to these latter models. Among the BM-based models, even the best trend-like

Chapter 2: Crocodylomorph body size evolution
49
model (usually the one with the best AICc scores among BM-based models) received
consistently worse support than any of these four OU-based models.
Figure 2.8. AICc scores of all evolutionary models fitted to the phylogenies and body size data of
Crocodylia and Notosuchia. For the trend-like models, only the AICc of the best model (“best trend”)
is shown.

Chapter 2: Crocodylomorph body size evolution
50
The results show a different scenario for Notosuchia, for which comparable support
was found for all evolutionary models analysed (Fig. 2.8B). Among OU-based models,
slightly better AICc scores were found for the SURFACE model. However, this model
received virtually the same support as the BMS model, the best of the BM-based models.
BMS is a multi-regime BM model that allows the rate parameter (σ2) to vary, and, as α is
effectively set to zero, represents diffusive model of evolution. The support found for this
model might suggest a more relaxed mode of body size evolution in notosuchians, which is
consistent with the wide range of body sizes observed in the group, even among closely-
related taxa. Indeed, even though the sample includes twice as many crocodylians (n = 70) as
notosuchians (n = 34), many SURFACE model fits found three main macroevolutionary
regimes for notosuchians, similar to what was found for Crocodylia (although model fits with
less regimes were more frequent for Notosuchia than in Crocodylia). For these, θ values were
usually around 80, 150 and 280 cm, with α usually ranging from 0.0124 to 0.6213 and σ2
between 0.0011 and 0.0201. When the same regimes detected by the SURFACE algorithm
were used by the OUwie algorithm to fit the BMS model, values of σ2 rarely varied
significantly from the range of whole-tree σ2 estimated for the SURFACE model fits. The few
exceptions were usually related to regimes with unrealised θ values, as in the case of
Armadillosuchus arrudai (probably with more than 2 metres in total length, whereas other
sampled sphagesaurids reach no more than 1.2 m; Marinho and Carvalho 2009), and
sebecosuchians (top predators of usually more than 2.5 metres; Godoy et al. 2016), even
though these values might still be realistic when simulating trend-like dynamics (i.e., in a
single lineage with extremely disparate trait values; Hansen 1997; Benson et al. 2014a).

Chapter 2: Crocodylomorph body size evolution
51
2.3.5. The influence of palaeolatitude and palaeotemperature
Most of the correlation analyses between the body size data and the different datasets of the
abiotic factors palaeotemperature and palaeolatitude yielded very weak or non-significant
correlations (see Appendix A for all regression results). The phylogenetic regressions of body
size and palaeolatitudinal data found some significant correlations. However, in all cases the
coefficient of determination (R2) was very low (always smaller than 0.1), indicating that the
correlation is very weak and only a small proportion (less than 10%) of the body size
variation observed can be explained by the palaeolatitudinal data (Fig. 2.9).
Figure 2.9. Palaeolatitudinal distribution of extinct crocodylomorphs through time, incorporating
body size information (circle sizes), with colours representing different mono- or paraphyletic (i.e.,
Crocodylomorph = non-mesoeucrocodylian crocodylomorphs, excluding Thalattosuchia; Neosuchia =
non-crocodylian neosuchians) crocodylomorph groups. Body sizes are log10 values of orbito-cranial
dorsal length (ODCL), in millimetres.
The situation was similar regarding temporal patterns of body size compared to global
palaeotemperature, with most analyses revealing very weak or non-significant correlations.

Chapter 2: Crocodylomorph body size evolution
52
Significant correlations were found in some cases, but they were frequently inconsistent (i.e.,
correlations did not persist in both ODCL and DCL datasets or were absent when accounting
for serial autocorrelation using GLS). The lack of strong correlations between environmental
variables and body size is consistent with the results from the macroevolutionary (model-
fitting) analyses, which found strong support for a multi-regime OU model (SURFACE). This
suggests that shifts between adaptive zones are more important in determining large-scale
macroevolutionary patterns of crocodylomorph body size evolution than abiotic factors, at
least when analysed separately.
However, one important exception was found between mean body size values and
palaeotemperatures from the Late Cretaceous (Maastrichtian) to the Recent (data from Zachos
et al. [2008]). Moderate to strong correlations were found when using either all taxa in the
datasets or only non-marine species (R2 ranging from 0.376 to 0.635), with higher mean body
size values found in time intervals with lower temperatures (i.e., positive slopes, given that
the δ18O proxy is inversely proportional to temperature). The correlation was present even
when applying GLS regressions with an autoregressive model (Table 2.3), which returned
very low to low autocorrelation coefficients (Phi = 0.01–0.15). This suggests that temperature
might have had an influence in determining the body size distribution of crocodylomorphs at
smaller temporal and phylogenetic scales (Fig. 2.10A). For this reason, further analyses
scrutinised the relationships between the distribution of body sizes and these abiotic factors at
these smaller scales, by repeating the regression analyses using only data for Crocodylia,
Notosuchia, Thalattosuchia, and Tethysuchia (see the “Material and Methods” section of this
Chapter).

Chapter 2: Crocodylomorph body size evolution
53
Figure 2.10. Caption on next page.

Chapter 2: Crocodylomorph body size evolution
54
Figure 2.10. A, Phenogram with body size (log10 ODCL) incorporated into crocodylomorph
phylogeny, with colours representing different crocodylomorph groups. B, Crocodylomorph body size
and palaeotemperature through time. Mean log10 ODCL represented by dashed black line, shaded
polygon shows maximum and minimum values for each time bin. Continuous light green displays
mean log10 ODCL values only for Crocodylia. Palaeotemperature (δ18O) data from Zachos et al.
(2008). C, Body size disparity through time. Disparity is represented by the standard deviation of
log10 ODCL values for each time bin (only time bins with more than 3 taxa were used for calculating
disparity). Error bars are accelerated bias-corrected percentile limits (BCa) of disparity from 1,000
bootstrapping replicates. Asterisks mark the events of largest interval-to-interval changes in disparity.
_________________________________________________________________________________________________________________
Table 2.3. Regression results of mean body size values (from both DCL and ODCL datasets) on
palaeotemperature. Results of GLS (with an autoregressive model) and OLS (untransformed data)
regressions. Mean body size values represented by log-transformed cranial, in millimetres. Data from
both datasets was divided into subsets with all crocodylomorphs or only non-marine species. 10 time
bins were analysed in all four subsets (n =10). Palaeotemperature data from Zachos et al. (2008),
represented by δ18O data from the Late Cretaceous to Recent. Only significant correlations (p < 0.05)
are shown.
Dataset GLS OLS (untransformed)
ODCL
(all taxa)
Phi Intercept Slope AIC R2 Intercept Slope AIC
-0.046 2.022 0.055
(0.002)
-31.576 0.635 2.023
0.054
(0.003)
-33.557
DCL
(all taxa)
Phi Intercept Slope AIC R2 Intercept Slope AIC
0.014 2.433 0.081
(0.011)
-19.577 0.527 2.433
0.081
(0.01)
-21.575
ODCL
(non-marine)
Phi Intercept Slope AIC R2 Intercept Slope AIC
-0.157 1.964 0.06
(0.007)
-24.96 0.502 1.965
0.06
(0.013)
-26.706
DCL
(non-marine)
Phi Intercept Slope AIC R2 Intercept Slope AIC
-0.089 2.345 0.07
(0.027)
-16.045 0.376 2.346
0.07
(0.034)
-18.272
These additional regressions corroborate the hypothesis that at least some
crocodylomorph subclades show a correspondence between body size and global

Chapter 2: Crocodylomorph body size evolution
55
palaeotemperature. Although most of the regressions provided non-significant or weak/very
weak correlations (see Appendix A for all regression results), including all regressions of
body size on palaeolatitudinal data, both maximum and mean body size values of Crocodylia
are strongly correlated to palaeotemperature through time (Table 2.4). The positive slopes and
coefficients of determination (R2 = 0.632 and 0.647) indicate that the lowest temperatures are
associated with the highest body size values in the crown-group. However, correlations with
data from other subclades (Notosuchia, Thalattosuchia and Tethysuchia) were mostly non-
significant, suggesting that this relationship between body size and temperature was not a
widespread pattern among all groups.
Table 2.4. Regression results of maximum and mean body size values (from both DCL and ODCL
datasets) on palaeotemperature. Results of GLS (with an autoregressive model) and OLS
(untransformed data) regressions. Mean body size values represented by log-transformed cranial, in
millimetres. Data from both datasets was divided into subsets with all crocodylomorphs or only non-
marine species. 10 time bins were analysed in all four subsets (n =10). Palaeotemperature data from
Zachos et al. (2008), represented by δ18O data from the Late Cretaceous to Recent. Only significant
correlations (p < 0.05) are shown.
Dataset GLS OLS (untransformed)
ODCL
maximum size
Phi Interc. Slope AIC R2 Interc. Slope AIC
0.19 2.133 0.121
(0.017)
-11.989 0.554 2.124 0.127
(0.008)
-13.662
ODCL
mean size
Phi Interc. Slope AIC R2 Interc. Slope AIC
-0.297 1.98 0.075
(0.0003)
-29.953 0.698 1.987 0.07
(0.001)
-31.137
DCL
maximum size
Phi Interc. Slope AIC R2 Interc. Slope AIC
-0.215 2.618 0.165
(0.001)
-10.724 0.632 2.627 0.157
(0.003)
-12.355
DCL
mean size
Phi Interc. Slope AIC R2 Interc. Slope AIC
-0.235 2.386 0.105
(0.0007)
-20.748 0.647 2.395 0.098
(0.003)
-22.325

Chapter 2: Crocodylomorph body size evolution
56
2.4. Discussion
2.4.1. The adaptive landscape of crocodylomorph body size evolution
Crocodylomorph body size disparity increased rapidly during the early evolution of the group,
from the Late Triassic to the Early Jurassic (Hettangian–Sinemurian), which is mostly a result
of the appearance of the large-bodied thalattosuchians (Fig. 2.10C). After a decline in the
Middle Jurassic, body size disparity reaches its maximum peak in the Late Jurassic, with the
appearance of atoposaurids, some of the smallest crocodylomorphs, as well as large
teleosaurids (such as Machimosaurus). This increase in disparity may have occurred earlier
than the results suggest, given that Middle Jurassic records of atoposaurids (Young et al.
2016b) could not be included in the analyses due to their highly incomplete preservation.
Since this peak in the Middle/Late Jurassic, crocodylomorphs underwent an essentially
continuous decline in body size disparity, with some short-term fluctuations related to the
extinction or diversification of particular lineages. The Early Cretaceous witnessed the
extinction of thalattosuchians, and a sharp decrease in disparity is seen from the Berriasian to
the Barremian (although this time interval is also relatively poorly sampled in the dataset). A
subsequent increase in disparity is seen in the Aptian, probably reflecting the appearance of
small-bodied crocodylomorphs (such as susisuchid eusuchians). Nevertheless, this is followed
by a continuing decline for the remainder of the Cretaceous (in spite of the occurrence of
highly disparate notosuchians). The Cenozoic is also characterised by an overall decrease in
disparity, even though some short-term increases in disparity do occur, mostly related to the
presence of smaller-bodied crocodylians in the Palaeogene (such as Tsoabichi).
The macroevolutionary patterns that gave rise to these patterns of body size disparity
through time were characterised by performing comparative model-fitting analyses. The
results indicate a strong support found for a multi-peak OU model (i.e., the SURFACE model;

Chapter 2: Crocodylomorph body size evolution
57
Fig. 2.3). Within the concept of adaptive landscape (Simpson 1944; 1953; Hansen 2012), the
SURFACE regimes, with different trait optima, can be interpreted as shifts to new
macroevolutionary adaptive zones (Van Valen 1971; Stanley 1973). Thus, the support found
for the SURFACE model indicates that lineage-specific innovations and/or adaptations in
body size play an important role in determining the patterns of crocodylomorph body size
evolution. The comparative model-fitting analyses also indicate that uniform or BM-based
models provide poor explanations for the overall patterns of crocodylomorph body size
evolution. Thus, the hypothesis of long-term, multi-lineage trends during the evolution of
crocodylomorph body size is rejected. This is true even for Crocodylia, which shows
increases in maximum, minimum and mean body sizes during the past 70 million years (Fig.
2.10C), a pattern that is classically taken as evidence for trend-like dynamics (McShea 1994).
In fact, explicitly phylogenetic models of the dynamics along evolving lineages reject this.
Likewise, diffusive Brownian-motion like dynamics can also be rejected for most of
Crocodylomorpha, although Notosuchia might be characterised by relatively unconstrained
dynamics (Fig. 2.8). Single-regime (i.e., uniform) models received poor support in general,
which might be expected for long-lived and disparate clades such as Crocodylomorpha, that
show complex and non-uniform patterns of body size evolution (see Stanley 1973, McKinney
1990; Hansen 1997; Butler and King 2004). Although multi-regime trend-like models
received stronger support than uniform models for most phylogenies (Fig. 2.3), multi-peak
OU models (SURFACE) received overwhelmingly still greater support. This suggests that the
macroevolutionary landscape of crocodylomorph body size evolution is best described by
shifts between phylogenetically defined regimes that experience constrained evolution around
distinct trait optima (Butler and King 2004; Hansen 2012; Ingram and Mahler 2013; Mahler
and Ingram 2014).

Chapter 2: Crocodylomorph body size evolution
58
The success of a multi-peak OU model indicates that, in general, a significant amount
of crocodylomorph body size variance emerged through pulses of body size variation, and not
from a gradual, BM-based dispersal of lineages through trait (body size) space. These pulses,
represented by regime shifts, indicate that lineage-specific innovations (such as ecological
diversification; see below) and adaptations are important for the large-scale patterns of
crocodylomorph body size evolution.
This can also explain the weak support for the early burst (“EB”) model found in the
analyses. This model was proposed as an attempt to simulate Simpson’s (1944) idea of
diversification through “invasion” of new adaptive zones (niche-filling). However, it only
focuses on a particular pattern of the idea, more specifically on the more widespread concept
of adaptive radiation, in which evolutionary rates of changes are higher in the early evolution
of a clade and decelerate through time (Harmon et al. 2010). In this sense, the EB model does
represent the complete idea of “quantum evolution” proposed by Simpson (1953) (i.e., abrupt
phenotypic shifts along evolving lineages resulting from the distribution of opportunities or
“unfilled niches”). This might explain why Harmon et al. (2010), in the study that formally
proposed the EB model, found that early bursts receive little support from phylogenetic
comparative data, even though some studies have found otherwise for some specific clades
(e.g., in the body size evolution of some dinosaur subgroups; Benson et al. 2014).
Accordingly, the weak support for the EB model in this Chapter does not reject
Simpson’s hypothesis “quantum evolution” or adaptive zone invasion. Furthermore, the
pattern of crocodylomorph body size evolution could still be explained by niche-filling if
niche availability was distributed through time rather than being concentrated early in the
evolution of the clade. This is one possible explanation of the pattern of regime shifts returned
by the SURFACE analyses, and might be particularly relevant for clades with long

Chapter 2: Crocodylomorph body size evolution
59
evolutionary histories spanning many geological intervals and many episodes of possible
radiation.
Bronzati et al. (2015) examined variation in rates of species diversification among
clades using methods based on tree asymmetry. They found that most of crocodyliform
diversity was achieved by a small number of significant diversification events that were
mostly linked to the origin of some subclades, rather than via a continuous process through
time. Some of the diversification shifts from Bronzati et al. (2015) coincide with body size
regime shifts found in many of the SURFACE model fits (as at the base of Notosuchia,
Eusuchia and Alligatoroidea; Fig. 2.11). However, many of the shifts in body size regimes
detected by the analyses are found in less-inclusive groups (as in the case of “singleton”
regimes, that contain only a single taxon).

Chapter 2: Crocodylomorph body size evolution
60
Figure 2.11. Summary of the SURFACE results combined with the crocodylomorph diversification
shifts found by Bronzati et al. (2015). Nodes with diversification shifts are indicated by arrows, the
colours of which represent distinct trait optima values (total body length in centimetres, after applying
formula from Hurlburt et al. [2003]), of different body size regimes. Black arrows indicate nodes for
which diversification shifts were identified, but no body size regime shift was found by SURFACE.

Chapter 2: Crocodylomorph body size evolution
61
2.4.2. Ecological diversification and its implications for crocodylomorph body size
distribution
Ecological factors seem to be important for the large-scale patterns of body size in
crocodylomorphs. Many of the regime shifts to larger sizes detected by the SURFACE
analyses occur at the base of predominantly aquatic or semi-aquatic clades, such as
Thalattosuchia, Tethysuchia and Crocodylia (Figs. 2.5, 2.6 and 2.7), although there are also
small-bodied aquatic and semi-aquatic clades, such as Atoposauridae. Some terrestrial clades
also display relatively large sizes (such as sebecosuchians and peirosaurids, within
Notosuchia). However, most terrestrial species are small-bodied (Fig. 2.12), including many
of the earliest crocodylomorphs (such as Litargosuchus leptorhynchus and Hesperosuchus
agilis; Clark et al. 2000; Clark and Sues 2002; Fig. 2.12A), and are within body size regimes
of lower values of θ (< 150 cm; Figs. 2.5, 2.6 and 2.7). In contrast, the regimes with the
highest values of θ (> 800 cm) are almost always associated with aquatic or semi-aquatic
crocodylomorphs (e.g., the tethysuchians Sarcosuchus imperator and Chalawan thailandicus,
the thalattosuchians Machimosaurus and Steneosaurus, and the crocodylians Purussaurus and
Mourasuchus).
To further investigate this, the body size data was subdivided into three discrete
categories to represent different generalised lifestyles: terrestrial, semi-aquatic/freshwater, and
aquatic/marine. Initially, a relationship was found between the lifestyle and body size using
analysis of variance (ANOVA), showing that terrestrial, freshwater and marine species had
significantly different body sizes (Fig. 2.12B; Table 2.5). Next, to account for phylogenetic
dependency, a phylogenetic ANOVA (Garland et al. 1993; Revell 2012) was performed. This
asks specifically whether evolutionary habitat transitions are consistently associated with
particular body size shifts as optimised on the phylogeny and returned non-significant results.
This indicates that, although crocodylomorphs with more aquatic lifestyles (particularly

Chapter 2: Crocodylomorph body size evolution
62
marine species) tend to be large-bodied, the evolutionary transitions between these lifestyle
categories were probably not accompanied by immediate non-random size changes.
Furthermore, the smaller bodies of some lineages (e.g., atoposaurids, Tsoabichi and
Pelagosaurus) show that adaptive peaks of smaller sizes are also viable among aquatic/semi-
aquatic species. This suggests that, even though there seem to be an ecological advantage for
larger-sized freshwater/marine crocodylomorphs, the body size lower limit (i.e., minimum
body sizes achieved) of these aquatic species might have been comparable to that of terrestrial
ones.
Table 2.5. Pairwise comparison between body size of crocodylomorphs subdivided into three lifestyle
categories. Body size data from the ODCL dataset (log-transformed cranial measurement, in
millimetres). Number of species in each category: 45 (terrestrial), 100 (semi-aquatic/freshwater), and
50 (aquatic/marine). Results of one-way analysis of variance (ANOVA), without accounting for
phylogenetic dependency, and phylogenetic ANOVA (Garland et al. 1993; Revell 2012). *Bonferroni-
corrected p-values (q-values) significant at alpha = 0.05
Category Mean Std.
Deviation
Std.
Error
Pairwise
comparisons t-value
ANOVA
q-value
Phylo
ANOVA
q-value
Terrestrial 1.854 0.223 0.0333 Terrestrial –
Freshwater 4.196 < 0.001* 1
Semi-aquatic/
freshwater 2.026 0.249 0.0249
Terrestrial –
Marine 8.721 < 0.001* 0.138
Aquatic/
marine 2.263 0.185 0.0261
Freshwater –
Marine 5.997 < 0.001* 0.537

Chapter 2: Crocodylomorph body size evolution
63
Figure 2.12. A, Body size frequency distributions of different crocodylomorph groups, constructed
using the full set of 240 specimens in the ODCL dataset. Underlying unfilled bars represent values for
all crocodylomorphs. Filled bars represent values for Crocodylia, Notosuchia, Thalattosuchia, non-
mesoeucrocodylian crocodylomorphs (excluding thalattosuchians), Tethysuchia and non-crocodylian
neosuchians (excluding tethysuchians and thalattosuchians). B, Body size distributions of different
crocodylomorph lifestyles, shown with box-and-whisker plots (on the left) and a mosaic plot (on the
right). The 195 species from the ODCL dataset were subdivided into terrestrial, semi-
aquatic/freshwater and aquatic/marine categories (n = 45, 100 and 50, respectively) based on the
literature.

Chapter 2: Crocodylomorph body size evolution
64
Previous studies have investigated a possible link between an aquatic/marine lifestyle
and larger body sizes in other animals, particularly in mammals (e.g., Smith and Lyons 2011;
Heim et al. 2015; Gearty et al. 2018). For instance, it has been previously shown that aquatic
life in mammals imposes a limit on minimum body size (Downhower and Bulmer 1988;
Gearty et al. 2018) and relaxes constraints on maximum size (Williams 1999). Therefore,
aquatic mammals (especially marine ones) have larger body sizes than their terrestrial
relatives (Smith and Lyons, 2011; Vermeij 2016). Here, a similar pattern is documented in
crocodylomorphs, although the phylogenetic ANOVA results (Table 2.5) revealed that
changes in size are not abrupt after environmental invasions (as also suggested by the
diminutive size of some semiaquatic lineages, such as atoposaurids and some crocodylians).
As animals lose heat faster in water than in air (given the different rates of convective heat
loss in these two environments), it has demonstrated that thermoregulation plays an important
role in determining the larger sizes of aquatic mammals (Downhower and Bulmer 1988;
Ahlborn and Blake 1999; Gearty et al. 2018). Although mammals have distinct thermal
physiology to crocodylomorphs (which are ectothermic poikilotherms), it has been reported
that American alligators (Alligator mississippiensis) heat up more rapidly than cool down, and
that larger individuals are able to maintain their inner temperature for longer than smaller
ones (Smith 1976). Thus, given that both heating and cooling rates are higher in water than in
air (Smith 1976), larger aquatic/semi-aquatic animals could have advantages in terms of
physiological thermoregulation. If extinct crocodylomorphs had similar physiologies, this
could provide a plausible explanation for the larger sizes of non-terrestrial species.

Chapter 2: Crocodylomorph body size evolution
65
2.4.3. Cope’s rule cannot explain the evolution of larger sizes in Crocodylomorpha
Previous interpretations of the fossil record suggest a dominance of small sizes during the
early evolution of crocodylomorphs (Irmis et al. 2013; Turner and Nesbitt 2013), inferred
from the small body sizes of most early crocodylomorphs. Consistent with this, the
SURFACE results revealed a small-bodied ancestral regime for Crocodylomorpha (Z0
between 66 and 100 cm), which was inherited virtually by all non-crocodyliform
crocodylomorphs. Larger non-crocodyliform crocodylomorphs have also been reported for
the Late Triassic (e.g., Carnufex carolinensis and Redondavenator quayensis, with estimated
body lengths of approximately 3 metres; Zanno et al. 2015), but the fragmentary nature of the
specimens prevented their inclusion in the macroevolutionary analysis. Nevertheless, given
the larger numbers of small-bodied early crocodylomorphs, taxa like Carnufex and
Redondavenator probably represent derived origins of large body size and their inclusion
would likely result in similar values of ancestral trait optima (=Z0).
The small ancestral body size inferred for crocodylomorphs, combined with the much
larger sizes seen in most extant crocodylians and in some other crocodylomorph subclades
(such as thalattosuchians and tethysuchians), suggests a pattern of increasing average body
size during crocodylomorph evolutionary history. The idea is reinforced by the overall
increase in crocodylomorph mean body size through time, particularly after the Early
Cretaceous (Fig. 2.10B). The same pattern also occurs within Crocodylia during the past 70
million years (Fig. 2.10B), as some of the earliest taxa (such as Tsoabichi, Wannaganosuchus
and Diplocynodon deponiae) were smaller-bodied (< 2m) than more recent species, such as
most extant crocodylians (usually > 3m). Cope’s rule is most frequently conceived as the
occurrence of multi-lineage trends of directional evolution towards larger body sizes (Cope

Chapter 2: Crocodylomorph body size evolution
66
1887; 1896; Stanley 1973), and this can be evaluated using BM-based models that incorporate
a directional trend (parameter μ; see e.g., Hunt and Carrano, 2010; Benson et al. 2018).
Little support was found for trend-like models as a description of crocodylomorph or
crocodylian body size evolution. Therefore, the applicability of Cope’s rule to
crocodylomorph evolution is rejected. This reinforces previous works suggesting that multi-
lineage trends of directional body-size evolution are rare over macroevolutionary time scales
(Sookias et al. 2012a, b; Huttenlocker 2014; Benson et al. 2018; but see Benson et al.,
2014a). Furthermore, the SURFACE model fits indicate that regime shifts towards smaller-
bodied descendent regimes occurred approximately as frequently (9–13 times) as shifts to
regimes of larger body sizes (13–16 times; Fig. 2.13). Together, these results indicate that
long-term increases in the average body size of crocodylomorphs also cannot be explained
either by multi-lineage trends of directional evolution towards larger size, or by a biased
frequency of transitions to large-bodied descendent regimes.
Instead, the apparent trend towards larger body sizes can be explained by extinctions
among small-bodied regimes. Crocodylomorph body size disparity decreased gradually
through the Cretaceous (Fig. 2.10B). This occurred due to the decreasing abundance of small-
bodied species. Despite this, the SURFACE model fits mostly indicate the survival of clades
exhibiting small-bodied regimes (θ < 200 cm) until approximately the end of the Mesozoic,
(e.g., gobiosuchids, uruguaysuchids, sphagesaurids, hylaeochampsids and some
allodaposuchids; Figs. 2.5, 2.6, and 2.7). Many of these small-bodied clades became extinct at
least by the Cretaceous/Palaeogene (K/Pg) boundary, resulting in a substantial reduction of
small-bodied species. Further reductions among the crown-group (Crocodylia) occurred by
the Neogene, from which small-bodied species are absent altogether (Figs. 2.5, 2.6, and 2.7).

Chapter 2: Crocodylomorph body size evolution
67
Figure 2.13. Distribution of regime shifts represented by the difference between descendant and
ancestral regimes trait optima values (θ) plotted against the θ of the ancestral regime. Large red circles
represent shifts that led to clades containing multiple taxa, while smaller pink circles represent
“singleton” regimes, containing only single taxa. Vertical dashed line indicates the ancestral regime
for all crocodylomorphs (Z0), while horizontal dashed line can be used as a reference to identify
regime shifts giving rise to larger (circles above the line) or smaller-bodied (circles below the line)
descendants. Circles at the exact same position (i.e., shifts with the same θ values for both ancestral
and descendant regimes) were slightly displaced in relation to one another to enable visualization. This
plot was constructed using the θ values from trees with different positions of Thalattosuchia: A, Tree
number 10, with Thalattosuchia within Neosuchia; B, Tree number 14, with Thalattosuchia as the
sister group of Crocodyliformes; C, Tree number 11, with Thalattosuchia as the sister group of
Mesoeucrocodylia. θ values in log10 mm, relative to the cranial measurement ODCL (orbito-cranial
dorsal length).
This predominance of regimes of large sizes today is also linked to the occurrence of
large body sizes in Crocodylia. The SURFACE analyses focusing on Crocodylia, indicate
ancestral body size regimes with relatively high values of θ (Z0 between 220 and 350 cm).
The shift to a larger-sized regime (when compared to smaller-bodied eusuchian regimes)
probably occurred at the Late Cretaceous (Figs. 2.5, 2.6, and 2.7), and this same regime was
inherited by many members of the clade (predominantly semi-aquatic species). During the
Palaeogene, however, shifts to regimes of smaller sizes also happen (such as in Tsoabichi

Chapter 2: Crocodylomorph body size evolution
68
greenriverensis, Diplocynodon deponiae and planocraniids), increasing body size disparity
(Fig. 2.10C). The crocodylian body size distribution shifts upwards mainly during the latter
part of the Cenozoic (from the Miocene; Fig. 2.10B), when even larger-bodied animals occur
(e.g., Purussaurus and Mourasuchus), combined with the disappearance of lineages of
smallest species.
2.4.4. Correlation of crocodylian body size with global cooling
The time-series regressions demonstrate a moderate to strong correlation between crocodylian
size and palaeotemperature (Table 2.4). This results from the upward-shift of the crocodylian
body size distribution, coinciding with cooling global climates in the second half of the
Cenozoic (Zachos et al. 2008; Linnert et al. 2014). Even though this is an apparently counter-
intuitive relationship, it is not interpreted here as a result of direct causation. Previous studies
have shown that crocodylian species richness decreased with declining global temperatures of
the Cenozoic (Markwick 1998a; Mannion et al. 2015). Furthermore, the palaeolatitudinal
ranges of both marine and continental crocodylomorphs have contracted as temperatures
decreased (Fig. 2.9; see also Markwick 1998a; Mannion et al. 2015). Therefore, the
temperatures experienced by evolving lineages of crocodylians are not equivalent to global
average temperatures. It is proposed here that the association between global cooling and
increasing crocodylian body size results from a systematic reduction of available habits/niches
(due to a more restricted geographical distribution), with differential extinction of smaller-
bodied species. The hypothesis of selective extinction is also consistent with the decreasing
disparity of body size disparity of crocodylians during the Cenozoic (Fig. 2.10B).

Chapter 2: Crocodylomorph body size evolution
69
2.4.5. Body size selectivity and diversification across Mesozoic boundaries
Numerous comparative studies have investigated a possible link between extinction risk and
animal body size (e.g., Alroy 2001; Johnson 2002; Fisher and Owens 2004; Cardillo et al.
2005; Clauset and Erwin 2008). For example, larger body sizes, in association with dietary
specializations, might increase susceptibility to extinction in some animal groups, such as
hypercarnivorous canids (Purvis et al. 2000; Van Valkenburgh et al. 2004). On the other
hand, the recovery of some animal clades after extinction events can also be associated with a
subsequent increase in diversity and morphological disparity (e.g., Palaeogene mammals;
Alroy 1998), potentially leading to the exploration of new regions of body size space (i.e.,
invasions of new body size adaptive zones). Thus, although for some groups (and for some
extinctions) body size might play an important role, this is evidently not a generalised pattern
across all animals.
For crocodylomorphs, little is known about possible influence of body size on
differential extinction. In one of the few studies to quantitatively investigate this, Turner and
Nesbitt (2013), using femoral length as a proxy for total body size, recognized a drop in mean
body size of crocodylomorphs across the Triassic-Jurassic (T–J) boundary. The SURFACE
results, however, indicate otherwise, as all Triassic crocodylomorphs are within a
macroevolutionary regime of smaller sizes (θ < 100 cm) when Thalattosuchia is placed within
Neosuchia (Figs. 2.5 and 2.6). In the other two phylogenetic scenarios, the origin of
thalattosuchians (which are predominantly large-bodied animals) is placed either at the middle
of the Late Triassic or closer to the T–J boundary (Fig. 2.7). However, as the first records of
thalattosuchians only occur in the Early Jurassic, mean body size increases immediately after
the boundary (Fig. 2.10A). The differences between the results obtained in this Chapter and
those found by Turner and Nesbitt (2013) might be related to the distinct body size proxies

Chapter 2: Crocodylomorph body size evolution
70
used, or to sampling, as those authors also included non-crocodylomorph taxa in the
pseudosuchian lineage. In this context, it is acknowledged that the inclusion of larger non-
crocodyliform crocodylomorphs, such as Carnufex carolinensis (~3 metres; Zanno et al.
2015), in the analyses of this Chapter might change the results. Thus, at the moment the is no
empirical or statistical evidence to demonstrate selectivity of body sizes in crocodylomorphs
during the end-Triassic extinction.
The Early Jurassic was characterized by key events of crocodylomorph diversification
(Bronzati et al. 2015) and an increase in morphological disparity (Toljagić and Butler 2013),
following the end-Triassic extinction. Similarly, the body size data collected for this Chapter
suggests an increase in body size disparity after the T–J boundary (Fig. 2.10B). Although a
decrease in disparity is observed subsequently, this is probably due to the relatively few
crocodylomorphs known for the latest Early Jurassic and the Middle Jurassic (Sinemurian–
Aalenian; Mannion et al. 2015). Subsequently, the diversification of thalattosuchians during
the Late Jurassic, together with the occurrence of smaller- to intermediate-bodied neosuchians
(such as atoposaurids and goniopholidids), created the greatest observed disparity of
crocodylomorph body sizes during their evolutionary history (Fig. 2.10C).
Recent studies (Tennant et al. 2016b, c; 2017) suggested that a combination of
environmental perturbations occurred during the Jurassic-Cretaceous (J/K) transition, which
might have led to the extinction of some tetrapod lineages. For crocodylomorphs the
boundary is characterised by a decrease in marine diversity (Mannion et al. 2015; Tennant et
al. 2016b, c), highlighted by declines in thalattosuchian diversity, especially among
teleosaurids, which suffered widespread extinction (except, apparently, at lower
palaeolatitudes; Fanti et al. 2016). Nevertheless, Wilberg (2017) did not find evidence for a
substantial decrease in crocodylomorph cranial disparity across the J/K boundary (neither did

Chapter 2: Crocodylomorph body size evolution
71
the analyses performed in Chapter 3 of this thesis). Similarly, the SURFACE results do not
suggest dramatic changes in body size space exploration immediately before or after the J/K
boundary (Figs. 2.5, 2.6 and 2.7), and there seems to be no defined body size selectivity
across this boundary, as the multiple survivor crocodylomorph lineages were within regimes
of very disparate optima values. Furthermore, the decrease in disparity observed in the middle
of the Early Cretaceous (i.e., Valanginian–Barremian) is likely due to poor sampling (Butler
et al. 2012; Benson et al. 2013), resulting in the scarcity of more completely preserved
crocodylomorphs during these stages.
The Late Cretaceous is marked by a remarkable fossil richness of notosuchians, in
Gondwana (Carvalho et al. 2010; Pol and Leardi 2015), and the diversification of eusuchian
crocodylians (Brochu 2003). Notosuchia exhibits a wide range of body sizes (Fig. 2.12A), to
some extent reflecting its remarkable diversity (Mannion et al. 2015; Pol and Leardi 2015)
and morphological disparity (Wilberg 2017; see Chapters 3 and 4 of this thesis for further
examples). The model-fitting analyses performed using only notosuchian data suggest more
relaxed modes of body size evolution (Fig. 2.9), which is consistent with their species
richness and morphological disparity. This could be explained by a combination of intrinsic
(i.e., innovations and/or adaptations, such as a highly modified feeding apparatus; Ősi 2014;
Pol et al. 2014) and extrinsic factors (i.e., specific environmental conditions, such as the
predominantly hot and arid climate of the Gondwanan landmasses occupied by notosuchians;
Carvalho et al., 2010; Marsola et al., 2016).
Even though the body size data of this Chapter show no specific pattern at the K/Pg
boundary, a decline in body size disparity is present through the Late Cretaceous, combined
with an increase in mean body size (Fig. 2.10), a pattern that generally continued through the
Cenozoic (although with some short-term fluctuations). This supports the hypothesis that the

Chapter 2: Crocodylomorph body size evolution
72
K/Pg extinction had only minor impacts on crocodylomorphs (Russell and Wu 1997;
Markwick 1998a; Bronzati et al. 2015; Mannion et al. 2015). Although subsampled data
suggests a decline in terrestrial diversity during the Late Cretaceous, it occurred prior to the
boundary, from the Campanian into the Maastrichtian, in both Europe and North America
(Mannion et al. 2015). Indeed, different crocodylomorph subclades lost several species prior
to the end of the Cretaceous (in particular notosuchians and non-crocodylian eusuchians;
Bronzati et al. 2015; Mannion et al. 2015; Figs. 2.5, 2.6, and 2.7), and multiple lineages
within other groups, such as dyrosaurid tethysuchians and crocodylians, crossed the boundary
with little change (Russell and Wu 1997; Markwick 1998a; Jouve et al. 2008; Figs. 2.5, 2.6,
and 2.7). The results of this Chapter suggest a long-term pattern of extinctions among small-
bodied taxa, starting from the Late Cretaceous and continuing to the Recent. This may have
resulted from a longstanding trend of global cooling (Zachos et al. 2008; Linnert et al. 2014),
resulting in more restricted geographical distributions, and reducing niche availability for
crocodylomorphs. This is consistent with the SURFACE results (Figs. 2.5, 2.6, and 2.7), that
show very few smaller-bodied regimes (θ < 150 cm) during the Palaeogene and a complete
absence after the Neogene. This pattern strikingly contrasts with that proposed for mammals,
which may have experienced selectivity against larger bodied taxa across the boundary
(Wilson 2013), although an increase in body size is observed subsequently during the
Palaeogene (Alroy 1998; Smith et al. 2010). It also differs from that suggested for squamates
(lizards and snakes), for which survival was possibly associated with small body sizes
(Longrich et al. 2012).

Chapter 2: Crocodylomorph body size evolution
73
2.5. Conclusions
After an early increase (with the highest peak in the Late Jurassic), crocodylomorph body size
disparity experienced sustained decline during virtually its entire evolutionary history. This
disparity decrease is combined with an increase of average body size through time, with
highest peaks in the Middle Jurassic and today. In particular, the increase in mean body size
seen during the Cenozoic (mostly related to crocodylians) is linked to an overall decrease in
global temperatures.
Comparative model-fitting analyses were used to further characterise these body size
macroevolutionary patterns in crocodylomorphs. The results show extremely strong support
for a multi-peak Ornstein-Uhlenbeck model (SURFACE), rejecting the hypothesis of
evolution based on Brownian motion dynamics (including those representing the concept of
Cope’s rule). This suggests that crocodylomorph body size evolution can be described within
the concept of a macroevolutionary adaptive landscape, with a significant amount of
crocodylomorph body size variance evolving from pulses of body size changes, represented
by shifts between macroevolutionary regimes (or adaptive zones). This is reflected in the
regime shifts frequently detected at the base of well-recognised and diverse crocodylomorph
subclades, such as Notosuchia, Thalattosuchia, and Crocodylia.
At large temporal and phylogenetic scales, no strong correlation was found between
the body size data and abiotic factors, indicating that shifts between macroevolutionary
regimes are more important for determining long-term patterns of crocodylomorph body size
than isolated climatic factors. However, at more refined scales, body size variation may track
changes in climate. In the case of Crocodylia, a global cooling event might explain the long-
term increases in body size, as a result of systematic reduction of available habitats/niches

Chapter 2: Crocodylomorph body size evolution
74
(due to a more latitudinally-restricted geographical distribution during cooler global climates),
with differential extinction of smaller-bodied species.
Shifts towards larger sizes are often associated with aquatic/marine or semi-aquatic
subclades, indicating that ecological diversification may also be relevant, and suggesting a
possible link between aquatic adaptations and larger body sizes in crocodylomorphs. These
shifts to larger sizes, occurred throughout crocodylomorph evolutionary history, combined
with the extinction of smaller-sized regimes, particularly during the Late Cretaceous and
Cenozoic, explain the overall increase in mean body size, as well as the large-bodied
distribution of extant crocodylians compared to earlier taxa.

Chapter 3: Crocodylomorph cranial shape disparity
75
Chapter 3: Crocodylomorph cranial shape disparity
3.1. Background
Transformations in the shape of living organisms have historically been the subject of
scientific investigations (e.g., Russell 1916; Thompson 1917; Huxley 1932), as the study of
shape provides crucial morphological information, which is fundamental for understanding
the evolution of life on Earth (Darwin 1859). Morphometrics (namely the “measurement of
shape”) is the systematic study of shape of organisms using multivariate statistical methods,
and is usually subdivided into “traditional morphometrics” (which involves linear
measurements, angles and ratios; Marcus 1990) and the more recent “geometric
morphometrics”, in which two- or three-dimensional landmark-based data is used to capture
the geometry of the structure being studied (Bookstein 1991; Rohlf and Marcus 1993; Adams
et al. 2004; Mitteroecker and Gunz 2009; Cooke and Terhune 2015).
Although there are other methods available for quantifying shape changes (e.g.
Euclidian distance matrix analysis; Lele and Richtsmeier [1991; 2001]; and elliptic Fourier
analysis; Lestrel [1982]; Haines and Crampton [2000]), the use of landmark-based geometric
morphometrics has become increasingly more frequent in ecological and evolutionary studies
(Adams et al. 2004; Zelditch et al. 2012). However, the long recognised and often tight
relationship between form and function (Cuvier 1817; Russell 1916; Gould 1977; Lauder
1981) potentially increases the frequency of convergent evolution, which challenges the
accurate characterisation of macroevolutionary patterns (Harvey and Pagel 1991; Martins and
Hansen 1997; Banavar et al. 2014; Cooke and Terhune 2015). This makes imperative the
incorporation of phylogenetic information for assessing shape variation in an evolutionary

Chapter 3: Crocodylomorph cranial shape disparity
76
framework, paving the way for the use of phylogenetic comparative methods in geometric
morphometric studies (Rohlf 2001; Monteiro 2013; Zelditch et al. 2012).
In this context, data collected from fossil organisms can yield essential information for
a better comprehension of evolutionary shape changes. Among tetrapods, crocodylomorphs
represent a good system for studying large-scale phenotypic evolution, given their long and
rich fossil record (Bronzati et al. 2015; Mannion et al. 2015), as well as extensive recent
effort to resolve major phylogenetic uncertainties (e.g., Jouve et al. 2006; Larsson and Sues
2007; Andrade et al. 2011; Clark 2011; Brochu 2011; 2012; Bronzati et al. 2012; Pol et al.
2013; Montefeltro et al. 2013; Pol et al. 2014; Young 2014; Herrera et al. 2015; Turner 2015;
Wilberg 2015). Historically, the crocodylomorph skull has received substantial attention in
anatomical studies, (Iordansky 1973), which might explain the preference for this part of the
skeleton as the source of morphological information in most works quantitatively
investigating phenotypic evolution in the group. Important exceptions include: Stubbs et al.
(2013) and Walmsley et al. (2013), which assessed mandibular morphology; Bonnan et al.
(2008) and Chamero et al. (2013), which used postcranial shape data; Gold et al. (2014),
which assessed braincase shape variation; and Toljagić and Butler (2013), which used discrete
characters to investigate morphological variation in the entire skeleton.
Previous work on crocodylomorph cranial shape variation have mostly focused on
specific subgroups, especially crocodylians (Monteiro et al. 1997; Pierce et al. 2008; Sadleir
and Makovicky 2008; Piras et al. 2009; 2010; 2014; Watanabe and Slice 2014; Clarac et al.
2016; Iijima 2017; McCurry et al. 2017a; Foth et al. 2017a; Bona et al. 2018), but also
thalattosuchians (Pierce et al. 2009a; Young et al. 2010) and notosuchians (Chapter 4). One
exception, however, is the recent work of Wilberg (2017), which assessed cranial shape
variation for Crocodyliformes as a whole, sampling a large number of species (n = 131).

Chapter 3: Crocodylomorph cranial shape disparity
77
Nevertheless, although larger than anything previously compiled, the landmark dataset
presented by Wilberg (2017) did not include numerous crocodylomorphs (e.g., non-
crocodyliform crocodylomorphs), and morphospace occupation was only compared between
members of the crown-group (i.e., crocodylians) and non-crown crocodylomorphs. Therefore,
the sample size of Wilberg (2017) could be significantly increased, potentially permitting the
assessment of morphospace occupation among a larger number of crocodylomorph subgroups
(e.g., notosuchians and thalattosuchians).
Furthermore, Wilberg (2017) used cranial shape data to estimate morphological
disparity in crocodylomorphs through time, a practice also implemented previously by several
other crocodylomorph studies (e.g., Pierce et al. 2008; Young et al. 2010; Stubbs et al. 2013)
and very frequently in studies of other tetrapod groups (e.g., in dinosaurs [Benton et al. 2014;
Brusatte et al. 2008a, b], turtles [Foth and Joyce 2016; Foth et al. 2017b], pterosaurs [Butler
et al. 2012; Foth et al. 2012], and early archosaurs [Foth et al. 2016a]). Wilberg (2017)
compared disparity estimation using distinct disparity metrics (i.e., range- and variance-based
metrics; Foote 1993; Wills et al. 1994; Foote 1997), as well as using different numbers of
time bins (i.e., time bins based on chronostratigraphic divisions and equal-length time bins).
However, a recent study (Guillerme and Cooper, 2018) suggests that alternative time sub-
sampling methods can impact significantly on disparity-through-time analyses, given the
uneven nature of the fossil record and that distinct methodologies have different assumptions
for sampling taxa in each time interval. Additionally, Wilberg (2017) did not investigate
cranial shape disparity among different crocodylomorph subgroups or ecologies (e.g., aquatic,
semi-aquatic or terrestrial lifestyles).
In this Chapter, I use geometric morphometric techniques to comprehensively quantify
crocodylomorph cranial shape variation, by combining a previously available landmark

Chapter 3: Crocodylomorph cranial shape disparity
78
dataset (from Wilberg [2017]) with newly digitised specimens. I also quantify cranial shape
disparity between distinct crocodylomorph subgroups, and estimate disparity through time
across the entire evolutionary history of the group using a variety of alternative methods.
Accordingly, this Chapter aims to assess the impact on both shape variation and disparity
estimates of significantly increasing taxon sample size, as well as the possible drivers of the
observed variation. Additionally, I aim to investigate the impacts of different methods used to
estimate disparity over time.
3.2. Material and Methods
3.2.1. Sampling and data collection
I used two-dimensional landmark-based geometric morphometric analyses to quantify cranial
shape variation among crocodylomorphs. Ideally, skull shape would be fully assessed in a
three-dimensional approach, using landmarks on 3D surfaces. However, most
crocodylomorph crania are taphonomically deformed, usually by dorsoventral compression,
which prevents a comprehensive study using 3D data. Thus, I initially used the data published
by Wilberg (2017), as this was the most phylogenetically comprehensive 2D landmark dataset
available for the group. This dataset comprised 131 crocodylomorph specimens, most of
which were identified to species level, and used only dorsal views of skulls, as this view is
less susceptible to compression and taphonomic distortion across different crocodylomorph
groups. Wilberg (2017) digitised four landmarks on the right side of the skulls of individual
specimens (reflecting the left side of the skull when only this was available or it was better
preserved or more complete than the right side): “Landmark 1” at the caudalmost point of the
skull at the midline (excluding the occipital condyle), “Landmark 2” at the rostralmost point
of the snout, “Landmark 3” at the rostralmost point of the orbit margin, and “Landmark 4” at
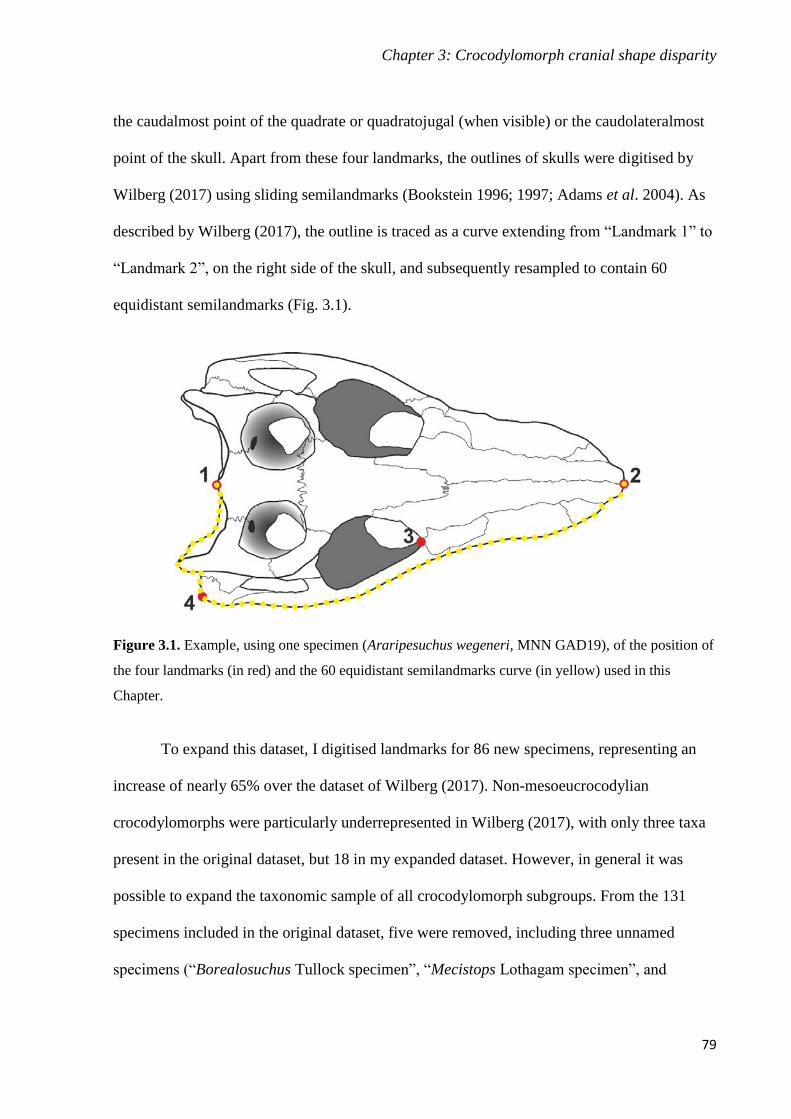
Chapter 3: Crocodylomorph cranial shape disparity
79
the caudalmost point of the quadrate or quadratojugal (when visible) or the caudolateralmost
point of the skull. Apart from these four landmarks, the outlines of skulls were digitised by
Wilberg (2017) using sliding semilandmarks (Bookstein 1996; 1997; Adams et al. 2004). As
described by Wilberg (2017), the outline is traced as a curve extending from “Landmark 1” to
“Landmark 2”, on the right side of the skull, and subsequently resampled to contain 60
equidistant semilandmarks (Fig. 3.1).
Figure 3.1. Example, using one specimen (Araripesuchus wegeneri, MNN GAD19), of the position of
the four landmarks (in red) and the 60 equidistant semilandmarks curve (in yellow) used in this
Chapter.
To expand this dataset, I digitised landmarks for 86 new specimens, representing an
increase of nearly 65% over the dataset of Wilberg (2017). Non-mesoeucrocodylian
crocodylomorphs were particularly underrepresented in Wilberg (2017), with only three taxa
present in the original dataset, but 18 in my expanded dataset. However, in general it was
possible to expand the taxonomic sample of all crocodylomorph subgroups. From the 131
specimens included in the original dataset, five were removed, including three unnamed
specimens (“Borealosuchus Tullock specimen”, “Mecistops Lothagam specimen”, and

Chapter 3: Crocodylomorph cranial shape disparity
80
“Prodiplocynodon Utah specimen”), as well as Stomatosuchus (because the fossil material
was lost during World War II [Sereno and Larsson 2009], preventing the inclusion of the
taxon in more recent phylogenetic analyses), and Hamadasuchus sp. (because first-hand
observation allowed me to instead use the holotype specimen of this genus). Following
Wilberg (2017), I did not include specimens identified by previous workers as juvenile or
sub-adult in the expanded dataset, in order to reduce the effect of ontogeny on cranial shape
variation. Furthermore, I also updated the taxonomy, permitting me to identify all specimens
at least to species level and to incorporate more recent taxonomic opinions. Thus, some of the
specimens treated by Wilberg (2017) as different species were merged (this was mostly the
case among thalattosuchians following recent taxonomic work: e.g., Parrilla-Bel et al. [2013],
Herrera et al. [2015], and Foffa et al. [2018]). In the cases where multiple specimens are
present for a species, averaged values were obtained before the Procrustes alignment. The
final expanded dataset includes 212 specimens, representing 209 species (see Appendix B for
the complete list of specimens). For landmark data collection, I followed the procedure
described in Wilberg (2017), using tpsUTIL version 1.76 (Rohlf 2015) for compiling the
images into a single .tps file, then digitising the landmarks and semilandmarks in tpsDIG2
version 2.30 (Rohlf 2015).
3.2.2. Phylogenetic framework
For the phylogenetic framework, I used a modified version of the crocodylomorph supertree
constructed for Chapter 2, which is itself a newer version of the supertrees previously
constructed by Bronzati et al. (2012; 2015). As in Chapter 2, I used three alternative positions
for the clade Thalattosuchia, as this represents one of the major uncertainties in
crocodylomorph phylogeny (see “Material and Methods” section of Chapter 2 for details). I

Chapter 3: Crocodylomorph cranial shape disparity
81
then used an informal approach (by manually modifying the tree using the software Mesquite
version 3.51; Maddison and Maddison 2018) to add species for which I had landmark data,
but which were not previously included in the supertree. The final version of the supertree
includes 325 species (316 crocodylomorphs and nine non-crocodylomorph species, as
outgroups), representing an increase of 20 taxa in comparison to the supertree used in Chapter
2. For the phylogenetic positions of the additional taxa included, I followed recently proposed
phylogenetic hypotheses. These included Brochu (2006) for gavialoids, Jouve et al. (2015) for
tomistomines, Meunier and Larsson (2017) for tethysuchians, and Parrilla-Bel et al. (2013),
Herrera et al. (2015), Fanti et al. (2016), Foffa et al. (2018), and Ősi et al. (2018) for
thalattosuchians. Additionally, I followed the phylogenetic hypothesis presented in Wilberg
(2017) for some extant crocodylians included in his original landmark dataset.
For performing disparity analyses, it was necessary to time-calibrate the trees (Bapst
2014a). I used the mbl method (Laurin 2004), which uses a minimum branch duration (in this
case set as 1 Myr) that is defined before time-scaling the phylogenies, in order to avoid zero-
length branches. Only one time-calibration method was used, although several alternative
approaches are available (see “Material and Methods” section of Chapter 2 for details), since
the aim here was to assess the impact of other factors on the analyses (such as different
topologies and distinct disparity metrics). For time-calibration, crocodylomorph age data (first
and last occurrence dates) were initially obtained from the Paleobiology Database (PBDB),
but were subsequently checked using the literature. To accommodate uncertainties related to
both debatable phylogenetic positions (reflected as polytomies in the supertree) and ages of
terminal taxa (i.e., ages based on single imprecise bounds, such as entire periods or
ages/stages), I generated 10 randomly resolved trees, each one of which was time-calibrated
with first and last occurrences dates treated as maximum and minimum possible ages,

Chapter 3: Crocodylomorph cranial shape disparity
82
drawing terminal dates (for the mbl method) from a uniform distribution between these. Time-
scaling was performed using the package paleotree (Bapst 2012) in R version 3.5.1 (R Core
Team 2018).
3.2.3. Geometric morphometric analyses
Prior to all geometric morphometric analyses, the crocodylomorph landmark data was
subjected to a generalised Procrustes analysis (GPA), using the package geomorph (Adams
and Otárola-Castillo 2013) in R version 3.5.1 (R Core Team 2018). GPA (also known as
Procrustes superimposition, Procrustes fit or GPA-alignment) is performed for obtaining
shape variables from landmark data after translating, rescaling and rotating the specimens,
resulting in aligned Procrustes coordinates for each specimen (Gower 1975; Rohlf and Slice
1990). Semilandmarks were defined using function define.sliders() in the same package, and
the location of sliding semilandmarks during GPA-alignment was optimised by minimizing
the bending energy between the reference and target specimen (i.e., argument ProcD=FALSE
within in the function gpagen(), also in geomoph; see Bookstein 1997). Subsequently, the
Procrustes coordinates of specimens were used as the input data for an ordination method, to
investigate which aspects of cranial shape varied the most among the sampled
crocodylomorph taxa. For that, I used principal component analysis (PCA; Hotelling 1933),
which was also performed in geomorph.
It is worth mentioning that these initial procedures (i.e., GPA followed by PCA) are,
to some extent, different from those applied by Wilberg (2017). The first difference was that
during Procrustes alignment, Wilberg (2017) allowed up to three iterations to occur (with
semilandmarks allowed to slide differently in each iteration). As I did not set a maximum
number of iterations, this resulted in up to six iterations in my analyses. Furthermore, Wilberg

Chapter 3: Crocodylomorph cranial shape disparity
83
(2017) also used a different software for performing GPA and ordination (tpsRELW; Rohlf
2015). Instead of PCA, Wilberg used Relative Warp Analysis (RWA) as the ordination
method, which should produce equivalent results to PCA, as he did not weight the variation
by bending energy (i.e., α = 0; Zelditch et al. 2012; Rohlf 2015). However, as a sensitivity
analysis, I submitted the original landmark data from Wilberg (2017) to the same procedure
used for the expanded dataset, in order to estimate the impact of these alternative procedures
on the results (i.e., morphospace occupation and PC scores [eigenvalues of each principal
component or eigenvector from the PCA]).
As the landmark data used in this Chapter derives from two distinct sources (i.e., the
dataset provided by Wilberg [2017] and the data collected for the present study), particular
attention was paid to the potential impact of interobserver error on the cranial shape data (i.e.,
measurement error caused by different observers/operators during the digitisation of
landmarks). This issue has received increased attention recently, given that sharing of
geometric morphometric datasets among scientists has become more frequent, and that a
significant amount of data (particularly three-dimensional data) have been collected from
multiple instruments (e.g., Fruciano 2016; Fruciano et al. 2017; Robinson and Tefhune 2017;
Shearer et al. 2017; Daboul et al. 2018). To assess whether interobserver error could be
influencing the morphospace occupation within my sample of crocodylomorphs, I initially
examined the scatterplot of scores along the first two principal components, dividing the
specimens into two groups: those originally included in the dataset of Wilberg (2017) and
those newly included in this Chapter. Additionally, to more quantitatively approach this issue,
I used Procrustes ANOVA (i.e., linear models) in geomorph (Goodall 1991; Klingenberg and
McIntyre 1998; Anderson 2001) to compute the amount of variation caused by interobserver
error. The Procrustes coordinates of all taxa were used as the response variable in the

Chapter 3: Crocodylomorph cranial shape disparity
84
Procrustes ANOVA formula, and the independent (grouping) variable was a discrete vector
indicating whether the landmark data was originally collected by Wilberg (2017) or by me. As
recommended by Collyer et al. (2015), I used a residual randomization permutation procedure
with 10,000 permutations to test the model significance. The percentage of variation driven by
interobserver error was then calculated by dividing the sum of squares (SS; see Goodall 1991)
for the term (grouping variable) by the total sum of squares of the model. The same procedure
was employed for examining the amount of variation originating from measurement error in
the first principal components (i.e., computing the percentage of variation caused by
interobserver error for each of these PCs).
Two procedures were then followed to attempt to minimise the effects of interobserver
error on the shape data. First, I applied Burnaby’s (1966) procedure of statistical correction
(also known as Burnaby back-projection or Burnaby’s projection), used for removing the
effect of extraneous variables from morphometric data (Rohlf and Bookstein 1987; Adams
1999). Burnaby’s method was originally designed as a size correction procedure, but it can be
used for removing the effects of other undesirable variables (vectors), by projecting the
original shape data into a subspace orthogonal to these vectors (Adams 1999; Fruciano 2016).
Apart from being frequently applied as a size correction in both traditional and geometric
morphometrics (Jungers et al. 1995; Klingenberg 1996; 2016; McCoy et al. 2006), this
method has proved itself useful for eliminating or reducing the artefactual variation caused by
other factors, particularly the body arching in fish (e.g., Valentin et al. 2008; Fruciano et al.
2011; Ingram 2015). The subspace (L) orthogonal to an extraneous variable (f1) is obtained
with matrix algebra, using the formula:
L = Iq − f1(f´1 f1) −1f´1

Chapter 3: Crocodylomorph cranial shape disparity
85
For N specimens, f1 is a q x 1 column vector, where q is the number of variables. I is
the identity matrix of q x q dimensions, whereas L is an idempotent symmetric matrix of rank
q – 1 (Rohlf and Bookstein 1987; Adams 1999). By multiplying the original data matrix by L,
the dataset of “adjusted specimens” (i.e., specimens with variation projected only to the
hyperplane orthogonal to the vector f1) is obtained (in this case, landmark coordinates without
the effect of an undesirable factor). For the purpose of this Chapter, f1 should be a vector that
best represents the shape variation caused by interobserver error. Accordingly, I used the sum
of squares from Procrustes ANOVA models to identify the principal component with the
highest percentage of variation explained by interobserver error, and subsequently used the
specimens’ PC scores for that principal component to represent f1. The matrix algebra for the
procedure described above was performed in R, adapting the script from Claude (2008). The
resulting adjusted landmarks were subjected to GPA and PCA, and the scatterplot of the first
two principal components was used to inspect the results (once again dividing the specimens
into two groups).
The second procedure used for reducing the effect of interobserver error focused on
the landmark digitisation protocol. As specified above, I followed the digitising protocol
defined by Wilberg (2017). For assessing the accuracy of this protocol, I opened the .tps file
(i.e., the “raw” landmark coordinates of each specimen) made available by Wilberg (2017) in
the software tpsDIG2 version 2.30. As I did not have access to the source images of
specimens originally used for digitising the landmarks, I modified the .tps file to use a blank
image, which allowed me to visualise the landmarks of all specimens. I then compared the
landmarks digitised by Wilberg (2017) and by me, searching for possible differences that
Chapter 3: Crocodylomorph cranial shape disparity
86
could generate biases during the digitisation process. I then attempted to minimise possible
differences by re-digitising the landmarks, following a standardised protocol.
Following these two procedures, landmark data were subjected to GPA and PCA, and
the results were then inspected using a plot of PC scores from the first two principal
components (with specimens divided into the same two groups), as well as by using
Procrustes ANOVA to calculate the percentage of variation caused by interobserver error. To
better visualise the morphospace occupation of different crocodylomorph subgroups (in PC1
versus PC2 scatterplots), I used distinct colours and convex hulls (i.e., the area inside the
minimum convex polygon; Cornwell et al. 2006) for six groups: Crocodylia, Tethysuchia,
Thalattosuchia, Notosuchia and two paraphyletic groupings of non-crocodylian neosuchians
(excluding tethysuchians and thalattosuchians) and non-mesoeucrocodylian crocodylomorphs
(excluding thalattosuchians). To statistically assesses the differences in the morphospace
occupied by these groups, I used non-parametric multivariate analysis of variance
(npMANOVA). In contrast to a parametric MANOVA, npMANOVA does not require the
data to be normally distributed, and tests for significant differences on the basis of
permutations (Anderson 2001). Pairwise comparisons between groups were performed, with
PC scores of taxa within each group transformed into a Euclidean distance matrix and
permuted 10,000 times. I then obtained adjusted p-values, to reduce the likelihood of type 1
statistical errors, using the Bonferroni correction (Rice 1989). It is worth mentioning that, as
the Bonferroni correction is considered very conservative, other methods for dealing with
multiple comparisons were also applied (such as the “Holm” and the “BH” methods; Holm
[1979]; Benjamini and Hochberg [1995]), as a sensitive test. Nevertheless, when different
methods provided similar results, only the Bonferroni-corrected p-values were reported.

Chapter 3: Crocodylomorph cranial shape disparity
87
I used phylomorphospaces to visually examine the influence of phylogeny on the
shape variation described by the first two principal components, by projecting phylogenetic
hypotheses onto the morphospace of PC1 against PC2. For that, the ancestral states were
estimated (i.e., landmark coordinates of hypothetical ancestors) using the R package
geomorph, which in turn uses function fastAnc() from package phytools (Revell 2012). This
function uses the “re-rooting method” (i.e., re-rooting the tree at every internal node; Yang et
al. 1996; Garland and Ives 2000) for estimating ancestral states with maximum likelihood and
assumes Brownian motion as the model of evolutionary change. Additionally, I more
quantitatively assessed the phylogenetic signal present in the shape data using a multivariate
generalisation of the K statistic of Bloomberg et al. (2003), which is a distance-based
approach described by Adams (2014). Using the function physignal() present in R package
geomorph, I obtained Adams’ Kmult, which provides a statistical measure of phylogenetic
signal based on Brownian motion dynamics (i.e., the expected value of Kmult under Brownian
motion is 1). The input data for this function is the entire dataset of aligned landmarks
(Procrustes coordinates of all specimens), which means that all aspects of shape variation are
being analysed (not only PC1 and PC2). For that, I used all 10 trees of each alternative
phylogenetic scenario (i.e., with different positions of Thalattosuchia), and calculated Kmult for
each tree performing 1000 iterations.
Furthermore, I also divided crocodylomorph species into three categories representing
distinct ecological habits (or lifestyles): marine/aquatic, freshwater/semi-aquatic and
terrestrial species. For dividing taxa into these subsets, I used information available in the
literature (mostly the information available in Mannion et al. 2015), as well as in the PBDB
(see Appendix B for a list of the lifestyles of all taxa). I then visually assessed the differences
in morphospace occupation using colours and convex hulls, and statistically scrutinised these
Chapter 3: Crocodylomorph cranial shape disparity
88
differences using npMANOVA (using the same parameters as for the taxonomic groups). For
analyses with taxonomic groups and ecological categories, pairwise npMANOVA tests were
performed using package RVAideMemoire (Hervé 2018), in R version 3.5.1 (R Core Team
2018).
3.2.4. Estimating disparity
Following the above procedures that accounted for measurement error, I performed analyses
to calculate the cranial shape disparity of the sampled crocodylomorphs. There are numerous
different methods for quantifying morphological disparity, which for geometric morphometric
data correspond to alternative proxies for space occupation (commonly known as disparity
metrics or indices; Foote 1993; Wills et al. 1994; Foote 1997; Wills 2001; Zelditch et al.
2012; Hopkins and Gerber 2017). Among these, the most frequently used in palaeontological
studies are the sums and products of ranges and variances (Wills et al. 1994; Guillerme and
Cooper 2018), which usually provide somewhat different results, and have their own
limitations (e.g., range metrics are more susceptible to problems arising from uneven
sampling, and variance metrics can introduce co-variance between not measured dimensions;
Butler et al. 2012; Guillerme and Cooper 2018). For the analyses within this Chapter, I
selected the sum of variances as the disparity metric, as it seems to be more robust for
measuring disparity through time (see Wills et al. 1994; Guillerme and Cooper 2018), and
also because it allows comparisons with the results from Wilberg (2017) as well as other
studies (e.g., Stubbs et al. 2003; Toljagić and Butler 2013). Thus, herein, disparity is defined
as the sum of variances expressed for all dimensions (eigenvectors), using PC scores of
specimens from all non-null principal components.

Chapter 3: Crocodylomorph cranial shape disparity
89
For disparity-through-time analyses, I included the estimated ancestral states, using all
10 time-calibrated trees for each of the three alternative phylogenetic scenarios. Subsequently,
two sub-sampling procedures were used for assessing crocodylomorph disparity through time:
time binning and time-slicing. As detailed by Guillerme and Cooper (2018), different methods
for sub-sampling taxa through time can have important impacts on the results of disparity-
through-time studies. For example, using stratigraphic intervals such as stages (a widely
employed approach; e.g., Prentice et al. 2011; Foth et al. 2012; Hughes et al. 2013; Stubbs et
al. 2013; Benton et al. 2014; Wilberg 2017) usually introduces sampling biases, since some
short time bins can include very few taxa, leading to large confidence intervals (Guillerme
and Cooper 2018). Alternatively, time bins can be arbitrarily set to represent equal length
intervals (e.g., Butler et al. 2012; Foth and Joyce 2016; Foth et al. 2016a; 2017b; Wilberg
2017), which might diminish the issues of uneven sampling. However, as this approach only
allows comparisons of changes in disparity that occur between intervals, it potentially
assumes a punctuated model of evolution (i.e., “punctuated equilibrium”, sensu Gould and
Eldredge 1977), and prevents the assessment of variation within intervals as a result of
gradual evolution (Guillerme and Cooper 2018). As an alternative to this time binning
method, Guillerme and Cooper (2018) recently proposed the “time-slicing” method, which is
a phylogeny-based method (i.e., using data from terminal taxa, nodes and branches) and takes
into consideration those taxa contemporaneous at specific equidistant points in time (instead
of taxa that were present between two points in time), resulting in even sampling.
Furthermore, this method allows a priori definition of the evolutionary model underlying the
changes in disparity.
Therefore, to more rigorously assess the patterns of crocodylomorph cranial shape
disparity through time, I used both time sub-sampling methods, with time sub-samples (either

Chapter 3: Crocodylomorph cranial shape disparity
90
time bins or time slices) defined by the number of intervals (i.e., using the same number of
time intervals for both methods). In this case, I used 10 and 20 time intervals (i.e., equal-
length time bins, in the time binning method, and equally distant specific points in time, in the
time-slicing method), to assess the impact of the number of time intervals. In both methods, I
used landmark data for both terminal taxa and hypothetical ancestors, and I also allowed taxa
to occur in multiple time intervals, by using taxon first and last occurrence dates. PC scores of
taxa in each time bin were subjected to bootstrapping (1,000 iterations) to calculate
confidence intervals. Finally, for the time-slicing method, I calculated disparity assuming
gradual and punctuated models of evolution. For punctuated evolution, selection of values of
ancestors or descendants was based on the position of the time slice along the branch, using
the score of the ancestor if it is located in the first half of the branch, and the score of the
descendant if it is in the second half (i.e., “proximity”; Guillerme and Cooper 2018). For
gradual evolution, a probability function of the distance between the nodes/tip at the ends of
the branch and the slice was used for selecting the values (i.e., “gradual splits”; Guillerme and
Cooper 2018).
I further inspected disparity among different crocodylomorph subgroups by dividing
the PC scores for each species into distinct subsets. First, I assessed disparity using six
subsets: Crocodylia, Tethysuchia, Thalattosuchia, Notosuchia, non-crocodylian neosuchians
and non-mesoeucrocodylian crocodylomorphs. Second, to investigate if the inclusion of
crocodylians and tethysuchians within Neosuchia could significantly change the results, I
divided the species into four subsets (Notosuchia, Thalattosuchia, Neosuchia and non-
mesoeucrocodylian crocodylomorphs). PC scores were subsequently bootstrapped 100 times
and, during each bootstrap replication, the number of elements (taxa) drawn was standardised
in all groups, by rarefying the data to 18 elements (the minimum number of species in a group

Chapter 3: Crocodylomorph cranial shape disparity
91
[in this case, non-mesoeucrocodylian crocodylomorphs]). As for disparity-through-time
analyses, the metric used was the sum of variances (i.e., “disparity” is the median of the sum
of variances in each group). Significant differences in bootstrapped median values were
statistically assessed using npMANOVA with 10,000 permutations, followed by a Bonferroni
correction for adjusted p-values (Rice 1989, Anderson 2001). Finally, in addition to these
analyses investigating disparity among different taxonomic groups, I also calculated disparity
for crocodylomorphs divided into three ecological categories. As for the taxonomic groups,
PC scores were bootstrapped (100 times) and rarefied (to 45 elements, as this is the minimum
number of taxa within any of the ecological categories), and I subsequently used
npMANOVA to test for statistically significant differences. All disparity analyses (through-
time and between groups) were performed using the R package dispRity (Guillerme 2018). An
example R script of the morphometric geometric and disparity analyses can be found in
Appendix C.
3.3. Results
3.3.1. Geometric morphometric analyses
The results obtained after subjecting the landmark dataset made available by Wilberg (2017)
to Procrustes alignment (GPA) and ordination (PCA) were very similar to those originally
presented by Wilberg (2017). The minor differences are possibly due to slightly different
methodological settings between the two software packages (tpsRELW and the R package
geomorph; as detailed in the “Material and Methods” section of this Chapter). However, the
first two principal components represent very similar percentages of total shape variation (i.e.,
PC1 = 70.76% in this work and 73.55% in Wilberg [2017], PC2 = 9.58% in this work and
10.81% in Wilberg [2017]) and describe almost identical aspects of morphological changes

Chapter 3: Crocodylomorph cranial shape disparity
92
(PC1 mainly represents snout length, whereas PC2 shows variation in snout width, position of
the orbit and quadrate condyle width). A morphospace scatterplot of PC1 against PC2 (Fig.
3.2) also shows taxa in similar positions in the morphospace to that presented in Wilberg
(2017; figure 4), and convex hulls of crocodylians and non-crocodylian crocodylomorphs
illustrate comparable morphospace occupations. These results indicate that any dissimilarities
found after expanding the landmark dataset would not be the result of differences in the
alignment and ordination procedures.
Figure 3.2. Morphospace scatterplot of the first two principal components using only specimens
included in the original dataset of Wilberg (2017), with 131 taxa. Comparative morphospace
occupation of crocodylians (crown group) and non-crocodylian crocodylomorphs (non-crown) is
shown using convex hulls. Deformation grids illustrate the cranial shape at the extremes of each PC.

Chapter 3: Crocodylomorph cranial shape disparity
93
Following this initial sensitivity analysis, I investigated the cranial shape variation of
crocodylomorphs using the expanded dataset of 209 species. Following GPA and PCA, the
PC1 versus PC2 morphospace (Fig. 3.3) exhibits a pattern unequivocally caused by
interobserver error (i.e., measurement error introduced to data due to different
observers/operators during data collection). Taxa originally included in Wilberg’s (2017)
dataset are clearly separated from those included in the present study, mainly along the PC2
axis. Whereas PC1 (50.89% of the variation) still seems to represent changes in snout length,
PC2 accounts for a significant larger amount of the total variation (22.89% of the variation)
compared to the sensitivity analysis. Furthermore, apart from changes in the quadrate condyle
width, PC2 does not seem to represent variations in other meaningful aspects of cranial
morphology, suggesting PC2 might mainly represent interobserver error.

Chapter 3: Crocodylomorph cranial shape disparity
94
Figure 3.3. Morphospace plot (PC1 versus PC2) using the expanded dataset, with 209 taxa. Different
colours were used for taxa originally in the dataset of Wilberg (2017), in red, and those newly
included in the present Chapter, in blue. Deformation grids illustrate the cranial shape at the extremes
of each PC.
Table 3.1. Procrustes ANOVA results investigating the amount of variation in shape data caused by
interobserver error. SS, sum of squares after 10,000 permutations; MS, mean squares; % of variation,
obtained by dividing the sum of squares of the independent variable (groups) by the total sum of
squares; F, F-statistic; p, p-value. * Significant at alpha = 0.05.
Total shape variation (all PCs)
Effect SS MS % of variation F p
Interobserver error 0.3507 0.35069 7.342348 16.403 0.0001*
Residuals 4.4255 0.02138
Total 4.7762
Shape variation represented by PC2
Effect SS MS % of variation F p
Interobserver error 0.32754 0.32754 29.96293 88.558 0.0001*
Residuals 0.76562 0.00370
Total 1.09316
To quantitatively estimate the amount of measurement error in the shape data, I used
Procrustes ANOVA with two distinct groups (taxa originally sampled by Wilberg [2017] and
those included in this Chapter) as the independent variable. The results show that
interobserver error corresponds to more than 7% of total shape variation, and virtually 30%
when assessing only the variation expressed by PC2 (Table 3.1). Among other PCs,
interobserver error represents a much smaller, sometimes marginal, percentage of the

Chapter 3: Crocodylomorph cranial shape disparity
95
variation (e.g., PC1 = 0.01%; PC3 = 2.84%; PC4 = 1.8%). This confirms that, among all
principal components, PC2 contains the largest amount of interobserver error, suggesting that
it could be used as a proxy vector (i.e., vector f1) for performing Burnaby’s (1966) projection,
aiming at removing the effects of an extraneous variable (in this case, interobserver error)
from the shape data. Thus, I subsequently employed Burnaby’s (1966) method, projecting the
landmark data into a subspace orthogonal to scores from PC2.
After GPA and PCA, the amount of variation accounted for interobserver error was
evidently reduced (from more than 7% to 1.68% of total shape variation). However, the
morphospace of PC1 against PC2 reveals that essential shape information was also
eliminated, as the morphological aspects represented by the first principal components are
rather unrealistic (Fig. 3.4A). Since this procedure did not produce satisfactory results, I then
more rigorously assessed the landmark digitising protocol, by visualising the landmarks from
the original dataset on a blank image (see “Material and Methods” section of this Chapter for
details). This allowed me to identify an important difference in the protocol. Different to what
was described by Wilberg (2017), the curve representing the skull outline did not contain 60
equidistant semilandmarks. Instead, there were two separate but adjoining curves. The first
curve, containing 35 semilandmarks, extended from “Landmark 1” to the level of the
rostralmost point of the orbit. The other, with 25 semilandmarks, started just after the end of
the first curve and extended until “Landmark 2”. Even though these curves were merged in
the final .tps file made available by Wilberg (2017), they were very likely drawn separately,
creating two modules on the outline of the skull (one rostral to and another caudal to the level
rostralmost point of the orbit), potentially exacerbating differences between longirostrine and
brevirostrine forms. Thus, to reduce the bias caused by differences in the digitising protocol, I
used the software tpsDIG2 (Rohlf 2015) to manually modify all specimens in the original

Chapter 3: Crocodylomorph cranial shape disparity
96
Wilberg’s dataset, resampling the outline curves to contain 60 equidistant semilandmarks. I
then added the remaining specimens (those included for the first time in the present work) and
subjected the landmark data to GPA and PCA.

Chapter 3: Crocodylomorph cranial shape disparity
97
Figure 3.4. Morphospace plot (PC1 versus PC2) using the expanded dataset, after applying two
procedures for removing the effect of interobserver error: A, Burnaby’s (1966) projection method and
B, standardisation of the landmark digitising protocol. Different colours were used for taxa originally
in the dataset of Wilberg (2017), in red, and those included for the first time in the present Chapter, in
blue. Deformation grids illustrate the cranial shape at the extremes of each PC.
Procrustes ANOVA results (Table 3.2) show that potential error caused by multiple
observers was drastically reduced (i.e., interobserver error accounts for 1.6% of total shape
variation), which indicates that biases originating from imprecisions in the digitising protocol
generated most of the error. For this reason, I used this modified version of the expanded
dataset for all subsequent analyses. The morphospace scatterplot of PC1 versus PC2 provides
further evidence that interobserver error has been considerably reduced following the
standardisation of the digitising protocol, as specimens are not clearly separated (Fig. 3.4B).
The aspects of morphology represented by PC1 and PC2 are equivalent to those found by the
original analysis (Wilberg, 2017). PC1 (71.89% of the variation) still describes variation in
snout length, but it also expresses changes in the caudolateral region of the skull, maybe
reflecting the addition of many metriorhynchoid thalattosuchians (twice as many as in the
original dataset) and some gavialoids (such as Piscogavialis jugaliperforatus and
Ikanogavialis gameroi). PC2 (8.6% of the variation) mostly describes changes in the quadrate
condyle and the position of the orbit in relation to the lateral outline of the skull. All other
principal components summed up represent less than 16% of total shape variation, none of
which represents more than 4% (Fig. 3.5).

Chapter 3: Crocodylomorph cranial shape disparity
98
Figure 3.5. Percentage of the cranial shape variation expressed by each of the first 20 principal
components, using the modified version of the expanded dataset (after the standardisation of the
landmark digitising protocol). Shown in green are the principal components (PC1 and PC2) used for
morphospace scatterplots in this Chapter.
Table 3.2. Procrustes ANOVA results investigating the amount of variation in shape data caused by
interobserver error after the standardisation of the landmark digitising protocol. SS, sum of squares
after 10,000 permutations; MS, mean squares; % of variation, obtained by dividing the sum of
squares of the independent variable (groups) by the total sum of squares; F, F-statistic; p, p-value. *
Significant at alpha = 0.05.
Total shape variation (all PCs)
Effect SS MS % of variation F p
Interobserver error 0.0870 0.086985 1.606624 3.38 0.038*
Residuals 5.3272 0.025735
Total 5.4142

Chapter 3: Crocodylomorph cranial shape disparity
99
The region around the negative end of the PC1 axis (left side of the plot; Fig. 3.6)
shows a concentration of longirostrine species, most of which are gavialoids (such as
Piscogavialis jugaliperforatus and Ikanogavialis gameroi), thalattosuchians (such as
Pelagosaurus typus, Steneosaurus bollensis, and Teleosaurus cadomensis), and tethysuchians
(such as the “pholidosaurid” Terminonaris browni and the dyrosaurid Rhabdognathus
keiniensis). However, some representatives of other groups are also present in this region,
such as the notosuchian Stolokrosuchus lapparenti and the crocodyloid Euthecodon brumpti.
The positive extremity of PC1 (Fig. 3.6) is dominated by forms with very short rostra, such as
the notosuchians Notosuchus terrestris and Comahuesuchus brachybuccalis, the non-
crocodylian neosuchians Iharkutosuchus makadii and Acynodon adriaticus, as well as the
non-mesoeucrocodylian crocodyliform Gobiosuchus kielanae. The distribution along the PC2
axis is not as extreme as for PC1, but, in general, taxa at the positive end of the axis (at the top
of the plot; Fig. 3.6) have broader snouts and wider quadrate condyles. This region is
occupied by the caimanine alligatoroid Purussaurus brasiliensis, as well as some
notosuchians (such as Lorosuchus nodosus and Armadillosuchus arrudai). Notosuchians
(such as Candidodon itapecuruense) are also observed in the region of negative PC2 scores
(at the bottom of the plot; Fig. 3.6), in addition to many thalattosuchians (such as Cricosaurus
lithographicus, Maledictosuchus riclaensis and Rhacheosaurus gracilis).
Comparisons of the morphospace occupied by different crocodylomorph subgroups
(Fig. 3.7) reveals a wide distribution of crocodylians and notosuchians. Crocodylian species
(Fig. 3.7A) exhibit almost the entire range of morphological variation described by PC1 (i.e.,
long versus short snouts), whereas most notosuchians (Fig. 3.7B) occupy the region of short
rostra (although the presence of Stolokrosuchus lapparenti in the analysis expands the
morphospace occupation of the group towards the “longirostrine region”). Pairwise statistical

Chapter 3: Crocodylomorph cranial shape disparity
100
assessment using npMANOVA (Table 3.3) reinforces the apparently disparate cranial
morphology of these two groups, as it shows that their morphospaces are significantly
different to one another, and also from most of the groups tested.
Figure 3.6. Morphospace plot (PC1 versus PC2) of crocodylomorph cranial shape variation, using the
expanded dataset, after removing the effect of interobserver error (by standardising the landmark
digitising protocol). Different colours represent distinct crocodylomorph subgroups: non-
mesoeucrocodylian crocodylomorphs (excluding thalattosuchians), Notosuchia, non-crocodylian
neosuchians (excluding tethysuchians and thalattosuchians), Tethysuchia, Thalattosuchia, and
Crocodylia.
The morphospaces of thalattosuchians and tethysuchians (Fig. 3.7C, and D) are more
restricted to the “longirostrine region” of the scatterplot, and the npMANOVA tests further
indicate that their morphospaces do not differ significantly from each other (Table 3.3). The

Chapter 3: Crocodylomorph cranial shape disparity
101
npMANOVA results also show that the morphospace of non-mesoeucrocodylian
crocodylomorphs is not significantly distinct from that of notosuchians, although they exhibit
an apparently less disparate morphospace occupation, with nearly all species confined to the
region of shorter snouts (Fig. 3.7E). Lastly, even though the morphospace of non-neosuchian
crocodylians is, in general, more restricted than that of crocodylians and they do not differ
significantly (Fig. 3.7F; Table 3.3), some species explore regions of the morphospace not
occupied by members of the crown-group (e.g., those of extremely short snouts, such as
Acynodon and Iharkutosuchus).
Table 3.3. npMANOVA results illustrating differences in the morphospace occupied by distinct
crocodylomorph subgroups in a pairwise comparison. *Bonferroni-corrected p-values significant at
alpha = 0.05.
Pairwise comparison p-values
Crocodylia – Notosuchia 0.0015*
Crocodylia – Thalattosuchia 0.0015*
Crocodylia – Tethysuchia 0.0585
Crocodylia – Non-crocodylian neosuchians 0.0615
Crocodylia – Non-mesoeucrocodylian crocodylomorphs 0.0015*
Notosuchia – Thalattosuchia 0.0015*
Notosuchia – Tethysuchia 0.0015*
Notosuchia – Non-crocodylian neosuchians 1
Notosuchia – Non-mesoeucrocodylian crocodylomorphs 1
Thalattosuchia – Tethysuchia 1
Thalattosuchia – Non-crocodylian neosuchians 0.0015*
Thalattosuchia – Non-mesoeucrocodylian crocodylomorphs 0.0015*
Tethysuchians – Non-crocodylian neosuchians 0.0015*
Tethysuchians – Non-mesoeucrocodylian crocodylomorphs 0.0015*
Non-neosuchians crocodylians – Non-mesoeucrocodylian crocodylomorphs 0.081

Chapter 3: Crocodylomorph cranial shape disparity
102
Fig. 3.7. Comparative morphospace occupation (PC1 versus PC2) of different crocodylomorph
subgroups using convex hulls (colour-coded as in Fig. 3.6). A, Crocodylia (n = 89). B, Notosuchia (n
= 30). C, Thalattosuchia (n = 29). D, Tethysuchia (n = 18). E, Non-mesoeucrocodylian
crocodylomorphs (without thalattosuchians; n = 18). F, Non-crocodylian neosuchians (without
tethysuchians and thalattosuchians; n = 25).
Even though some crocodylomorph subgroups exhibit morphospaces that are
significantly distinct from other groups, no clear signal is recovered when phylogenetic

Chapter 3: Crocodylomorph cranial shape disparity
103
information is incorporated into tangent space, producing a phylomorphospace plot of PC1
against PC2 (Fig. 3.8). The results were similar across all phylogenetic hypotheses available
(i.e., 10 trees for each phylogenetic scenario, with different positions of Thalattosuchia).
Indeed, using any of these trees, the phylogenetic signal estimated for the shape data was
relatively weak, although significant (Kmult values between 0.152 and 0.201, p-values =
0.001), which is consistent with the multiple intersections of branches seen in the
phylomorphospace.
Figure 3.8. Phylomorphospace (i.e., phylogenetic relationships plotted on to PC scores of specimens)
of crocodylomorph cranial shape variation (PC1 versus PC2). Circles of different colours represent
distinct crocodylomorph subgroups: non-mesoeucrocodylian crocodylomorphs, Notosuchia, non-
crocodylian neosuchians, Tethysuchia, Thalattosuchia, and Crocodylia. White circles represent
ancestor states (Procrustes coordinates), which were reconstructed using maximum likelihood.
Phylogenetic hypothesis from tree number 1, with Thalattosuchia within Neosuchia, but different trees
produce very similar results.
I further assessed the morphospace occupation of crocodylomorphs divided into three
distinct ecological categories (i.e., aquatic/marine, semi-aquatic/freshwater and terrestrial).

Chapter 3: Crocodylomorph cranial shape disparity
104
Although most terrestrial taxa are restricted to the region of the morphospace that represents
short-snouted skulls (positive end of the PC1 axis in Fig. 3.9), they also range along the entire
PC2 axis. Conversely, aquatic crocodylomorphs are more confined to the negative end of the
PC1 axis (Fig. 3.9) and are represented by some of the most extreme longirostrine forms
(such as Ikanogavialis gameroi). Semi-aquatic species are more widespread along the PC1
axis (Fig. 3.9), although their distribution along the PC2 axis seems to be similar to that
observed for aquatic forms. These differences between the distinct ecologies are reflected in
the npMANOVA results, which indicate that all three categories have significantly different
morphospace occupation (p-values < 0.001).
Figure 3.9. Morphospace occupation of crocodylomorphs divided into three ecological categories:
aquatic/marine (n = 56), semi-aquatic/freshwater (n = 109) and terrestrial (n = 44).

Chapter 3: Crocodylomorph cranial shape disparity
105
3.3.2. Disparity through time and between groups
Distinct tree topologies, as well as different time sub-sampling methods, had significant
impacts on the disparity-through-time analyses (see Appendix D for plots of all disparity-
through-time analyses). For each alternative phylogenetic scenario (i.e., changing the position
of Thalattosuchia), 10 distinct randomly resolved trees were time-scaled, generating different
branch lengths in each tree. Furthermore, as these trees were used for estimating the ancestral
states (i.e., landmark coordinates of hypothetical ancestors), they presumably produce distinct
PC scores for ancestors. Comparisons of trees sharing the same position of Thalattosuchia
show some dissimilarities in the pattern of disparity through time, and these differences are
more marked when a greater number of time intervals are used (using either the time binning
or the time-slicing methods). Using trees with Thalattosuchia as the sister group of
Crocodyliformes as an example (Fig. 3.10), analyses using distinct randomly resolved and
time-scaled trees disagree on the timing and magnitude of a disparity peak during the early
evolution of the group. Whereas some trees show this peak beginning prior to the Triassic-
Jurassic (T–J) boundary, other trees yield a later start, only after the boundary. Other
differences include whether there is an increase or a decrease in disparity from the middle of
the Neogene (Eocene) to the Recent, as well as if a peak observed during the Early Cretaceous
corresponds to the highest disparity seen in the group’s entire evolutionary history (Fig. 3.10).
The use of alternative phylogenetic positions of Thalattosuchia did not cause significant
changes to the patterns of disparity after the Late Jurassic, having instead the greatest impact
on disparity estimation during the Jurassic, since this corresponds to the age range of
thalattosuchians.

Chapter 3: Crocodylomorph cranial shape disparity
106
Figure 3.10. Comparison between different randomly resolved and time-scaled trees used for
disparity-through-time analyses. All trees share the same phylogenetic position of thalattosuchians (as
sister to Crocodyliformes) and the analyses used the same time sub-sampling method (time binning
method, with 20 equal-length time bins). The sum of variance is used as the disparity metric. Light and
dark green shades represent, respectively, 75% and 97.5% confidence intervals from 1,000
bootstrapping replicates.
In general, disparity-through-time analyses using more time intervals (either time bins
or time slices) reconstruct more nuanced changes in disparity, even though they also often
have larger confidence intervals (Fig. 3.11). When comparing different time sub-sampling
methods, similar differences are observed to those seen when different tree topologies are
compared (i.e., variation in the timing and magnitude of disparity peaks). For example,
analyses using the time-slicing method more frequently detected an increase in disparity
during the Palaeogene (Eocene) than those using the time-binning method. Similarly, the
magnitude estimated for the peak seen at the end of the Early Cretaceous (i.e., Aptian–Albian)

Chapter 3: Crocodylomorph cranial shape disparity
107
was usually greater when using the time-slicing method. Furthermore, comparing analyses
using only the time-slicing method, but with different numbers of time slices, analyses with
10 time slices more often failed to detect an early disparity peak (during the Early Jurassic)
than those using 20 time slices. By contrast, almost identical results were found when
different evolutionary models (i.e., punctuated or gradual model) were assumed for analyses
using the time-slicing method (Fig. 3.11).
Despite these dissimilarities arising from different time-scaled trees and time sub-
sampling methods, most analyses seem to agree on some overall patterns of crocodylomorph
cranial shape disparity through time (Figs. 3.10, 3.11 and Appendix D). An early peak in
disparity is frequently observed, most often during the Early Jurassic (although sometimes
even prior to the Triassic-Jurassic boundary). Following a sharp decrease during the Middle
Jurassic, disparity undergoes a continuous increase until the middle of the Cretaceous
(Aptian–Albian), when maximum disparity is reached in most analyses. Subsequently, a near
constant decline is observed during the Late Cretaceous and the Palaeocene, with analyses
only disagreeing whether it continues until the Recent or ceases during the Eocene. In these
latter cases (more frequently seen in analyses using the time-slicing method), the sharp
increase in disparity seen in the Eocene is sometimes maintained until the Recent.

Chapter 3: Crocodylomorph cranial shape disparity
108
Figure 3.11. Comparison between different time sub-sampling methods used for calculating
crocodylomorph disparity through time. All analyses used the same time-scaled tree (tree number 4
with Thalattosuchia within Neosuchia). A, Time binning method, with 10 equal-length time bins. B,
Time binning method, with 20 equal-length time bins. C, Time-slicing method, with 10 time slices,
assuming punctuated evolution. D, Time-slicing method, with 20 time slices, assuming punctuated
evolution. E, Time-slicing method, with 10 time slices, assuming gradual evolution. F, Time-slicing
method, with 20 time slices, assuming gradual evolution. The sum of variance is used as the disparity
metric. Light and dark green shades represent, respectively, 75% and 97.5% confidence intervals from
1,000 bootstrapping replicates.

Chapter 3: Crocodylomorph cranial shape disparity
109
Subsequently, I examined cranial shape disparity among different crocodylomorph
subgroups. Analyses with six subsets (i.e., Crocodylia, Notosuchia, Thalattosuchia,
Tethysuchia, non-crocodylian neosuchians, and non-mesoeucrocodylian crocodylomorphs)
revealed that Notosuchia has the highest cranial shape disparity among all groups assessed
(Fig. 3.12A). Crocodylia exhibits a smaller disparity, although slightly higher than the other
four groups (Tethysuchia, Thalattosuchia, non-crocodylian neosuchians, and non-
mesoeucrocodylian crocodylomorphs), which have comparable median values. Pairwise
comparisons (Table 3.4) show that disparity in both Notosuchia and Crocodylia is
significantly different from that in all other groups analysed, whereas some other groups have
statistically equivalent disparities (e.g., thalattosuchians and non-mesoeucrocodylian
crocodylomorphs, as well as tethysuchians and non-crocodylian eusuchians). The same results
were recovered when fewer subsets of taxa were analysed (i.e., Notosuchia, Thalattosuchia,
non-mesoeucrocodylian crocodylomorphs, and Neosuchia), with notosuchian disparity still
higher and significantly different from the other groups (Fig. 3.12B; Table 3.5). Finally, I
assessed the differences in disparity between the three ecological categories (i.e.,
aquatic/marine, semi-aquatic/freshwater and terrestrial). Whereas aquatic and semi-aquatic
species exhibit similar median disparity (Fig. 3.13), which is supported by the npMANOVA
results (Table 3.6), terrestrial crocodylomorphs show significantly higher disparity than the
other two categories (Fig. 3.13; Table 3.6).

Chapter 3: Crocodylomorph cranial shape disparity
110
Figure 3.12. Cranial shape disparity (sum of variances) among different crocodylomorph subgroups.
A, Species divided into six taxonomic subsets (“neosuchians” represent crocodylian neosuchians,
without thalattosuchians and tethysuchians; “crocodylomorphs” represent non-mesoeucrocodylian
crocodylomorphs, without thalattosuchians). B, Species divided into four taxonomic subsets
(“Neosuchia” also includes crocodylians and tethysuchians). PC scores of specimens were
bootstrapped and rarefied for disparity calculation.

Chapter 3: Crocodylomorph cranial shape disparity
111
Table 3.4. npMANOVA results for pairwise comparisons of cranial shape disparity (sum of variances)
in different crocodylomorph subgroups (divided into six subsets). *Bonferroni-corrected p-values
significant at alpha = 0.05.
Pairwise comparison p-values
Crocodylia – Notosuchia 0.0015*
Crocodylia – Thalattosuchia 0.0015*
Crocodylia – Tethysuchia 0.0015*
Crocodylia – Non-crocodylian neosuchians 0.0015*
Crocodylia – Non-mesoeucrocodylian crocodylomorphs 0.0090*
Notosuchia – Thalattosuchia 0.0015*
Notosuchia – Tethysuchia 0.0015*
Notosuchia – Non-crocodylian neosuchians 0.0015*
Notosuchia – Non-mesoeucrocodylian crocodylomorphs 0.0015*
Thalattosuchia – Tethysuchia 0.0090*
Thalattosuchia – Non-crocodylian neosuchians 0.7919
Thalattosuchia – Non-mesoeucrocodylian crocodylomorphs 0.6884
Tethysuchians – Non-crocodylian neosuchians 1
Tethysuchians – Non-mesoeucrocodylian crocodylomorphs 0.0015*
Non-neosuchians crocodylians – Non-mesoeucrocodylian crocodylomorphs 0.0015*
Table 3.5. npMANOVA results for pairwise comparisons of cranial shape disparity (sum of variances)
in different crocodylomorph subgroups (divided into four subsets). *Bonferroni-corrected p-values
significant at alpha = 0.05.
Pairwise comparison p-values
Notosuchia – Neosuchia 0.0006*
Notosuchia – Thalattosuchia 0.0006*
Notosuchia – Non-mesoeucrocodylian crocodylomorphs 0.0006*
Neosuchia – Thalattosuchia 0.0006*
Neosuchia – Non-mesoeucrocodylian crocodylomorphs 0.0006*
Thalattosuchia – Non-mesoeucrocodylian crocodylomorphs 1

Chapter 3: Crocodylomorph cranial shape disparity
112
Figure 3.13. Cranial shape disparity (sum of variances) with crocodylomorphs subdivided into three
different lifestyle categories: marine/aquatic (n = 56), freshwater/semi-aquatic (n = 109), and
terrestrial (n = 44) species. PC scores of specimens were bootstrapped and rarefied for disparity
calculation.
Table 3.6. npMANOVA results (pairwise comparisons) of cranial shape disparity (sum of variances)
of crocodylomorphs assessed in different lifestyle categories. *Bonferroni-corrected p-values (q-
values) significant at alpha = 0.05.
Pairwise comparison q-values
Aquatic – Semi-aquatic 0.096
Aquatic – Terrestrial 0.0003*
Semi-aquatic – Terrestrial 0.0003*

Chapter 3: Crocodylomorph cranial shape disparity
113
3.4. Discussion
3.4.1. Assessing the different methods to minimise the effects of interobserver error
Among the two methods applied for diminishing the effects of interobserver error, only the
standardisation of the landmark digitising protocol proved itself useful in the context of this
Chapter. Although other studies previously successfully applied Burnaby’s (1966) projection
method, most of these were able to create a model to more appropriately represent the
extraneous variable, which can be either a size-factor or undesirable morphological features
(e.g., Gharaibeh 2005; Valentin et al. 2008). For example, Valentin et al. (2008) presented a
protocol for removing the effects of upward and downward arching in the body of fish due to
preservation. For that approach, the authors digitised landmarks from 10 arched specimens
(photographed 20 times each) to create a deformation model that represented the arching
effect. The landmark data of this model was then subjected to GPA and RWA (equivalent to
PCA), and the first eigenvector (i.e., principal component), representing 97.3% of total
variation, accurately described the arching effect. Subsequently, Burnaby’s (1966) projection
method was applied, by projecting the original landmark data to a subspace orthogonal to the
first eigenvector of the deformation model. This procedure was further applied in other
studies (e.g.; Fruciano et al. 2011; 2012; Franchini et al. 2014; Ingram 2015; Fruciano et al.
2016), for which it also provided satisfactory results.
For the analyses in this Chapter, however, the extraneous variable (i.e., interobserver
error) could not be modelled. Thus, the second principal component (PC2) was used as a
proxy, since among all PCs, PC2 described the largest amount of interobserver error (~30% of
the variation described by this eigenvector). Nevertheless, after applying Burnaby’s projection
method, other components of morphological variation described by PC2 were also removed,
generating in unrealistic result (which could be assessed after performing GPA and PCA; Fig.

Chapter 3: Crocodylomorph cranial shape disparity
114
3.4A). Similar issues were reported by Berner (2011), which used simulated data to assess the
effectiveness of size-correction methods based on principal components, a widely applied
approach (Klingenberg 2016). This approach assumes that, in datasets with a substantial
amount of variation correlated with size, PC1 should mostly reflect size variation, and could
hypothetically be used as a proxy vector for Burnaby’s projection method. Nevertheless,
Berner (2011) demonstrated that this method produced systematic statistical artefacts,
especially when all traits in the dataset were strongly correlated with size, making it
inappropriate for size correction. Likewise, similar artefacts are expected in the context of the
present Chapter, since the interobserver error is very likely correlated with all aspects of
morphological variation (described by the principal components).
By contrast, the second approach used (i.e., looking for differences in the landmark
digitising protocol) sensibly reduced the effects of interobserver error (from 7.35% to 1.6% of
total shape variation; Tables 3.1 and 3.2). After performing GPA and PCA, it was possible to
confirm that the aspects of morphology described by the principal components were realistic
and compatible with the variation seen in the actual specimens (Fig. 3.4B). These results
demonstrate, in practice, the importance of well-described, standardised digitisation protocols.
Similarly, Fruciano et al. (2017) suggested that, if more than one observer/operator is required
during the digitisation of landmarks, the exclusion of landmarks that are potentially difficult
to digitise can robustly reduce interobserver error. Thus, if we are to more frequently use
landmark data from different sources in geometric morphometric studies, by either combining
published datasets with newly digitised specimens or using more than one operator during the
digitisation process, approaches towards best practice should include clearer, simpler and
well-described digitisation protocols.

Chapter 3: Crocodylomorph cranial shape disparity
115
3.4.2. Crocodylomorph cranial shape variation
The geometric morphometric analyses showed that most of the shape variation in
crocodylomorph skulls represents changes in the snout, particularly in its length and width
(Figs. 3.5 and 3.6). This is consistent with what was found in previous geometric
morphometric studies (e.g., Pierce et al. 2008; Sadleir and Makovicky 2008; Pierce et al.
2009a; Piras et al. 2009; Young et al. 2010; Foth et al. 2017a; Wilberg 2017; Chapter 4),
indicating that this region of the skull has the highest morphological variation. High
variability in crocodylomorph snout length has long been acknowledged (Langston 1973;
Busbey 1995; Brochu 2001), even leading early taxonomists (e.g., Lydekker 1888) to
erroneously classify crocodylomorphs into different groups (Pierce et al. 2008). More
recently, however, the high plasticity of crocodylomorph snouts has been more frequently
recognised, resulting from the strong ecological selective pressures on this region of the skull,
such as those arising from feeding behaviour (see McCurry et al. [2017a] for an exceptional
example of convergent evolution in snouts of crocodylians and odontocete cetaceans).
Consequently, cladistic studies (e.g., Clark 1994; Jouve et al. 2006; Pol and Gasparini 2009;
Wilberg 2015) have suggested that convergences in crocodylomorph snouts during their
evolutionary history have created the “longirostrine problem”, in which clades that are not
necessarily closely related tend to be grouped together in phylogenetic analyses. Even though
the variation seen within snout lengths may differ between different crocodylomorph groups
(for example, in Notosuchia snout length variation seems to represent a less substantial
amount of total skull shape variation; Chapter 4), this seems to be a key feature during the
group’s evolutionary history.
Snout length can provide useful insights into ecological specializations (Taylor 1987;
Busbey 1995; Brochu 2001; McHenry et al. 2006; Pierce et al. 2008; Walmsley et al. 2013).

Chapter 3: Crocodylomorph cranial shape disparity
116
For example, longer snouts are traditionally associated with a piscivorous diet, since the tip of
the snout moves faster through water, facilitating the capture of small prey such as fish
(Thorbjarnarson 1990; McHenry et al. 2006; Walmsley et al. 2013; McCurry et al. 2017b).
Similarly, snout width also has important biomechanical implications, such as impacting on
hydrodynamic pressure drag (e.g., longirostrine animals compensate the higher pressure from
dragging with narrower snouts; McHenry et al. 2006; Walmsley et al. 2013). Unfortunately,
the two-dimensional nature of the geometric morphometric data used in the present study,
using skulls only in dorsal view, prevents the assessment of crocodylomorph snout height,
which represents a relevant aspect of rostral morphology and has important biomechanical
implications (Taylor 1987; Busbey 1995; McHenry et al. 2006).
Other regions of the crocodylomorph skull also vary significantly according to the
aspects of morphology described by the principal components. Changes in the quadrate
condyle width and in the caudolateral region of the skull are described by both PC1 and PC2
(Fig. 3.6). As for the variation seen in among crocodylomorph snouts, modifications in the
quadrate condyle, presumably associated with the craniomandibular joint, also have important
implications for biomechanics and feeding strategies (Kley et al. 2010; Stubbs et al. 2013; Ősi
2014).
Some crocodylomorph subgroups occupy regions of the morphospace that are
significantly distinct from other groups (Fig. 3.7; Table 3.3), which might indicate that clade-
specific innovations led to the exploration of new cranial morphologies. However, the
relatively weak phylogenetic signal estimated, independently of the phylogenetic hypothesis
used, is consistent with the multiple intersections of branches seen in the phylomorphospace
(Fig. 3.8). Indeed, it seems clear that whereas some clades, such as Thalattosuchia, are more
confined to a given region of the morphospace, others are more widespread, including
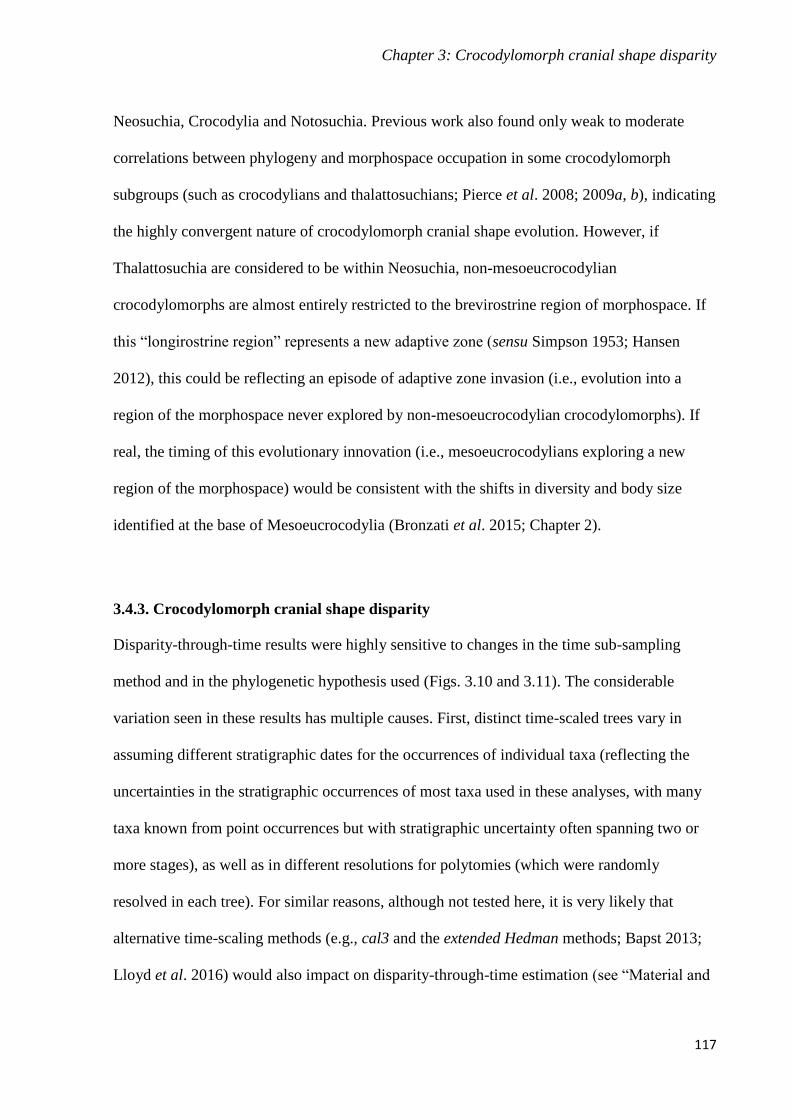
Chapter 3: Crocodylomorph cranial shape disparity
117
Neosuchia, Crocodylia and Notosuchia. Previous work also found only weak to moderate
correlations between phylogeny and morphospace occupation in some crocodylomorph
subgroups (such as crocodylians and thalattosuchians; Pierce et al. 2008; 2009a, b), indicating
the highly convergent nature of crocodylomorph cranial shape evolution. However, if
Thalattosuchia are considered to be within Neosuchia, non-mesoeucrocodylian
crocodylomorphs are almost entirely restricted to the brevirostrine region of morphospace. If
this “longirostrine region” represents a new adaptive zone (sensu Simpson 1953; Hansen
2012), this could be reflecting an episode of adaptive zone invasion (i.e., evolution into a
region of the morphospace never explored by non-mesoeucrocodylian crocodylomorphs). If
real, the timing of this evolutionary innovation (i.e., mesoeucrocodylians exploring a new
region of the morphospace) would be consistent with the shifts in diversity and body size
identified at the base of Mesoeucrocodylia (Bronzati et al. 2015; Chapter 2).
3.4.3. Crocodylomorph cranial shape disparity
Disparity-through-time results were highly sensitive to changes in the time sub-sampling
method and in the phylogenetic hypothesis used (Figs. 3.10 and 3.11). The considerable
variation seen in these results has multiple causes. First, distinct time-scaled trees vary in
assuming different stratigraphic dates for the occurrences of individual taxa (reflecting the
uncertainties in the stratigraphic occurrences of most taxa used in these analyses, with many
taxa known from point occurrences but with stratigraphic uncertainty often spanning two or
more stages), as well as in different resolutions for polytomies (which were randomly
resolved in each tree). For similar reasons, although not tested here, it is very likely that
alternative time-scaling methods (e.g., cal3 and the extended Hedman methods; Bapst 2013;
Lloyd et al. 2016) would also impact on disparity-through-time estimation (see “Material and

Chapter 3: Crocodylomorph cranial shape disparity
118
Methods” section of Chapter 2, as well as Bapst [2013; 2014b] for further discussion).
Furthermore, the use of distinct phylogenetic hypotheses, in this case the variable position of
Thalattosuchia, results in different ancestral state estimations. Similarly, distinct approaches
to estimating ancestral states could also potentially impact on the results (see Ekman et al.
2008; Slater et al. 2012). Finally, the use of distinct time sub-sampling methods, as well as
different numbers of time intervals (either time bins or time slices), results in different taxa
being sampled in each time interval, since the rates of sedimentation (and fossilisation) are
uneven in space and time (Butler et al. 2012; Guillerme and Cooper 2018).
These results shed light on the importance of using multiple time sub-sampling
methods and trees for these analyses (as previously highlighted by Guillerme and Cooper
2018), but also multiple phylogenetic hypotheses (for groups with major uncertainties in
stratigraphic occurrence dates and phylogenetic relationships). However, many previous
studies have ignored this issue, often presenting results based on one time-scaled phylogeny
and one time binning approach (e.g., Brusatte et al. 2008a, b; Stubbs et al. 2013; Foth and
Joyce 2016). Accordingly, rather than using a single analysis, a better way to report the results
might be by describing shared patterns among the outputs, as I have done here.
The overall disparity patterns seen in most disparity-through-time analyses resemble
those found by Wilberg (2017), in that a clear peak is observed in the Cretaceous, followed by
a nearly continuous decline towards the Recent. Some differences, however, are also noted.
Since Wilberg (2017) used different disparity metrics in his analyses, my comparisons
between my results and his focus on the results of variance-based disparities. The first
discrepancy arises from the fact that Wilberg (2017) restricted his study to Crocodyliformes
(with the exception of thalattosuchians) and did not include any Late Triassic species,
resulting in an absence of information about crocodylomorph disparity prior to the Jurassic.

Chapter 3: Crocodylomorph cranial shape disparity
119
When using stratigraphic intervals as time bins for his disparity-through-time analyses
(resulting in 36 time bins), Wilberg (2017) found two significant disparity peaks during the
Jurassic (one in the Pliensbachian and another in the Aalenian–Bajocian), whereas in most of
my analyses a single Jurassic peak was estimated, usually occurring from the Sinemurian to
the Toarcian (Figs. 3.10 and 3.11). However, similarly to my results, Wilberg’s analyses did
not detect Jurassic peaks in disparity when using fewer, equal-length time bins (n = 9), at least
not with comparable magnitude to the peak in the Cretaceous. The timing of the disparity
peak in the Cretaceous is another divergence between the two studies, with the analyses
performed by Wilberg (2017) indicating a Late Cretaceous peak (Cenomanian), whereas most
of my analyses show a slightly earlier peak (Aptian–Albian). Finally, another difference was
found in the pattern of disparity from the Eocene to the Recent. Whereas many of my analyses
(particularly when using the time-slicing method) indicate a disparity increase starting in the
Eocene, this increase is not identified by the variance-based analyses in Wilberg (2017).
The discrepancies between these two studies can be explained by the increase in the
sample size, by the differences in ages assigned to both terminal taxa and lineage divergences,
and by methodological differences in time sub-sampling strategies and the consideration of
divergent phylogenetic hypotheses. A similar argument may explain differences seen between
my results and those presented by Stubbs et al. (2013). Stubbs et al. (2013) found that
mandibular morphological disparity was greater during the Late Cretaceous. Besides using a
different proxy for morphological disparity (mandibular shape instead of cranial), Stubbs et
al. (2013) also sampled 23 non-crocodylomorphs (such as phytosaurs and aetosaurs), as they
were interested in pseudosuchian disparity more broadly.
Regarding the disparity patterns that are common to most of my results, the early peak
seen during the Jurassic is very likely associated with the origin and diversification of
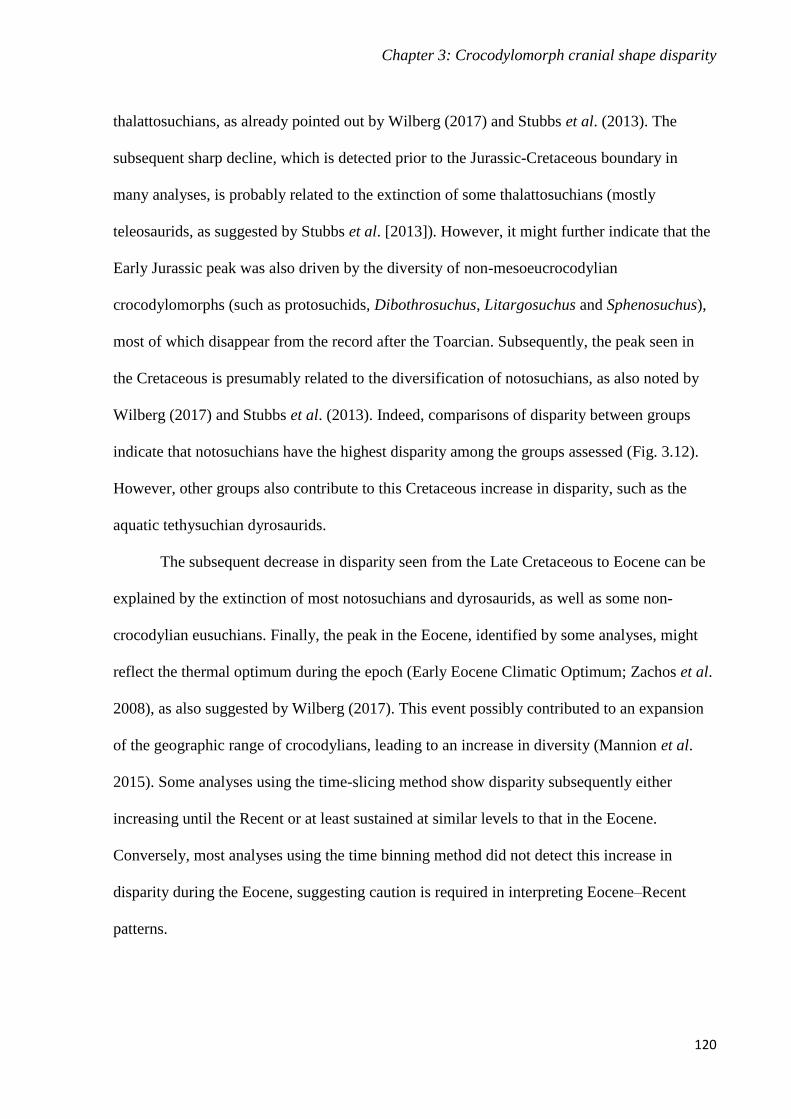
Chapter 3: Crocodylomorph cranial shape disparity
120
thalattosuchians, as already pointed out by Wilberg (2017) and Stubbs et al. (2013). The
subsequent sharp decline, which is detected prior to the Jurassic-Cretaceous boundary in
many analyses, is probably related to the extinction of some thalattosuchians (mostly
teleosaurids, as suggested by Stubbs et al. [2013]). However, it might further indicate that the
Early Jurassic peak was also driven by the diversity of non-mesoeucrocodylian
crocodylomorphs (such as protosuchids, Dibothrosuchus, Litargosuchus and Sphenosuchus),
most of which disappear from the record after the Toarcian. Subsequently, the peak seen in
the Cretaceous is presumably related to the diversification of notosuchians, as also noted by
Wilberg (2017) and Stubbs et al. (2013). Indeed, comparisons of disparity between groups
indicate that notosuchians have the highest disparity among the groups assessed (Fig. 3.12).
However, other groups also contribute to this Cretaceous increase in disparity, such as the
aquatic tethysuchian dyrosaurids.
The subsequent decrease in disparity seen from the Late Cretaceous to Eocene can be
explained by the extinction of most notosuchians and dyrosaurids, as well as some non-
crocodylian eusuchians. Finally, the peak in the Eocene, identified by some analyses, might
reflect the thermal optimum during the epoch (Early Eocene Climatic Optimum; Zachos et al.
2008), as also suggested by Wilberg (2017). This event possibly contributed to an expansion
of the geographic range of crocodylians, leading to an increase in diversity (Mannion et al.
2015). Some analyses using the time-slicing method show disparity subsequently either
increasing until the Recent or at least sustained at similar levels to that in the Eocene.
Conversely, most analyses using the time binning method did not detect this increase in
disparity during the Eocene, suggesting caution is required in interpreting Eocene–Recent
patterns.

Chapter 3: Crocodylomorph cranial shape disparity
121
3.4.4. Ecological diversity and crocodylomorph skull shape
The high variability of the crocodylomorph snout, which associated with ecological
specializations (particularly the ones related to feeding; McHenry et al. 2006; Walmsley et al.
2013), combined with the weak phylogenetic signal found for cranial shape data, suggests that
crocodylomorph cranial shape evolution is mostly driven by ecology. I further examined the
effect of ecology on shape variation by subdividing the species into three ecological
categories (aquatic/marine, semi-aquatic/freshwater and terrestrial), using habitat (i.e., the
hypothesised environment in which these species lived in) as a proxy for ecological diversity.
The npMANOVA results provide further support for this hypothesis, as they show that all
three categories have significantly distinct morphospaces.
Closer inspection of the morphospace reveals that semi-aquatic/freshwater forms are
more widespread along the PC1 axis in comparison to terrestrial and aquatic/marine
crocodylomorphs (Fig. 3.9), suggesting a higher diversity of feeding strategies in semi-
aquatic/freshwater species. However, when cranial shape disparity is quantified, terrestrial
forms show higher disparity than both aquatic and semi-aquatic categories (Fig. 3.13).
Disparity estimation includes the shape variation described by all principal components, not
just that shown in the morphospace scatterplot of PC1 against PC2. Thus, although exhibiting
less variability in terms of snout length, skulls of terrestrial species are more disparate in
general.
This higher disparity in terrestrial taxa is possibly related to the cranial shape variation
of notosuchians, which show greater disparity than any other crocodylomorph subgroup (Fig.
3.12). Notosuchians explored a wide range of cranial morphologies, some of which are unique
within crocodylomorph evolutionary history (such as mammal-like adaptations and putative
herbivory; Buckley et al. 2000; O'Connor et al. 2010; Ősi 2014). The remarkable species
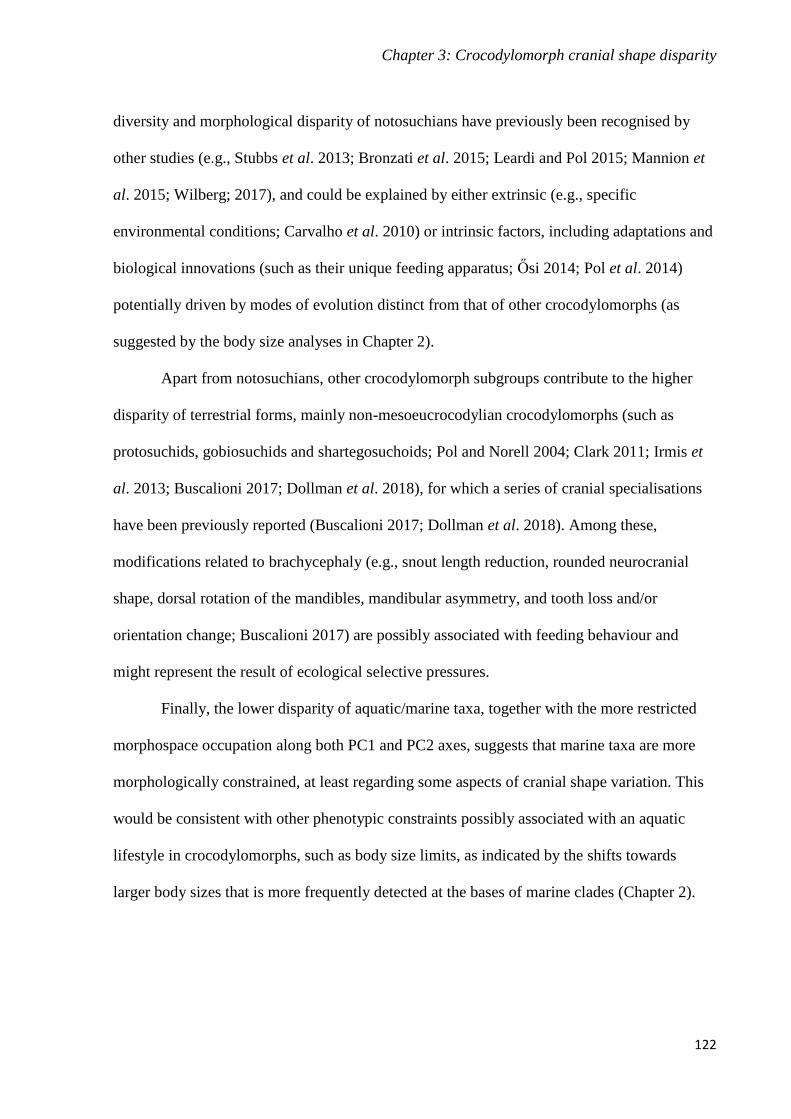
Chapter 3: Crocodylomorph cranial shape disparity
122
diversity and morphological disparity of notosuchians have previously been recognised by
other studies (e.g., Stubbs et al. 2013; Bronzati et al. 2015; Leardi and Pol 2015; Mannion et
al. 2015; Wilberg; 2017), and could be explained by either extrinsic (e.g., specific
environmental conditions; Carvalho et al. 2010) or intrinsic factors, including adaptations and
biological innovations (such as their unique feeding apparatus; Ősi 2014; Pol et al. 2014)
potentially driven by modes of evolution distinct from that of other crocodylomorphs (as
suggested by the body size analyses in Chapter 2).
Apart from notosuchians, other crocodylomorph subgroups contribute to the higher
disparity of terrestrial forms, mainly non-mesoeucrocodylian crocodylomorphs (such as
protosuchids, gobiosuchids and shartegosuchoids; Pol and Norell 2004; Clark 2011; Irmis et
al. 2013; Buscalioni 2017; Dollman et al. 2018), for which a series of cranial specialisations
have been previously reported (Buscalioni 2017; Dollman et al. 2018). Among these,
modifications related to brachycephaly (e.g., snout length reduction, rounded neurocranial
shape, dorsal rotation of the mandibles, mandibular asymmetry, and tooth loss and/or
orientation change; Buscalioni 2017) are possibly associated with feeding behaviour and
might represent the result of ecological selective pressures.
Finally, the lower disparity of aquatic/marine taxa, together with the more restricted
morphospace occupation along both PC1 and PC2 axes, suggests that marine taxa are more
morphologically constrained, at least regarding some aspects of cranial shape variation. This
would be consistent with other phenotypic constraints possibly associated with an aquatic
lifestyle in crocodylomorphs, such as body size limits, as indicated by the shifts towards
larger body sizes that is more frequently detected at the bases of marine clades (Chapter 2).

Chapter 3: Crocodylomorph cranial shape disparity
123
3.5. Conclusions
In this Chapter, I assessed crocodylomorph cranial shape variation with 2D landmark-based
geometric morphometrics, using the most phylogenetically comprehensive dataset to date,
including 209 species. To do that, I combined a previously published dataset with newly
digitised specimens. After manually assessing the differences in the landmarks digitised by
multiple observers/operators, which could be causing a significant amount of interobserver
error, I was able to substantially reduce the error (from ~30% to ~1.5%), demonstrating the
importance of a standardised digitisation protocol.
Most of cranial shape variation of crocodylomorphs is related to changes in the snout,
in terms of both length and width. This is consistent with previous work and provides
additional evidence of a strong link between ecology and crocodylomorph cranial
morphology, since changes in snout length are likely related to feeding behaviour. Indeed, the
weak phylogenetic signal in the shape data, as well as the significantly different morphospace
occupied by distinct ecological categories (i.e., aquatic/marine, semi-aquatic/freshwater and
terrestrial groupings), further supports the hypothesis that ecological selective pressures could
be driving crocodylomorph cranial shape variation.
Disparity quantified between different crocodylomorph subgroups shows that the
species-rich and ecologically diverse clade Notosuchia exhibits the highest disparity, which is
also probably the greatest contributor to the peak in disparity seen in the Cretaceous, as well
as to the higher disparity seen among terrestrial forms (when compared to aquatic and semi-
aquatic species). Although less disparate, crocodylians also display substantial cranial shape
variability, mainly in snout lengths. Tighter morphological constraints seem to apply to
marine/aquatic crocodylomorphs, as these forms are more restricted in terms of morphospace
occupation.

Chapter 3: Crocodylomorph cranial shape disparity
124
Finally, perhaps most importantly, the results of this Chapter provide valuable
evidence that disparity-through-time analyses are highly sensitive to methodological
assumptions, since changes in the time sub-sampling method and in the phylogenetic
hypothesis used in these analyses had significant impacts on the results. Although previous
works have already acknowledged the importance of time sub-sampling, given the uneven
nature of the fossil record, it is demonstrated here that the use of different time-scaled trees
can also be a major cause of variability. Thus, future work quantifying disparity of long-lived
clades, especially those with substantial phylogenetic and stratigraphic uncertainties (such as
vertebrates), should ideally perform multiple analyses (with different time sub-sampling
methods, numbers of time intervals, phylogenetic hypotheses, ancestral states estimation
methods, and time-scaling methods), reporting shared patterns and treating incongruent
results with caution.

Chapter 4: Heterochrony in the cranial evolution of notosuchians
125
Chapter 4: Heterochrony in the cranial evolution of notosuchians
This chapter is a modified version of a paper already published in the journal Palaeontology,
with the following citation:
GODOY, P. L., FERREIRA, G. S., MONTEFELTRO, F. C., VILA NOVA, B. C., BUTLER,
R. J. and LANGER, M. C. 2018b. Evidence for heterochrony in the cranial evolution of
fossil crocodyliforms. Palaeontology, 61, 543–558.
During the development of this project, my collaboration involved leading all parts of the
research, including collecting the data, analysing it and interpreting the results, as well as
writing the manuscript. My colleagues collaborated by co-designing the project, collecting
part of the data, running some geometric morphometric analyses, providing feedback on
interpretation of results, and giving important comments on earlier versions of the manuscript
the manuscript.
4.1. Background
Heterochrony, the shifts in timing and rate of development, has been hypothesized to drive
major phenotypic modifications in many groups (Gould 1977; McKinney 1988; McNamara
and McKinney 2005; Bhullar et al. 2012; Koyabu et al. 2014). The identification of
heterochronic processes requires information about the ancestral condition and the
ontogenetic stage (age) of the studied organisms (Alberch et al. 1979; Shea 1983;
Klingenberg 1998). However, as well-preserved ontogenetic series and precise information on
absolute ages of individuals are rare for fossil vertebrates, palaeontologists have often used
relative size as a proxy for ontogenetic stage (Erickson et al. 2004; Schoch 2010; Ezcurra and

Chapter 4: Heterochrony in the cranial evolution of notosuchians
126
Butler 2015; Foth et al. 2016b). In this context, the recent discovery of a beautifully preserved
new specimen of the baurusuchid crocodylomorph Pissarrachampsa sera (Fig. 4.1),
noticeably smaller than the other specimens previously reported (Montefeltro et al. 2011),
provides the opportunity to investigate the role of ontogenetic changes in the evolution of one
of the most remarkable crocodylomorph groups, the notosuchians.
Notosuchia is the most diverse crocodylomorph group in the Cretaceous of Gondwana
(Turner and Sertich 2010; Godoy et al. 2014; Pol et al. 2014; Pol and Leardi 2015), showing
an extraordinary taxonomical and ecological diversity (Stubbs et al. 2013; Bronzati et al.
2015; Mannion et al. 2015). Additionally, as indicated by the results in Chapters 2 and 3 of
this thesis, notosuchians have a remarkable morphological disparity, which was likely driven
by ecological diversification and might have been the result of modes of evolution distinct to
that of most other crocodylomorphs.
Among the notosuchian subclades, baurusuchids are distinguished by their peculiar
anatomy, including a high and laterally compressed skull and blade-like ziphodont teeth.
These features have been used to infer an ecological role as land-dwelling hypercarnivores,
acting as apex predators in specific Gondwanan ecosystems in which theropod dinosaurs, the
dominant terrestrial predators throughout most of the Mesozoic, were scarce (Montefeltro et
al. 2011; Riff and Kellner 2011; Godoy et al. 2014; 2016). Despite the long history of
research on baurusuchids (Price 1945; Gasparini 1971), few studies have examined aspects of
their ontogeny, as juvenile specimens have been rarely reported and their preserved fossils are
mostly fragmentary (e.g., Carvalho et al. 2011). Likewise, although Crocodylomorpha is a
highly diverse and fossil-rich clade, studies identifying the role of heterochronic processes in
their evolutionary history are relatively rare and usually focused on extant crocodylians (e.g.,
Gignac and O'Brien 2016).
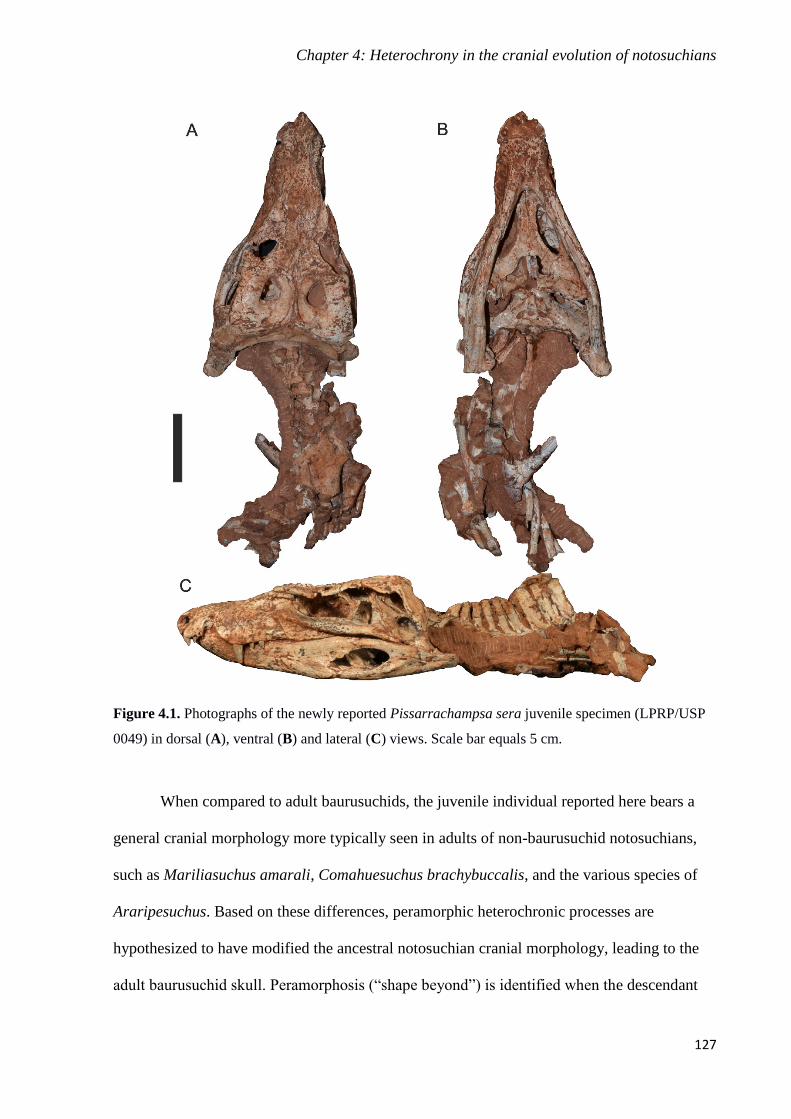
Chapter 4: Heterochrony in the cranial evolution of notosuchians
127
Figure 4.1. Photographs of the newly reported Pissarrachampsa sera juvenile specimen (LPRP/USP
0049) in dorsal (A), ventral (B) and lateral (C) views. Scale bar equals 5 cm.
When compared to adult baurusuchids, the juvenile individual reported here bears a
general cranial morphology more typically seen in adults of non-baurusuchid notosuchians,
such as Mariliasuchus amarali, Comahuesuchus brachybuccalis, and the various species of
Araripesuchus. Based on these differences, peramorphic heterochronic processes are
hypothesized to have modified the ancestral notosuchian cranial morphology, leading to the
adult baurusuchid skull. Peramorphosis (“shape beyond”) is identified when the descendant

Chapter 4: Heterochrony in the cranial evolution of notosuchians
128
development (size or shape) extends beyond that of the ancestor, producing exaggerated adult
traits (Alberch et al. 1979; Klingenberg 1998). Ancestral adult characters are therefore seen in
juveniles of the descendent. The opposite process is known as paedomorphosis, in which the
descendant retains at adult size the shape (or the characteristics) of the ancestral juvenile
(Alberch et al. 1979; Klingenberg 1998).
As previously documented (Erickson and Brochu 1999), large extant and extinct
crocodylomorphs have achieved larger bodies by extending the growth period, suggesting the
action of time hypermorphosis, a peramorphic process that leads to an increase in size.
Accordingly, the evolution of larger body sizes in baurusuchids may have been the result of
similar processes, but this hypothesis has not been previously examined. In this Chapter, the
new specimen of Pissarrachampsa sera is used to document heterochronic changes and
assess the action of peramorphic processes in the cranial evolution of Baurusuchidae.
4.1.1. Heterochrony terminology
It is important to clearly define the peramorphic processes used in the context of this Chapter,
as distinct heterochronic processes have been defined using different formalisms
(evolutionary versus developmental concepts, for example) in the past (Klingenberg 1998).
The definitions of the peramorphic processes used herein (Fig. 4.2) follow mainly the works
of Gould (1977), Alberch et al. (1979), Shea (1983), and Klingenberg (1998). Accordingly, it
is acknowledged that the effects of heterochrony on the phenotype may be realized on three
different and independent dimensions – shape of a given structure, body size, and age
(Klingenberg 1998). The variation of three parameters – rate of change (either of a structure
or the entire body), and times of onset and offset of growth (either of a structure or the entire
body) – can be used to describe the processes (Alberch et al. 1979; Klingenberg 1998).

Chapter 4: Heterochrony in the cranial evolution of notosuchians
129
Figure 4.2. Caption on next page.

Chapter 4: Heterochrony in the cranial evolution of notosuchians
130
Figure 4.2. A, Comparison between effects of time hypermorphosis, rate hypermorphosis and
acceleration on size (large arch), shape (small arch), and age (bottom bar) of ancestors (dotted
midline) and descendants (filled bars), using the clock model devised by Gould (1977). B,
Representation of morphological evolution and their relations to ontogenetic scaling (modified from
Strelin et al. 2016). Full black circle and line represent the ancestor and ancestral ontogenetic
trajectory, respectively. Dotted lines are descendant trajectories, and arrows are the deviations from
the ancestral ontogenetic trajectory. Circles I and II represent modifications not predicted and
modifications predicted by the ontogenetic scaling hypothesis, respectively. C, Pairwise comparison of
the effects of time hypermorphosis, rate hypermorphosis, acceleration, and predisplacement on size,
shape (trait) and ages, using hypothetical ontogenetic trajectories (lines), from the onset (square) to the
offset of growth (circles) of ancestors (full lines) and descendants (dashed lines). The effects of
predisplacement on size are not completely known and can potentially occur in two forms: size and
shape (trait) growth are coupled and both are “predisplaced” in time (age); (i.e. the onset in descendant
occurs earlier than in the ancestor), or size and trait growth are decoupled and predisplacement affects
only descendant’s shape, and size growth follows the same ancestral path.
_________________________________________________________________________________________________________________
Acceleration is identified when anatomical structures of the descendant develop faster
(increased rate) than the rest of the body, when compared to the ancestor. There is a break of
the ancestral allometry (size-shape relationship), so these changes are not ontogenetically
scaled (i.e., heterochronic changes do not maintain the ancestral allometric relationship).
There is no change of the times of onset and offset of growth. The outcome is a peramorphic
structure, in an individual with the same body size and an equivalent period of development
as the ancestor.
Hypermorphosis can be divided into two subtypes (Shea 1983). Time hypermorphosis,
is when the entire body of the descendant (including the studied part) develops for a longer
period than in the ancestor. The ancestral allometry is maintained, so the changes are
ontogenetically scaled. There is no change in the time of growth onset, but the offset is
delayed. The outcome is a peramorphic structure, in an individual with larger body size and a
longer period of development than the ancestor. By contrast, in rate hypermorphosis the entire

Chapter 4: Heterochrony in the cranial evolution of notosuchians
131
body of the descendant (including the studied part) develops faster than in the ancestor. The
ancestral allometry is maintained, so the changes are ontogenetically scaled. There is no
change in the times of onset and offset of growth. The outcome is a peramorphic structure, in
an individual with a larger body size and the same period of development as in the ancestor.
The distinction between rate and time hypermorphosis, introduced by Shea (1983), was not
part of the original classification of Alberch et al. (1979), and the use of the term rate
hypermorphosis has been criticized by some authors (e.g., Gould 2000). In any case, the
resulting morphology (i.e., the descendant’s morphology) is ontogenetically scaled in both
time and rate hypermorphosis.
Finally, predisplacement is when a structure of the descendant starts to develop earlier
than in the ancestor. This often leads to a break of the ancestral allometry, but not if the entire
body also starts developing earlier. The onset of growth is anticipated (at least that of the
structure), but the offset is maintained. The outcome is a peramorphic structure, in an
individual with the same body size and the same period of development as the ancestor or
with a larger body size and a longer period of development than the ancestor if the earlier
onset also affected the entire body.
4.2. Material and Methods
4.2.1. Systematic Palaeontology
CROCODYLIFORMES Benton and Clark 1988
MESOEUCROCODYLIA Whetstone and Whybrow 1983
BAURUSUCHIDAE Price 1945
PISSARRACHAMPSINAE Montefeltro et al. 2011
Pissarrachampsa sera Montefeltro et al. 2011

Chapter 4: Heterochrony in the cranial evolution of notosuchians
132
Holotype. LPRP/USP 0019; nearly complete skull and mandibles lacking the rostralmost
portion of the rostrum, seven dorsal vertebrae, partial forelimb, pelvic girdle, and hindlimbs
(Montefeltro et al. 2011; Godoy et al. 2016).
Newly referred specimen. LPRP/USP 0049; a juvenile individual comprised of a complete
skull with lower jaws, articulated neck/trunk vertebrae and partial right scapula and forelimb
(Fig. 4.1).
Locality. Inhaúmas-Arantes Farm, Gurinhatã, Minas Gerais state, Brazil (Martinelli and
Teixeira 2105).
Age and horizon. Adamantina Formation, Bauru Group, Bauru Basin; Late Cretaceous,
Campanian–Maastrichtian (Marsola et al. 2016; Batezelli 2017).
Diagnosis. The new specimen LPRP/USP 0049 was identified as Pissarrachampsa sera based
on the presence of the following combination of features, unique to that taxon (Montefeltro et
al. 2011; Godoy et al. 2016): a longitudinal depression on the rostral portion of frontal;
frontal longitudinal ridge extending rostrally beyond the frontal midlength; supratemporal
fenestra with equally developed medial and rostral rims; lacrimal duct positioned at the
angular junction between the dorsal and lateral surfaces of the lacrimal; well-developed
rounded foramen between the anterior and posterior palpebrals; quadratojugal and jugal do
not form a continuous ventral border (a notch is present due to the ventral displacement of the
quadratojugal); four subtympanic foramina (sensu Montefeltro et al. 2016) visible laterally; a

Chapter 4: Heterochrony in the cranial evolution of notosuchians
133
single ventral parachoanal fenestra and one ventral parachoanal fossa (divided into medial and
lateral parachoanal subfossae); lateral Eustachian foramina larger than the medial one; a deep
depression on the caudodorsal surface of the pterygoid wings; complete absence of
postcranial osteoderms.
4.2.2. Sampling and data collection
To test if the cranial modifications seen in Baurusuchidae were generated by heterochronic
processes, the cranial disparity of Notosuchia was assessed using 2D geometric morphometric
analyses of general skull shape. The specimens/species sampling took into account the
phylogenetic positions within Notosuchia of the species and the preservation of the
specimens. Only fairly complete skulls, for which most of the landmarks could be readily
identified and digitized, were sampled. Specimens too deformed or lacking important parts of
the skull were not included. However, to maximise the sample size, specimens in which only
a small portion of the skull was missing (e.g., the rostralmost tip of the snout) and specimens
that were only slightly deformed were also included. In these cases, closely related taxa were
used to project the landmark positions during the digitization.
As a result, 38 specimens were sampled, from a total of 27 taxa across Notosuchia,
including four juvenile specimens: the baurusuchids Pissarrachampsa sera and
Campinasuchus dinizi, as well as Anatosuchus minor and Mariliasuchus amarali (see
Appendix E for further information on the sampled specimens). To obtain more detailed
interpretations of skull shape variation, both lateral and dorsal views were used for the
analyses (Openshaw et al. 2016), with 19 and 17 landmarks respectively (Fig. 4.3; see
Appendix E for further information on the landmarks). Landmarks were digitized using the
software tpsDig 2.22 (Rohlf 2015). Landmarks were digitised on both right and left sides of

Chapter 4: Heterochrony in the cranial evolution of notosuchians
134
the skulls, choosing the side that offered the best conditions for digitization (considering
either preservation or quality of photographs). Then, the reflected shape of the specimens that
were digitized on the right side was extracted while performing the Procrustes fit in MorphoJ.
To minimize error, landmarks were collected twice for each specimen (by a single person),
and the subsequent analyses employed the average coordinates from the two digitizations of
each specimen.
Figure 4.3. Example, using one specimen (Araripesuchus wegeneri, MNN GAD19), of the position
of the landmarks for the geometric morphometrics analyses in this Chapter. A, dorsal view. B, lateral
view.

Chapter 4: Heterochrony in the cranial evolution of notosuchians
135
4.2.3. Phylogenetic framework
Notosuchia is a group of mesoeucrocodylians that has been consistently supported as
monophyletic, even though its exact taxonomic content may vary in different phylogenetic
hypotheses (e.g., Turner and Sertich 2010; Andrade et al. 2011; Bronzati et al. 2012;
Montefeltro et al. 2013; Pol et al. 2014; Sertich and O’Connor 2014; Turner 2015; Wilberg
2015). The placement of Baurusuchidae deeply nested within Notosuchia is supported even
by studies that have highly distinct taxonomic and character samples (Montefeltro et al. 2013;
Pol et al. 2014; Turner 2015; Martin and de Lapparent de Broin 2016; Meunier and Larsson
2017), but uncertainties remain regarding the nearest relatives of baurusuchids. The
morphological similarities with Sebecidae, a group of Cenozoic terrestrial crocodylomorphs,
have led many phylogenetic studies to cluster Baurusuchidae and Sebecidae into
Sebecosuchia (Turner and Sertich 2010; Kellner et al. 2014; Pol et al. 2014). Alternative
positions placed Baurusuchidae closer to other Cretaceous notosuchians, such as
Sphagesauridae, with Sebecidae placed closer to other groups such as Peirosauridae and
Mahajangasuchidae (Sereno and Larson 2009; Montefeltro et al. 2013; Wilberg 2015;
Meunier and Larsson 2017). It is almost universally agreed, however, that baurusuchids are
not very closely related to a set of mostly small-bodied notosuchians, such as Mariliasuchus,
Araripesuchus, Notosuchus, and Uruguaysuchus (Kellner et al. 2014; Pol et al. 2014; Leardi
et al. 2015a, b; Martin and de Lapparent de Broin 2016).
The phylogenetic hypothesis proposed by Montefeltro et al. (2013) was selected as the
primary phylogenetic framework for the geometric morphometric analyses (Fig. 4.4A). Four
additional taxa were added to the original topology of Montefeltro et al. (2013), for which
morphometric data was available: Aplestosuchus sordidus, Campinasuchus dinizi,
Candidodon itapecuruensis, and Pakasuchus kapilimai. The information from Godoy et al.

Chapter 4: Heterochrony in the cranial evolution of notosuchians
136
(2014) was employed to define the phylogenetic position of the first two taxa, and from Pol et
al. (2014) for the latter two. Following this phylogenetic framework, the sampled specimens
were divided into four different taxonomic groups, which was necessary to test the hypothesis
of peramorphosis in baurusuchid evolution: “Baurusuchidae”, “Sphagesauridae”,
“Peirosauridae + Sebecidae”, and the remaining notosuchians falling outside of these groups
(clustered here as “other notosuchians”). As Sebecus icaeorhinus was the only representative
of Sebecidae included, it was combined with peirosaurids into a single group for the analyses.
Figure 4.3. A, Phylogenetic hypothesis of the Notosuchia taxa included in our geometric
morphometric analyses (based on Montefeltro et al. 2013), with clades Baurusuchidae,
Sphagesauridae, and Peirosauridae/Sebecidae indicated, and other notosuchians distributed along the
tree. The skulls of some notosuchians (not to scale) were selected to illustrate the cranial disparity of
the group (clockwise, from the top left): adult Araripesuchus wegeneri, adult Mariliasuchus amarali,
juvenile Pissarrachampsa sera¸ and an undescribed adult baurusuchid (LPRP/USP 0697). B,
Morphological transformation during Pissarrachampsa sera ontogeny, shown by the results of the thin
plate spline analysis with the juvenile (top) and adult (bottom) specimens, also illustrating the position
of the landmarks (in lateral view).

Chapter 4: Heterochrony in the cranial evolution of notosuchians
137
In order to test the robustness of the results to changes in phylogenetic hypotheses, the
sampled specimens were also divided to fit an alternative phylogenetic framework. For this,
the topology of Pol et al. (2014) was selected, as the data matrix presented in this work has
formed the basis of many subsequent phylogenetic analyses of notosuchians (e.g., Leardi et
al. 2015a, b; Godoy et al. 2016). As a result, the specimens were reallocated within three
alternative taxonomic groups: “Sebecosuchia” (baurusuchids + Sebecus icaeorhinus),
“Uruguaysuchidae + Peirosauridae” (Araripesuchus species, Uruguaysuchus and Anatosuchus
in Uruguaysuchidae + peirosaurids) and “other notosuchians” (all remaining species,
including sphagesaurids).
4.2.4. Geometric morphometric analyses
To extract shape information from both lateral and dorsal view datasets, a Procrustes fit with
reflection was applied using the software MorphoJ 1.06e (Klingenberg 2011), and also
obtained centroid size, to be used in subsequent analyses as a proxy for size. Next, to visualize
the skull shape transformations during the postnatal ontogeny of Pissarrachampsa sera, a thin
plate spline was performed (Bookstein 1991), using the lateral view dataset of both the
juvenile and adult specimens of this taxon. This procedure was conducted using geomorph
package (Adams and Otárola-Castillo 2013) in R (R Core Team 2017), and shape variation
(the position of the Procrustes coordinates) of the adult against the juvenile was plotted in a
deformation grid. Then, a principal component analyses (PCA) was conducted in MorphoJ, to
investigate the morphospace occupied by the sampled taxa. For these comparisons, the
specimens were divided into taxonomic groups using both phylogenetic frameworks outlined
above. The position of individual specimens within the morphospace will not change using

Chapter 4: Heterochrony in the cranial evolution of notosuchians
138
alternative phylogenetic frameworks (i.e., the only difference should be in the morphospace
occupation by the different taxonomic groups). Furthermore, the topology of Montefeltro et
al. (2013) was mapped onto centroid size (using only the lateral view dataset) to explore the
size differences among the sampled taxa.
Subsequently, a set of analyses was performed to assess which specific heterochronic
processes could be driving baurusuchid cranial evolution. Peramorphic changes in the shape
of structures can be decoupled from (acceleration) or accompanied by (hypermorphosis and
predisplacement) changes in size (Gould 1977; Alberch et al. 1979; Shea 1983; Klingenberg
1998). To explore this relationship, a size-correction was employed to both datasets to test
whether the shape differences remained after removing the effect of allometric changes
(Gould 1966; Revell 2009; Klingenberg 2016). Using MorphoJ, the residuals of a multivariate
regression of the Procrustes coordinates against centroid size were obtained (Monteiro 1999;
Klingenberg et al. 2012; Klingenberg 2016). For this, a subset restricted to adult specimens
was used, as only interspecific size variation was being analysed. The residuals from this
regression were then used as the input for a second PCA to explore the occupied morphospace
after removing the effect of size on the observed variation. As for the first PCA, the
specimens were also divided into taxonomic groups using both the primary and alternative
phylogenetic frameworks. Non-parametric multivariate analysis of variance (npMANOVA)
was used to test the significance of the differences in the distributions of groups in the
morphospace. These tests were performed in PAST (Hammer et al. 2001), using the PC
scores that represent at least 95 per cent of shape variation. These scores were then
transformed into a Euclidean distance matrix (Euclidean similarity index), and permuted with
10,000 replications. Comparisons were made using Bonferroni correction for adjusted p-
values. Additionally, the topology based on the hypothesis of Montefeltro et al. (2013) was

Chapter 4: Heterochrony in the cranial evolution of notosuchians
139
projected onto the PC scores (using both dorsal and lateral view datasets), creating a
phylomorphospace to explore the evolutionary history of shape changes in the sampled taxa.
To evaluate the specific action of time hypermorphosis, the methodology described by
Strelin et al. (2016) was applied, to test whether the shape modifications seen in the
baurusuchid skull evolved by ontogenetic scaling. Time hypermorphosis corresponds to an
extension of the ancestral ontogenetic trajectory, a pattern previously detected in other
crocodylomorphs known to extend the growth period and attain larger body sizes (e.g.,
Erickson and Brochu 1999). As such, based on whether the differences among taxa remain or
not after this procedure, hypermorphosis could be either rejected or confirmed as the sole
peramorphic process acting on baurusuchid skull evolution, as this is the only process that
extends the ontogenetic trajectory in time.
For this, skull size and shape variation from juvenile to adult baurusuchids was
compared to those changes seen along the ontogenetic trajectory of a hypothetical ancestral
notosuchian. The ancestral ontogenetic trajectory was inferred via a phylogenetic approach
based on outgroup taxa to Baurusuchidae (i.e., using trajectories of other notosuchians as
proxies for estimating this ancestral condition). Good proxies would, ideally, fulfil two
requirements: (1) have at least one juvenile specimen, as well as at least one adult specimen,
both with skulls sufficiently well-preserved to be sampled for the geometric morphometric
analyses; (2) be unequivocally non-baurusuchid notosuchians (with their positions relative to
baurusuchids supported by alternative phylogenetic hypotheses), as the aim was an
ontogenetic trajectory of a hypothetical notosuchian ancestor that was at least outside
Baurusuchidae. Preferably, this approach would incorporate information from as many
species as possible. However, only two non-baurusuchid notosuchians satisfy the first
requirement: Mariliasuchus amarali and Anatosuchus minor. Among the six Mariliasuchus

Chapter 4: Heterochrony in the cranial evolution of notosuchians
140
amarali specimens sampled for the geometric morphometric analyses, one (the holotype,
UFRJ DG 50-R) is clearly a juvenile (Carvalho and Bertini 2009). The second species,
Anatosuchus minor, has two specimens sampled, and its holotype (MNN GAD603) is a
putative juvenile, due to its smaller size (Sereno and Larsson 2009). Although using only two
taxa is not ideal, the phylogenetic positions of these two species relative to baurusuchids
support their use as the best available proxies for the ancestral condition of baurusuchids (see
Martinelli 2003; Sereno et al. 2003; Pol et al. 2009; Sereno and Larsson 2009; Turner and
Sertich 2010; Andrade et al. 2011; Pol et al. 2012; Montefeltro et al. 2013; Kellner et al.
2014; Pol et al. 2014; Sertich and O’Connor 2014; Leardi et al. 2015a, b; Godoy et al. 2016;
Meunier and Larsson 2017).
Accordingly, an ontogenetic regression model was created for both Mariliasuchus
amarali and Anatosuchus minor, using all sampled specimens of these species (including
juveniles), by regressing the Procrustes coordinates against the log-transformed centroid size
in MorphoJ (Klingenberg 2011; Strelin et al. 2016). This ontogenetic regression model was
used to perform an allometric size-correction (referred here as the “ancestral ontogenetic
allometry correction”) for all other taxa in the datasets (Strelin et al. 2016). Regression
residuals were calculated in MorphoJ, by using the vector of regression coefficients for the
ontogenetic allometry estimated for the two taxa and applying them to the shape data. This
process removes the potential effect of ontogenetic scaling from the variation among taxa.
These residuals were then used as the input data for a third PCA, again including only adults,
to explore the morphospace occupied after removing the effect of the ancestral ontogenetic
allometry trajectory from the landmark data. As for the first and second PCA, morphospace
occupation was investigated using both primary and alternative phylogenetic frameworks. As
also done following the size-correction, npMANOVA was used to test the significance of the

Chapter 4: Heterochrony in the cranial evolution of notosuchians
141
differences between groups and created phylomorphospaces, by projecting the topology of
Montefeltro et al. (2013) onto the PC scores.
Finally, it is worth noting that the use of Anatosuchus minor as a proxy for the
ancestral ontogenetic trajectory should be treated with caution. The holotype specimen of
Anatosuchus minor, which has been interpreted as a juvenile, is not much smaller than the
only other known specimen of this taxon, which has been interpreted as an adult. Moreover,
this taxon also exhibits a cranial morphology notably distinct from those of other
notosuchians (Sereno et al. 2003; Sereno and Larsson 2009). Accordingly, as a sensitivity
test, the ancestral ontogenetic trajectory was also estimated without including Anatosuchus
minor, instead performing the ancestral ontogenetic allometry correction using only the
Mariliasuchus amarali specimens.
4.3. Results
The thin plate spline shows that the cranial changes observed during the ontogeny of
Pissarrachampsa sera include an expansion of the rostrum (both rostrocaudally and
dorsoventrally), a rostrocaudal shortening of the skull roof (orbitotemporal region), and the
reduction of the relative size of the orbits and the lower temporal fenestrae (Fig. 4.4B).
Furthermore, based on the primary phylogenetic framework (Montefeltro et al. 2013), the first
PCA shows that juvenile and adult baurusuchids occupy different regions of the
morphospace. In both the lateral (PC1 accounting for 60.6per cent of the variation, PC2 = 9.9
per cent) and dorsal views (PC1 = 57.9 per cent, PC2 = 11.3 per cent), juvenile baurusuchids
fall outside the morphospace of adult baurusuchids, but within the morphospace occupied by
non-baurusuchid notosuchians. By contrast, when compared to juveniles, adult baurusuchids
occupy a distinct part of the morphospace, mainly displaced along the PC1 axis for the lateral

Chapter 4: Heterochrony in the cranial evolution of notosuchians
142
view dataset (Fig. 4.5A), and along both PC1 and PC2 axes for the dorsal view dataset (see
Appendix E for information on additional results). A similar pattern of morphospace
occupation was found when the alternative phylogenetic framework (Pol et al. 2014) was
used, with the sampled taxa rearranged into different groups. In both lateral and dorsal views
(Appendix E) juvenile sebecosuchians (the group that includes baurusuchids) are displaced in
relation to the morphospace occupied by adults.
Figure 4.5. A, Two-dimensional morphospace (PCA results plot) of the first two PCs of the lateral
view dataset, with deformation grids for hypothetical extremes along the two axes. The coloured
polygons show the morphospace occupation by each of the four groups considered in this study.
Crosses represent juvenile specimens, squares, stars, hexagons and circles represent adults of
Baurusuchidae, Sphagesauridae, Peirosauridae/Sebecidae and other notosuchians, respectively
(average values were used for taxa with more than one adult specimen sampled). The arrows represent
an ontogenetic trajectory along this two-dimensional morphospace. B, Topology based on the
phylogenetic hypothesis of Montefeltro et al. (2013) projected onto the log-transformed centroid size.
The centroid size was obtained from the lateral view dataset using only adults. Silhouettes from Godoy
et al. (2014).

Chapter 4: Heterochrony in the cranial evolution of notosuchians
143
The allometric regression of the Procrustes coordinates against log-transformed
centroid size shows that changes related to size differences accounted for 36.4 and 40.5 per
cent of the variation in the dorsal and lateral view datasets, respectively (see Appendix E for
more information about this allometric regression, as well as additional results). The second
PCA, with size-corrected data, shows that size variation strongly influences morphospace
occupation of the different lineages, in both lateral and dorsal views (Fig. 4.6A and B). For
the primary phylogenetic framework (Montefeltro et al. 2013), the confidence ellipses (90 per
cent) for baurusuchids, sphagesaurids, and even peirosaurids/sebecids overlapped with the
confidence ellipse of other notosuchians (see Appendix E for additional results). The absence
of significant differences in the distribution of these groups was supported by the
npMANOVA test (Table 4.1), showing that changes in size can explain the apparent
separation of groups found in the previous analyses (first PC plots). Additionally, when the
alternative phylogenetic framework (Pol et al. 2014) was taken into account through
rearranging the specimens into different taxonomic groups (see above), very similar results
were found. The npMANOVA results also indicate that the morphospaces of sebecosuchians
(i.e., baurusuchids) and other notosuchians are not significantly different, in both dorsal and
lateral views (see Appendix E for additional npMANOVA results).

Chapter 4: Heterochrony in the cranial evolution of notosuchians
144
Figure 4.6. Two-dimensional morphospace (plot of PCA results) after the size-correction (A, dorsal
view; B, lateral view) and after the ancestral ontogenetic allometry correction (C, dorsal view; D,
lateral view). Average values were used for taxa with more than one adult specimen sampled. The 90
per cent confidence ellipses were added for each of the four groups considered in the other analyses:
Peirosauridae/Sebecidae (hexagons), Baurusuchidae (circles), Sphagesauridae (stars), and other
notosuchians (squares).
Finally, the ancestral ontogenetic trajectory was estimated by using the ontogenetic
trajectories of Mariliasuchus amarali and Anatosuchus minor as proxies. First, to assure that
the ontogenetic trajectories of these two species (representing the ancestral condition) differ
from that of Pissarrachampsa sera (representing the baurusuchid trajectory), the
reconstructed trajectories of these three taxa were compared with a regression analysis. As
expected, the trajectories of these three species are clearly displaced in relation to one another

Chapter 4: Heterochrony in the cranial evolution of notosuchians
145
(Fig. 4.7). However, in dorsal view, whereas the trajectories of Mariliasuchus amarali and
Pissarrachampsa sera exhibit a similar slope, that of Anatosuchus minor is clearly different.
This might indicate that the use of Anatosuchus minor for reconstructing the ancestral
ontogenetic trajectory should be treated with caution, given its unique cranial morphology
among Notosuchia (see above).
Table 4.1. Pairwise comparison between morphospace occupation of different taxonomic groups.
Bonferroni-corrected p-values obtained from npMANOVA, using PC scores of all specimens after
both size and ancestral ontogenetic allometry corrections, with lateral and dorsal view datasets.
Taxonomic groups based on the phylogenetic framework from Montefeltro et al. (2013). Significant
differences are indicated by an asterisk.
Pairwise comparisons
p-values
Size correction “Ontogenetic”
correction
Dorsal
view
Lateral
view
Dorsal
view
Lateral
view
Baurusuchidae – other notosuchians 1 0.9923 0.0126* 0.064
Baurusuchidae – Peirosauridae/Sebecidae 0.1122 0.008* 0.267 0.019*
Baurusuchidae – Sphagesauridae 1 0.048* 0.1416 0.048*
Peirosauridae/Sebecidae – other notosuchians 1 1 0.0138* 0.0138*
Peirosauridae/Sebecidae – Sphagesauridae 0.3732 0.0402* 0.1836 0.0402*
Sphagesauridae – other notosuchians 1 0.1668 0.0126* 0.1944
The distinction between those ontogenetic trajectories (that of the hypothetical
ancestor, represented by Mariliasuchus and Anatosuchus, and that of baurusuchids,
Chapter 4: Heterochrony in the cranial evolution of notosuchians
146
represented by Pissarrachampsa) allowed us to progress further with the ancestral
ontogenetic allometry correction (i.e., removing the effect of ontogenetic scaling from the
data). The results of the third PCA, after this correction, employing the primary phylogenetic
framework (Montefeltro et al. 2013), are apparently conflicting. Using the lateral view
dataset, the morphospaces occupied by adult baurusuchids and other notosuchians overlap and
are not significantly separated (Fig. 4.6D; Table 4.1), suggesting that the shape variation
observed in baurusuchids could be ontogenetically scaled. However, the dorsal dataset shows
a different result, with baurusuchid and other notosuchian morphospaces significantly
separated (Fig. 4.6C, Table 4.1). Furthermore, when using the alternative phylogenetic
framework (Pol et al. 2014), the morphospaces of sebecosuchians (i.e., baurusuchids) and
other notosuchians is significantly separated, in both dorsal and lateral views (Appendix E).
Finally, to test the influence of the ontogenetic trajectory of Anatosuchus minor on these
results (given its unique morphology, see above), an ancestral ontogenetic allometry
correction was applied using only Mariliasuchus amarali for estimating the ancestral
trajectory. The results, in both dorsal and lateral views, show the morphospaces of
baurusuchids and other notosuchians to be significantly separated (Appendix E).

Chapter 4: Heterochrony in the cranial evolution of notosuchians
147
Figure 4.7. Comparisons between the ontogenetic trajectories of Mariliasuchus amarali and
Anatosuchus minor (used as proxies for the ancestral ontogenetic trajectory) and that of
Pissarrachampsa sera (representing the baurusuchid condition), based on regression analyses of
Procrustes coordinates against log-transformed centroid size, in both dorsal (A) and lateral (B) views.
Squares and circles represent juveniles and adults, respectively.
4.4. Discussion
4.4.1. Peramorphosis in Baurusuchidae
The results of the initial analyses (first PCA and thin plate spline) show that adult
baurusuchids occupy distinct morphospaces in comparison to juveniles, even when using
different phylogenetic frameworks (Appendix E). This could indicate that juvenile

Chapter 4: Heterochrony in the cranial evolution of notosuchians
148
baurusuchids bear a more generalized notosuchian morphotype (since they occupy the
morphospace associated to other notosuchians), whereas adults diverge from this morphotype
in later ontogenetic stages, supporting the hypothesis of peramorphic processes operating in
the evolution of notosuchians. However, given that only one juvenile baurusuchid specimen
was included in the lateral view dataset, while only two juvenile specimens were used in the
dorsal view, these results should be taken with caution. Only new discoveries of juvenile
specimens would provide us with information to clarify if other baurusuchids have similar
ontogenetic trajectories.
Nevertheless, our results allow us to describe the cranial transformations during
Pissarrachampsa sera ontogeny, which can serve as a reference for other baurusuchids.
According to our results, during their ontogeny baurusuchids seem to expand their rostrum
(both rostrocaudally and dorsoventrally), shorten their skull roof rostrocaudally, and reduce
the relative sizes of the orbits and the lower temporal fenestrae, differences that can be
observed on the deformation grid of the thin plate spline (Fig. 4.3B). The first PCA
corroborates these ontogenetic transformations. In lateral view (Fig. 4.5A), the PC1 axis, from
negative to positive values, represents relative rostrocaudal shortening of the rostrum as well
as relative enlargement of the orbit, and the PC2 axis displays changes in skull height (higher
skulls represented by more negative values). Adult baurusuchids are all located on the
negative side of the PC1 axis, whereas the juvenile Pissarrachampsa sera is positioned in a
positive region along this axis, illustrating the rostrocaudal expansion of the rostrum during
the ontogeny of this taxon. Other modifications can be observed in the dorsal view
morphospace (Appendix E), in which the PC1 axis also represents rostrocaudal shortening of
the rostrum (as in lateral view). The PC2 axis accounts for the mediolateral compression of

Chapter 4: Heterochrony in the cranial evolution of notosuchians
149
the skull (from negative to positive values), and illustrates the mediolateral compression of
the skull that occurs during the ontogeny of Pissarrachampsa.
Studies using geometric morphometric methods to investigate the ontogenetic
trajectories of extant crocodylians (e.g., Piras et al. 2010; Watanabe and Slice 2014; Foth et
al. 2017a) suggest similarities between the morphological modifications during the ontogeny
of Pissarrachampsa sera and the ontogenies of living taxa. For example, the best documented
transformation is the relative reduction of the orbits, also found in living representatives of the
three main lineages of Crocodylia: Gavialoidea, Crocodyloidea and Alligatoroidea (e.g., Piras
et al. 2010; Foth et al. 2015; 2017a). Other common modifications previously reported
include the mediolateral compression of the rostrum, although in Caiman latirostris the
opposite process is observed (i.e., snouts relatively broader later in ontogeny; Bona and
Desojo 2011; Foth et al. 2017a). Nevertheless, quantitative investigations of possible
heterochronic processes acting on the evolution of crocodylomorphs are rare (e.g., Gignac and
O'Brien 2016), and the present work represents the first attempt to verify the action of
heterochrony in fossil lineages of the group using geometric morphometric methods.
However, given the lack of juveniles of other baurusuchids with complete skulls,
further assumptions cannot be quantitatively tested. For example, it is difficult to determine
the phylogenetic distribution of cranial peramorphism within Baurusuchidae (i.e., asserting
whether the action of peramorphic processes started at the base of Baurusuchidae or later
within the lineage). The size and phylogenetic positions of Cynodontosuchus rothi and
Gondwanasuchus scabrosus suggest that the peramorphic changes occurred just prior or
within the clade composed of Pissarrachampsinae + Baurusuchinae (Godoy et al. 2014).
These two early-diverging species, known from fragmentary remains, have been suggested to
be adults, but are substantially smaller than other baurusuchids (estimated as approximately

Chapter 4: Heterochrony in the cranial evolution of notosuchians
150
50 per cent the size of an adult Pissarrachampsa sera; Montefeltro et al. 2011; Godoy et al.
2014).
4.4.2. Acceleration, predisplacement or hypermorphosis
Among the known peramorphic processes (i.e., acceleration, predisplacement, and
hypermorphosis; Fig. 4.2; Gould 1977; Alberch et al. 1979; Shea 1983; Klingenberg 1998),
acceleration is the only one that does not affect total body size (i.e., based on the definition
used here, shape and size are not coupled; Fig. 4.2A) (Klingenberg 1998). The results show
that the apparent separation between baurusuchids and other notosuchians seen in the first
PCA disappears after applying the size-correction (Fig. 4.6A and B), suggesting a strong
correlation between cranial shape and size (centroid size) variation in baurusuchids.
Therefore, according to these results, acceleration cannot, as a sole process, explain the shape
changes observed in the baurusuchid skull.
Further examination aimed to assess if hypermorphosis could explain the shape
variation seen in baurusuchid cranial morphology, by testing the ontogenetic scaling
hypothesis. The ontogenetic scaling hypothesis predicts that heterochronic changes can occur
by maintaining the ancestral allometric relationships, generating a descendant morphology via
proportional changes in size and shape that follow the same ancestral ontogenetic pathway
(Fig. 4.2B) (Shea 1983; Klingenberg 1998; Strelin et al. 2016). Based on the definitions used
here, hypermorphosis is the peramorphic process that incorporates the concept of ontogenetic
scaling, either by increasing the duration of ontogeny (time hypermorphosis) or by increasing
the rate of size and shape changes during the same period of growth (rate hypermorphosis)
(Fig. 4.2A and C; Shea 1983). Accordingly, in both time and rate hypermorphosis the shape
variation is ontogenetically scaled.

Chapter 4: Heterochrony in the cranial evolution of notosuchians
151
As such, if the data fit the predictions of the ontogenetic scaling model, after removing
the effects of the ancestral ontogenetic allometry the confidence ellipses of baurusuchids
should collapse to the same morphospace as other notosuchians. This should be true for all
shape variation observed in the sampled specimens, in both lateral and dorsal views.
Accordingly, the results do not corroborate the ontogenetic scaling hypothesis, since the
apparently ontogenetically scaled shape variation seen in lateral view (Fig. 4.6D) is not
congruent with the results for the dorsal view or for the other analyses performed. In dorsal
view (Fig. 4.6C), the morphospaces of baurusuchids and other notosuchians remain separate
after the ancestral ontogenetic allometry correction (significantly separated, as confirmed by
the npMANOVA tests; Table 4.1), which indicates that the shape variation is not
ontogenetically scaled. This also highlights the importance of using different views when
studying skull shape and interpreting their evolutionary patterns (Openshaw et al. 2016).
Furthermore, when a different phylogenetic framework was used, which essentially
rearranged the sampled species into different taxonomic groups (see above), the
morphospaces of sebecosuchians (which includes baurusuchids) and other notosuchians
remain significantly separated (Appendix E). The same is observed when the Anatosuchus
minor specimens were removed from the ancestral ontogenetic trajectory estimation
(Appendix E). These complementary results corroborate the idea that the cranial shape
variation observed in baurusuchids is not ontogenetically scaled.
Nevertheless, as highlighted before, the small number of juvenile specimens included
in these analyses, particularly when estimating the ancestral trajectory, can be problematic.
Only two species were used for inferring the ancestral state, with only one juvenile specimen
each, making the analyses more susceptible to abnormalities derived from taphonomic
Chapter 4: Heterochrony in the cranial evolution of notosuchians
152
deformations, for example. As in the case of the transformations during baurusuchid
ontogeny, only new specimens can corroborate or reject the results found here.
Even though the results should be interpreted carefully, the lack of support for the
ontogenetic scaling hypothesis found here indicates that neither time nor rate hypermorphosis
could be considered as the single, isolated driver of baurusuchid peramorphism (Shea 1983;
Strelin et al. 2016). Accordingly, the only process that acting alone could possibly explain the
peramorphism observed in baurusuchids is predisplacement, in which the onset age of growth
of a structure occurs earlier than in the ancestor (Alberch et al. 1979; McNamara 1986) (Fig.
4.2C). However, changes in the time of onset can only be comprehensively assessed by
comparing changes in traits (shape) as a function of ontogenetic stages (age) (Klingenberg
1998). As such, at present, it is not possible to confirm the role of predisplacement in the
evolution of the baurusuchid skull. Indeed, information such as growth rates and time of onset
and offset would be necessary to precisely identify the action of any specific heterochronic
process, not only predisplacement. Histological studies comparing growth patterns among
different notosuchians have the potential to test whether the onset of baurusuchid traits
occurred earlier than in their close relatives (e.g., Cubo et al. 2017), which would allow
further investigation on the action of peramorphic processes on the evolution of this group.
Moreover, the action of a single evolutionary process on morphological structures is expected
to be rare (Alberch et al. 1979; Klingenberg 1998) and one should expect a combination of
two (or more) heterochronic processes acting in the evolution of such complex traits
(Klingenberg 1998). Accordingly, as these results are derived from indirect investigation of
the action of heterochrony, they only allow us to discard acceleration and hypermorphosis
acting in isolation in the cranial evolution of baurusuchids.

Chapter 4: Heterochrony in the cranial evolution of notosuchians
153
4.4.3. Heterochrony explains hypercarnivory
Hypercarnivores, as defined by Van Valkenburgh (1991), are taxa that consume at least 70
per cent of vertebrate flesh. They frequently have a specialized dentition, such as the
ziphodont teeth of baurusuchids (Riff and Kellner 2011), in which the primary function is
slicing. The documentation presented here of peramorphosis in the evolution of the
baurusuchid skull provides important palaeoecological insights, as it supports a strong relation
between the reported cranial modifications and size, changes that might have occurred
together with the shift to a hypercarnivorous habit. A link between size increase and the
evolution of hypercarnivory has been previously documented in other vertebrate lineages,
such as carnivoran and creodont mammals (Werdelin 1996; Van Valkenburgh 1999; Van
Valkenburgh et al. 2004; Wesley-Hunt 2005). Furthermore, heterochrony is commonly
associated with evolutionary trends leading to size increase (McNamara 1982; 1990), and one
of the possible triggers of these trends is the positive pressure caused by competition (Van
Valkenburgh et al. 2004; McKinney 1990b).
Theropod dinosaurs, the top predators of most terrestrial environments in the
Mesozoic, are scarce in the Adamantina Formation, from which the greatest diversity of
baurusuchids has been recovered (Méndez et al. 2012; Godoy et al. 2014). Thus, the large
size of baurusuchids (Chapter 2), coupled with their cranial specializations, could have
granted access to new feeding resources (Erickson et al. 2012), efficiently occupying the
niches more commonly filled by theropods elsewhere. Baurusuchids coexisted and interacted
with other crocodylomorph taxa in Gondwanan palaeoecosystems during the Late Cretaceous,
including carnivorous forms such as peirosaurids (Carvalho et al. 2007; Barrios et al. 2016).
Interestingly, the coeval notosuchians (including baurusuchids) are inferred to have filled a
broad range of feeding habits (herbivorous, omnivorous, and carnivorous), with a high degree

Chapter 4: Heterochrony in the cranial evolution of notosuchians
154
of niche/resource partitioning (O'Connor et al. 2010; Stubbs et al. 2013; Ősi 2014). In this
context, the peramorphic size increase of baurusuchids may have played a key role in this
niche partitioning, and may also have influenced other aspects of their unique palaeobiology.
The life history strategy hypothesized for baurusuchids, and notosuchians in general, includes
a shift to the K-selected end of the r/K selection spectrum. The shift is suggested by the
consistently smaller egg clutches present in notosuchians, including Pissarrachampsa sera
(2–5 eggs per clutch; Marsola et al. 2016) when compared to fossil neosuchians, such as
atoposaurids and dyrosaurids (approximately 12 eggs per clutch; Russo et al. 2014; Srivastava
et al. 2015). The smaller egg clutches of notosuchians (and baurusuchids) is also dissimilar to
those of extant crocodylians, in which the number of eggs varies from a lower limit of 10 and
reaches up to 80 eggs (Brazaitis and Watanabe 2011; Marsola et al. 2016). The features of K-
selected organisms are commonly associated with hypermorphosis, primarily because this
process is classically related to size increase. Even though the results of the geometric
morphometric analyses performed in this Chapter do not support the action of
hypermorphosis as the single process in the cranial evolution of baurusuchids,
predisplacement can also lead to size increase (Fig. 4.2C), and it may similarly be linked to
the evolution of K-selection strategies.
4.5. Conclusions
In this Chapter, it is demonstrated that changes in the skull shape of baurusuchids, likely
accompanied by highly specialized cranial modifications, were strongly linked to size
increase in the lineage. As these shape changes occurred through their ontogeny, they provide
evidence for the action of heterochronic processes (peramorphosis) in the shift to a
hypercarnivorous diet during baurusuchid evolutionary history. These are interesting

Chapter 4: Heterochrony in the cranial evolution of notosuchians
155
advances in the knowledge of the underlying processes that drove notosuchian evolution, and
provide important clues for understanding the exceptional diversity displayed by this peculiar
group of crocodylomorphs.

Chapter 5: Summary and perspectives
156
Chapter 5: Summary and perspectives
5.1. General conclusions
This thesis employed a phylogenetic comparative approach to quantitatively and
comprehensively investigate body size and cranial shape variation in Crocodylomorpha.
Given the fundamental nature of these two aspects of animal morphology in evolutionary
biology, the results presented here represent an important contribution to current knowledge
of the groups’ phenotypic evolution over the last ~220 million years.
In Chapter 2, model-fitting analyses used to investigate the modes of evolution that
gave rise to the body size patterns during the group’s evolutionary history provided
overwhelmingly strong support for a multi-peak Ornstein-Uhlenbeck model (SURFACE).
This indicates that the macroevolutionary dynamics of crocodylomorph body size evolution
are better described within the concept of an adaptive landscape, with most body size
variation emerging after shifts to new adaptive zones, which are represented by the
macroevolutionary body size regimes. These results do not support, for example, the
hypothesis of Cope's rule (i.e., a consistent evolutionary trend towards larger sizes based on
Brownian motion dynamics) in crocodylomorphs.
Consistently, long-term crocodylomorph body size patterns (i.e., of maximum and
mean body size values, as well as body size disparity) could not be fully explained by the
abiotic factors tested here (i.e., palaeolatitude and palaeotemperature). Thus, on large
phylogenetic scales, shifts between macroevolutionary regimes (representing lineage-specific
innovations) are more important than isolated climatic factors. At more refined scales,
however, body size variation may track changes in climate, as in the case of crocodylians, in
which a global cooling event might explain the long-term increases in body size (as a result of
Chapter 5: Summary and perspectives
157
systematic reduction of available habits/niches, with differential extinction of smaller-bodied
species).
In particular, the evolution of a more aquatic lifestyle (especially marine) correlates, in
several clades, with increases in average body size, though not without exceptions. This is
reflected in the shifts leading to larger body sizes that are more frequently detected at the base
of predominantly aquatic or semi-aquatic groups, and suggests a link between ecological
diversification and body size evolution in crocodylomorphs.
Indeed, ecology also seems to play an important role in determining cranial shape
variation in crocodylomorphs, as indicated by the results of Chapters 3 and 4. Comprehensive
investigation of cranial shape variation and disparity (Chapter 3) corroborates previous work
in that most of it is related to changes in the dimensions of the crocodylomorph snout, in
terms of both length and width. Given the tight relationship between snout morphology and
feeding behaviour, strong ecological selective pressures are expected, suggesting that ecology
may be driving most of the variability. This is supported by the relatively weak phylogenetic
signal found in the shape data. Additionally, when subdivided into distinct lifestyle
categories, crocodylomorphs occupy significantly different morphospaces, which further
emphasises the association between crocodylomorph cranial shape variation and ecological
specializations.
Among the crocodylomorph subgroups assessed, the highest cranial shape disparity
was found among notosuchians, a group known for its species richness, but also for a
remarkable variety of feeding strategies, including omnivorous, hypercarnivorous and even
herbivorous diets. This higher disparity could be the result of more relaxed modes of
evolution in the group, as suggested by the investigation of body size evolution performed
exclusively within notosuchians (Chapter 2).

Chapter 5: Summary and perspectives
158
Finally, one of the processes that might have underpinned the cranial evolution of
notosuchians is investigated in Chapter 4. The results demonstrated that the changes observed
in the cranial shape of baurusuchids, a group of top-predator notosuchians, were linked to a
size increase in the lineage, providing evidence for the action of heterochronic processes
(peramorphosis). In this case, heterochrony would be related to the shift to a hypercarnivorous
diet, possibly accompanied by highly specialized cranial modifications, reinforcing the
importance of ecological selective pressures in determining phenotypic changes during
crocodylomorph evolutionary history.
5.2. Prospects and future work
Chapter 2 of this thesis represents the first comprehensive investigation of the modes of
evolution underlying crocodylomorph body size through the entire history of the group.
Accordingly, the results presented here can pave the way for new studies, addressing more
specific questions (e.g., association between larger sizes and aquatic lifestyle; correlation
between body size and other biotic and abiotic factors) or testing the impact of different
approaches (e.g., distinct proxies for body size or direct estimates of body mass; increases in
taxon sample size; changes in the phylogenetic hypotheses).
Chapters 3 and 4 represent attempts to more deeply understand the patterns of cranial
shape variation in crocodylomorphs. For instance, allometric changes can be assessed by
testing the correlation between size and shape, and similar methodological approaches to that
used in Chapter 4 can be used to investigate the presence of heterochrony in other
crocodylomorph subgroups. Chapter 3 sheds light on the importance of methodological
assumptions when estimating disparity through time, and future work will likely explore the
impact of other differences (e.g., the use of distinct methods for time-scaling the trees), as
Chapter 5: Summary and perspectives
159
well as trying to clarify patterns that are currently ambiguous (e.g., evidence for either
disparity increase or disparity decline from the Eocene onwards). Additionally, with the most
comprehensive landmark dataset available for the group, other questions can be addressed.
For example, the presence of integrated components in morphometric data can be tested by
setting a priori defined modules (i.e., specific regions of the skull, such as the snout). Rates of
morphological evolution can be also calculated, and a model fitting-approach could be used
for investigating the modes of evolution underlying cranial shape variation in the group.
Furthermore, patterns of cranial shape disparity through time can be compared to other
evolutionary patterns (e.g., species diversity, body size disparity, and morphological disparity
measured from discrete characters), as well as tested for correlations with abiotic
environmental factors. Finally, unequal morphological diversification in different
crocodylomorph groups can be investigated using the phylomorphospace approach proposed
by Sidlauskas (2008), assessing, for example, if the unique morphological disparity seen in
notosuchians significantly deviates from that expected for other crocodylomorphs.

Appendices
160
Appendices
Appendix A: Supplementary information for Chapter 2
The supplementary material for Chapter 2 (“Crocodylomorph body size evolution”) was
uploaded to the online repository Zenodo (Godoy et al. 2018c) and can be found at:
https://zenodo.org/record/1344593. The online content includes three documents (Additional
files 1, 2, and 3) and four subfolders (Additional files 4, 5, 6, and 7), which are detailed
below:
- Additional file 1: Supplementary methods and results, including information on (1)
total length estimation from cranial measurements, (2) supertree construction, (3) time
bins used for time series correlations and disparity calculation, and (4) regression
results tables of all correlation analyses performed.
- Additional file 2: Datasets with information on crocodylomorph body size (cranial
measurements), palaeolatitude, specimens and lifestyle.
- Additional file 3: AICc scores of all models fitted in our macroevolutionary analyses.
- Additional file 4: Folder containing all plots of SURFACE model fits.
- Additional file 5: Folder containing cross plotting of all SURFACE model fits, using
distinct time-scaling methods.
- Additional file 6: Folder containing alternative crocodylomorph trees and FAD (First
Appearance Datum) and LAD (Last Appearance Datum) of all species used in our
analyses.
- Additional file 7: Folder containing R functions and data for running an example script
of our model-fitting analyses.

Appendices
161
Appendix B: List of specimens sampled for the geometric morphometric analyses of
Chapter 3
Species Specimen number Source Lifestyle (source)
Acynodon adriaticus MCSNT 57248 Wilberg (2017) semi-aquatic
(PBDB)
Acynodon iberoccitanus ACAP-FX1 Wilberg (2017) semi-aquatic
(PBDB)
Agaresuchus fontisensis HUE-02502 Narváez et al. (2016) semi-aquatic
(PBDB)
Agaresuchus subjuniperus MPZ 2012/288 Puértolas-Pascual et al. (2014) semi-aquatic
(PBDB)
Albertochampsa langstoni SMM P67 15 3 Wilberg (2017) semi-aquatic
(PBDB)
Alligator mcgrewi FMNH P 26242 Wilberg (2017) semi-aquatic
(PBDB)
Alligator mefferdi AMNH 7016 Wilberg (2017) semi-aquatic
(PBDB)
Alligator mississippiensis UF 10941 Wilberg (2017) semi-aquatic
(extant taxon)
Alligator olseni reconstruction White (1942) semi-aquatic
(PBDB)
Alligator prenasalis YPM-PU 14063 Wilberg (2017) semi-aquatic
(PBDB)
Alligator sinensis IVPP 1342 Wilberg (2017) semi-aquatic
(extant taxon)
Alligator thomsoni AMNH 1736 Wilberg (2017) semi-aquatic
(PBDB)
Allodaposuchus precedens reconstruction Wilberg (2017) semi-aquatic
(PBDB)
Allognathosuchus haupti HLMD-Me 1435 First-hand examination semi-aquatic
(PBDB)
Amphicotylus gilmorei OMNH 2322 Wilberg (2017) semi-aquatic
(PBDB)
Amphicotylus lucasii CM 1339 Wilberg (2017) semi-aquatic
(PBDB)
Anatosuchus minor MNN GAD603 Wilberg (2017) terrestrial (PBDB)
Anteophthalmosuchus hooleyi IRSNB R47 Martin et al. (2016) semi-aquatic
(PBDB)

Appendices
162
Anthracosuchus balrogus UF/IGM 67 Hastings et al. (2015) marine (Mannion
et al. 2015)
Aplestosuchus sordidus LPRP/USP 0229a First-hand examination terrestrial (PBDB)
Araripesuchus gomesii reconstruction Hecht (1991) terrestrial (PBDB)
Araripesuchus patagonicus reconstruction Wilberg (2017) terrestrial (PBDB)
Araripesuchus tsangatsangana FMNH PR 2297 First-hand examination terrestrial (PBDB)
Araripesuchus wegeneri MNN GAD 19 Wilberg (2017) terrestrial (PBDB)
Arenysuchus gascabadiolorum MPZ ELI-1 Puértolas-Pascual et al. (2011) semi-aquatic
(PBDB)
Argochampsa krebsi reconstruction Wilberg (2017) marine (Mannion
et al. 2015)
Armadillosuchus arrudai UFRJ DG 303-R Marinho and Carvalho (2009) terrestrial (PBDB)
Asiatosuchus germanicus GM XIV 4757-a Wilberg (2017) semi-aquatic
(PBDB)
Atlantosuchus coupatezi reconstruction Wilberg (2017) marine (Mannion
et al. 2015)
Australosuchus clarkae reconstruction Wilberg (2017) semi-aquatic
(PBDB)
Baurusuchus salgadoensis MPMA 62-0001-02 First-hand examination terrestrial (PBDB)
Bernissartia fagesii IRSNB R46 Wilberg (2017) semi-aquatic
(PBDB)
Borealosuchus acutidentatus NMC 8544 Wilberg (2017) semi-aquatic
(PBDB)
Borealosuchus formidabilis SMM P75.22.29 Wilberg (2017) semi-aquatic
(PBDB)
Borealosuchus sternbergii MOR 701 Wilberg (2017) semi-aquatic
(PBDB)
Borealosuchus wilsoni FMNH PR 1647 Wilberg (2017) semi-aquatic
(PBDB)
Boverisuchus magnifrons GM XVIII 3094 Brochu (2012) semi-aquatic
(PBDB)
Boverisuchus vorax FMNH PR 399 Wilberg (2017) semi-aquatic
(PBDB)
Brachychampsa montana UCMP 133901 Wilberg (2017) semi-aquatic
(PBDB)
Brachyuranochampsa eversolei AMNH 4993 Wilberg (2017) semi-aquatic
(PBDB)
Caiman crocodilus apaporiensis FMNH 69823 Wilberg (2017) semi-aquatic
(extant taxon)
Caiman crocodilus chiapasius FMNH 73739 Wilberg (2017) semi-aquatic
(extant taxon)

Appendices
163
Caiman crocodilus fuscus FMNH 69852 Wilberg (2017) semi-aquatic
(extant taxon)
Caiman latirostris MACN 1232 7.021 Wilberg (2017) semi-aquatic
(extant taxon)
Caiman yacare MLP 9147 Wilberg (2017) semi-aquatic
(extant taxon)
Caipirasuchus montealtensis MPMA 68-0003-12 First-hand examination terrestrial (PBDB)
Caipirasuchus paulistanus MPMA 67-0001-00 First-hand examination terrestrial (PBDB)
Caipirasuchus stenognathus MZSP-PV 139 Pol et al. (2014) terrestrial (PBDB)
Candidodon itapecuruense UFRJ DG 114-R Photos from other researchers terrestrial (PBDB)
Ceratosuchus burdoshi FMNH P 15576 First-hand examination semi-aquatic
(PBDB)
Cerrejonisuchus improcerus UF/IGM 29 Hastings et al. (2010) marine (Mannion
et al. 2015)
Chalawan thailandicus CAS42-20 Martin et al. (2014) semi-aquatic
(PBDB)
Chenanisuchus lateroculi reconstruction Wilberg (2017) marine (Mannion
et al. 2015)
Comahuesuchus brachybuccalis reconstruction Wilberg (2017) terrestrial (PBDB)
Cricosaurus araucanensis MLP 72-IV-7-1 Parrilla-Bel et al. (2013) marine (Mannion
et al. 2015)
Cricosaurus lithographicus MOZ-PV 5787 Herrera et al. (2013) marine (Mannion
et al. 2015)
Crocodylus acer AMNH 1240 Wilberg (2017) semi-aquatic
(PBDB)
Crocodylus acutus TMM m-6040 Wilberg (2017) semi-aquatic
(extant taxon)
Crocodylus affinis YPM 1345 Wilberg (2017) semi-aquatic
(PBDB)
Crocodylus depressifrons IRSNB R251 Wilberg (2017) semi-aquatic
(PBDB)
Crocodylus intermedius FMNH 75659 Wilberg (2017) semi-aquatic
(extant taxon)
Crocodylus johnstoni USNM 064091 Wilberg (2017) semi-aquatic
(extant taxon)
Crocodylus megarhinus AMNH 5061 Wilberg (2017) semi-aquatic
(PBDB)
Crocodylus mindorensis FMNH 19891 Wilberg (2017) semi-aquatic
(extant taxon)
Crocodylus moreletii TMM m-4980 Wilberg (2017) semi-aquatic
(extant taxon)

Appendices
164
Crocodylus niloticus TMM m-1786 Wilberg (2017) semi-aquatic
(extant taxon)
Crocodylus novaeguinea FMNH 2854 Wilberg (2017) semi-aquatic
(extant taxon)
Crocodylus palaeindicus NHMUK 39795 First-hand examination semi-aquatic
(PBDB)
Crocodylus palustris AMNH 96134 Wilberg (2017) semi-aquatic
(extant taxon)
Crocodylus porosus AMNH 29949 Wilberg (2017) semi-aquatic
(extant taxon)
Crocodylus rhombifer AMNH 6179 Wilberg (2017) semi-aquatic
(extant taxon)
Crocodylus siamensis AMNH (unknown
no.) Wilberg (2017)
semi-aquatic
(extant taxon)
Dakosaurus andiniensis MOZ 6146P Wilberg (2017) marine (Mannion
et al. 2015)
Dibothrosuchus elaphros IVPP V7907 First-hand examination terrestrial (PBDB)
Diplocynodon darwini IRSNB R 0412 Wilberg (2017) semi-aquatic
(PBDB)
Diplocynodon deponiae HLMD-Be 147 First-hand examination semi-aquatic
(PBDB)
Diplocynodon hantoniensis AMNH 27632 Wilberg (2017) semi-aquatic
(PBDB)
Diplocynodon ratelii MNHN.F SG 13728 a
b First-hand examination
semi-aquatic
(PBDB)
Dollosuchoides densmorei IRSNB 1748 Wilberg (2017) semi-aquatic
(PBDB)
Dromicosuchus grallator UNC 15574 Sues et al. (2003) terrestrial (PBDB)
Dyrosaurus maghribensis reconstruction Wilberg (2017) marine (Mannion
et al. 2015)
Dyrosaurus phosphaticus OUMNH KX.15904 First-hand examination marine (Mannion
et al. 2015)
Elosuchus cherifiensis MNHN.R MRS 340–
25 First-hand examination
semi-aquatic
(PBDB)
Eogavialis africanus YPM 6263 Wilberg (2017) marine (Mannion
et al. 2015)
Eoneustes bathonicus unnumbered specimen Mercier (1933) marine (Mannion
et al. 2015)
Eosuchus lerichei IRSNB R 48 Wilberg (2017) marine (Mannion
et al. 2015)
Eosuchus minor USNM V 299730 First-hand examination marine (Mannion
et al. 2015)

Appendices
165
Eothoracosaurus mississippiensis MSU 3293 Wilberg (2017) marine (Mannion
et al. 2015)
Euthecodon arambourgi MNHN ZEL 001 Wilberg (2017) semi-aquatic
(PBDB)
Euthecodon brumpti KNM-ER 1773 Wilberg (2017) semi-aquatic
(PBDB)
Eutretauranosuchus delfsi BYU 17628 Wilberg (2017) semi-aquatic
(PBDB)
Fruitachampsa callisoni LACM 120455a Clark (2011) terrestrial (PBDB)
Gavialis gangeticus NHMUK unnumbered Wilberg (2017) semi-aquatic
(extant taxon)
Gavialosuchus americana BHI 126440 Wilberg (2017) marine (Mannion
et al. 2015)
Gavialosuchus eggenburgensis KM F/1358 Wilberg (2017) marine (Mannion
et al. 2015)
Geosaurus grandis BSPG AS-VI-1 Young and Andrade (2009) marine (Mannion
et al. 2015)
Gobiosuchus kielanae reconstruction Wilberg (2017) terrestrial (PBDB)
Goniopholis baryglyphaeus reconstruction Wilberg (2017) semi-aquatic
(PBDB)
Goniopholis kiplingi DORCM 12154 Andrade et al. (2011) semi-aquatic
(PBDB)
Goniopholis simus NHMUK R 41098 Wilberg (2017) semi-aquatic
(PBDB)
Gracilineustes leedsi NHMUK PV R3015 Wilberg (2017) marine (Mannion
et al. 2015)
Gryposuchus pachakamue reconstruction Salas-Gismondi et al. (2016) semi-aquatic
(PBDB)
Guarinisuchus munizi DG-CTG-UFPE 5723 Wilberg (2017) marine (Mannion
et al. 2015)
Hamadasuchus rebouli ROM 52620 Photos from other researchers terrestrial (PBDB)
Hemiprotosuchus leali PVL 3829 First-hand examination terrestrial (PBDB)
Hesperosuchus agilis CM 29894 Clark et al. (2000) terrestrial (PBDB)
Hsisosuchus chungkingensis cast of CNM V 1090 First-hand examination semi-aquatic
(PBDB)
Hsisosuchus dashanpuensis ZDM 3405 Gao (2001) semi-aquatic
(PBDB)
Hyposaurus rogersii reconstruction Wilberg (2017) marine (Mannion
et al. 2015)
Iharkutosuchus makadii MTM 2006.52.1 Wilberg (2017) semi-aquatic
(PBDB)

Appendices
166
Ikanogavialis gameroi MCNC unnumbered Photos from other researchers marine (Mannion
et al. 2015)
Isisfordia duncani reconstruction Salisbury et al. (2000) semi-aquatic
(PBDB)
Junggarsuchus sloani IVPP V14010 First-hand examination terrestrial (PBDB)
Kambara implexidens QM F29662 Wilberg (2017) semi-aquatic
(PBDB)
Kaprosuchus saharicus MNN IGU12 Wilberg (2017) terrestrial (PBDB)
Knoetschkesuchus guimarotae reconstruction Wilberg (2017) semi-aquatic
(PBDB)
Knoetschkesuchus langenbergensis DFMMh/FV 200 Schwarz et al. (2017) semi-aquatic
(PBDB)
Leidyosuchus canadensis ROM 1903 Wilberg (2017) semi-aquatic
(PBDB)
Libycosuchus brevirostris BSPG 1912 VIII 574 Wilberg (2017) terrestrial (PBDB)
Litargosuchus leptorhynchus BP/1/5237 Clark and Sues (2002) terrestrial (PBDB)
Lomasuchus palpebrosus MOZ 4084 PV Gasparini et al. (1991) terrestrial (PBDB)
Lorosuchus nodosus PVL 6219 First-hand examination
semi-aquatic
(Kellner et al.
2014)
Machimosaurus buffetauti SMNS 91415 Martin and Vincent (2013) marine (Mannion
et al. 2015)
Machimosaurus hugii reconstruction Krebs (1967) marine (Mannion
et al. 2015)
Machimosaurus mosae BHN2R 1100 Young et al. (2014) marine (Mannion
et al. 2015)
Malawisuchus mwakasyungutiensis Mal-49 Gomani (1997) terrestrial (PBDB)
Maledictosuchus riclaensis MPZ 2001/130a Parrilla-Bel et al. (2013) marine (Mannion
et al. 2015)
Maomingosuchus petrolica DM-F0001 Shan et al. (2017) semi-aquatic
(PBDB)
Mariliasuchus amarali UFRJ-106R Wilberg (2017) terrestrial (PBDB)
Maroccosuchus zennaroi UF unnumbered Wilberg (2017) marine (Mannion
et al. 2015)
Mecistops cataphractus AMNH 10075 Wilberg (2017) semi-aquatic
(extant taxon)
Melanosuchus fisheri MCNC 243 Medina (1976) semi-aquatic
(PBDB)
Melanosuchus niger UF 53600 Wilberg (2017) semi-aquatic
(extant taxon)
metriorhynchus brachyrhynchus NHMUK R3804 Wilberg (2017) marine (Mannion
et al. 2015)

Appendices
167
metriorhynchus brachyrhynchus NHMUK PV R3699 Wilberg (2017) marine (Mannion
et al. 2015)
metriorhynchus casamiquelai MGHF 1-08573 Wilberg (2017) marine (Mannion
et al. 2015)
Metriorhynchus geoffroyii OUMNH J.29823 Grange and Benton (1996) marine (Mannion
et al. 2015)
Metriorhynchus superciliosus NHMUK PV R6860 Wilberg (2017) marine (Mannion
et al. 2015)
Metriorhynchus superciliosus NHMUK PV R6859 Wilberg (2017) marine (Mannion
et al. 2015)
Montealtosuchus arrudacamposi MPMA 16-0007-04 First-hand examination terrestrial (PBDB)
Mourasuchus amazonensis DGM 526-R Wilberg (2017) semi-aquatic
(PBDB)
Nannosuchus gracilidens NHMUK 48217 First-hand examination semi-aquatic
(PBDB)
Notosuchus terrestris MACN-PV RN 1037 Wilberg (2017) terrestrial (PBDB)
Oceanosuchus boecensis MHNH 9036 Wilberg (2017)
marine (Mannion
et al. 2015)
Orthogenysuchus olseni AMNH 5178 Wilberg (2017)
semi-aquatic
(PBDB)
Orthosuchus stormbergi SAM-PK-K409 Wilberg (2017) terrestrial (PBDB)
Osteolaemus osborni AMNH 10082 Wilberg (2017)
semi-aquatic
(extant taxon)
Osteolaemus tetraspis FMNH 98936 Wilberg (2017)
semi-aquatic
(extant taxon)
Pakasuchus kapilimai RRBP 08631 O’Connor et al. (2010) terrestrial (PBDB)
Paleosuchus palpebrosus YPM R 11407 Wilberg (2017) semi-aquatic
(extant taxon)
Paleosuchus trigonatus AMNH R-58136 Photos from other researchers semi-aquatic
(extant taxon)
Paralligator gradilifrons PIN 554-1
Turner (2015) semi-aquatic
(PBDB)
Paralligator major PIN 3726/501
Turner (2015) semi-aquatic
(PBDB)
Peipehsuchus teleorhinus IVPP V10098 First-hand examination marine (Mannion
et al. 2015)
Pelagosaurus typus BRLSI M 1413
Wilberg (2017) marine (Mannion
et al. 2015)
Pholidosaurus purbeckensis reconstruction
Wilberg (2017) semi-aquatic
(PBDB)
Pietraroiasuchus ormezzanoi Specimen PC-2 Buscalioni et al. (2011) semi-aquatic
(PBDB)

Appendices
168
Piscogavialis jugaliperforatus SMNK PAL 1282
First-hand examination marine (Mannion
et al. 2015)
Planocrania datangensis IVPP V5016
First-hand examination semi-aquatic
(PBDB)
Platysuchus multicrobiculatus SMNS 9930
First-hand examination marine (Mannion
et al. 2015)
Procaimanoidea kayi CM 9600
Wilberg (2017) semi-aquatic
(PBDB)
Prodiplocynodon langi AMNH 108
Wilberg (2017) semi-aquatic
(PBDB)
Protosuchus haughtoni BP/1/4770 Gow (2000) terrestrial (PBDB)
Protosuchus richardsoni reconstruction Wilberg (2017) terrestrial (PBDB)
Pseudhesperosuchus jachaleri PVL 3830 First-hand examination terrestrial (PBDB)
Purranisaurus potens MJCM PV 2060 Herrera et al. (2015) marine (Mannion
et al. 2015)
Purussaurus brasiliensis UFAC 1403 Wilberg (2017) semi-aquatic
(PBDB)
Purussaurus mirandae UNEFM-CIAAP-
1369 Aguilera et al. (2006)
semi-aquatic
(PBDB)
Purussaurus neivensis reconstruction
Wilberg (2017) semi-aquatic
(PBDB)
Rhabdognathus keiniensis reconstruction
Wilberg (2017) marine (Mannion
et al. 2015)
Rhacheosaurus gracilis NHMUK PV R3948
Parrilla-Bel et al. (2013) marine (Mannion
et al. 2015)
Rimasuchus lloydi NHMUK R 14145
Wilberg (2017) semi-aquatic
(PBDB)
Rugosuchus nonganensis IGV 33 Wilberg (2017) semi-aquatic
(PBDB)
Sarcosuchus imperator MNN 604
Wilberg (2017) semi-aquatic
(PBDB)
Sebecus icaeorhinus reconstruction Wilberg (2017) terrestrial (PBDB)
Shantungosuchus brachycephalus IVPP V4020 First-hand examination terrestrial (PBDB)
Siamosuchus phuphokensis reconstruction Wilberg (2017) semi-aquatic
(PBDB)
Sichuanosuchus shuhanensis IVPP V10594 First-hand examination terrestrial (PBDB)
Simosuchus clarki UA 8679 Wilberg (2017) terrestrial (PBDB)
Siquisiquesuchus venezuelensis MBLUZ-P-5050 Brochu and Rincón (2004) marine (Mannion
et al. 2015)
Sokotosuchus ianwilsoni reconstruction Wilberg (2017) marine (Mannion
et al. 2015)

Appendices
169
Sphagesaurus huenei cast of MACN-PV
19037 First-hand examination
terrestrial (PBDB)
Sphenosuchus acutus reconstruction Walker (1990) terrestrial (PBDB)
Stangerochampsa mccabei RTMP.86.61.1 Wilberg (2017)
semi-aquatic
(PBDB)
Steneosaurus bollensis MNHN.F 1885-28 Wilberg (2017)
marine (Mannion
et al. 2015)
Steneosaurus edwardsi NHMUK PV R2865 Wilberg (2017)
marine (Mannion
et al. 2015)
Steneosaurus gracilirostris NHMUK PV R15500 Wilberg (2017)
marine (Mannion
et al. 2015)
Steneosaurus leedsi NHMUK PV R3320 Wilberg (2017)
marine (Mannion
et al. 2015)
Steneosaurus leedsi NHMUK PV R3806 Wilberg (2017)
marine (Mannion
et al. 2015)
Steneosaurus megistorhynchus OUMNH J.29850 First-hand examination marine (Mannion
et al. 2015)
Stolokrosuchus lapparenti MNN GDF 600 Wilberg (2017) terrestrial (PBDB)
Stratiotosuchus maxhechti DGM 1477-R First-hand examination terrestrial (PBDB)
Suchodus durobrivensis NHMUK PV R2618 Wilberg (2017) marine (Mannion
et al. 2015)
Susisuchus anatoceps SMNK PAL 3804 First-hand examination semi-aquatic
(PBDB)
Teleidosaurus calvadosii cast of NHMUK PV
R 2681 Wilberg (2017)
marine (Mannion
et al. 2015)
Teleosaurus cadomensis reconstruction Wilberg (2017)
marine (Mannion
et al. 2015)
Terminonaris browni AMNH 5851 Wilberg (2017)
marine (Mannion
et al. 2015)
Terminonaris robusta AMNH 5850 Wilberg (2017)
marine (Mannion
et al. 2015)
Terrestrisuchus gracilis reconstruction Crush (1984) terrestrial (PBDB)
Thecachampsa antiqua USNM 25243 Wilberg (2017) marine (Mannion
et al. 2015)
Thecachampsa carolinensis ChM PV 4279 Erickson and Sawyer (1996) marine (Mannion
et al. 2015)
thoracosaurus macrorhynchus LO 3076T Wilberg (2017) marine (Mannion
et al. 2015)
Tomistoma schlegelii RMBR unnumbered Wilberg (2017) semi-aquatic
(extant taxon)
Torvoneustes carpenteri reconstruction Wilkinson et al. (2008)
marine (Mannion
et al. 2015)

Appendices
170
Toyotamaphimeia machikanensis MOUF00001 Kobayashi et al. (2006)
semi-aquatic
(PBDB)
Tsoabichi greenriverensis SMNK PAL 2334
cast First-hand examination
semi-aquatic
(PBDB)
Tyrannoneustes lythrodectikos PETMG:R176 Foffa and Young (2014)
marine (Mannion
et al. 2015)
Uberabasuchus terrificus CPP 0630* Wilberg (2017) terrestrial (PBDB)
Vectisuchus leptognathus reconstruction Wilberg (2017)
semi-aquatic
(PBDB)
Voay robustus NHMUK R 36685 Wilberg (2017)
semi-aquatic
(PBDB)
Wannaganosuchus brachymans SMM P76.28.247* Wilberg (2017)
semi-aquatic
(PBDB)
Yacarerani boliviensis MNK-PAL 5063* Novas et al. (2009) terrestrial (PBDB)

Appendices
171
Appendix C: Example R script of the geometric morphometric analyses performed in
Chapter 3
###########################################################################
#Crocodylomorpha cranial shape variation and disparity
#Example script
#set work directory#
setwd("C:/R/9 - GM Crocs")
#load required packages
library(geomorph)
library(phytools)
library(paleotree)
library(dispRity)
library(RVAideMemoire)
###########################################################################
#loading landmark data for geometric morphometric analyses
#reads the .tps file with landmark data:
landmark_data <- readland.tps(file = "GM_Crocs.tps", specID="ID",
readcurves = TRUE)
#reads classifier (for groups):
classifiers <- read.table(file = "Classifiers.txt", header = T)
#sorting taxa for matching order of classifiers
taxa <- dimnames(landmark_data)
taxa <- taxa[[3]]
order_taxa <- match(classifiers$ID,taxa)
which(is.na(order_taxa)) #looking for NAs
landmark_data <- landmark_data[,,order_taxa]
#reads semi-landmark curve
semi_landmarks <- read.csv("curveslide.csv")

Appendices
172
#performs GPA onto landmark data
landmarks_aligned <- gpagen(landmark_data, curves = semi_landmarks,
surfaces = NULL, PrinAxes = TRUE, max.iter = NULL, ProcD = F, Proj = TRUE,
print.progress = TRUE)
#performs PCA and plots morphospace (PC1 vs PC2) with tip labels
PCA_crocs <- plotTangentSpace(landmarks_aligned$coords, label =
names(landmarks_aligned$Csize))
###########################################################################
#estimating interobserver error in shape data
#converting data to "geomorph data frame" format
#different groups represent different observer/operator during landmarks
digitisation
#information about observer/operator has to be in the classifiers file
gdf <- geomorph.data.frame(shape = landmarks_aligned$coords, groups =
classifiers$observer)
#performs Procrustes ANOVA
ANOVA_test <- procD.lm(shape ~ groups, data = gdf, iter=999)
#calculates the percentage of variation explained by interobserver error
interobserver_error <- (ANOVA_test$SS[1]/ANOVA_test$SS[3])*100
interobserver_error
###########################################################################
#Burnaby's back-projection method (BBPM) or orthogonal projection method
#using PC2 as a proxy for measurement error
#calculating L (the orthogonal subspace)
f1 <- as.numeric(PCA_crocs$pc.scores[,2])
names(f1) <- names(landmarks_aligned$Csize)
I <- diag(1,209)
L <- I-f1 %*% ginv(t(f1) %*% f1) %*% t(f1)
#transforming landmark data into a two-dimensional array
landmark_data_2D <- two.d.array(landmark_data)
landmark_data_2D <- t(landmark_data_2D) #transpose

Appendices
173
#projecting landmarks to orthogonal subspace
corrected_landmark_data <- landmark_data_2D %*% L
corrected_landmark_data <- t(corrected_landmark_data) #transpose
#back to three-dimensional array (64 landmarks and 2 dimensions)
corrected_landmark_data <- arrayspecs(corrected_landmark_data,64,2)
#performs GPA onto corrected landmark data
corrected_landmarks_aligned <- gpagen(corrected_landmark_data, curves =
semi_landmarks, surfaces = NULL, PrinAxes = TRUE, max.iter = NULL, ProcD =
F, Proj = TRUE, print.progress = TRUE)
#performs PCA
PCA_crocs_corrected <- plotTangentSpace(corrected_landmarks_aligned$coords,
label = names(corrected_landmarks_aligned$Csize))
###########################################################################
#estimating ancestral states for phylomorphospace
#loads crocodylomorph tree
tree <- read.tree("croc_tree.tre")
#reads the age data (FADs and LADs)
ages <- read.table("croc_ages.txt", header=T)
#rownames as taxa names
rownames(ages) <- ages$taxa
ages <- ages[,-1]
#times-scaling the tree using the "mbl" method
#generates 20 randomly resolved time-scaled trees
ttrees <- timePaleoPhy(tree, ages, type="mbl", randres=T, vartime=1,
ntrees=20, dateTreatment="minMax")
#dropping taxa from trees for which I do not have landmark data
for (i in 1: length(ttrees)) {
ttrees[[i]] <- drop.tip (ttrees[[i]],
ttrees[[i]]$tip.label[!(ttrees[[i]]$tip.label %in%
unlist(dimnames(landmarks_aligned$coords)[3]))])}

Appendices
174
#sorting taxa for matching order of trees' tip labels
taxa2 <- ttrees[[1]]$tip.label
order_taxa2 <- match(taxa2, classifiers$ID)
which(is.na(order_taxa2)) #looking for NAs
classifiers <- classifiers[order_taxa2,]
landmark_data <- landmark_data[,,order_taxa2]
#performs GPA onto landmark data
landmarks_aligned <- gpagen(landmark_data, curves = semi_landmarks,
surfaces = NULL, PrinAxes = TRUE, max.iter = NULL, ProcD = F, Proj = TRUE,
print.progress = TRUE)
#performs PCA and plots morphospace (PC1 vs PC2) with tip labels
PCA_crocs <- plotTangentSpace(landmarks_aligned$coords, label =
names(landmarks_aligned$Csize))
#estimates ancestral states and plots phylomorphospace using one time-
scaled tree
PhyloMorphoSpace <- plotGMPhyloMorphoSpace(ttrees[[1]],
landmarks_aligned$coords, tip.labels=F, node.labels=F)
#estimating phylogenetic signal (Kmult) of shape data
phylo_signal <- physignal(landmarks_aligned$coords, ttrees[[1]],iter=999)
###########################################################################
#disparity analyses
#gets Principal Components (PC) scores from landmark data previously
subjected to GPA
PC_scores <- geomorph.ordination(landmarks_aligned)
#gets PC scores for ancestors (from previous ancestral states estimation)
ancestral_states_array <- arrayspecs(PhyloMorphoSpace,64,2)
ancestral_states_aligned <- gpagen(ancestral_states_array, curves =
semi_landmarks, surfaces = NULL, PrinAxes = TRUE, max.iter = NULL, ProcD =
F, Proj = TRUE, print.progress = TRUE)
ancestral_PC_scores <- geomorph.ordination(ancestral_states_aligned)
#merges PC scores from tips and ancestors in a single object
PC_scores_all <- rbind(PC_scores, ancestral_PC_scores)

Appendices
175
#disparity-through-time analysis using time-slicing method with 20 time
slices and gradual model
#creates time subsets
subsets <- chrono.subsets(data = PC_scores_all, tree = ttrees[[1]], method
= "continuous", model = "proximity", time = 20, FADLAD = ages)
#bootstrapping the time subsets
boot_subsets <- boot.matrix(subsets, bootstraps = 1000)
#calculates disparity (sum of variances)
disparity <- dispRity(boot_subsets, metric = c(sum, variances))

Appendices
176
Appendix D: Supplementary results of the disparity-through-time analyses of Chapter 3

Appendices
177

Appendices
178

Appendices
179

Appendices
180

Appendices
181

Appendices
182

Appendices
183

Appendices
184

Appendices
185

Appendices
186

Appendices
187

Appendices
188

Appendices
189

Appendices
190
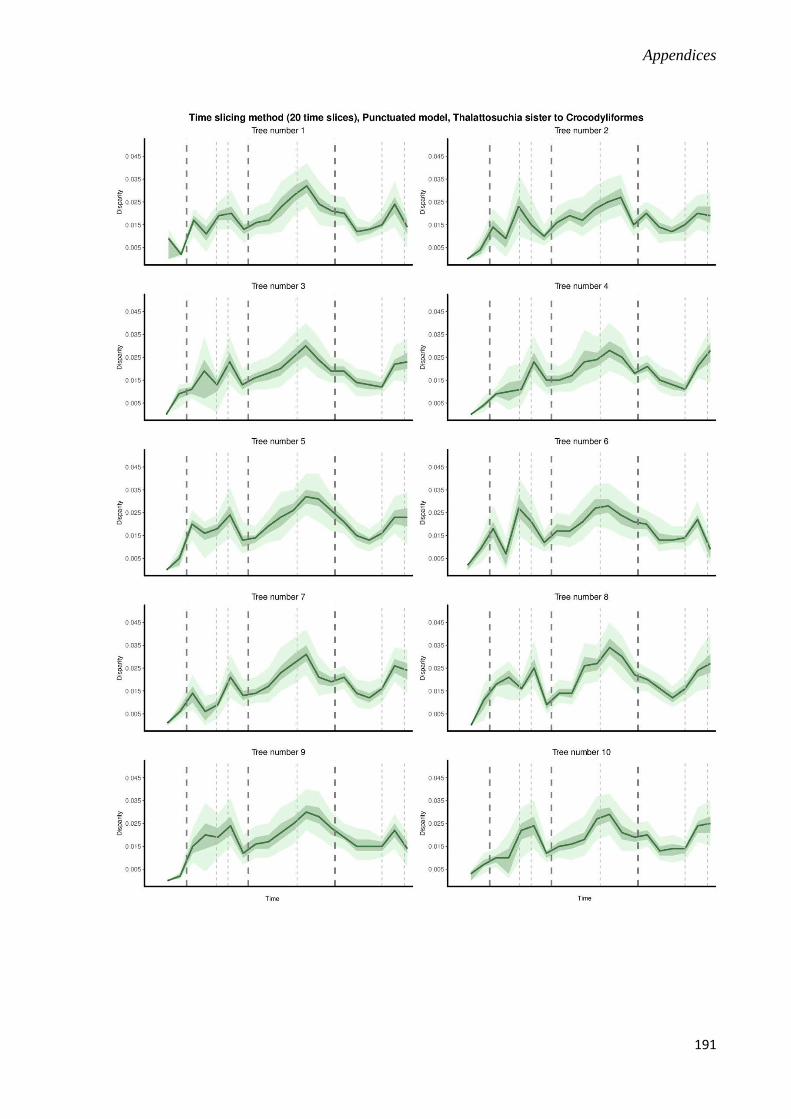
Appendices
191

Appendices
192

Appendices
193

Appendices
194
Appendix E: Supplementary information for Chapter 4
The supplementary material for Chapter 4 (“Heterochrony in the cranial evolution of
notosuchians”) was uploaded to the online repository Dryad (Godoy et al. 2018d) and can be
found at: https://datadryad.org/resource/doi:10.5061/dryad.7m48r. The online content
includes three documents and one compacted (ZIP file) file:
- Supporting information: file (.docx) containing supplementary text (with further
explanation on the reconstruction of the ancestral ontogenetic trajectory), the complete
list of sampled specimens, the description of the landmarks, as well as further tables
and figures with supplementary results (including additional morphospaces,
phylomorphospaces, regression scores and additional npMANOVA results).
- MorphoJ script (.morphoj): script used for all geometric morphometric analyses
performed in Chapter 2.
- Thin plate spline: R script used for thin plate spline analyses.
- TPS files: compacted file containing .tps files with digitized landmarks of both lateral
and dorsal view datasets.

References
195
References
ADAMS, D. C. 1999. Methods for shape analysis of landmark data from articulated
structures. Evolutionary Ecology Research, 1, 959–970.
ADAMS, D. C. 2014. A generalized K statistic for estimating phylogenetic signal from shape
and other high-dimensional multivariate data. Systematic Biology, 63, 685–697.
ADAMS, D. C. and OTÁROLA-CASTILLO, E. 2013. geomorph: an R package for the
collection and analysis of geometric morphometric shape data. Methods in Ecology and
Evolution, 4, 393–399.
ADAMS, D. C., ROHLF, F. J. and SLICE, D. E. 2004. Geometric morphometrics: ten years
of progress following the ‘revolution’. Italian Journal of Zoology, 71, 5–16.
AGUILERA, O. A., RIFF, D. and BOCQUENTIN-VILLANUEVA, J. 2006. A new giant
Purussaurus (Crocodyliformes, Alligatoridae) from the upper Miocene Urumaco
formation, Venezuela. Journal of Systematic Palaeontology, 4, 221–232.
AHLBORN, B. K. and BLAKE, R. W. 1999. Lower size limit of aquatic mammals. American
Journal of Physics, 67, 920–922.
AKAIKE, H. 1974. A new look at the statistical model identification. IEEE Transactions on
Automatic Control, 19, 716–723.
ALBERCH, P., GOULD, S. J., OSTER, G. F. and WAKE, D. B. 1979. Size and shape in
ontogeny and phylogeny. Paleobiology, 5, 296–317.
ALBERDI, M. T., PRADO, J. L. and ORTIZ-JAUREGUIZAR, E. 1995. Patterns of body
size changes in fossil and living Equini (Perissodactyla). Biological Journal of the
Linnean Society, 54, 349–370.

References
196
ALLSTEADT, J. and LANG, J. W. 1995. Incubation temperature affects body size and
energy reserves of hatchling American alligators (Alligator mississippiensis).
Physiological Zoology, 68, 76–97.
ALROY, J. 1998. Cope's rule and the dynamics of body mass evolution in North American
fossil mammals. Science, 280, 731–734.
ALROY, J. 2001. A multispecies overkill simulation of the end-Pleistocene megafaunal mass
extinction. Science, 292, 1893–1896.
ALROY, J. 2010. Fair sampling of taxonomic richness and unbiased estimation of origination
and extinction rates. 55–80. In ALROY, J. and HUNT, G. (eds.). Quantitative Methods in
Paleobiology. The Paleontological Society Papers.
ANDERSON, M. J. 2001. A new method for non-parametric multivariate analysis of
variance. Austral Ecology,. 26, 32–46.
ANDRADE, M. B., YOUNG, M. T., DESOJO, J. B. and BRUSATTE, S. L. 2010. The
evolution of extreme hypercarnivory in Metriorhynchidae (Mesoeucrocodylia:
Thalattosuchia) based on evidence from microscopic denticle morphology. Journal of
Vertebrate Paleontology, 30, 1451–1465.
ANDRADE, M. B., EDMONDS, R., BENTON, M. J. and SCHOUTEN, R. 2011. A new
Berriasian species of Goniopholis (Mesoeucrocodylia, Neosuchia) from England, and a
review of the genus. Zoological Journal of the Linnean Society, 163, 66–108.
ARNOLD, S. J. 2014. Phenotypic evolution: the ongoing synthesis. The American Naturalist.
1836, 729–746.
ARNOLD, S. J., PFRENDER, M. E. and JONES, A. G. 2001. The adaptive landscape as a
conceptual bridge between micro-and macroevolution. Genetica, 112, 9–32.

References
197
AWRAMIK, S. M. 1992. The oldest records of photosynthesis. Photosynthesis Research, 33,
75–89.
BANAVAR, J. R., COOKE, T. J., RINALDO, A. and MARITAN, A. 2014. Form, function,
and evolution of living organisms. Proceedings of the National Academy of Sciences,
111, 3332–3337.
BAPST, D. W. 2012. paleotree: an R package for paleontological and phylogenetic analyses
of evolution. Methods in Ecology and Evolution, 3, 803–807.
BAPST, D. W. 2013. A stochastic rate-calibrated method for time-scaling phylogenies of
fossil taxa. Methods in Ecology and Evolution, 4, 724–733.
BAPST, D. W. 2014a. Preparing paleontological datasets for phylogenetic comparative
methods. 515–544. In GARAMSZEGI, L. Z. (ed.). Modern Phylogenetic Comparative
Methods and Their Application in Evolutionary Biology. Springer Berlin Heidelberg.
BAPST, D. W. 2014b. Assessing the effect of time-scaling methods on phylogeny-based
analyses in the fossil record. Paleobiology, 40, 331–351.
BARBOSA, J. A., KELLNER, A. W. A. and VIANA, M. S. S. 2008. New dyrosaurid
crocodylomorph and evidences for faunal turnover at the K–P transition in Brazil.
Proceedings of the Royal Society of London B, 275, 1385–1391.
BARRIOS, F., PAULINA-CARABAJAL, A. and BONA P. 2016. A new peirosaurid
(Crocodyliformes, Mesoeucrocodylia) from the Upper Cretaceous of Patagonia,
Argentina. Ameghiniana, 53, 14–25.
BATES, K. T., MANNING, P. L., HODGETTS, D. and SELLERS, W. I. 2009. Estimating
mass properties of dinosaurs using laser imaging and 3D computer modelling. PLoS One,
4, e4532.

References
198
BATEZELLI, A. 2017. Continental systems tracts of the Brazilian Cretaceous Bauru Basin
and their relationship with the tectonic and climatic evolution of South America. Basin
Research, 29, 1–25.
BEAULIEU, J. M. and O’MEARA, B. C. 2016. OUwie: Analysis of Evolutionary Rates in an
OU Framework. R package version 1.50. https://CRAN.R-project.org/package=OUwie.
BEAULIEU, J. M., JHWUENG, D. C., BOETTIGER, C. and O’MEARA, B. C. 2012.
Modeling stabilizing selection: expanding the Ornstein–Uhlenbeck model of adaptive
evolution. Evolution, 66, 2369–2383.
BELL, E. A., BOEHNKE, P., HARRISON, T. M. and MAO, W. L. 2015. Potentially
biogenic carbon preserved in a 4.1 billion-year-old zircon. Proceedings of the National
Academy of Sciences, 112, 14518–14521.
BENJAMINI, Y. and HOCHBERG, Y. 1995. Controlling the false discovery rate: a practical
and powerful approach to multiple testing. Journal of the Royal Statistical Society Series
B, 57, 289–300.
BENSON, R. B. and BUTLER, R. J. 2011. Uncovering the diversification history of marine
tetrapods: ecology influences the effect of geological sampling biases. 191–208. In
MCGOWAN, A. J. and SMITH, A. B. (eds.). Comparing the Geological and Fossil
Records: Implications for Biodiversity Studies. Geological Society, London, Special
Publications, 358.
BENSON, R. B., MANNION, P. D., BUTLER, R. J., UPCHURCH, P., GOSWAMI, A. and
EVANS, S. E. 2013. Cretaceous tetrapod fossil record sampling and faunal turnover:
implications for biogeography and the rise of modern clades. Palaeogeography,
Palaeoclimatology, Palaeoecology, 372, 88–107.

References
199
BENSON, R. B. J., FRIGOT, R. A., GOSWAMI, A., ANDRES, B. and BUTLER, R. J.
2014a. Competition and constraint drove Cope's rule in the evolution of giant flying
reptiles. Nature Communications, 5, 3567.
BENSON, R. B., CAMPIONE, N. E., CARRANO, M. T., MANNION, P. D., SULLIVAN,
C., UPCHURCH, P. and EVANS, D. C. 2014b. Rates of dinosaur body mass evolution
indicate 170 million years of sustained ecological innovation on the avian stem lineage.
PLoS Biology, 12, e1001853.
BENSON, R. B., HUNT, G., CARRANO, M. T. and CAMPIONE, N. 2018. Cope's rule and
the adaptive landscape of dinosaur body size evolution. Palaeontology, 61, 13–48.
BENTON, M. J. 2015. Exploring macroevolution using modern and fossil data. Proceedings
of the Royal Society of London B, 282, 20150569.
BENTON, M. and CLARK, J. M. 1988. Archosaur phylogeny and the relationships of the
Crocodylia. 295–338. In BENTON, M. (ed.). The phylogeny and Classification of the
Tetrapods. Clarendon Press.
BENTON, M. and HARPER, D. A. 2013. Introduction to Paleobiology and the Fossil
Record. John Wiley & Sons.
BENTON, M. J., FORTH, J. and LANGER, M. C. 2014. Models for the rise of the dinosaurs.
Current Biology, 24, R87–R95.
BERNER, D. 2011. Size correction in biology: how reliable are approaches based on
(common) principal component analysis? Oecologia, 166, 961–971.
BHULLAR, B. A., MARUGÁN-LOBÓN, J., RACIMO, F., BEVER, G. S., ROWE, T. B.,
NORELL, M. A. and ABZHANOV, A. 2012. Birds have paedomorphic dinosaur skulls.
Nature, 487, 223–226.

References
200
BLOMBERG, S. P., GARLAND, T. and IVES, A. R. 2003. Testing for phylogenetic signal in
comparative data: behavioral traits are more labile. Evolution, 57, 717–745.
BONA, P. and DESOJO, J. B. 2011. Osteology and cranial musculature of Caiman latirostris
(Crocodylia: Alligatoridae). Journal of Morphology, 272, 780–795.
BONA, P., EZCURRA, M. D., BARRIOS, F. and BLANCO, M. V. F. 2018. A new
Palaeocene crocodylian from southern Argentina sheds light on the early history of
caimanines. Proceedings of the Royal Society of London B, 285, 20180843.
BONNAN, M. F., FARLOW, J. O. and MASTERS, S. L. 2008. Using linear and geometric
morphometrics to detect intraspecific variability and sexual dimorphism in femoral shape
in Alligator mississippiensis and its implications for sexing fossil archosaurs. Journal of
Vertebrate Paleontology, 28, 422–431.
BOOKSTEIN, F. L. 1991. Morphometric Tools for Landmark Data. Cambridge University
Press.
BOOKSTEIN, F. L. 1996. Applying landmark methods to biological outline data. 59–70. In
MARDIA, K. V., GILL, C. A. and DRYDEN, I. L (eds.). Image Fusion and Shape
Variability. Leeds University Press.
BOOKSTEIN, F. L. 1997. Landmark methods for forms without landmarks: morphometrics
of group differences in outline shape. Medical Image Analysis, 1, 225–243.
BOOKSTEIN, F. L. 1998. A hundred years of morphometrics. Acta Zoologica Academiae
Scientiarum Hungaricae, 44, 7–59.
BRAZAITIS, P. and WATANABE, M. E. 2011. Crocodilian behaviour: a window to
dinosaur behaviour? Historical Biology, 23, 73–90.

References
201
BROCHU, C. A. 1997. A review of “Leidyosuchus” (Crocodyliformes, Eusuchia) from the
Cretaceous through Eocene of North America. Journal of Vertebrate Paleontology, 17,
679–697.
BROCHU, C. A. 1999. Phylogenetics, taxonomy, and historical biogeography of
Alligatoroidea. Journal of Vertebrate Paleontology, 19, 9–100.
BROCHU, C. A. 2001. Crocodylian snouts in space and time: phylogenetic approaches
toward adaptive radiation. American Zoologist, 41, 564–585.
BROCHU, C. A. 2003. Phylogenetic approaches toward crocodylian history. Annual Review
of Earth and Planetary Sciences, 31, 357–397.
BROCHU, C. A. 2006. Osteology and phylogenetic significance of Eosuchus minor (Marsh,
1870) new combination, a longirostrine crocodylian from the late Paleocene of North
America. Journal of Paleontology, 80, 162–186.
BROCHU, C. A. 2010. A new alligatorid from the lower Eocene Green River Formation of
Wyoming and the origin of caimans. Journal of Vertebrate Paleontology, 30, 1109–1126.
BROCHU, C. A. 2011. Phylogenetic relationships of Necrosuchus ionensis Simpson, 1937
and the early history of caimanines. Zoological Journal of the Linnean Society, 163,
S228–S256.
BROCHU, C. A. 2012. Phylogenetic relationships of Palaeogene ziphodont eusuchians and
the status of Pristichampsus Gervais, 1853. Earth and Environmental Science
Transactions of the Royal Society of Edinburgh, 103, 521–550.
BROCHU, C. A. and RINCÓN, A. D. 2004. A gavialoid crocodylian from the Lower
Miocene of Venezuela. Special Papers in Palaeontology, 71, 61–79.

References
202
BROCHU, C. A. and STORRS, G. W. 2012. A giant crocodile from the Plio-Pleistocene of
Kenya, the phylogenetic relationships of Neogene African crocodylines, and the antiquity
of Crocodylus in Africa. Journal of Vertebrate Paleontology, 32, 587–602.
BROCHU, C. A., PARRIS, D. C., GRANDSTAFF, B. S., DENTON, R. K. and
GALLAGHER, W. B. 2012. A new species of Borealosuchus (Crocodyliformes,
Eusuchia) from the Late Cretaceous–early Paleogene of New Jersey. Journal of
Vertebrate Paleontology, 32, 105–116.
BROCKLEHURST, N. 2016. Rates and modes of body size evolution in early carnivores and
herbivores: a case study from Captorhinidae. PeerJ, 4, e1555.
BROCKLEHURST, N. 2017. Rates of morphological evolution in Captorhinidae: an adaptive
radiation of Permian herbivores. PeerJ, 5, e3200.
BRONZATI, M., MONTEFELTRO, F. C. and LANGER, M. C. 2012. A species-level
supertree of Crocodyliformes. Historical Biology, 24, 598–606.
BRONZATI, M., MONTEFELTRO, F. C. and LANGER, M. C. 2015. Diversification events
and the effects of mass extinctions on Crocodyliformes evolutionary history. Royal
Society Open Science, 2, 140385.
BRUSATTE, S. L., BENTON, M. J., RUTA, M. and LLOYD, G. T. 2008. Superiority,
competition, and opportunism in the evolutionary radiation of dinosaurs. Science, 321,
1485–1488.
BRUSATTE, S. L., BENTON, M. J., RUTA, M. and LLOYD, G. T. 2008. The first 50 Myr
of dinosaur evolution: macroevolutionary pattern and morphological disparity. Biology
Letters, 4, 733–736.

References
203
BRUSATTE, S. L., BUTLER, R. J., BARRETT, P. M., CARRANO, M. T., EVANS, D. C.,
LLOYD, G. T., MANNION, P. D., NORELL, M. A., PEPPE, D. J., UPCHURCH, P. and
WILLIAMSON, T. E. 2015. The extinction of the dinosaurs. Biological Reviews, 90,
628–642.
BUCKLEY, G. A. and BROCHU, C. A. 1999. An enigmatic new crocodile from the Upper
Cretaceous of Madagascar. Cretaceous Fossil Vertebrates, 60, 149–175.
BUCKLEY, G. A., BROCHU, C. A., KRAUSE, D. W. and POL, D. 2000. A pug-nosed
crocodyliform from the Late Cretaceous of Madagascar. Nature, 405, 941–944.
BURNABY, T. P. 1966. Growth-invariant discriminant functions and generalized distances.
Biometrics, 22, 96–110.
BURNESS, G. P., DIAMOND, J. and FLANNERY, T. 2001. Dinosaurs, dragons, and
dwarfs: the evolution of maximal body size. Proceedings of the National Academy of
Sciences, 98, 14518–14523.
BURNHAM, K. P. and ANDERSON, D. R. 2003. Model selection and multimodel inference:
a practical information–theoretic approach. Springer Science & Business Media.
BURNHAM, K. P., ANDERSON, D. R. and HUYVAERT, K. P. 2011. AIC model selection
and multimodel inference in behavioral ecology: some background, observations, and
comparisons. Behavioral Ecology and Sociobiology, 65, 23–35.
BUSBEY, A. B. 1995. The structural consequences of skull flattening in crocodilians. 173–
192. In THOMASON, J. J. (ed.). Functional Morphology in Vertebrate Paleontology.
Cambridge University Press.
BUSCALIONI, Á. D. 2017. The Gobiosuchidae in the early evolution of Crocodyliformes.
Journal of Vertebrate Paleontology, 37, e1324459.

References
204
BUSCALIONI, Á. D., ORTEGA, F., WEISHAMPEL, D. B. and JIANU, C. M. 2001. A
revision of the crocodyliform Allodaposuchus precedens from the Upper Cretaceous of
the Hateg Basin, Romania. Its relevance in the phylogeny of Eusuchia. Journal of
Vertebrate Paleontology, 21, 74–86.
BUSCALIONI, Á. D., PIRAS, P., VULLO, R., SIGNORE, M. and BARBERA, C. 2011.
Early Eusuchia Crocodylomorpha from the vertebrate-rich Plattenkalk of Pietraroia
(Lower Albian, southern Apennines, Italy). Zoological Journal of the Linnean Society,
163, S199–S227.
BUSTARD, H. R. and SINGH, L. A. K. 1977. Studies on the Indian Gharial Gavialis
gangeticus (Gmelin) (Reptilia, Crocodilia) – I: Estimation of body length from scute
length. Indian Forester, 103, 140–149.
BUTLER, M. A. and KING, A. A. 2004. Phylogenetic comparative analysis: a modeling
approach for adaptive evolution. The American Naturalist, 164, 683–695.
BUTLER, R. J. and GOSWAMI, A. 2008. Body size evolution in Mesozoic birds: little
evidence for Cope’s rule. Journal of Evolutionary Biology, 21, 1673–1682.
BUTLER, R. J., BRUSATTE, S. L., ANDRES, B. and BENSON, R. B. 2012. How do
geological sampling biases affect studies of morphological evolution in deep time? A
case study of pterosaur (Reptilia: Archosauria) disparity. Evolution, 66, 147–162.
CALDER, W. A. 1984. Size, Function, and Life History. Harvard University Press.
CAMPIONE, N. E. and EVANS, D. C. 2012. A universal scaling relationship between body
mass and proximal limb bone dimensions in quadrupedal terrestrial tetrapods. BMC
Biology, 10, 60.

References
205
CAMPIONE, N. E., EVANS, D. C., BROWN, C. M. and CARRANO, M. T. 2014. Body
mass estimation in non-avian bipeds using a theoretical conversion to quadruped
stylopodial proportions. Methods in Ecology and Evolution, 5, 913–923.
CARBALLIDO, J. L., POL, D., OTERO, A., CERDA, I. A., SALGADO, L., GARRIDO, A.
C., RAMEZANI, J., CÚNEO, N. R. and KRAUSE, J. M. 2017. A new giant titanosaur
sheds light on body mass evolution among sauropod dinosaurs. Proceedings of the Royal
Society of London B, 284, 20171219.
CARDILLO, M., MACE, G. M., JONES, K. E., BIELBY, J., BININDA-EMONDS, O. R.,
SECHREST, W., ORME, C. D. L. and PURVIS, A. 2005. Multiple causes of high
extinction risk in large mammal species. Science, 309, 1239–1241.
CARRANO, M. T. 2006. Body-size evolution in the Dinosauria. 225–268. In CARRANO, M.
T., BLOB, R. W., GAUDIN, T. and WIBBLE, J. R. (eds.). Amniote Paleobiology:
Perspectives on the Evolution of Mammals, Birds, and Reptiles. University of Chicago
Press.
CARVALHO, I. S. and BERTINI, R. J. 1999. Mariliasuchus: um novo Crocodylomorpha
(Notosuchia) do Cretáceo da Bacia Bauru, Brasil. Geologia Colombiana, 24, 83–105.
CARVALHO, I. S., RIBEIRO, L. C. B. and AVILLA, L. S. 2004. Uberabasuchus terrificus
sp. nov., a new crocodylomorpha from the Bauru Basin, (Upper Cretaceous), Brazil.
Gondwana Research, 7, 975–1004.
CARVALHO, I. S., VASCONCELLOS, F. M. and TAVARES, S. A. S. 2007.
Montealtosuchus arrudacamposi, a new peirosaurid crocodile (Mesoeucrocodylia) from
the Late Cretaceous Adamantina Formation of Brazil. Zootaxa, 1607, 35–46.

References
206
CARVALHO, I. S., GASPARINI, Z. B., SALGADO, L., VASCONCELLOS, F. M. and
MARINHO, T. S. 2010. Climate's role in the distribution of the Cretaceous terrestrial
Crocodyliformes throughout Gondwana. Palaeogeography, Palaeoclimatology,
Palaeoecology, 297, 252–262.
CARVALHO, I. S., TEIXEIRA, V. P. A., FERRAZ, M. L. F., RIBEIRO, L. C. B.,
MARTINELLI, A. G., NETO, F. M., SERTICH, J. J. W., CUNHA, G. C., CUNHA, I. C.
and FERRAZ, P. F. 2011. Campinasuchus dinizi gen. et sp. nov., a new Late Cretaceous
baurusuchid (Crocodyliformes) from the Bauru Basin, Brazil. Zootaxa, 2871, 19–42.
CHAMERO, B., BUSCALIONI, Á. D. and MARUGÁN-LOBÓN, J. 2013. Pectoral girdle
and forelimb variation in extant Crocodylia: the coracoid–humerus pair as an
evolutionary module. Biological Journal of the Linnean Society, 108, 600–618.
CHURCHILL, M., CLEMENTZ, M. T. and KOHNO N. 2015. Cope's rule and the evolution
of body size in Pinnipedimorpha (Mammalia: Carnivora). Evolution, 69, 201–215.
CLARAC, F., SOUTER, T., CUBO, J., DE BUFFRENIL, V., BROCHU, C. and
CORNETTE, R. 2016. Does skull morphology constrain bone ornamentation? A
morphometric analysis in the Crocodylia. Journal of Anatomy, 229, 292–301.
CLARK, J. M. 1994. Patterns of evolution in Mesozoic Crocodyliformes. 84–97. In
FRASER, N. C. and SUES, H. D. (eds.). In the Shadow of the Dinosaurs. Early Mesozoic
Tetrapods. Cambridge University Press.
CLARK, J. M. 2011. A new shartegosuchid crocodyliform from the Upper Jurassic Morrison
Formation of western Colorado. Zoological Journal of the Linnean Society, 163, S152–
S172.

References
207
CLARK, J. M. and SUES, H. D. 2002. Two new basal crocodylomorph archosaurs from the
Lower Jurassic and the monophyly of the Sphenosuchia. Zoological Journal of the
Linnean Society, 136, 77–95.
CLARK, J. M., SUES, H. D. and BERMAN, D. S. 2000. A new specimen of Hesperosuchus
agilis from the Upper Triassic of New Mexico and the interrelationships of basal
crocodylomorph archosaurs. Journal of Vertebrate Paleontology, 20, 683–704.
CLARK, J. M., XU, X., FORSTER, C. A. and WANG, Y. 2004. A Middle Jurassic
‘sphenosuchian’from China and the origin of the crocodylian skull. Nature, 430, 1021–
1024.
CLAUDE, J. 2008. Morphometrics with R. Springer-Verlag.
CLAUSET, A. and ERWIN, D. H. 2008. The evolution and distribution of species body size.
Science, 321, 399–401.
CLELAND, C. E. 2001. Historical science, experimental science, and the scientific method.
Geology, 29, 987–990.
CLELAND, C. E. 2002. Methodological and epistemic differences between historical science
and experimental science. Philosophy of Science, 69, 474–496.
COLBERT, E. H. 1962. The weights of dinosaurs. American Museum Novitates, 2076, 1–16.
COLLYER, M. L., SEKORA, D. J. and ADAMS, D. C. 2015. A method for analysis of
phenotypic change for phenotypes described by high-dimensional data. Heredity, 115,
357–365.
COOKE, S. B. and TERHUNE, C. E. 2015. Form, function, and geometric morphometrics.
The Anatomical Record, 298, 5–28.

References
208
COOPER, N. and PURVIS, A. 2010. Body size evolution in mammals: complexity in tempo
and mode. The American Naturalist, 175, 727–738.
COOPER, N., THOMAS, G. H., VENDITTI, C., MEADE, A. and FRECKLETON, R. P.
2016. A cautionary note on the use of Ornstein Uhlenbeck models in macroevolutionary
studies. Biological Journal of the Linnean Society, 118, 64–77.
COPE, E. D. 1887. The Origin of the Fittest: Essays on Evolution. D. Appleton and
Company.
COPE, E. D. 1896. The Primary Factors of Organic Evolution. Open Court Press.
CORNWELL, W. K., SCHWILK, D. W. and Ackerly, D. D. 2006. A traitbased test for
habitat filtering: Convex hull volume. Ecology, 87, 1465–1471.
COWEN, R. 2013. History of life. John Wiley & Sons.
CRUSH, P. J. 1984. A late Upper Triassic sphenosuchid crocodilian from Wales.
Palaeontology, 27, 131–157.
CUBO, J., KÖHLER, M. and BUFFRENIL, V. 2017. Bone histology of Iberosuchus
macrodon (Sebecosuchia, Crocodylomorpha). Lethaia, 50, 495–503.
CURRIE, P. J. 1978. The orthometric linear unit. Journal of Paleontology, 5, 964–971.
CUVIER, G. 1817. Le Règne Animal Distribué d'après son Organisation, pour Servir de Base
à l'Histoire Naturelle des Animaux et d'Introduction à l'Anatomie Comparée. Fortin,
Masson et cie, Libraires.
DABOUL, A., IVANOVSKA, T., BÜLOW, R., BIFFAR, R. and CARDINI, A. 2018.
Procrustes-based geometric morphometrics on MRI images: An example of inter-operator
bias in 3D landmarks and its impact on big datasets. PLoS One, 13, e0197675.

References
209
DARWIN, C. 1859. On the Origin of Species by Means of Natural Selection, or, the
Preservation of Favoured Races in the Struggle for Life. John Murray.
DAVIS, A. M., UNMACK, P. J., PUSEY, B. J., PEARSON, R. G. and MORGAN, D. L.
2014. Evidence for a multi-peak adaptive landscape in the evolution of trophic
morphology in terapontid fishes. Biological journal of the Linnean Society, 113, 623–
634.
DELFINO, M. and DE VOS, J. 2014. A giant crocodile in the Dubois Collection from the
Pleistocene of Kali Gedeh (Java). Integrative Zoology, 9, 141–147.
DELFINO, M., PIRAS, P. and SMITH, T. 2005. Anatomy and phylogeny of the gavialoid
crocodylian Eusuchus lerichei from the Paleogene of Europe. Acta Palaeontologica
Polonica, 50, 565–580.
DELFINO, M., CODREA, V., FOLIE, A., DICA, P., GODEFROIT, P. and SMITH, T.
2008a. A complete skull of Allodaposuchus precedens Nopcsa, 1928 (Eusuchia) and a
reassessment of the morphology of the taxon based on the Romanian remains. Journal of
Vertebrate Paleontology, 28, 111–122.
DELFINO, M., MARTIN, J. E. and BUFFETAUT, E. 2008b. A new species of Acynodon
(Crocodylia) from the upper cretaceous (Santonian–Campanian) of Villaggio del
Pescatore, Italy. Palaeontology, 51, 1091–1106.
DEPÉRET, C. J. J. 1909. The Transformations of the Animal World. D. Appleton and
Company.
DODD, M. S., PAPINEAU, D., GRENNE, T., SLACK, J. F., RITTNER, M., PIRAJNO, F.,
O’NEIL, J. and LITTLE, C. T. 2017. Evidence for early life in Earth’s oldest
hydrothermal vent precipitates. Nature, 543, 60–64.

References
210
DOLLMAN, K. N., CLARK, J. M., NORELL, M. A., XING, X. and CHOINIERE, J. N.
2018. Convergent evolution of a eusuchian-type secondary palate within
Shartegosuchidae. American Museum Novitates, 3901, 1–23.
DOWNHOWER, J. F. and BLUMER, L. S. 1988. Calculating just how small a whale can be.
Nature, 335, 675.
EKMAN, S., ANDERSEN, H. L. and WEDIN, M. 2008. The limitations of ancestral state
reconstruction and the evolution of the ascus in the Lecanorales (lichenized Ascomycota).
Systematic Biology, 57, 141–156.
ERICKSON, B. R. and SAWYER, G. T. 1996. The estuarine crocodile Gavialosuchus
carolinensis n. sp. (Crocodylia: Eusuchia) from the late Oligocene of South Carolina,
North America. The Science Museum of Minnesota Monograph Paleontology, 3, 1–49.
ERICKSON, G. M. and BROCHU, C. A. 1999. How the ‘terror crocodile’grew so big.
Nature, 398, 205–206.
ERICKSON, G. M., MAKOVICKY, P. J., CURRIE, P. J., NORELL, M. A., YERBY, S. A.
and BROCHU, C. A. 2004. Gigantism and comparative life-history parameters of
tyrannosaurid dinosaurs. Nature, 430, 772–775.
ERICKSON, G. M., GIGNAC, P. M., STEPPAN, S. J., LAPPIN, A. K., VLIET, K. A.,
BRUEGGEN, J. D., INOUYE, B. D., KLEDZIK, D. and WEBB, G. J. 2012. Insights into
the ecology and evolutionary success of crocodilians revealed through bite-force and
tooth-pressure experimentation. PLoS One, 7, e31781.
EZCURRA, M. D. and BUTLER, R. J. 2015. Post-hatchling cranial ontogeny in the Early
Triassic diapsid reptile Proterosuchus fergusi. Journal of Anatomy, 226, 387–402.

References
211
FANTI, F., MIYASHITA, T., CANTELLI, L., MNASRI, F., DRIDI, J., CONTESSI, M. and
CAU, A. 2016. The largest thalattosuchian (Crocodylomorpha) supports teleosaurid
survival across the Jurassic-Cretaceous boundary. Cretaceous Research, 61, 263–274.
FARLOW, J. O., HURLBURT, G. R., ELSEY, R. M., BRITTON, A. R. and LANGSTON,
W. 2005. Femoral dimensions and body size of Alligator mississippiensis: estimating the
size of extinct mesoeucrocodylians. Journal of Vertebrate Paleontology, 25, 354–369.
FELSENSTEIN, J. 1985. Phylogenies and the comparative method. The American Naturalist,
125, 1–15.
FELSENSTEIN, J. 1988. Phylogenies and quantitative characters. Annual Review of Ecology
and Systematics, 19, 445–471.
FIORELLI, L. E. and CALVO, J. O. 2007. The first “protosuchian”(Archosauria:
Crocodyliformes) from the Cretaceous (Santonian) of Gondwana. Arquivos do Museu
Nacional, 65, 417–459.
FIORELLI, L. E. and CALVO, J. O 2008. New remains of Notosuchus terrestris Woodward,
1896 (Crocodyliformes: Mesoeucrocodylia) from Late Cretaceous of Neuquén,
Patagonia, Argentina. Arquivos do Museu Nacional, 66, 83–124.
FIORELLI, L. E., LEARDI, J. M., HECHENLEITNER, E. M., POL, D., BASILICI, G. and
GRELLET-TINNER, G. 2016. A new Late Cretaceous crocodyliform from the western
margin of Gondwana (La Rioja Province, Argentina). Cretaceous Research, 60, 194–209.
FISHER, D. O. and OWENS, I. P. 2004. The comparative method in conservation biology.
Trends in Ecology & Eevolution, 19, 391–398.

References
212
FOFFA, D. and YOUNG, M. T. 2014. The cranial osteology of Tyrannoneustes
lythrodectikos (Crocodylomorpha: Metriorhynchidae) from the Middle Jurassic of
Europe. PeerJ, 2, e608.
FOFFA, D., YOUNG, M. T., BRUSATTE, S. L., GRAHAM, M. R. and STEEL, L. 2018. A
new metriorhynchid crocodylomorph from the Oxford Clay Formation (Middle Jurassic)
of England, with implications for the origin and diversification of Geosaurini. Journal of
Systematic Palaeontology, 16, 1123–1143.
FOOTE, M. 1993. Discordance and concordance between morphological and taxonomic
diversity. Paleobiology, 19, 185–204.
FOOTE, M. 1997. The evolution of morphological diversity. Annual Reviews of Ecology and
Systematics, 28, 129–152.
FORTIER, D. C. and SCHULTZ, C. L. 2009. A new neosuchian crocodylomorph
(Crocodyliformes, Mesoeucrocodylia) from the Early Cretaceous of north-east Brazil.
Palaeontology, 52, 991–1007.
FORTIER, D., PEREA, D. and SCHULTZ, C. 2011. Redescription and phylogenetic
relationships of Meridiosaurus vallisparadisi, a pholidosaurid from the Late Jurassic of
Uruguay. Zoological Journal of the Linnean Society, 163, S257–S272.
FORTIER, D. C., SOUZA-FILHO, J. P., GUILHERME, E., MACIENTE, A. A. and
SCHULTZ, C. L. 2014. A new specimen of Caiman brevirostris (Crocodylia,
Alligatoridae) from the Late Miocene of Brazil. Journal of Vertebrate Paleontology, 34,
820–834.
FOTH, C. and JOYCE, W. G. 2016. Slow and steady: the evolution of cranial disparity in
fossil and recent turtles. Proceedings of the Royal Society of London B, 283, 20161881.
References
213
FOTH, C., BRUSATTE, S. L. and BUTLER, R. J. 2012. Do different disparity proxies
converge on a common signal? Insights from the cranial morphometrics and evolutionary
history of Pterosauria (Diapsida: Archosauria). Journal of Evolutionary Biology, 25, 904–
915.
FOTH, C., BONA, P. and DESOJO, J. B. 2015. Intraspecific variation in the skull
morphology of the black caiman Melanosuchus niger (Alligatoridae, Caimaninae). Acta
Zoologica, 96, 1–13.
FOTH, C., EZCURRA, M. D., SOOKIAS, R. B., BRUSATTE, S. L. and BUTLER R. J.
2016a. Unappreciated diversification of stem archosaurs during the Middle Triassic
predated the dominance of dinosaurs. BMC Evolutionary Biology, 16, 188.
FOTH, C., HEDRICK, B. P. and EZCURRA M. D. 2016b. Cranial ontogenetic variation in
early saurischians and the role of heterochrony in the diversification of predatory
dinosaurs. PeerJ, 4, e1589.
FOTH, C., FERNANDEZ BLANCO, M. V., BONA, P. and SCHEYER, T. M. 2017a. Cranial
shape variation in jacarean caimanines (Crocodylia, Alligatoroidea) and its implications
in the taxonomic status of extinct species: The case of Melanosuchus fisheri. Journal of
Morphology. Journal of Morphology, 279, 259–273.
FOTH, C., ASCARRUNZ, E. and JOYCE, W. G. 2017b. Still slow, but even steadier: an
update on the evolution of turtle cranial disparity interpolating shapes along branches.
Royal Society Open Science, 4, 170899.
FRANCHINI, P., FRUCIANO, C., SPREITZER, M. L., JONES, J. C., ELMER, K. R.,
HENNING, F. and MEYER, A. 2014. Genomic architecture of ecologically divergent

References
214
body shape in a pair of sympatric crater lake cichlid fishes. Molecular Ecology, 23, 1828–
1845.
FRUCIANO, C. 2016. Measurement error in geometric morphometrics. Development Genes
and Evolution, 226, 139–158.
FRUCIANO, C., TIGANO, C. and FERRITO, V. 2011. Geographical and morphological
variation within and between colour phases in Coris julis (L. 1758), a protogynous
marine fish. Biological Journal of the Linnean Society, 104, 148–162.
FRUCIANO, C., TIGANO, C. and FERRITO, V. 2012. Body shape variation and colour
change during growth in a protogynous fish. Environmental Biology of Fishes, 94, 615–
622.
FRUCIANO, C., FRANCHINI, P., KOVACOVA, V., ELMER, K. R., HENNING, F. and
MEYER, A. 2016. Genetic linkage of distinct adaptive traits in sympatrically speciating
crater lake cichlid fish. Nature Communications, 7, 12736.
FRUCIANO, C., CELIK, M. A., BUTLER, K., DOOLEY, T., WEISBECKER, V. and
PHILLIPS, M. J. 2017. Sharing is caring? Measurement error and the issues arising from
combining 3D morphometric datasets. Ecology and Evolution, 7, 7034–7046.
GAO, Y. H. 2001. A new species of Hsisosuchus from Dashanpu, Zigong, Sichuan.
Vertebrata PalAsiatica, 39, 177–184.
GARLAND, T. and IVES, A. R. 2000. Using the past to predict the present: confidence
intervals for regression equations in phylogenetic comparative methods. The American
Naturalist, 155, 346–364.

References
215
GARLAND JR, T., DICKERMAN, A. W., JANIS, C. M. and JONES, J. A. 1993.
Phylogenetic analysis of covariance by computer simulation. Systematic Biology, 42,
265–292.
GASPARINI, Z. B. 1971. Los Notosuchia del Cretácico de América del Sur como un nuevo
Infraorden de los Mesosuchia (Crocodilia). Ameghiniana, 8, 83–103.
GASPARINI, Z., POL, D. and SPALLETTI, L. A. 2006. An unusual marine crocodyliform
from the Jurassic-Cretaceous boundary of Patagonia. Science, 311, 70–73.
GASPARINI, Z., CHIAPPE, L. M. and FERNANDEZ, M. 1991. A new Senonian peirosaurid
(Crocodylomorpha) from Argentina and a synopsis of the South American Cretaceous
crocodilians. Journal of Vertebrate Paleontology, 11, 316–333.
GEARTY, W., MCCLAIN, C. R. and PAYNE, J. L. 2018. Energetic tradeoffs control the size
distribution of aquatic mammals. Proceedings of the National Academy of Sciences, 115,
4194–4199.
GHARAIBEH, W. 2005. Correcting for the effect of orientation in geometric morphometric
studies of side-view images of human heads. 117–143. In SLICE, D. (ed.). Modern
morphometrics in physical anthropology. Springer.
GIGNAC, P. and O'BRIEN, H. 2016. Suchian feeding success at the interface of ontogeny
and macroevolution. Integrative and Comparative Biology, 56, 449–458.
GODOY, P. L., MONTEFELTRO, F. C., NORELL, M. A. and LANGER, M. C. 2014. An
additional baurusuchid from the Cretaceous of Brazil with evidence of interspecific
predation among Crocodyliformes. PLoS One, 9, e97138.
GODOY, P. L., BRONZATI, M., ELTINK, E., MARSOLA, J. C. A., CIDADE, G. M.,
LANGER, M. C. and MONTEFELTRO, F. C. 2016. Postcranial anatomy of

References
216
Pissarrachampsa sera (Crocodyliformes, Baurusuchidae) from the Late Cretaceous of
Brazil: insights on lifestyle and phylogenetic significance. PeerJ, 4, e2075.
GODOY, P. L., BENSON, R. B. J., BRONZATI, M. and BUTLER, R. J. 2018a. The multi-
peak adaptive landscape of crocodylomorph body size evolution. bioRxiv, 405621,
https://doi.org/10.1101/405621.
GODOY, P. L., FERREIRA, G. S., MONTEFELTRO, F. C., VILA NOVA, B. C., BUTLER,
R. J. and LANGER, M. C. 2018b. Evidence for heterochrony in the cranial evolution of
fossil crocodyliforms. Palaeontology, 61, 543–558.
GODOY, P. L., BENSON, R. B. J., BRONZATI, M. and BUTLER, R. J. 2018c. Supporting
data for: The multi-peak adaptive landscape of crocodylomorph body size evolution.
Zenodo. http://doi.org/10.5281/zenodo.1344593.
GODOY, P. L., FERREIRA, G. S., MONTEFELTRO, F. C., VILA NOVA, B. C., BUTLER,
R. J. and LANGER, M. C. 2018d. Data from: Evidence for heterochrony in the cranial
evolution of fossil crocodyliforms. Dryad Digital Repository.
https://doi.org/10.5061/dryad.7m48r.
GOLD, M. E. L., BROCHU, C. A. and NORELL, M. A. 2014. An expanded combined
evidence approach to the Gavialis problem using geometric morphometric data from
crocodylian braincases and Eustachian systems. PLoS One, 9, e105793.
GOMANI, E. M. 1997. A crocodyliform from the Early Cretaceous dinosaur beds, northern
Malawi. Journal of Vertebrate Paleontology, 17, 280–294.
GOODALL, C. 1991. Procrustes methods in the statistical analysis of shape. Journal of the
Royal Statistical Society. Series B (Methodological), 53, 285–339.

References
217
GOULD, S. J. 1966. Allometry and size in ontogeny and phylogeny. Biological Reviews of
the Cambridge Philosophical Society, 41, 587–640.
GOULD, S. J. 1977. Ontogeny and Phylogeny. Harvard University Press.
GOULD, S. J. 1991. The disparity of the Burgess Shale arthropod fauna and the limits of
cladistic analysis: why we must strive to quantify morphospace. Paleobiology, 17, 411–
423.
GOULD, S. J. 2000. Of coiled oysters and big brains: how to rescue the terminology of
heterochrony, now gone astray. Evolution & Development, 2, 241–248.
GOULD, S. J. and ELDREDGE, N. 1977. Punctuated equilibria: the tempo and mode of
evolution reconsidered. Paleobiology, 3, 115–151.
GOW, C. E. 2000. The skull of Protosuchus haughtoni, an Early Jurassic crocodyliform from
southern Africa. Journal of Vertebrate Paleontology, 20, 49–56.
GOWER, J. C. 1975. Generalized procrustes analysis. Psychometrika, 40, 33–51.
GRANGE, D. R. and BENTON, M. J. 1996. Kimmeridgian metriorhynchid crocodiles from
England. Palaeontology, 39, 497–514.
GRIGG, G. C., SEEBACHER, F. and FRANKLIN, C. E. 2001. Crocodilian Biology and
Evolution. Surrey Beatty & Sons.
GUILLERME, T. 2018. dispRity: A modular R package for measuring disparity. Methods in
Ecology and Evolution, 9, 1755–1763.
GUILLERME, T. and COOPER, N. 2018. Time for a rethink: time sub-sampling methods in
disparity-through-time analyses. Palaeontology, 61, 481–493.

References
218
HAINES, A. J. and CRAMPTON, J. S. 2000. Improvements to the method of Fourier shape
analysis as applied in morphometric studies. Palaeontology, 43, 765–783.
HALL, P. M. and PORTIER, K. M. 1994. Cranial morphometry of New Guinea crocodiles
(Crocodylus novaeguineae): ontogenetic variation in relative growth of the skull and an
assessment of its utility as a predictor of the sex and size of individuals. Herpetological
Monographs, 8, 203–225.
HAMMER, Ø., HARPER, D. A. T. and RYAN, P. D. 2001. PAST: Paleontological statistics
software package for education and data analysis. Paleontologia Electronica, 4, 1–9.
HANSEN, T. F. 1997. Stabilizing selection and the comparative analysis of adaptation.
Evolution, 51, 1341–1351.
HANSEN, T. F. 2012. Adaptive landscapes and macroevolutionary dynamics. 205–226. In
SVENSSON, E. and CALSBEEK, R. (eds.). The Adaptive Landscape in Evolutionary
Biology. Oxford University Press.
HANSEN, T. F. and MARTINS, E. P. 1996. Translating between microevolutionary process
and macroevolutionary patterns: the correlation structure of interspecific data. Evolution,
50, 1404–1417.
HARMON, L. J., WEIR, J. T., BROCK, C. D., GLOR, R. E. and CHALLENGER, W. 2007.
GEIGER: investigating evolutionary radiations. Bioinformatics, 24, 129–131.
HARMON, L. J., LOSOS, J. B., DAVIES, T. J., GILLESPIE, R. G., GITTLEMAN, J. L.,
JENNINGS, B. W., KOZAK, K. H., MCPEEK, M. A., MORENO-ROARK, F., NEAR,
T. J., PURVIS, A., RICKLEFS, R. E., SCHLUTER, D., SCHULTE II, J. A.,
SEEHAUSEN, O., SIDLAUSKAS, B. L., TORRES-CARVAJAL, O., WEIR, J. T. and

References
219
MOOERS, A. Ø., 2010. Early bursts of body size and shape evolution are rare in
comparative data. Evolution, 64, 2385–2396.
HARVEY, P. H. and PAGEL, M. D. 1991. The Comparative Method in Evolutionary
Biology. Oxford University Press.
HASTINGS, A. K., BLOCH, J. I., CADENA, E. A. and JARAMILLO, C. A. 2010. A new
small short-snouted dyrosaurid (Crocodylomorpha, Mesoeucrocodylia) from the
Paleocene of Northeastern Colombia. Journal of Vertebrate Paleontology, 30, 139–162.
HASTINGS, A. K., BLOCH, J. I. and JARAMILLO, C. A. 2011. A new longirostrine
dyrosaurid (Crocodylomorpha, Mesoeucrocodylia) from the Paleocene of north-eastern
Colombia: biogeographic and behavioural implications for New-World Dyrosauridae.
Palaeontology, 54, 1095–1116.
HASTINGS, A. K., BLOCH, J. I., JARAMILLO, C. A., RINCON, A. F. and MACFADDEN,
B. J. 2013. Systematics and biogeography of crocodylians from the Miocene of Panama.
Journal of Vertebrate Paleontology, 33, 239–263.
HASTINGS, A. K., BLOCH, J. I. and JARAMILLO, C. A. 2015. A new blunt-snouted
dyrosaurid, Anthracosuchus balrogus gen. et sp. nov.(Crocodylomorpha,
Mesoeucrocodylia), from the Palaeocene of Colombia. Historical Biology, 27, 998–1020.
HECHT, M. K. 1991. Araripesuchus Price, 1959. 342–347. In MAISEY, J. G. (ed.). Santana
Fossils: an Illustrated Guide. T.F.H. Publications.
HEDMAN, M. M. 2010. Constraints on clade ages from fossil outgroups. Paleobiology, 36,
16–31.
HEIM, N. A., KNOPE, M. L., SCHAAL, E. K., WANG, S. C. and PAYNE, J. L. 2015.
Cope’s rule in the evolution of marine animals. Science, 347, 867–870.

References
220
HERRERA, Y., GASPARINI, Z. and FERNANDEZ, M. S. 2013. A new Patagonian species
of Cricosaurus (Crocodyliformes, Thalattosuchia): first evidence of Cricosaurus in
Middle–Upper Tithonian lithographic limestone from Gondwana. Palaeontology, 56,
663–678.
HERRERA, Y., GASPARINI, Z. and FERNÁNDEZ, M. S. 2015. Purranisaurus potens
Rusconi, an enigmatic metriorhynchid from the Late Jurassic–Early Cretaceous of the
Neuquén Basin. Journal of Vertebrate Paleontology, 35, e904790.
HERRERA, Y., FERNANDEZ, M. S., LAMAS, S. G., CAMPOS, L., TALEVI, M. and
GASPARINI, Z. 2017. Morphology of the sacral region and reproductive strategies of
Metriorhynchidae: a counter-inductive approach. Earth and Environmental Science
Transactions of the Royal Society of Edinburgh, 106, 247–255.
HERVÉ, M. 2018. RVAideMemoire: Testing and Plotting Procedures for Biostatistics. R
package version 0.9-69-3. https://CRAN.R-project.org/package=RVAideMemoire.
HO, L. S. T. and ANÉ, C. 2014. Intrinsic inference difficulties for trait evolution with
Ornstein-Uhlenbeck models. Methods in Ecology and Evolution, 5, 1133–1146.
HOLM, S. 1979. A simple sequentially rejective multiple test procedure. Scandinavian
Journal of Statistics, 6, 65–70.
HONE, D. W. E., DYKE, G. J., HADEN, M. and BENTON, M. J. 2008. Body size evolution
in Mesozoic birds. Journal of Evolutionary Biology, 21, 618–624.
HOPKINS, M. J. and GERBER, S. 2017. Morphological disparity. 1–12. In NUÑO DE LA
ROSA, L. and MÜLLER G. B. (eds.). Evolutionary Developmental Biology. Springer.
HOTELLING, H. 1933. Analysis of a complex of statistical variables into principal
components. Journal of Educational Psychology, 24, 417–441.

References
221
HUA, S. and JOUVE, S. 2004. A primitive marine gavialoid from the Paleocene of Morocco.
Journal of Vertebrate Paleontology, 24, 341–350.
HUA, S., BUFFETAUT, E., LEGALL, C. and ROGRON, P. 2007. Oceanosuchus boecensis
n. gen, n. sp., a marine pholidosaurid (Crocodylia, Mesosuchia) from the Lower
Cenomanian of Normandy (western France). Bulletin de la Société Géologique de
France, 178, 503–513.
HUGHES, M., GERBER, S. and WILLS, M. A. 2013. Clades reach highest morphological
disparity early in their evolution. Proceedings of the National Academy of Sciences, 110,
13875–13879.
HUNT, G. 2008a. Evolutionary patterns within fossil lineages: model-based assessment of
modes, rates, punctuations and process. 117–131. In BAMBACH, R. K. and KELLEY, P.
H. (eds.). From Evolution to Geobiology: Research Questions Driving Paleontology at
the Start of a New Century. The Paleontological Society Papers.
HUNT, G. 2008b. Gradual or pulsed evolution: when should punctuational explanations be
preferred?. Paleobiology, 34, 360–377.
HUNT, G. 2012. Measuring rates of phenotypic evolution and the inseparability of tempo and
mode. Paleobiology, 38, 351–373.
HUNT, G. and CARRANO, M. T. 2010. Models and methods for analyzing phenotypic
evolution in lineages and clades. 245–269. In ALROY, J. and HUNT, G. (eds.).
Quantitative Methods in Paleobiology. The Paleontological Society Papers.
HUNT, G., CRONIN, T. M. and ROY, K. 2005. Species–energy relationship in the deep sea:
a test using the Quaternary fossil record. Ecology Letters, 8, 739–747.

References
222
HUNT, G., HOPKINS, M. J. and LIDGARD, S. 2015. Simple versus complex models of trait
evolution and stasis as a response to environmental change. Proceedings of the National
Academy of Sciences, 112, 4885–4890.
HURLBURT, G. 1999. Comparison of body mass estimation techniques, using recent reptiles
and the pelycosaur Edaphosaurus boanerges. Journal of Vertebrate Paleontology, 19,
338–350.
HURLBURT, G. R., HECKERT, A. B. and FARLOW, J. O. 2003. Body mass estimates of
phytosaurs (Archosauria: Parasuchidae) from the Petrified Forest Formation (Chinle
Group: Revueltian) based on skull and limb bone measurements. New Mexico Museum of
Natural History and Science Bulletin, 24, 105–113.
HUTCHINSON, G. E. and MACARTHUR, R. H. 1959. A theoretical ecological model of size
distributions among species of animals. The American Naturalist, 93, 117–125.
HUTTENLOCKER, A. K. 2014. Body size reductions in nonmammalian eutheriodont
therapsids (Synapsida) during the end-Permian mass extinction. PLoS One, 9, e87553.
HUXLEY, J. S. 1932. Problems of relative growth. Johns Hopkins University Press.
IIJIMA, M. 2017. Assessment of trophic ecomorphology in non-alligatoroid crocodylians and
its adaptive and taxonomic implications. Journal of Anatomy, 231, 192–211.
IORDANSKY, N. N. 1973. The skull of the Crocodilia. 201–260. In GANS, C. and
PARSONS, T. (eds.). Biology of the Reptilia, Vol. 4. Academic Press.
INGRAM, T. 2015. Diversification of body shape in Sebastes rockfishes of the north-east
Pacific. Biological Journal of the Linnean Society, 116, 805–818.

References
223
INGRAM, T. and MAHLER, D. L. 2013. SURFACE: detecting convergent evolution from
comparative data by fitting Ornstein-Uhlenbeck models with stepwise Akaike
Information Criterion. Methods in Ecology and Evolution, 4, 416–425.
IRMIS, R. B., NESBITT, S. J. and SUES, H. D. 2013. Early Crocodylomorpha. 275–302. In.
NESBITT, S. J., DESOJO, J. B. and IRMIS, R. B. (eds.). Anatomy, phylogeny and
palaeobiology of early archosaurs and their kin. Geological Society of London, Special
Publications, 379.
JOHNSON, C. N. 2002. Determinants of loss of mammal species during the Late Quaternary
‘megafauna’ extinctions: life history and ecology, but not body size. Proceedings of the
Royal Society of London B, 269, 2221–2227.
JOUVE, S. 2005. A new description of the skull of Dyrosaurus phosphaticus (Thomas, 1893)
(Mesoeucrocodylia: Dyrosauridae) from the Lower Eocene of North Africa. Canadian
Journal of Earth Sciences, 42, 323–337.
JOUVE, S. 2009. The skull of Teleosaurus cadomensis (Crocodylomorpha; Thalattosuchia),
and phylogenetic analysis of Thalattosuchia. Journal of Vertebrate Paleontology, 29, 88–
102.
JOUVE, S. 2016. A new basal tomistomine (Crocodylia, Crocodyloidea) from Issel (Middle
Eocene; France): palaeobiogeography of basal tomistomines and palaeogeographic
consequences. Zoological Journal of the Linnean Society, 177, 165–182.
JOUVE, S., BOUYA, B. and AMAGHZAZ, M. 2005. A short-snouted dyrosaurid
(Crocodyliformes, Mesoeucrocodylia) from the Palaeocene of Morocco. Palaeontology,
48, 359–369.

References
224
JOUVE, S., IAROCHENE, M., BOUYA, B. and AMAGHZAZ, M. 2006. A new species of
Dyrosaurus (Crocodylomorpha, Dyrosauridae) from the early Eocene of Morocco:
phylogenetic implications. Zoological Journal of the Linnean Society, 148, 603–656.
JOUVE, S., BARDET, N., JALIL, N. E., SUBERBIOLA, X. P., BOUYA, B. and
AMAGHZAZ, M. 2008. The oldest African crocodylian: phylogeny, paleobiogeography,
and differential survivorship of marine reptiles through the Cretaceous-Tertiary
boundary. Journal of Vertebrate Paleontology, 28, 409–421.
JOUVE, S., BOUYA, B., AMAGHZAZ, M. and MESLOUH, S. 2015. Maroccosuchus
zennaroi (Crocodylia: Tomistominae) from the Eocene of Morocco: phylogenetic and
palaeobiogeographical implications of the basalmost tomistomine. Journal of Systematic
Palaeontology, 13, 421–445.
JUNGERS, W. L., FALSETTI, A. B. and WALL, C. E. 1995. Shape, relative size, and size‐
adjustments in morphometrics. American Journal of Physical Anthropology, 38, 137–
161.
KELLNER, A. W., PINHEIRO, A. E. and CAMPOS, D. A. 2014. A new sebecid from the
paleogene of Brazil and the crocodyliform radiation after the K-Pg boundary. PLoS One
9, e81386.
KHABBAZIAN, M., KRIEBEL, R., ROHE, K. and ANÉ, C. 2016. Fast and accurate
detection of evolutionary shifts in Ornstein–Uhlenbeck models. Methods in Ecology and
Evolution, 7, 811–824.
KLEY, N. J., SERTICH, J. J., TURNER, A. H., KRAUSE, D. W., O'CONNOR, P. M. and
GEORGI, J. A. 2010. Craniofacial morphology of Simosuchus clarki (Crocodyliformes:

References
225
Notosuchia) from the Late Cretaceous of Madagascar. Journal of Vertebrate
Paleontology, 30(sup1), 13–98.
KLINGENBERG, C. P. 1996. Multivariate allometry. 23–49. In MARCUS, L. F., CORTI,
M., LOY, A., NAYLOR, G. J. P. and SLICE, D. E. (eds.). Advances in Morphometrics.
Springer.
KLINGENBERG, C. P. 1998. Heterochrony and allometry: the analysis of evolutionary
change in ontogeny. Biological Reviews of the Cambridge Philosophical Society, 73, 79–
123.
KLINGENBERG, C. P. 2011. MorphoJ: an integrated software package for geometric
morphometrics. Molecular Ecology Resouces, 11, 353–357.
KLINGENBERG, C. P. 2016. Size, shape, and form: concepts of allometry in geometric
morphometrics. Development Genes and Evolution, 226, 113–137.
KLINGENBERG, C. P. and MCINTYRE, G. S. 1998. Geometric morphometrics of
developmental instability: analyzing patterns of fluctuating asymmetry with Procrustes
methods. Evolution, 52, 1363–1375.
KLINGENBERG, C. P., DUTTKE, S., WHELAN, S. and KIM, M. 2012. Developmental
plasticity, morphological variation and evolvability: a multilevel analysis of
morphometric integration in the shape of compound leaves. Journal of Evolutionary
Biology, 25, 115–129.
KOBAYASHI, Y., TOMIDA, Y., KAMEI, T. and EGUCHI, T. 2006. Anatomy of a Japanese
tomistomine crocodylian, Toyotamaphimeia machikanensis (Kamei et Matsumoto, 1965),
from the middle Pleistocene of Osaka Prefecture: the reassessment of its phylogenetic
status within Crocodylia. National Science Museum Monographs, 35, 1-121.

References
226
KOYABU, D., WERNEBURG, I., MORIMOTO, N., ZOLLIKOFER, C. P., FORASIEPI, A.
M., ENDO, H., KIMURA, J., OHDACHI, S. D., SON, N. T. and SANCHEZ-
VILLAGRA, M. R. 2014. Mammalian skull heterochrony reveals modular evolution and
a link between cranial development and brain size. Nature Communications, 5, 3625.
KREBS, B. 1967. Der Jura-Krokodilier Machimosaurus H. v. Meyer. Paläontologische
Zeitschrift, 41, 46–59.
LANGSTON W. 1973. The crocodilian skull in historical perspective. 263–284. In GANS, C.
and PARSONS, T. S. (eds.). Biology of the Reptilia. Academic Press.
LARSSON, H. C. and SUES, H. D. 2007. Cranial osteology and phylogenetic relationships of
Hamadasuchus rebouli (Crocodyliformes: Mesoeucrocodylia) from the Cretaceous of
Morocco. Zoological Journal of the Linnean Society, 149, 533–567.
LAUDER, G. V. 1981. Form and function: structural analysis in evolutionary morphology.
Paleobiology, 7, 430–442.
LAUPRASERT, K., CUNY, G., BUFFETAUT, E., SUTEETHORN, V. and THIRAKHUPT,
K. 2007. Siamosuchus phuphokensis, a new goniopholidid from the Early Cretaceous
(ante-Aptian) of northeastern Thailand. Bulletin de la Société Géologique de France, 178,
201–216.
LAURIN, M. 2004. The evolution of body size, Cope's rule and the origin of amniotes.
Systematic Biology, 53, 594–622.
LEARDI, J. M., FIORELLI, L. E. and GASPARINI, Z. 2015a. Redescription and
reevaluation of the taxonomical status of Microsuchus schilleri (Crocodyliformes:
Mesoeucrocodylia) from the Upper Cretaceous of Neuquén, Argentina. Cretaceous
Research, 52, 153–166.

References
227
LEARDI, J. M., POL, D., NOVAS, F. E. and SUÁREZ RIGLOS, M. 2015b. The postcranial
anatomy of Yacarerani boliviensis and the phylogenetic significance of the notosuchian
postcranial skeleton. Journal of Vertebrate Paleontology, 35, e995187.
LEARDI, J. M., POL, D. and CLARK, J. M. 2017. Detailed anatomy of the braincase of
Macelognathus vagans Marsh, 1884 (Archosauria, Crocodylomorpha) using high
resolution tomography and new insights on basal crocodylomorph phylogeny. PeerJ, 5,
e2801.
LECUONA, A., EZCURRA, M. D. and IRMIS, R. B. 2016. Revision of the early
crocodylomorph Trialestes romeri (Archosauria, Suchia) from the lower Upper Triassic
Ischigualasto Formation of Argentina: one of the oldest-known crocodylomorphs. Papers
in Palaeontology, 2, 585–622.
LEE, M. S., CAU, A., NAISH, D. and DYKE, G. J. 2014. Sustained miniaturization and
anatomical innovation in the dinosaurian ancestors of birds. Science, 345, 562–566.
LEE, M. S. and YATES, A. M. 2018. Tip-dating and homoplasy: reconciling the shallow
molecular divergences of modern gharials with their long fossil record. Proceedings of
the Royal Society of London B, 285, 20181071.
LELE, S. and RICHTSMEIER, J. T. 1991. Euclidean distance matrix analysis: A coordinate‐
free approach for comparing biological shapes using landmark data. American Journal of
Physical Anthropology, 86, 415–427.
LELE, S. R. and RICHTSMEIER, J. T. 2001. An Invariant Approach to Statistical Analysis of
Shapes. Chapman and Hall/CRC.
References
228
LESTREL, P. E. 1982. A Fourier analytic procedure to describe complex morphological
shapes. 393–409. In Dixon, A. and Sarnat B. (eds.). Factors and mechanisms influencing
bone growth. Alan R. Liss.
LINNERT, C., ROBINSON, S. A., LEES, J. A., BOWN, P. R., PÉREZ-RODRÍGUEZ, I.,
PETRIZZO, M. R., FALZONI, F., LITTLER, K., ARZ, J. A. and RUSSELL, E. E. 2014.
Evidence for global cooling in the Late Cretaceous. Nature Communications, 5, 4194.
LLOYD, G. T., BAPST, D. W., FRIEDMAN, M. and DAVIS, K. E. 2016. Probabilistic
divergence time estimation without branch lengths: dating the origins of dinosaurs, avian
flight and crown birds. Biology Letters, 12, 20160609.
LONGRICH, N. R., BHULLAR, B. A. S. and GAUTHIER, J. A. 2012. Mass extinction of
lizards and snakes at the Cretaceous–Paleogene boundary. Proceedings of the National
Academy of Sciences, 109, 21396–21401.
LYDEKKER, R. 1888. Catalogue of the Fossil Reptilia and Amphibia in the British Museum
(Natural History), Part 1. Containing the orders Ornithosauria, Crocodilia, Dinosauria,
Squamata, Rhynchocephalia, and Proterosauria. Trustees of the British Museum of
Natural History, London.
MACFADDEN, B. J. 1986. Fossil horses from “Eohippus”(Hyracotherium) to Equus: scaling,
Cope's Law, and the evolution of body size. Paleobiology, 12, 355–369.
MADDISON, W. P. and MADDISON, D. R. 2018. Mesquite: a Modular System for
Evolutionary Analysis. Version 3.51. Available at: http://www.mesquiteproject.org.
MAHLER, D. L. and INGRAM, T. 2014. Phylogenetic comparative methods for studying
clade-wide convergence. 425–450. In GARAMSZEGI, L. Z. (ed.). Modern Phylogenetic
Comparative Methods and their Application in Evolutionary Biology. Springer.

References
229
MAHLER, D. L., INGRAM, T., REVELL, L. J. and LOSOS, J. B. 2013. Exceptional
convergence on the macroevolutionary landscape in island lizard radiations. Science, 341,
292–295.
MANNION, P. D., BENSON, R. B., CARRANO, M. T., TENNANT, J. P., JUDD, J. and
BUTLER, R. J. 2015. Climate constrains the evolutionary history and biodiversity of
crocodylians. Nature Communications, 6, 8438.
MARCUS, L. F. 1990. Traditional morphometrics. 77–122. In ROHLF, F. J. and
BOOKSTEIN, F. L. (eds.). Proceedings of the Michigan Morphometrics Workshop.
University of Michigan Museum of Zoology Special Publication, 1990.
MARINHO, T. S. and CARVALHO, I. S. 2009. An armadillo-like sphagesaurid
crocodyliform from the Late Cretaceous of Brazil. Journal of South American Earth
Sciences, 27, 36–41.
MARKWICK, P. J. 1998a. Crocodilian diversity in space and time: the role of climate in
paleoecology and its implication for understanding K/T extinctions. Paleobiology, 24,
470–497.
MARKWICK, P. J. 1998b. Fossil crocodilians as indicators of Late Cretaceous and Cenozoic
climates: implications for using palaeontological data in reconstructing palaeoclimate.
Palaeogeography, Palaeoclimatology, Palaeoecology, 137, 205–271.
MARSOLA, J. C. A., BATEZELLI, A., MONTEFELTRO, F. C., GRELLET-TINNER, G.
and LANGER, M. C. 2016. Palaeoenvironmental characterization of a crocodilian
nesting site from the Late Cretaceous of Brazil and the evolution of crocodyliform
nesting strategies. Palaeogeography, Palaeoclimatology, Palaeoecology, 457, 221–232.

References
230
MARTIN, J. E. 2007. New material of the Late Cretaceous globidontan Acynodon
iberoccitanus (Crocodylia) from southern France. Journal of Vertebrate Paleontology,
27, 362–372.
MARTIN, J. E 2010. A new species of Diplocynodon (Crocodylia, Alligatoroidea) from the
Late Eocene of the Massif Central, France, and the evolution of the genus in the climatic
context of the Late Palaeogene. Geological Magazine, 147, 596–610.
MARTIN, J. E. and VINCENT, P. 2013. New remains of Machimosaurus hugii von Meyer,
1837 (Crocodilia, Thalattosuchia) from the Kimmeridgian of Germany. Fossil Record,
16, 179–196.
MARTIN, J. E. and DE LAPPARENT DE BROIN, F. A. 2016. A miniature notosuchian with
multicuspid teeth from the Cretaceous of Morocco. Journal of Vertebrate Paleontology,
36, e1211534.
MARTIN, J. E., LAUPRASERT, K., BUFFETAUT, E., LIARD, R. and SUTEETHORN, V.
2014. A large pholidosaurid in the Phu Kradung Formation of north-eastern Thailand.
Palaeontology, 57, 757–769.
MARTIN, J. E., DELFINO, M. and SMITH, T. 2016. Osteology and affinities of Dollo's
goniopholidid (Mesoeucrocodylia) from the Early Cretaceous of Bernissart, Belgium.
Journal of Vertebrate Paleontology, 36, e1222534.
MARTINELLI, A. G. 2013. Comahuesuchus brachybuccalis (Archosauria, Crocodyliformes)
from the Late Cretaceous of Río Negro Province (Argentina). Ameghiniana, 40, 559–572.
MARTINELLI , A. G. and TEIXEIRA, V. P. 2015. The late Cretaceous vertebrate record
from the Bauru group in the Triângulo Mineiro, southeastern Brazil. Boletín Geológico y
Minero, 126, 129–158.

References
231
MARTINS, E. P. and HANSEN, T. F. 1997. Phylogenies and the comparative method: a
general approach to incorporating phylogenetic information into the analysis of
interspecific data. The American Naturalist, 149, 646–667.
MARX, F. G. and UHEN, M. D. 2010. Climate, critters, and cetaceans: Cenozoic drivers of
the evolution of modern whales. Science, 327, 993–996.
MAYR, E. 1982. The growth of Biological Thought: Diversity, Evolution, and Inheritance.
Harvard University Press.
MCCLAIN, C. R. and BOYER, A. G. 2009. Biodiversity and body size are linked across
metazoans. Proceedings of the Royal Society of London B, 276, 2209–2215.
MCCOY, M. W., BOLKER, B. M., OSENBERG, C. W., MINER, B. G. and VONESH, J. R.
2006. Size correction: comparing morphological traits among populations and
environments. Oecologia, 148, 547–554.
MCCURRY, M. R., EVANS, A. R., FITZGERALD, E. M., ADAMS, J. W., CLAUSEN, P.
D. and MCHENRY, C. R. 2017a. The remarkable convergence of skull shape in
crocodilians and toothed whales. Proceedings of the Royal Society of London B, 284,
20162348.
MCCURRY, M. R., WALMSLEY, C. W., FITZGERALD, E. M. G. and MCHENRY, C. R.
2017b. The biomechanical consequences of longirostry in crocodilians and odontocetes.
Journal of Biomechanics, 56, 61–70.
MCHENRY, C. R., CLAUSEN, P. D., DANIEL, W. J., MEERS, M. B. and PENDHARKAR,
A. 2006. Biomechanics of the rostrum in crocodilians: a comparative analysis using
finite-element modeling. The Anatomical Record Part A, 288A, 827–849.

References
232
MCKINNEY, M. L. 1988. Classifying heterochrony: allometry, size, and time. 17–34. In
MCKINNEY, M. L. (ed.). Heterochrony in Evolution. A Multidisciplinary Approach.
Plenum Press.
MCKINNEY, M. L. 1990a. Trends in body size evolution. 75–118. In MCNAMARA, K. J.
(ed.). Evolutionary Trends. The University of Arizona Press.
MCKINNEY, M. L. 1990b. Classifying and analyzing evolutionary trends. 28–58. In
MCNAMARA, K. J. (ed.). Evolutionary Trends. The University of Arizona Press.
MCNAMARA, K. J. 1982. Heterochrony and phylogenetic trends. Paleobiology, 8, 130–142.
MCNAMARA, K. J. 1986. A guide to the nomenclature of heterochrony. Journal of
Paleontology, 60, 4–13.
MCNAMARA, K. J. 1990. The role of heterochrony in evolutionary trends. 59–74. In
MCNAMARA, K. J. (ed.). Evolutionary Trends. The University of Arizona Press.
MCNAMARA, K. J. and MCKINNEY, M. L. 2005. Heterochrony, disparity, and
macroevolution. Paleobiology, 31, 17–26.
MCSHEA, D. W. 1994. Mechanisms of large-scale evolutionary trends. Evolution, 48, 1747–
1763.
MEDINA, C. J. 1976. Crocodilians from the Late Tertiary of northwestern Venezuela:
Melanosuchus fisheri sp. nov. Breviora, 438, 1–14.
MÉNDEZ, A. H., NOVAS, F. E. and IORI FV. 2012. First record of Megaraptora
(Theropoda, Neovenatoridae) from Brazil. Comptes Rendus Palevol, 11, 251–256.
MERCIER, J. 1933. Contribution à l’étude des Métriorhynchidés (crocodiliens). Annales de
Paléontologie, 22, 99–119.

References
233
MEUNIER, L. and LARSSON, H. C. 2017. Revision and phylogenetic affinities of Elosuchus
(Crocodyliformes). Zoological Journal of the Linnean Society, 179, 169–200.
MITTEROECKER, P. and GUNZ, P. 2009. Advances in geometric morphometrics.
Evolutionary Biology, 36, 235–247.
MONTEFELTRO, F. C., LARSSON, H. C. and LANGER, M. C. 2011. A new baurusuchid
(Crocodyliformes, Mesoeucrocodylia) from the Late Cretaceous of Brazil and the
phylogeny of Baurusuchidae. PLoS One 6, e21916.
MONTEFELTRO, F. C., LARSSON, H. C. FRANCA, M. A. and LANGER, M. C. 2013. A
new neosuchian with Asian affinities from the Jurassic of northeastern Brazil.
Naturwissenschaften, 100, 835–841.
MONTEFELTRO, F. C., ANDRADE, D. V. and LARSSON, H. C. 2016. The evolution of
the meatal chamber in crocodyliforms. Journal of Anatomy, 228, 838–863.
MONTEIRO, L. R. 1999. Multivariate regression models and geometric morphometrics: the
search for causal factors in the analysis of shape. Systematic Biology, 48, 192–199.
MONTEIRO, L. R. 2013. Morphometrics and the comparative method: studying the
evolution of biological shape. Hystrix, the Italian Journal of Mammalogy, 24, 25–32.
MONTEIRO, L. R., CAVALCANTI, M. J. and SOMMER III, H. J. S. 1997. Comparative
ontogenetic shape changes in the skull of Caiman species (Crocodylia, Alligatoridae).
Journal of Morphology, 231, 53–62.
MOTANI, R. 2001. Estimating body mass from silhouettes: testing the assumption of
elliptical body cross-sections. Paleobiology, 27, 735–750.

References
234
NARVÁEZ, I., BROCHU, C. A., ESCASO, F., PÉREZ-GARCÍA, A. and ORTEGA, F.
2015. New crocodyliforms from southwestern Europe and definition of a diverse clade of
European Late Cretaceous basal eusuchians. PLoS One, 10, e0140679.
NARVÁEZ, I., BROCHU, C. A., ESCASO, F., PÉREZ-GARCÍA, A. and ORTEGA, F.
2016. New Spanish Late Cretaceous eusuchian reveals the synchronic and sympatric
presence of two allodaposuchids. Cretaceous Research, 65, 112–125.
NESBITT, S. J. 2011. The early evolution of archosaurs: relationships and the origin of major
clades. Bulletin of the American Museum of Natural History, 352, 1–292.
NEWELL, N. D. 1949. Phyletic size increase, an important trend illustrated by fossil
invertebrates. Evolution, 3, 103–124.
NOVAS, F. E., PAIS, D. F., POL, D., CARVALHO, I. D. S., SCANFERLA, A., MONES, A.
and RIGLOS, M. S. 2009. Bizarre notosuchian crocodyliform with associated eggs from
the Upper Cretaceous of Bolivia. Journal of Vertebrate Paleontology, 29, 1316–1320.
O'CONNOR, P. M., SERTICH, J. J. W., STEVENS, N. J., ROBERTS, E. M., GOTTFRIED,
M. D., HIERONYMUS, T. L., JINNAH, Z. A., RIDGELY, R., NGASALA, S. E. and
TEMBA, J. 2010. The evolution of mammal-like crocodyliforms in the Cretaceous
Period of Gondwana. Nature, 466, 748–751.
OPENSHAW, G. H., D'AMORE, D. C., VIDAL-GARCÍA, M. and KEOGH, .J. S. 2016.
Combining geometric morphometric analyses of multiple 2D observation views improves
interpretation of evolutionary allometry and shape diversification in monitor lizard
(Varanus) crania. Biological Journal of the Linnean Society, 120, 539–552.

References
235
ORME, C. D. L., FRECKLETON, R., THOMAS, G., PETZOLDT, T., FRITZ, S., ISAAC, N.
and PEARSE, W. 2018. CAPER: comparative analyses of phylogenetics and evolution in
R. R package version 1.0.1. https://CRAN.R-project.org/package=caper.
ORTEGA, F., GASPARINI, Z., BUSCALIONI, A. D. and CALVO, J. O. 2000. A new
species of Araripesuchus (Crocodylomorpha, Mesoeucrocodylia) from the lower
Cretaceous of Patagonia (Argentina). Journal of Vertebrate Paleontology, 20, 57–76.
ŐSI, A. 2014. The evolution of jaw mechanism and dental function in heterodont
crocodyliforms. Historical Biology, 26, 279–414.
ŐSI, A., CLARK, J. M. and WEISHAMPEL, D. B. 2007. First report on a new basal
eusuchian crocodyliform with multicusped teeth from the Upper Cretaceous (Santonian)
of Hungary. Neues Jahrbuch für Geologie und Paläontologie-Abhandlungen, 243, 169–
177.
ŐSI, A., YOUNG, M. T., GALÁCZ, A. and RABI, M. 2018. A new large-bodied
thalattosuchian crocodyliform from the Lower Jurassic (Toarcian) of Hungary, with
further evidence of the mosaic acquisition of marine adaptations in Metriorhynchoidea.
PeerJ, 6, e4668.
PAGEL, M. 1999. Inferring the historical patterns of biological evolution. Nature, 401, 877–
884.
PAGEL, M. 2002. Modelling the evolution of continuously varying characters on
phylogenetic trees. 269–286. In MACLEOD, N. and FOREY, P. L. (eds.). Morphology,
Shape and Phylogeny. Taylor & Francis.

References
236
PARRILLA-BEL, J., YOUNG, M. T., MORENO-AZANZA, M. and CANUDO, J. I. 2013.
The first metriorhynchid crocodylomorph from the Middle Jurassic of Spain, with
implications for evolution of the subclade Rhacheosaurini. PLoS One, 8, e54275.
PENNELL, M. W. and HARMON, L. J. 2013. An integrative view of phylogenetic
comparative methods: connections to population genetics, community ecology, and
paleobiology. Annals of the New York Academy of Sciences, 1289, 90–105.
PETERS, R. H. 1986. The Ecological Implications of Body Size. Cambridge University Press.
PIERCE, S. E., ANGIELCZYK, K. D. and RAYFIELD, E. J. 2008. Patterns of morphospace
occupation and mechanical performance in extant crocodilian skulls: a combined
geometric morphometric and finite element modeling approach. Journal of Morphology,
269, 840–864.
PIERCE, S. E., ANGIELCZYK, K. D. and RAYFIELD, E. J. 2009a. Morphospace
occupation in thalattosuchian crocodylomorphs: skull shape variation, species delineation
and temporal patterns. Palaeontology, 52, 1057–1097.
PIERCE, S. E., ANGIELCZYK, K. D. and RAYFIELD, E. J. 2009b. Shape and mechanics in
thalattosuchian (Crocodylomorpha) skulls: implications for feeding behaviour and niche
partitioning. Journal of Anatomy, 215, 555–576.
PINHEIRO, J., BATES, D., DEBROY, S., SARKAR, D. and R CORE TEAM. 2017. nlme:
linear and nonlinear mixed effects models. R package version 3.1–131. https://CRAN.R-
project.org/package=nlme.
PIRAS, P., DELFINO, M., DEL FAVERO, L. and KOTSAKIS, T. 2007. Phylogenetic
position of the crocodylian Megadontosuchus arduini and tomistomine
palaeobiogeography. Acta Palaeontologica Polonica, 52, 315–328.

References
237
PIRAS, P., TERESI, L., BUSCALIONI, Á. D. and CUBO, J. 2009. The shadow of forgotten
ancestors differently constrains the fate of Alligatoroidea and Crocodyloidea. Global
Ecology and Biogeography, 18, 30–40.
PIRAS, P., COLANGELO, P., ADAMS, D. C., BUSCALIONI, Á. D., CUBO, J.,
KOTSAKIS, T., MELORO, C. and RAIA, P. 2010. The Gavialis–Tomistoma debate: the
contribution of skull ontogenetic allometry and growth trajectories to the study of
crocodylian relationships. Evolution & Development, 12, 568–579.
PIRAS, P., BUSCALIONI, A. D., TERESI, L., RAIA, P., SANSALONE, G., KOTSAKIS, T.
and CUBO, J. 2014. Morphological integration and functional modularity in the
crocodilian skull. Integrative Zoology, 9, 498–516.
PLATT, S. G., RAINWATER, T. R., THORBJARNARSON, J. B., FINGER, A. G.,
ANDERSON, T. A. and MCMURRY, S. T. 2009. Size estimation, morphometrics, sex
ratio, sexual size dimorphism, and biomass of Morelet's crocodile in northern Belize.
Caribbean Journal of Science, 45, 80–93.
PLATT, S. G., RAINWATER, T. R., THORBJARNARSON, J. B. and MARTIN, D. 2011.
Size estimation, morphometrics, sex ratio, sexual size dimorphism, and biomass of
Crocodylus acutus in the coastal zone of Belize. Salamandra, 47, 179–192.
POL, D. 2003. New remains of Sphagesaurus huenei (Crocodylomorpha: Mesoeucrocodylia)
from the Late Cretaceous of Brazil. Journal of Vertebrate Paleontology, 23, 817–831.
POL, D. 2005. Postcranial remains of Notosuchus terrestris Woodward (Archosauria:
Crocodyliformes) from the Upper Cretaceous of Patagonia, Argentina. Ameghiniana, 42,
21–38.
References
238
POL, D. and NORELL, M. A. 2004. A new gobiosuchid crocodyliform taxon from the
Cretaceous of Mongolia. American Museum Novitates, 3458, 1–31.
POL, D. and GASPARINI, Z. 2009. Skull anatomy of Dakosaurus andiniensis
(Thalattosuchia: Crocodylomorpha) and the phylogenetic position of Thalattosuchia.
Journal of Systematic Palaeontology, 7, 163–197.
POL, D. and LEARDI, J. M. 2015. Diversity patterns of Notosuchia (Crocodyliformes,
Mesoeucrocodylia) during the Cretaceous of Gondwana. 172–186. In FERNÁNDEZ, M.
and HERRERA, Y. (eds.). Reptiles Extintos – Volumen en Homenaje a Zulma Gasparini.
Publicación Electrónica de la Asociación Paleontológica Argentina, Buenos Aires,
Argentina.
POL, D., JI, S. A., CLARK, J. M. and CHIAPPE, L. M. 2004. Basal crocodyliforms from the
Lower Cretaceous Tugulu Group (Xinjiang, China), and the phylogenetic position of
Edentosuchus. Cretaceous Research, 25, 603–622.
POL, D., TURNER, A. H. and NORELL, M. A. 2009. Morphology of the Late Cretaceous
crocodylomorph Shamosuchus djadochtaensis and a discussion of neosuchian phylogeny
as related to the origin of Eusuchia. Bulletin of the American Museum of Natural History,
324, 1–103.
POL, D., LEARDI, J. M., LECUONA, A. and KRAUSE, M. 2012. Postcranial anatomy of
Sebecus icaeorhinus (Crocodyliformes, Sebecidae) from the Eocene of Patagonia.
Journal of Vertebrate Paleontology, 32, 328–354.
POL, D., RAUHUT, O. W., LECUONA, A., LEARDI, J. M., XU, X. and CLARK, J. M.
2013. A new fossil from the Jurassic of Patagonia reveals the early basicranial evolution
and the origins of Crocodyliformes. Biological Reviews, 88, 862–872.

References
239
POL, D., NASCIMENTO, P. M., CARVALHO, A. B., RICCOMINI, C., PIRES-
DOMINGUES, R. A. and ZAHER, H. 2014. A new notosuchian from the Late
Cretaceous of Brazil and the phylogeny of advanced notosuchians. PLoS One, 9, e93105.
PRENTICE, K. C., RUTA, M. and BENTON, M. J. 2011. Evolution of morphological
disparity in pterosaurs. Journal of Systematic Palaeontology, 9, 337–353.
PRICE, L. I. 1945. A new reptil from the Cretaceous of Brazil. Divisão de Geologia e
Mineralogia, Notas Preliminares e Estudos, 25, 1–8.
PRICE, S. A. and HOPKINS, S. S. B. 2015. The macroevolutionary relationship between diet
and body mass across mammals. Biological Journal of the Linnean Society, 115, 173–
184.
PROKOPH, A., SHIELDS, G. A. and VEIZER, J. 2008. Compilation and time-series analysis
of a marine carbonate δ18O, δ13C, 87Sr/86Sr and δ34S database through Earth history.
Earth-Science Reviews, 87, 113–133.
PUÉRTOLAS-PASCUAL, E., CANUDO, J. I. and CRUZADO-CABALLERO, P. 2011. A
new crocodylian from the Late Maastrichtian of Spain: implications for the initial
radiation of crocodyloids. PLoS One, 6, e20011.
PUÉRTOLAS-PASCUAL, E., CANUDO, J. I. and MORENO-AZANZA, M. 2014. The
eusuchian crocodylomorph Allodaposuchus subjuniperus sp. nov., a new species from the
latest Cretaceous (upper Maastrichtian) of Spain. Historical Biology, 26, 91–109.
PURVIS, A., GITTLEMAN, J. L., COWLISHAW, G. ans MACE, G. M. 2000. Predicting
extinction risk in declining species. Proceedings of the Royal Society of London B, 267,
1947–1952.
References
240
R CORE TEAM. 2017. R: A language and environment for statistical computing. v. 3.4.1. R
Foundation for Statistical Computing, Vienna, Austria. https://www.R-project.org/.
R CORE TEAM. 2018. R: A language and environment for statistical computing. v. 3.5.1. R
Foundation for Statistical Computing, Vienna, Austria. URL https://www.R-project.org/.
RAUP, D. M. 1972. Taxonomic diversity during the Phanerozoic. Science, 177, 1065–1071.
RAUP, D. M. 1988. Testing the fossil record for evolutionary progress. 293–317. In Nitecki,
M. H. (ed.). Evolutionary Progress. University of Chicago Press.
RAUP, D. M. and SEPKOSKI, J. J. 1982. Mass extinctions in the marine fossil record.
Science, 215, 1501–1503.
REVELL, L. J. 2009. Size-correction and principal components for interspecific comparative
studies. Evolution, 63, 3258–3268.
REVELL, L. J. 2012. phytools: an R package for phylogenetic comparative biology (and
other things). Methods in Ecology and Evolution, 3, 217–223.
RICE, W. R. 1989. Analyzing tables of statistical tests. Evolution, 43, 223–225.
RIFF. D. and KELLNER AWA. 2011. Baurusuchid crocodyliforms as theropod mimics:
clues from the skull and appendicular morphology of Stratiotosuchus maxhechti (Upper
Cretaceous of Brazil). Zoological Journal of the Linnean Society, 163, 37–56.
RISTEVSKI, J., YOUNG, M. T., ANDRADE, M. B. and HASTINGS, A. K. 2018. A new
species of Anteophthalmosuchus (Crocodylomorpha, Goniopholididae) from the Lower
Cretaceous of the Isle of Wight, United Kingdom, and a review of the genus. Cretaceous
Research, 84, 340–383.

References
241
ROBINSON, C. and TERHUNE, C. E. 2017. Error in geometric morphometric data
collection: Combining data from multiple sources. American Journal of Physical
Anthropology, 164, 62–75.
ROHLF, F. J. 2001. Comparative methods for the analysis of continuous variables: geometric
interpretations. Evolution, 55, 2143–2160.
ROHLF, F. J. 2015. The tps series of software. Hystrix, the Italian Journal of Mammalogy,
26, 9–12
ROHLF, F. J. and BOOKSTEIN, F. L. 1987. A comment on shearing as a method for “size
correction”. Systematic Zoology, 36, 356–367.
ROHLF, F. J. and SLICE, D. E. 1990. Extensions of the Procrustes method for the optimal
superimposition of landmarks. Systematic Biology, 39, 40–59.
ROHLF, F. J. and MARCUS, L. F. 1993. A revolution in morphometrics. Trends in Ecology
& Evolution, 8, 129–129.
ROMER, A. S. and PRICE, L. W. 1940. Review of the Pelycosauria. Geological Society of
America, Special Papers, 28, 1–534.
ROSS, J. P. 1998. Crocodiles: Status Survey and Conservation Action Plan. IUCN/SSC
Crocodile Specialist Group.
RUSSELL, E. S. 1916. Form and function: A Contribution to the History of Animal
Morphology. John Murray.
RUSSELL, A. P. and WU, X. 1997. The Crocodylomorpha at and between geological
boundaries. Zoology, 100, 164–182.

References
242
RUSSO, J., MATEUS, O., BALBINO, A. and MARZOLA, M. 2014. Crocodylomorph eggs
and eggshells from the Lourinhã Fm. (Upper Jurassic), Portugal. Comunicações
Geológicas, 101, 563–566.
SAARINEN, J. J, BOYER, A. G., BROWN, J. H., COSTA, D. P., ERNEST, S. M., EVANS,
A. R., FORTELIUS, M., GITTLEMAN, J. L., HAMILTON, M. J., HARDING, L. E.,
LINTULAAKSO, K., LYONS, S. K., OKIE, J. G., SIBLY, R. M., STEPHENS, P. R.,
THEODOR, J., UHEN, M. D. and SMITH, F. A. 2014. Patterns of maximum body size
evolution in Cenozoic land mammals: eco-evolutionary processes and abiotic forcing.
Proceedings of the Royal Society of London B, 281, 20132049.
SADLEIR, R. W. and MAKOVICKY, P. J. 2008. Cranial shape and correlated characters in
crocodilian evolution. Journal of Evolutionary Biology, 21, 1578–1596.
SALAS-GISMONDI, R., FLYNN, J. J., BABY, P., TEJADA-LARA, J. V., WESSELINGH,
F. P. and ANTOINE, P. O. 2015. A Miocene hyperdiverse crocodylian community
reveals peculiar trophic dynamics in proto-Amazonian mega-wetlands. Proceedings of
the Royal Society of London B, 282, 20142490.
SALAS-GISMONDI, R., FLYNN, J. J., BABY, P., TEJADA-LARA, J. V., CLAUDE, J. and
ANTOINE, P. O. 2016. A new 13 million year old gavialoid crocodylian from proto-
Amazonian mega-wetlands reveals parallel evolutionary trends in skull shape linked to
longirostry. PLoS One, 11, e0152453.
SALISBURY, S. W., MOLNAR, R. E., FREY, E. and WILLIS, P. M. 2006. The origin of
modern crocodyliforms: new evidence from the Cretaceous of Australia. Proceedings of
the Royal Society of London B, 273, 2439–2448.
References
243
SCHEYER, T. M., AGUILERA, O. A., DELFINO, M., FORTIER, D. C., CARLINI, A. A.,
SÁNCHEZ, R., CARRILLO-BRICEÑO, J. D., QUIROZ, L. and SÁNCHEZ-
VILLAGRA, M. R. 2013. Crocodylian diversity peak and extinction in the late Cenozoic
of the northern Neotropics. Nature Communications, 4, 1907.
SCHMIDT-NIELSEN, K. 1984. Scaling: Why is Animal Size so Important?. Cambridge
University Press.
SCHOCH, R. R. 2010. Heterochrony: the interplay between development and ecology
exemplified by a Paleozoic amphibian clade. Paleobiology, 36, 318–334.
SCHWARZ, D., RADDATZ, M. and WINGS, O. 2017. Knoetschkesuchus langenbergensis
gen. nov. sp. nov., a new atoposaurid crocodyliform from the Upper Jurassic Langenberg
Quarry (Lower Saxony, northwestern Germany), and its relationships to Theriosuchus.
PLoS One, 12, e0160617.
SELLERS, W. I., HEPWORTH-BELL, J., FALKINGHAM, P. L., BATES, K. T.,
BRASSEY, C. A., EGERTON, V. M. and MANNING, P. L. 2012. Minimum convex
hull mass estimations of complete mounted skeletons. Biology Letters, 8, 842–845.
SEPKOSKI, J. J. 1978. A kinetic model of Phanerozoic taxonomic diversity I. Early
Phanerozoic families and multiple equilibria. Paleobiology, 4, 223–251.
SEPKOSKI, J. J. 1979. A kinetic model of Phanerozoic taxonomic diversity II. Early
Phanerozoic families and multiple equilibria. Paleobiology, 5, 222–251.
SEPKOSKI, J. J. 1981. A factor analytic description of the Phanerozoic marine fossil record.
Paleobiology, 7, 36–53.
SEPKOSKI, J. J. 1984. A kinetic model of Phanerozoic taxonomic diversity II. Early
Phanerozoic families and multiple equilibria. Paleobiology, 10, 246–267.

References
244
SEPKOSKI, D. 2012. Rereading the Fossil Record: the Growth of Paleobiology as an
Eevolutionary Discipline. University of Chicago Press.
SEPKOSKI JR, J. J., BAMBACH, R. K., RAUP, D. M. and VALENTINE, J. W. 1981.
Phanerozoic marine diversity and the fossil record. Nature, 293, 435–437.
SERENO, P. C. 2005. The logical basis of phylogenetic taxonomy. Systematic Biology, 54,
595–619.
SERENO, P. and LARSSON. H. 2009. Cretaceous crocodyliforms from the Sahara. ZooKeys,
28, 1–143.
SERENO, P. C., LARSSON, H. C., SIDOR, C. A. and GADO, B. 2001. The giant
crocodyliform Sarcosuchus from the Cretaceous of Africa. Science, 294, 1516–1519.
SERENO, P., SIDOR, C. A., LARSSON, H. C. E. and GADO, B. 2003. A new notosuchian
from the Early Cretaceous of Niger. Journal of Vertebrate Paleontology, 23, 477–482.
SERTICH, J. J. W. and O’CONNOR, P. M. 2014. A new crocodyliform from the middle
Cretaceous Galula Formation, southwestern Tanzania. Journal of Vertebrate
Paleontology, 34, 576–596.
SHAN, H. Y., WU, X. C., CHENG, Y. N. and SATO, T. 2017. Maomingosuchus petrolica, a
restudy of “Tomistoma” petrolica Yeh, 1958. Palaeoworld, 26, 672–690.
SHEA, B. T. 1983. Allometry and heterochrony in the African apes. American Journal of
Physical Anthropology, 62, 275–289.
SHEARER, B. M., COOKE, S. B., HALENAR, L. B., REBER, S. L., PLUMMER, J. E.,
DELSON, E. and TALLMAN, M. 2017. Evaluating causes of error in landmark-based
data collection using scanners. PLoS One, 12, e0187452.

References
245
SIDLAUSKAS, B. 2008. Continuous and arrested morphological diversification in sister
clades of characiform fishes: a phylomorphospace approach. Evolution, 62, 3135–3156.
SIMPSON, G. G. 1944. Tempo and Mode in Evolution. Columbia University Press.
SIMPSON, G. G. 1953. Major Features of Evolution. Columbia University Press.
SLATER, G. J. 2013. Phylogenetic evidence for a shift in the mode of mammalian body size
evolution at the Cretaceous-Palaeogene boundary. Methods in Ecology and Evolution, 4,
734–744.
SLATER, G. J. 2015. Iterative adaptive radiations of fossil canids show no evidence for
diversity-dependent trait evolution. Proceedings of the National Academy of Sciences,
112, 4897–4902.
SLATER, G. J., HARMON, L. J. and ALFARO, M. E. 2012. Integrating fossils with
molecular phylogenies improves inference of trait evolution. Evolution, 66, 3931–3944.
SMITH, E. N. 1976. Heating and cooling rates of the American alligator, Alligator
mississippiensis. Physiological Zoology, 49, 37–48.
SMITH, F. A. and LYONS, S. K. 2011. How big should a mammal be? A macroecological
look at mammalian body size over space and time. Philosophical Transactions of the
Royal Society of London B, 366, 2364–2378.
SMITH, F. A., BOYER, A. G., BROWN, J. H., COSTA, D. P., DAYAN, T., ERNEST, S.
M., EVANS, A. R., FORTELIUS, M., GITTLEMAN, J. L., HAMILTON, M. J.,
HARDING, L. E., LINTULAAKSO, K., LYONS, S. K., MCCAIN, C., OKIE, J. G.,
SAARINEN, J. J., SIBLY, R. M., STEPHENS, P. R., THEODOR, J. and UHEN, M. D.
2010. The evolution of maximum body size of terrestrial mammals. Science, 330, 1216–
1219.

References
246
SOOKIAS, R. B., BUTLER, R. J. and BENSON, R. B. 2012a. Rise of dinosaurs reveals
major body-size transitions are driven by passive processes of trait evolution.
Proceedings of the Royal Society of London B, 279, 2180–2187.
SOOKIAS, R. B., BUTLER, R. J. and BENSON, R. B. 2012b. Biology, not environment,
drives major patterns in maximum tetrapod body size through time. Biology Letters, 8,
674–677.
SRIVASTAVA, R., PATNAIK, R., SHUKLA, U. K. and SAHNI, A. 2015. Crocodilian nest
in a Late Cretaceous sauropod hatchery from the type Lameta Ghat locality, Jabalpur,
India. PLoS One, 10, e0144369.
STANLEY, S. M. 1973. An explanation for Cope's rule. Evolution, 27, 1–26.
STRELIN, M. M., BENITEZ-VIEYRA, S., FORNONI, J., KLINGENBERG, C. P. and
COCUCCI, A. A. 2016. Exploring the ontogenetic scaling hypothesis during the
diversification of pollination syndromes in Caiophora (Loasaceae, subfam. Loasoideae).
Annals of Botany, 117, 937–947.
STUBBS, T. L., PIERCE, S. E., RAYFIELD, E. J. and ANDERSON, P. S. 2013.
Morphological and biomechanical disparity of crocodile-line archosaurs following the
end-Triassic extinction. Proceedings of the Royal Society of London B, 280, 20131940.
SUES, H. D., OLSEN, P. E., CARTER, J. G. and SCOTT, D. M. 2003. A new
crocodylomorph archosaur from the Upper Triassic of North Carolina. Journal of
Vertebrate Paleontology, 23, 329–343.
SUGIURA, N. 1978. Further analysts of the data by Akaike's information criterion and the
finite corrections. Communications in Statistics–Theory and Methods, 7, 13–26.

References
247
TAYLOR, M. A. 1987. How tetrapods feed in water: a functional analysis by paradigm.
Zoological Journal of the Linnean Society, 91, 171–195.
TENNANT, J. P., MANNION, P. D. and UPCHURCH, P. 2016a. Evolutionary relationships
and systematics of Atoposauridae (Crocodylomorpha: Neosuchia): implications for the
rise of Eusuchia. Zoological Journal of the Linnean Society, 177, 854–936.
TENNANT, J. P., MANNION, P. D. and UPCHURCH, P. 2016b. Environmental drivers of
crocodyliform extinction across the Jurassic/Cretaceous transition. Proceedings of the
Royal Society of London B, 283, 20152840.
TENNANT, J. P., MANNION, P. D. and UPCHURCH, P. 2016c. Sea level regulated
tetrapod diversity dynamics through the Jurassic/Cretaceous interval. Nature
Communications, 7, 12737.
TENNANT, J. P., MANNION, P. D., UPCHURCH, P., SUTTON, M. D. and PRICE, G. D.
2017. Biotic and environmental dynamics through the Late Jurassic–Early Cretaceous
transition: evidence for protracted faunal and ecological turnover. Biological Reviews, 92,
776–814.
THOMPSON, D. W. 1917. On growth and form. Cambridge University Press.
THORBJARNARSON, J. B. 1990. Notes on the feeding behavior of the gharial (Gavialis
gangeticus) under semi-natural conditions. Journal of Herpetology, 24, 99–100.
TOLJAGIĆ, O. and BUTLER, R. J. 2013. Triassic–Jurassic mass extinction as trigger for the
Mesozoic radiation of crocodylomorphs. Biology Letters, 9, 20130095.
TURNER, A. H. 2006. Osteology and phylogeny of a new species of Araripesuchus
(Crocodyliformes: Mesoeucrocodylia) from the Late Cretaceous of Madagascar.
Historical Biology, 18, 255–369.

References
248
TURNER, A. H. 2015. A review of Shamosuchus and Paralligator (Crocodyliformes,
Neosuchia) from the Cretaceous of Asia. PLoS One, 10, e0118116.
TURNER, A. H. and BUCKLEY, G. A. 2008. Mahajangasuchus insignis (Crocodyliformes:
Mesoeucrocodylia) cranial anatomy and new data on the origin of the eusuchian-style
palate. Journal of Vertebrate Paleontology, 28, 382–408.
TURNER, A. and SERTICH, J. J. W. 2010. Phylogenetic history of Simosuchus clarki
(Crocodyliformes: Notosuchia) from the Late Cretaceous of Madagascar. Journal of
Vertebrate Paleontology, 30, 177–236.
TURNER, A. H. and NESBITT, S. J. 2013. Body size evolution during the Triassic
archosauriform radiation. 573–597. In. NESBITT, S. J., DESOJO, J. B. and IRMIS, R. B.
(eds.). Anatomy, phylogeny and palaeobiology of early archosaurs and their kin.
Geological Society of London, Special Publications, 379.
TURNER, A. H. and PRITCHARD, A. C. 2015. The monophyly of Susisuchidae
(Crocodyliformes) and its phylogenetic placement in Neosuchia. PeerJ, 3, e759.
TURNER, A. H., POL, D., CLARKE, J. A., ERICKSON, G. M. and NORELL, M. A. 2007.
A basal dromaeosaurid and size evolution preceding avian flight. Science, 317, 1378–
1381.
TYKOSKI, R. S., ROWE, T. B., KETCHAM, R. A. and COLBERT, M. W. 2002.
Calsoyasuchus valliceps, a new crocodyliform from the Early Jurassic Kayenta
Formation of Arizona. Journal of Vertebrate Paleontology, 22, 593–611.
UYEDA, J. C. and HARMON, L. J. 2014. A novel Bayesian method for inferring and
interpreting the dynamics of adaptive landscapes from phylogenetic comparative data.
Systematic Biology, 63, 902–918.

References
249
VALENTIN, A. E., PENIN, X., CHANUT, J. P., SÉVIGNY, J. M. and ROHLF, F. J. 2008.
Arching effect on fish body shape in geometric morphometric studies. Journal of Fish
Biology, 73, 623–638.
VAN VALEN, L. 1971. Adaptive zones and the orders of mammals. Evolution, 25, 420–428.
VAN VALKENBURGH, B. 1991. Iterative evolution of hypercarnivory in canids
(Mammalia: Carnivora): evolutionary interactions among sympatric predators.
Paleobiology, 17, 340–361.
VAN VALKENBURGH, B. 1999. Major patterns in the history of carnivorous mammals.
Annual Review of Earth and Planetary Sciences, 27, 463–493.
VAN VALKENBURGH, B., WANG, X. and DAMUTH, J. 2004. Cope's rule,
hypercarnivory, and extinction in North American canids. Science, 306, 101–104.
VENDITTI, C., MEADE, A. and PAGEL, M. 2011. Multiple routes to mammalian diversity.
Nature, 479, 393–396.
VERMEIJ, G. J. 2016. Gigantism and its implications for the history of life. PLoS One, 11,
e0146092.
WALKER, A. D. 1990. A revision of Sphenosuchus acutus Haughton, a crocodylomorph
reptile from the Elliot Formation (late Triassic or early Jurassic) of South Africa.
Philosophical Transactions of the Royal Society of London B, 330, 1–120.
WALMSLEY, C. W., SMITS, P. D., QUAYLE, M. R., MCCURRY, M. R., RICHARDS, H.
S., OLDFIELD, C. C., WROE, S., CLAUSEN, P. D. and MCHENRY, C. R. 2013. Why
the long face? The mechanics of mandibular symphysis proportions in crocodiles. PLoS
One, 8, e53873.
References
250
WATANABE, A. and SLICE, D. E. 2014. The utility of cranial ontogeny for phylogenetic
inference: a case study in crocodylians using geometric morphometrics. Journal of
Evolutionary Biology, 27, 1078–1092.
WEBB, G. J. W. and MESSEL, H. 1978. Morphometric analysis of Crocodylus porosus from
the north coast of Arnhem Land, northern Australia. Australian Journal of Zoology, 26,
1–27.
WERDELIN, L. 1996. Carnivoran ecomorphology: a phylogenetic perspective. 582–624. In
GITTLEMAN, J. (ed.). Carnivore Behavior, Ecology and Evolution. Cornell University
Press.
WESLEY-HUNT, G. D. 2005. The morphological diversification of carnivores in North
America. Paleobiology, 31, 35–55.
WHETSTONE, K. N. and WHYBROW, P. J. 1983. A "cursorial" crocodilian from the
Triassic of Lesotho (Basutoland), southern Africa. Occasional Papers of the Museum of
Natural History of University of Kansas, 106, 1–37.
WHITE, T. E. 1942. A new alligator from the Miocene of Florida. Copeia, 1942, 3–7.
WILBERG, E. W. 2015. What's in an outgroup? The impact of outgroup choice on the
phylogenetic position of Thalattosuchia (Crocodylomorpha) and the origin of
Crocodyliformes. Systematic Biology, 64, 621–637.
WILBERG, E. W. 2017. Investigating patterns of crocodyliform cranial disparity through the
Mesozoic and Cenozoic. Zoological Journal of the Linnean Society, 181, 189–208.
WILKINSON, L. E., YOUNG, M. T. and BENTON, M. J. 2008. A new metriorhynchid
crocodilian (Mesoeucrocodylia: Thalattosuchia) from the Kimmeridgian (Upper Jurassic)
of Wiltshire, UK. Palaeontology, 51, 1307–1333.

References
251
WILLIAMS, T. M. 1999. The evolution of cost efficient swimming in marine mammals:
limits to energetic optimization. Philosophical Transactions of the Royal Society of
London B, 354, 193–201.
WILLS, M. A. 2001. Morphological disparity: a primer. 55–145. In: ADRAIN, J. M.,
EDGECOMBE, G. D. and LIEBERMAN, B. S. (eds.). Fossils, Phylogeny, and Form: An
Analytical Approach. Springer.
WILLS, M. A., BRIGGS, D. E. G. and FORTEY, R. A. 1994. Disparity as an evolutionary
index: a comparison of Cambrian and Recent arthropods. Paleobiology, 20, 93–130.
WILSON, G. P. 2013. Mammals across the K/Pg boundary in northeastern Montana, USA:
dental morphology and body-size patterns reveal extinction selectivity and immigrant-
fueled ecospace filling. Paleobiology, 39, 429–469.
YANG, Z., KUMAR, S. and NEI, M. 1996. A new method of inference of ancestral
nucleotide and amino acid sequences. Genetics, 141, 1641–1650.
YOUNG, M. T. 2014. Filling the ‘Corallian Gap’: re-description of a metriorhynchid
crocodylomorph from the Oxfordian (Late Jurassic) of Headington, England. Historical
Biology, 26, 80–90.
YOUNG, M. T. and ANDRADE, M. B. 2009. What is Geosaurus? Redescription of
Geosaurus giganteus (Thalattosuchia: Metriorhynchidae) from the Upper Jurassic of
Bayern, Germany. Zoological Journal of the Linnean Society, 157, 551–585.
YOUNG, M. T., BRUSATTE, S. L., RUTA, M. and ANDRADE, M. B. 2010. The evolution
of Metriorhynchoidea (Mesoeucrocodylia, Thalattosuchia): an integrated approach using
geometric morphometrics, analysis of disparity, and biomechanics. Zoological Journal of
the Linnean Society, 158, 801–859.

References
252
YOUNG, M. T., BELL, M. A., ANDRADE, M. B. and BRUSATTE, S. L. 2011. Body size
estimation and evolution in metriorhynchid crocodylomorphs: implications for species
diversification and niche partitioning. Zoological Journal of the Linnean Society, 163,
1199–1216.
YOUNG, M. T., BRUSATTE, S. L., ANDRADE, M. B., DESOJO, J. B., BEATTY, B. L.,
STEEL, L., FERNÁNDEZ, M. S., SAKAMOTO, M., RUIZ-OMEÑACA, J. I. and
SCHOCH, R. R. 2012. The cranial osteology and feeding ecology of the metriorhynchid
crocodylomorph genera Dakosaurus and Plesiosuchus from the Late Jurassic of Europe.
PLoS One, 7, e44985.
YOUNG, M. T., ANDRADE, M. B., ETCHES, S. and BEATTY, B. L. 2013. A new
metriorhynchid crocodylomorph from the Lower Kimmeridge Clay Formation (Late
Jurassic) of England, with implications for the evolution of dermatocranium
ornamentation in Geosaurini. Zoological Journal of the Linnean Society, 169, 820–848.
YOUNG, M. T., HUA, S., STEEL, L., FOFFA, D., BRUSATTE, S. L., THÜRING, S.,
MATEUS, O., RUIZ-OMEÑACA, J. I., HAVLIK, P., LEPAGE, Y. and ANDRADE, M.
B. 2014. Revision of the Late Jurassic teleosaurid genus Machimosaurus
(Crocodylomorpha, Thalattosuchia). Royal Society Open Science, 1, 140222.
YOUNG, M. T., RABI, M., BELL, M. A., FOFFA, D., STEEL, L., SACHS, S. and PEYER,
K. 2016a. Big-headed marine crocodyliforms and why we must be cautious when using
extant species as body length proxies for long-extinct relatives. Palaeontologia
Electronica, 19, 1–14.
YOUNG, M. T., TENNANT, J. P., BRUSATTE, S. L., CHALLANDS, T. J., FRASER, N.
C., CLARK, N. D. and ROSS, D. A. 2016b. The first definitive Middle Jurassic

References
253
atoposaurid (Crocodylomorpha, Neosuchia), and a discussion on the genus Theriosuchus.
Zoological Journal of the Linnean Society, 176, 443–462.
YOUNG, M. T., HASTINGS, A. K., ALLAIN, R. and SMITH, T. J. 2017. Revision of the
enigmatic crocodyliform Elosuchus felixi de Lapparent de Broin, 2002 from the Lower–
Upper Cretaceous boundary of Niger: potential evidence for an early origin of the clade
Dyrosauridae. Zoological Journal of the Linnean Society, 179, 377–403.
ZACHOS, J. C., DICKENS, G. R. and ZEEBE, R. E. 2008. An early Cenozoic perspective on
greenhouse warming and carbon-cycle dynamics. Nature, 451, 279–283.
ZANNO, L. E., DRYMALA, S., NESBITT, S. J. and SCHNEIDER, V. P. 2015. Early
crocodylomorph increases top tier predator diversity during rise of dinosaurs. Scientific
Reports, 5, 9276.
ZELDITCH, M. L., SWIDERSKI, D. L. and SHEETS. H. D. 2012. Geometric
Morphometrics for Biologists: A Primer. Elsevier/Academic Press.
ZHANG, N. R. and SIEGMUND, D. O. 2007. A modified Bayes information criterion with
applications to the analysis of comparative genomic hybridization data. Biometrics, 63,
22–32.