Characterising Graduate Unemployment in Nigeria as ...
18
African Journal of Economic Review, Volume VII, Issue 2, July 2019 113 Characterising Graduate Unemployment in Nigeria as Education-job Mismatch Problem Alarudeen Aminu Abstract The study investigates education-job mismatch in the graduate segment of the nation’s labour market, which has had to contend with increasing graduate unemployment in an environment that is inundated with frequent adverts for vacancies across graduate disciplines. Variance of relative unemployment and proportional index of unemployed and employed are used to explain the mismatch from 2012 to 2016. Mismatch is found to be low but increasing in the entire labour market. Aggregate unemployment rate was structurally dependent on unemployment rates among those without education and those who had secondary education while the rate was cyclically affected by unemployment rates in the ranks of those who had post-secondary education (graduates) and those who underwent less than primary education. The results of the proportional index analysis show that the graduates of Medical Sciences, Social Sciences/Business Studies and Engineering would not experience unemployment, while graduates with specialisations in Education, Law, Arts and Sciences were most likely to be unemployed in the Nigerian labour market. A number of reasons are offered to explain the plausibility of these results, while some solutions are put forward to address unemployment among graduates of the latter set of disciplines. Key Words: Graduate Unemployment, Education-Job Mismatch, Educational Levels, Proportionality Index JEL: J01, J2, J13, J21, J24 Senior Lecturer,Department of Economics,Faculty of Economics,University of Ibadan, Ibadan, Nigeria.
Transcript of Characterising Graduate Unemployment in Nigeria as ...

African Journal of Economic Review, Volume VII, Issue 2, July 2019
113
Characterising Graduate Unemployment in Nigeria as Education-job Mismatch
Problem
Alarudeen Aminu
Abstract
The study investigates education-job mismatch in the graduate segment of the nation’s labour
market, which has had to contend with increasing graduate unemployment in an environment
that is inundated with frequent adverts for vacancies across graduate disciplines. Variance of
relative unemployment and proportional index of unemployed and employed are used to
explain the mismatch from 2012 to 2016. Mismatch is found to be low but increasing in the
entire labour market. Aggregate unemployment rate was structurally dependent on
unemployment rates among those without education and those who had secondary education
while the rate was cyclically affected by unemployment rates in the ranks of those who had
post-secondary education (graduates) and those who underwent less than primary education.
The results of the proportional index analysis show that the graduates of Medical Sciences,
Social Sciences/Business Studies and Engineering would not experience unemployment, while
graduates with specialisations in Education, Law, Arts and Sciences were most likely to be
unemployed in the Nigerian labour market. A number of reasons are offered to explain the
plausibility of these results, while some solutions are put forward to address unemployment
among graduates of the latter set of disciplines.
Key Words: Graduate Unemployment, Education-Job Mismatch, Educational Levels,
Proportionality Index
JEL: J01, J2, J13, J21, J24
Senior Lecturer,Department of Economics,Faculty of Economics,University of Ibadan, Ibadan, Nigeria.

African Journal of Economic Review, Volume VII, Issue 2, July 2019
114
1. Introduction
Unemployment is a situation in which individuals who are willing and able to work cannot find
jobs to do.1 The state of unemployment in Nigeria has remained a central policy issue since the
second half of the 1980s following the down turn in the economy from 1982 and the adoption
of the Structural Adjustment Programme (SAP) in 1986. The spectre of unemployment has
been discussed more often than not along the educational attainment/groups of the unemployed.
In the case of Nigeria, five educational groups are identified for this purpose by the National
Bureau of Statistics (NBS) in recent times. These groups are those who never had any
education, those who had below primary education, those who had primary education, those
who completed secondary education and those who underwent post-secondary education. The
unemployment rates of these groups have been in a state of flux perhaps in response to what
goes on in the economy.
Since 2012, the unemployment rate among those who had post-secondary education has always
been higher than the national unemployment rates and it has equally been higher than that of
any other educational group except for individuals with below primary education in 2015 (see
Table 1.1 in the Appendix). It is interesting to realise that the unemployed graduates of tertiary
institutions in Nigeria are classified among those with post-secondary education and, in fact,
NBS has, in recent times, described unemployment rate of post-secondary education as being
synonymous with that of graduates (see National Bureau of Statistics, 2018:34).
An estimated 2.5 million of new labour force enters the nation’s labour market every year with
60% (1.5 million) of the new entrants being youths (including graduates) who possess only
paltry job experience and skills (Adesugba and Mavrotas, 2016a). While job creation in the
labour market is split between the formal and informal segments, a higher percentage of the
job creation resides in the latter segment. The formal segment is made up of the public and
formal private sectors with 5% of new jobs coming from the former while 33% of new job
creation is traceable to the latter. The rest, which, of course, is the bulk of new jobs, is spawned
in the informal segment that is identified with less structure and organisation.2 The identified
features of this segment of the labour market sort of explain the prevalence of
underemployment among the ranks of those who decide to get employed in it while those who
cannot secure the limited jobs in the formal segment and will not want to contend with the
nature of the informal employment opportunities remain unemployed (see Adesugba and
Mavrotas, 2016b). Another reason why an unemployed person may not want to take up the
available jobs, especially in the informal sector, is the low pay offered by the private employers
of labour.3
At present, Nigeria has a large number of employment/empowerment projects, policies and
programmes together with an increasing number of tertiary institutions which are meant to
1 According to National Bureau of Statistics (2016:4-5), unemployed are those who actively looked for work but
could not find any job to do for at least 20 hours during the reference period. On the other hand, people are said
to be underemployed if they work less than full time that is 40 hours per week, work at least 20 hours on average
a week; and they work on full time but in a job that sort of underutilises their skills, time, and educational
qualifications. 2 In Nigeria, the statistical agency (National Bureau of Statistics) defines formal-sector jobs as employment in
organisations that employ 10 or more individuals while informal sector jobs are employment in entities employing
less than 10 people. Informal sector entities are characterised by lack of registration (with government regulatory
agencies) and proper book-keeping practices, and structure (see Adesugba and Mavrotas, 2016b:11). 3 This came to light when a sample of unemployed youth was interviewed in Lagos (the commercial capital of
Nigeria) by a member of a research team of which I participated. The unemployed made reference to this problem
when they were asked about the obstacles they faced in the process of seeking employment.
African Journal of Economic Review, Volume VII, Issue 2, July 2019
115
increase the supply of skilled and employable labour force. There is no gain saying in the fact
that most graduates from tertiary institutions will seek employment in the formal segment of
the labour market. Unfortunately, the segment can absorb only a small percentage of the
graduates. A positive relation is expected to exist between skill/education/qualification level
and labour market outcomes as increased educational/skill attainment improves one’s chances
of securing quality jobs with good income, improved satisfaction and low turnover.
It is interesting to know that the newspapers sold in Nigeria and some firms’ websites within
Nigerian domains are awash with advertisement on graduate job vacancies in one sector or the
other, which are, of course, expected to be filled in most cases by tertiary education graduates.
Some of the posts declared vacant may be re-advertised several times perhaps due to lack of
qualified applicants. Given the high educational attainments of the unemployed and the
underemployed in Nigeria,4 it then becomes pertinent to ask whether the skills, education or
qualifications acquired are really the ones demanded by the labour market as reflected in, at
least, the newspapers’ advertised vacancies. This will thus raise issues that border on
mismatches between skills/education/qualifications possessed by graduates and the available
jobs.5 It should thus be of research and policy interest to know the extent to which
skills/education/qualifications-job mismatch contributes to unemployment of graduates in the
nation’s labour market.
A preliminary analysis of the outcome of graduate education and employability survey by
Phillips Consulting (2014) together with the structure of enrolment in, at least, the Nigerian
universities during the 2009 matriculation (see Shu’ara, 2010) suggests that there is a creeping
problem of skills/qualifications/education and job mismatch in the labour market (See Table
1.2 below). Phillips Consulting survey focuses on employers of recently recruited tertiary
education graduates, majority of whom were First Degree holders (83%) while others were
Higher National Diploma (HND) holders (8%), Master Degree holders (5%) and Ordinary
National Diploma (OND) holders (4%).
4 See Adesugba and Mavrotas (2016b), which contains statistics showing the increased educational attainments
of at least the youth cohorts of the labour force. 5 Skills mismatch is defined as an encompassing term that relates to the various types of imbalances between skills
supplied and skills demanded in the labour market. Skills and competencies are difficult to measure using the
instrumentality of the regular statistical programmes operated across countries. It is for this reason that some sort
of skill proxies are used, such as qualifications and years of education at the supply side, and occupations at the
demand side (see ILO, 2014:6-7).

African Journal of Economic Review, Volume VII, Issue 2, July 2019
116
Table 1.2: Enrolment and Effective Labour Demand across Disciplines
Discipline Enrolment
(%)
Labour Market Effective
Demand (%)
Mismatch Index
1 Business & Law 12.2% 41.0% 0.30
2 Engineering 12.2% 29.0% 0.42
3 Science/Maths/Comp. Sc. 24.7% 11.0% 2.25
4 Social Science 14.2% 12.0% 1.18
5 Medical 6.0% 3.0% 2.00
6 Humanities/Art 9.8% 3.0% 3.27
7 Agriculture & Veterinary 5.9% 1.0% 5.90
8 Education 15.0% - Undefined!
Total 100.0% 100.0%
Sources: Shu’ara (2010) and Phillips Consulting (2014).
A sort of guide for mismatch is obtained by dividing enrolment by effective demand to arrive
at the entries in the last column.6 The lower the mismatch index, the better the labour market
outcomes of the concerned graduates. The above table shows that the discipline that appears to
be side-lined is education. The most sought after graduates were those with Business and Law
Degrees/Certificates followed by those with Engineering Degrees/Certificates. It is the
graduates with these disciplines that can be said to have the best labour market outcomes.
The problem of unemployment among the ranks of graduates of tertiary institutions in spite of
their increased skills and educational qualifications cannot be blamed outright on the notion of
skills/qualifications/education-job mismatch without conducting an in-depth study to shed light
on whether the phenomenon of qualifications/education-job mismatch exists in the graduate
arm of the nation’s labour market. As at the time of carrying out this study, there appears to be
no study along this line. Among related studies on Nigeria are: Dabalen, Oni and Adekola
(2000), Pitan and Adedeji (2012), Stutern (2016), which have investigated, in part, the extent
to which Nigerian graduates possess soft skills (such as decision making, critical thinking, oral
and written communication, and analytical skills), prevalence of graduate unemployment and
employers’ assessment of graduates from tertiary educational institutions (especially the
universities). None of these studies addresses the sort of question raised in this study and
neither does any of them utilises the genre of data and methodologies deployed in this study.
The rest of this study is structured into five sections starting from Section 2, which reviews
relevant literature on skills/qualifications/education-job mismatch while Section 3 explains the
methodology adopted. Section 4 discusses the data, while Section 5 contains empirical analysis
of the implementation of the methodologies on the data obtained from both the demand and
supply sides of graduate labour market. The last section concludes the study.
2. A Review of Related Literature on Education-Job Mismatch
Dablen, Oni and Adekola (2000) was undertaken against a background of increasing graduate
unemployment and the growing employers’ dissatisfaction with the quality of Nigerian
graduates. They analyse data from both the supply side (university enrolment and graduation)
and demand side (absorption into public service and advert for vacancies). They find out that
there is mismatch between the university training and the needs of the labour market. And that
the employers observe that university graduates are poorly trained and unproductive on the job
and that they are deficient in oral and written communication skills and in applied technical
skills.
6 See Section 3 for an exposition of the approach used to obtain the mismatch indices.

African Journal of Economic Review, Volume VII, Issue 2, July 2019
117
The study carried out by Pitan and Adedeji (2012) focuses on skills mismatch among the
university graduates in Nigeria. It involves a survey of employers of graduates in 300
organizations spread across the six geo-political zones. The responses of the employers were
sought with respect to demand for skills and performance of recently employed graduates. The
study finds out that the extent of skills mismatch was 60.6% with major weaknesses (in
graduates) found in information technology, decision making, critical thinking and
entrepreneurial skills while analytical skill is the most required.
Another related study in recent times for Nigeria is undertaken by the Phillips Consulting
(2014). An electronic medium is used to obtain data from the employers and recently recruited
graduate employees. The study finds out that the employers rate the importance of critical and
analytical thinking higher than graduates. The employers are satisfied with the graduates
employed, especially in the fields of education and agriculture while it is a different story
entirely with respect to the employers of graduates in consulting and oil/gas sectors with the
major complaints anchored on the graduates’ inability to work on their own and lack of critical
and analytical skills. One other interesting finding is that the employers rank employability
skills such as good attitude and effective communication skills as the most important
considerations for graduate recruitment but the graduates are of the belief that their
qualifications (academic results) are the most important to the employers.
Stutern’s (2016) study on Nigeria is more of survey but it comes up with some interesting
findings among which is that employment appears to favour the most educated graduates and
that unemployment is highest among those who possess Ordinary National Diploma (OND)
and Higher National Diploma (HND) while it is the lowest among the holders of Master of
Business Administration and Doctor of Philosophy. Fifty per cent of Nigerian graduates hold
the belief that their graduate training never equips them with communication skills. The survey
finds out that the ten most lucrative courses in Nigeria are Computer Science, Economics,
Electrical and Electronics, Accounting, Mass Communication, Bio-Chemistry, Computer
Engineering, Banking and Finance, Business Administration and Micro-Biology.
Among studies from other countries are those of Bartlett, Johansen and Gatelli (2012) for
Croatia, Serbia and Montenegro, Sengupta (2017) for India, Restrepo (2015) and Khalifa
(2013) for the United States of America (USA), Humal (2013) for Sweden and Obiols-Homs
and Sanchez-Marcos (2016) for 15 countries within the European Union (EU). The study on
Croatia, Serbia and Montenegro utilizes two approaches to unravel skills mismatch. These are
variance of relative unemployment and proportional index of the unemployed and the
employed. It is found out that skills mismatch under variance of relative unemployment
assumes an inverted U-shape in both Serbia and Montenegro and to a certain extent in Croatia.
And that the skills mismatch sort of increases during the boom years while there are decreases
during the global financial meltdown. The results of proportional index also show an inverted
U-shape across educational categories, with positive mismatch at intermediate levels of
education and show negative mismatch at lower and upper levels of education.7
Sengupta (2017) utilises variance of relative unemployment and proportionality index to
measure mismatch in the Indian labour market. The study finds that the variance is low but it
increases uniformly over the years while the proportional indices show that mismatch increases
over the years across general education, technical education, gender and age groups. It is also
7 A negative mismatch under proportional index implies that the supply is less than the demand for educational
group or cohort while a positive mismatch means the opposite holds. Proportional index of the unemployed and
employed is explained further under Section 3.

African Journal of Economic Review, Volume VII, Issue 2, July 2019
118
found that positive mismatch characterises all the general education groups whereas negative
mismatch is observed for some technical education groups.
The studies on USA investigate issues of skills/labour market mismatch, structural
unemployment, skill obsolescence and persistent unemployment. They use employment data
and data obtained from the surveys on educational attainment and labour market information
of employees. Restrepo (2015) finds out that skills mismatch has some sort of amplified effects
on unemployment especially during recession and in the labour market in which the demand
for goods and services is depressed. Khalifa (2013) finds out that the unemployment rate is
highly persistent for the unskilled labour compared with the skilled labour and that negative
technology shocks make the educated workers compete with the low educated workers thereby
leading to crowding out of low educated workers as the more educated workers take up the
available job openings.
Obiols-Homs and Sanchez-Marcos (2016) examine the impact of education outcome on
mismatch rate and unemployment rate. The education outcome (quality of education) is
measured by the programme for the International Assessment of Adult Competencies. Other
variables used are mismatch index and unemployment rate. They find that the increasing skills
of the Spanish educated and non-educated workers that will match the European average
reduces mismatch by about 10% and that the unemployment rates of the educated and non-
educated employees will be reduced by more than 40%.
3. Methodologies for Measuring Education-Job Mismatch
While there are several approaches to measuring education-job mismatch, it appears that it is
only two that are applicable to Nigerian data. One of the two measures is in the mould of
standardised variance of relative unemployment rates, while the other is proportionality index
of unemployment and employment. These two have been applied in such studies as Sengupta
(2017) for India and Bartlett, Johansen and Gatelli (2012) for Montenegro, Serbia and Croatia.
The first approach is variance of the ratios of unemployment rate at each level to the aggregate
unemployment rate. The approach is expressed below:
𝑀𝑢 = 𝑉𝑎𝑟 [𝑈𝑖𝑈]……………………………………………………………………………1.
Where Ui is the unemployment rate for set i or education level i while U is the total
unemployment rate. Mu is the variance of the ratios of unemployment rate at each education
level to the aggregate unemployment rate. A low variance implies that the incidence of
mismatch is low while a high figure indicates high mismatch in the labour market but without
pinpointing which of the educational levels (sets of unemployed) are more affected than others
in terms of mismatch between demand and supply. However, additional insights can be
obtained by undertaking some graphical analysis, which may shed light on which educational
level(s) are driving the aggregate unemployment rate and, of course, the observed mismatch
in the labour market.
The second approach entails the comparison of proportion/share of unemployed persons with
a particular education level to the proportion/share of employed persons with the same level of
education. It is the deviation of the index (proportionality) from unity that forms the core of
the approach. The approach is expressed below:

African Journal of Economic Review, Volume VII, Issue 2, July 2019
119
𝑃𝑃𝑖 =𝑈𝑖𝐸𝑖……………………………………………………………………………2
Under this approach, a negative mismatch occurs when the computed proportionality index is
less than unity, while it is positive mismatch if the index is higher than unity. It is only cases
in which the shares of an education or skill group in both unemployment and employment are
equal that perfect matching is said to prevail. When a negative mismatch occurs and the
employees are not substitutable for one another (perhaps under a Leontief technology), there
will be a phenomenon of skills shortage. It thus implies that the potential job seekers with
disciplines experiencing skills shortages (negative mismatch) may not find it difficult to secure
jobs of their dreams. The opposite holds for the job seekers with disciplines characterised by
positive mismatch and in this case, there may be unemployment in their ranks.
4. Data
The data used for the implementation of standardized variance of relative unemployment rates
are unemployment rates across educational levels and aggregate unemployment rates from
2012 to 2016. The data were compiled by the National Bureau of Statistics (of Nigeria). On the
other hand, the data used for the computation of education-job mismatch using the
proportionality index approach are derived from both the supply and demand sides of the
graduate labour market. The data from the supply side are numbers and percentages of
graduates across disciplines from 2012 to 2016 compiled by the National Bureau of Statistics
(of Nigeria) while the demand data are job openings across disciplines over the same period.
The bulk (about 90%) of the advertised vacancies are found in The Guardian and The Punch
daily newspapers. Websites of firms and blogs/social groups advertising job placement were
monitored and a large number of them were found not reliable and so they were excluded.
Each of the graduate disciplines is an aggregate of related disciplines/courses offered in the
nation’s tertiary institutions during the period. They include Social Science/Business Studies,
Sciences, Arts, Education, Engineering, Law and Medical Sciences. For instance, Social
Science and Business Studies as a discipline, encompasses Economics, Sociology, Psychology,
Geography, Political Science, Mass Communication, Business Administration, Accounting,
Banking and Finance and any other disciplines/courses that are regarded as either Social
Science or Business disciplines/courses.
Two reasons inform the use of these sets of data to implement the proportionality index
approach. The first is that there are no data on the distribution of the unemployed graduates
across disciplines and the second reason is that there are equally no data whatsoever with
respect to employed graduates across disciplines in the various sectors of the economy
overtime. However, there is just one survey that shows the distribution of some newly-recruited
graduates and their disciplines across sectors in 2014 (see Phillips Consulting, 2014). Given
the fact that it is only 35% of job seekers in Nigeria who secured jobs in less than one year,8
the entire population of fresh graduates is assumed to be unemployed and each of them is
therefore expected to face an equal probability of being unemployed. This assumption is
reinforced by the fact 38% of new jobs are created in the formal labour market and it is all
those with varying educational levels that are potential candidates.9 On the other hand, the
structure/distribution of job openings for graduates is assumed to be as close as possible to the
structure/distribution of employed graduates while taking their disciplines into consideration.
8 This was part of the findings from labour force survey by the National Bureau of Statistics in 2018 (see
National Bureau of Statistics, 2018:73). 9 See Adesugba and Mavrota (2016b), who found out that 5% and 33% of new jobs were provided by the public
and formal private sectors respectively.

African Journal of Economic Review, Volume VII, Issue 2, July 2019
120
Again, the structure of job openings should as a matter of fact reflect graduate disciplines that
are relevant and the extent of their relevance in the labour market.
5. Empirical Analysis
The analysis is restricted to the most recent 5 years starting from 2012 to 2016.10 This is with
a view to unravelling the extent of unemployment spread across educational levels and also
determining the educational levels that dominated aggregate unemployment rates during the
period in the first place, using the instrumentality of variance of relative unemployment. In the
second instance, the period chosen for the analysis is equally meant to reveal the
correspondence between the demand and supply sides of graduate labour market at a time the
problem of graduate unemployment has attracted some sorts of hysterical attention from the
public perhaps due to the statistical evidence that shows that unemployment rates among those
with post-secondary education was the highest from 2012.
In Figure 5.1 below, each of the computed variance of relative unemployment is on the low
side and is in fact less than unity, which implies that mismatch is low in the nation’s labour
market. It can be seen that the variance, however, increased from 2013 thereby suggesting that
some element of mismatch was building up among people with certain educational levels. In
fact, this suggestion is given credence when one considers the results of a graphical analysis of
aggregate unemployment rates and unemployment rates at each education level as presented in
Figures 5.2 to 5.6 in the Appendix. Again, the Figures show the extent to which unemployment
rates at some educational levels affect the aggregate unemployment rates from 2012 to 2016.
Figure 5.1: Variance of Relative Unemployment
Source: Labour Force Statistics: Unemployment and Underemployment (Several Volumes),
(Abuja: National Bureau of Statistics)
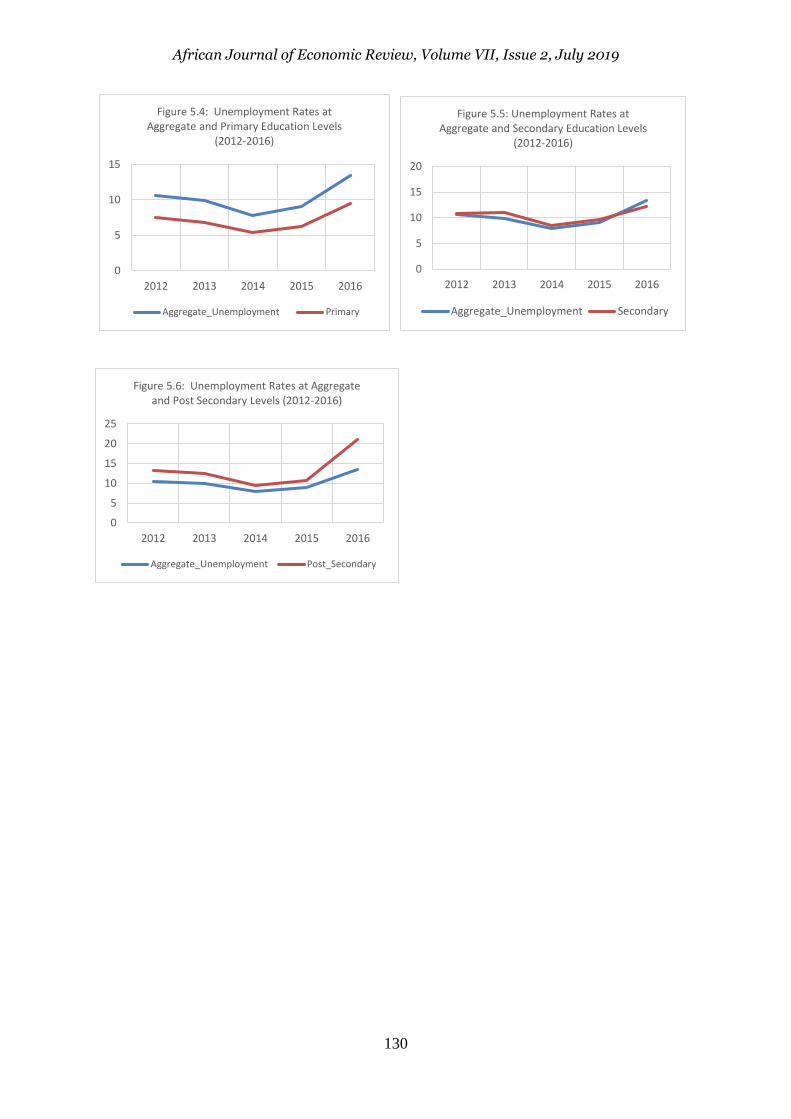
Figures 5.2 to 5.6 in the Appendix show that the unemployment rates at all educational levels
increased from 2014 but the increase was not uniform across levels. It appears that the spectre
10 The analysis could have ended in 2017 but for lack of data (from the National Bureau of Statistics) for the
year as at the time of conducting this study.
0.0504
0.0392 0.0412
0.0919 0.0931
0.0000
0.0100
0.0200
0.0300
0.0400
0.0500
0.0600
0.0700
0.0800
0.0900
0.1000
2012 2013 2014 2015 2016
Variance of Relative Unemployment Rates

African Journal of Economic Review, Volume VII, Issue 2, July 2019
121
of unemployment became concentrated among those with post-secondary education from 2015
and among those who had below primary education certificates from the same year. It can also
be seen that the unemployment rates among those with no education and secondary education
were to a large extent interwoven or the same with the aggregate unemployment rates
throughout the 5-year period. When viewed against the fact that aggregate unemployment rate
encompasses unemployment rates at all levels of education, it can be discerned that the
unemployment rates among those without education and those with secondary education
appear to dictate the trend and magnitude of aggregate unemployment rates during the 5-year
period (see Figures 5.2 and 5.5). Also discernible are the results that unemployment rates at
below primary education sort of pulled up the aggregate unemployment rates in 2015 and 2016
while the unemployment rates at post-secondary education level pushed up the aggregate
unemployment rates throughout the 5-year period (see Figures 5.3 and 5.6).
Next, is the presentation of the analysis of data on the demand and supply sides of graduate
labour market using the proportionality index approach. Table 5.1 shows the distribution of
graduates across disciplines/courses from 2012 to 2016. Graduates with background in sciences
constituted the highest percentage from 2012 to 2014 while those with grounding in social and
business studies were the largest in 2015 and 2016. Table 5.2, on the other hand, contains the
distribution of graduate jobs across disciples/courses over the period 2012-2016. It can be seen
that the largest percentage of graduate job openings were accounted for by those with
qualifications in Social Science/Business Studies, Engineering and Medical Sciences.
The core of the implementation of proportionality index approach to education-job mismatch
is contained in Table 5.3. Each of the cells under each discipline/course is a ratio of the
corresponding cells in Tables 5.1 and Table 5.2. The results in Table 5.3 show that the
proportionality indices for graduates with qualifications in Social Science/Business Studies,
Engineering and Medical Sciences are less than unity in each of the years thereby suggesting
that such graduates would have no unemployment problem and would accordingly have better
job prospects when compared to their counterparts with certifications in other
disciplines/courses. Given the results with respect to other disciplines, it can be seen that their
proportionality indices are above unity, which sort of imply that the graduates with those
disciplines (Education, Law, Arts and Sciences) would suffer unemployment and might find it
a bit difficult to secure jobs at least in formal segment of graduate labour market, which is the
first port of call for every graduate in Nigeria.
Given the fact that graduates from the four disciplines that appear to suffer unemployment
made up an average of 64.14% of graduates during the five-year period, it is most likely that
the number of them seeking jobs at every point in time will be far higher than the available
jobs. In fact, recent reports on job applications by at least two federal government agencies
seem to bear this out. First, out of the 324,000 shortlisted applicants for 4000 slots in the Federal
Road Safety Commission, 105,000 of them were graduates who applied for Inspector and Road
Marshall Assistants’ positions.11 Second, the Nigerian Police Force shortlisted 242,455
applicants for just 10,000 vacant positions during the first month of 2019.12 Even though there
was no breakdown of the shortlisted applicants into disciplines, there is no doubt that a large
number of the applicants would be graduates of perhaps the four disciplines that appear to
suffer poverty of employment in this study.
11 See Daily Trust, September 29, 2018. See also www.dailytrust.com.ng/unemployment-graduates-into-nigerias-
problem.html 12 See The Punch, January 4, 2019 page 41.

African Journal of Economic Review, Volume VII, Issue 2, July 2019
122
The results in Table 5.3 suggest that it is the graduates with some grounding in Medical
Sciences that would experience the least or no problem of unemployment and they might have
had, as a matter of course, the best job prospects among the graduates with good job prospects
during the 5-year period (see the last row of Table 5.3). This set of graduates is followed, in
terms of low incidence of unemployment and high job prospects, by graduates of Social
Science and Business Studies and Engineering in that order. On the other hand, it is the
graduates of Sciences that appear to have had the highest incidence of unemployment and the
worst job prospects followed by those graduates of Arts and Education background. However,
Law graduates appear to have had a lower incidence of unemployment and, of course, might
have enjoyed better job prospects than any of their colleagues with specialisations in either
Sciences, Arts or Education (see again, the last row of Table 5.3).
Table 5.1: Distributions of Graduates across Disciplines (Percentages)
Year
Social
Science
&
Business
Studies Engineering Arts Education Law
Medical
Sciences Sciences Total
2012 13.7202 14.4397 11.3633 8.7082 2.4011 1.5851 47.7824 100.0000
2013 13.3368 13.5537 12.0995 9.2860 2.2377 1.9530 47.5333 100.0000
2014 14.4135 14.3555 10.9932 7.7448 2.0771 1.8394 48.5765 100.0000
2015 27.0715 9.8271 9.9223 18.5009 3.4168 5.4803 25.7811 100.0000
2016 34.1657 7.6475 21.0127 14.8271 0.0031 5.9135 16.4305 100.0000
Source: Computations by the author from Annual Abstract of Statistics (several Issues)
published by the National Bureau of Statistics, Abuja, Nigeria.
Table 5.2: Distributions of Graduate Job Vacancies across Disciplines (Percentages)
Year
Social
Science
&
Business
Studies Engineering Arts Education Law
Medical
Sciences Sciences Total
2012 47.1315 17.9784 1.7562 9.1453 1.8863 16.0661 6.0362 100.0000
2013 55.7832 23.5883 1.6621 4.4399 1.3661 11.7259 1.4344 100.0000
2014 56.8887 18.4179 2.8853 4.5684 1.8755 12.3107 3.0536 100.0000
2015 62.0501 17.8404 1.4476 2.9734 2.1714 11.2089 2.3083 100.0000
2016 46.4628 18.0319 1.7819 9.9734 1.4894 16.0106 6.2500 100.0000
Source: Computations by the author from Daily Newspapers’ Adverts on Graduate Job
Vacancies (The Guardian and The Punch Newspapers)

African Journal of Economic Review, Volume VII, Issue 2, July 2019
123
Table 5.3: Education-Job Mismatch using Proportionality Index Approach
Year
Social
Science
&
Business
Studies Engineering Arts Education Law
Medical
Sciences Sciences
2012 0.2911 0.8032 6.4703 0.9522 1.2729 0.0987 7.9160
2013 0.2391 0.5746 7.2796 2.0915 1.6380 0.1666 33.1375
2014 0.2534 0.7794 3.8101 1.6953 1.1075 0.1494 15.9078
2015 0.4363 0.5508 6.8544 6.2221 1.5736 0.4889 11.1689
2016 0.7353 0.4241 11.7922 1.4867 0.0021 0.3693 2.6289
Average 0.3910 0.6264 7.2413 2.4896 1.1188 0.2546 14.1518
Source: Computations by the author from Tables 5.1 and 5.2
The results obtained here tally, to some extent, with what could have been obtained from using
the survey results of Phillip Consulting (2014) for freshly employed graduates. To use the
survey results, the disciplines/courses are collapsed/aggregated into five as follows: Social
Science/Business/Law, Engineering, Sciences, Medical Sciences and Arts. The proportionality
indices for these disciplines are respectively 0.4257, 0.4124, 3.1010, 1.1166 and 4.36.13 This
set of indices indicate that graduates with Social Science/Business/Law, Engineering and
Medical Sciences had better job prospects than those with other disciplines, which appear to
be in conformity with the results presented for the year 2014 and in the last row of Table 5.3.
If one considers the shares of the various disciplines and other findings in the survey conducted
by Phillip Consulting (2014) against the results presented in Table 5.3, one would realise that
the disciplines that appear to be less prone to unemployment (in this study) are the same as the
ones that had high shares in the recruitment and they were again the most sought after by the
employers of graduates as found in the survey. The results in this study are also in conformity
with aspects of Stutern’s (2016) study that delve on the ten most employable courses in Nigeria.
A number of reasons can be put forward to explain the education-job mismatch in the graduate
labour market in Nigeria. First, the unparalleled job prospects of graduates of Medical Sciences
may be explained by the fact that the medical personnel are still in short supply which is
epitomized by, at least, the ratio of medical doctors to patients, which is one doctor to 4000
patients. This is far below the World Health Organisation’s (WHO) recommendation of one
doctor to 600 patients. Another factor responsible for the short supply of especially practising
graduates of medical sciences is that a large number of them that are even trained locally are
fond of migrating to other countries considered as harbouring greener pastures. In fact, a recent
report by the British government found that no fewer than 5,405 Nigerian-trained doctors and
nurses were working with the British National Health Services (see The Guardian [April 22],
2018). It should therefore be understandable why graduates of medical sciences might have
had better job prospects than any other set of graduates in Nigeria.
The good job prospects of the Engineering graduates may be explained against the backcloth
of booming telecommunication, banking and electronic governance and payment systems in
the past two decades in Nigeria. A central factor in the increased activities of these
sectors/business environments is the revolution and spectacular development that has sort
characterised the global system of mobile communications since 2001. However, it seems that
13 The numerator in the proportionality index for each discipline is the average percentage share of the discipline
as presented in Table 5.1 when it is collapsed/aggregated to be in line with Phillip Consulting’s (2014) survey.

African Journal of Economic Review, Volume VII, Issue 2, July 2019
124
the Engineering graduates with specialisations in computer operation, networking,
programming, electronics/electrical and telecommunication appear to be more favoured in
securing employment than their counterparts in other areas of Engineering. Statistically, the
share of telecommunication and information services in gross domestic product (GDP) of the
country has registered a dramatic increase since 2001. In 2000, it was a mere 0.13% of GDP
and its share in GDP rose from 1.45% in 2001 to 8.31% and 8.40% in 2012 and 2016
respectively (see Central Bank of Nigeria, 2017). All these developments would definitely
require personnel with requisite education and background in engineering to ensure the
realisation of the sector’s plans and projects.
The bright job prospects of social and business studies’ graduates can equally be explained in
part by the growth registered by the sectors that require their services. Such sectors as trade
and services that are perhaps the ones that would employ this set of graduates grew from
45.91% of GDP in 2000 to 61.07% by 2016 (see Central Bank of Nigeria, 2017). A particular
sub-sector in the services sector is the banking sub-sector, which has undergone dramatic
growth from year 2000 to the present time. The banking sub-sector has grown in terms of
investment (following the recapitalisation policy of 2004/05),14 number of branches and staff
strength. The number of branches increased from 2,193 in 2000 to 3,233 in 2006. It further
increased to 5,564 in 2012 and 5570 in 2016. While the number of staff must have increased
during these years, it is for the period 2014-2017 that the data on staff is available. The number
of banks’ staff was at 70,960 in the first quarter of 2014 and it increased to 80,865 in the third
quarter of the same year. It increased to 82,531 by the end of third quarter of 2017 (National
Bureau of Statistics/Central Bank of Nigeria, 2017). All these developments in the banking
sub-sector would invariably result in increased demand for graduate personnel in at least the
social sciences and business studies.
Two factors may be adduced to explain the seeming poor job prospects of graduates of
education. First, the retirement age of teachers is 60, that is for graduates with background in
education while the rate of recruitment by the largest employer, government (both at federal
and state levels), is more often dictated by revenue that is hinged to the tune of 75% on the
volatile international price of oil. In fact, most government (at federal and state levels) place
embargo on employment of teachers pending improvement in their fiscal positions. There is no
doubt that retaining retirement age at 60 and the frequent and sometimes persistent embargo
on teachers’ recruitment by the government would affect the extent to which fresh graduates
of education could secure employment.15 The second factor is that some private secondary
schools tend to prefer graduates of Sciences, Arts (English and other languages and Religious
Studies) and Social Sciences (such as Geography, Economics and Political Science) with First-
Class and Second-Class Upper Division to graduates of education who combine courses in the
three areas with education courses.16 Graduates of other disciplines have, therefore, been
competing fiercely with and even displacing the education graduates from jobs that are
ostensibly meant for the latter.
14 The recapitalisation policy required each bank to increase its fully-paid capital to a minimum of N25 billion
from the initial statutory base of N2 billion. 15 The phenomenon of high teacher’s retirement age as a depressing employment factor for graduates of education
will assume a more disturbing character once the age is increased to 65 as it is being contemplated in recent times
at parliament (see The Nation (a daily newspaper), June 7, 2017). 16 The author discovered from a recent survey of brochures of some high fees-paying private secondary schools
in the city of Ibadan and its environs (South-West, Nigeria) that most of the teachers were graduates of Sciences,
Social Sciences and Arts with First-Class and Second-Class Upper degrees.

African Journal of Economic Review, Volume VII, Issue 2, July 2019
125
While there is no doubt that unemployment is on the high side among graduates of Law and it
is of great concern for the senior lawyers, there appears to be no clue as to why these members
of the so-called ‘learned’ profession have been massively unemployed for quite some time
now.17 Even those of them who secure jobs have had to contend with extremely low pay.18
It is most likely that disguised contraction in the law industry is responsible for the poor job
prospects for young lawyers in Nigeria. The general lull in the nation’s economy may be
responsible for the decline in law industry and consequently the poor job prospects for young
lawyers.
The rising rate of unemployment among graduates of Sciences (Chemistry, Physics,
Mathematics, Statistics, Biology, and Agricultural Science) and Arts (English,
Nigerian/foreign languages, Archaeology, Religious Studies, Language Arts and others) may
be attributed to the near zero growth in employment across the public sector educational
institutions on account of fiscal problems. The fiscal problems that are dictated by the ups and
downs in the international oil market. A sector that can as well serve as a big employer of, say,
graduates of sciences, is manufacturing. The sector’s fortune has more often been on a
declining trend and in a state of flux in the last two decades as its share of GDP was at 12.0%
in 2000 and at 6.6% and 8.8% in 2010 and 2017 respectively (see Central Bank, 2017). This
will definitely reduce the jobs that can be made available for graduates of Sciences. Again, the
less-than-required growth that the economy registered and is still recording may be responsible
for the poor job prospects for the sciences and Arts graduates. The economy was and is still
expected to grow at a double-digit rate instead of the growth rates of 6.5% and 5.3% during the
periods 2000-2010 and 2010-2014 respectively (see Central Bank, 2014).
6. Conclusion
This study has investigated the roles played by education-job mismatch in graduate
unemployment in Nigeria from 2012 to 2016. Two methodologies are used to explain the
presence of mismatch across educational levels and across disciplines/courses. The
methodologies are standardized variance of relative unemployment and proportionality index
of unemployment and employment. The results of standardised variance of relative
unemployment show that education-job mismatch was low in the nation’s labour market but
was increasing in the later years. It is also found that unemployment rates increased from 2014
across educational levels but the increases were not uniform. Unemployment became
concentrated among those with post-secondary (graduate) education from 2015 and among
those with below primary education from the same year.
It is equally realised that unemployment rates among those without education and secondary
education were interwoven or the same with the aggregate unemployment rate throughout the
5-year period. The unemployment rate at below primary education pulled up the aggregate
unemployment rates in 2015 and 2016 while unemployment rate at post-secondary education
level pushed up the aggregate unemployment rate throughout the 5-year period. It can therefore
be concluded that unemployment rate in Nigeria was structurally a function of unemployment
rates of those without education and those with secondary education while the nation’s
unemployment was cyclically dependent on the unemployment of those having below primary
17 See Vanguard (daily newspaper), June 13, 2013 where the spectre of unemployment among the young lawyers
was widely used as a campaign issue in the run-up to the presidential election of Nigerian Bar Association. See
also www.lawyard.ng/bar-association-and-the-sad-story-of-Nigerian-lawyers-by-Sylvester-Udemezue/. 18 See https://www.dailytrust.com.ng, April 5, 2018, where the issue of low pay for young lawyers was discussed
and it was revealed that they were being paid N15,000 per month by firms.

African Journal of Economic Review, Volume VII, Issue 2, July 2019
126
education and those with post-secondary education. This suggests that even if economy grows
rapidly, unemployment will still remain among those without education and those with
secondary education. This means that their skills do not seem to be demanded again in the
economy. It is interesting to know that in Nigeria, jobs that required secondary education before
are being taken over by those with post-secondary education.19 An example of this type of jobs
is desk clerk/cashier’s work in the Nigerian banks.
The proportionality indices of unemployment and employment for graduates with
qualifications in Social/Business Studies, Engineering and Medical Sciences are less than unity
in each of the years, which imply that the mismatch is negative for each discipline. This means
that there should be no problem of unemployment among the graduates of the aforementioned
disciplines as the percentage demanded is higher than the one supplied. However, the
proportionality indices for other disciplines are above unity, which sort of suggest that the
graduates with those disciplines (Education, Law, Arts and Sciences) would suffer
unemployment in each of the 5 years. These results across the 7 disciplines were very close to
what obtained in reality especially when considered alongside with the results of a survey of
recently recruited graduates in 2014 by Phillips Consulting (2014). The results obtained in this
study are equally in line, in large measure, with the findings of Stutern (2016) with respect to
the ten most employable courses/disciplines in the graduate arm of the nation’s labour market.
A number of reasons are put forward to explain why graduates of Social Science/Business
Studies, Engineering and Medical Sciences might have better job prospects than any other
graduates of either Law, Arts, Education or Sciences. Among the reasons are the peculiarities
of some professions (say, for example, doctor-patients ratio in Nigeria being below WHO
recommended ratio) and structural changes in the economy and the over-all growth
performance of the economy.
To address the problems of unemployment across disciplines, there is a need to implement
programme specific to each discipline. For instance, lawyers may have to be equipped with
other disciplines in high demand while undergoing training in their respective universities.
Lawyers-in-training or those of them who are unemployed can be encouraged to get certificated
in business-related disciplines to bolster their employability. The graduates of Sciences may be
given additional training and skills in health/medical care or in some areas of Engineering to
make them employable. The number of enrolment in every Science course may also have to be
justified on the current or immediate future marketability and scientific/technological
usefulness of the course. Education and Arts graduates can be given further training to get
certificated in business or medical-related disciplines of their choice to enhance their job
prospects. Again, the marketability and current/immediate usefulness of each Arts’ course
should play some roles in pegging students’ enrolment in the course at the university level.
Education courses in the universities can as well be rationalised on the basis of their relevance
and be made post graduate level courses only to stem the tide of what appears as over-
production for a market that is not expanding on account of especially the high retirement age
and the frequent embargo on employment by the dominant employers (government at both
federal and state levels). An indisputable fact is that Education as a profession in Nigeria, is
19 The employers are better-off employing from the large army of unemployed graduates who are ready to work
and who have more than enough educational attainment for the jobs meant for secondary education certificate
holders. A phenomenon called bumping-down is said to occur when the employers rationally prefer to hire those
with higher educational attainment to those with less educational attainment who are as well capable of doing the
job. The phenomenon also operates when a highly educated decides to accept a job meant for a lowly educated
(see Bartlett, Johansen and Gatelli, 2012 and McGuinness, 2006).

African Journal of Economic Review, Volume VII, Issue 2, July 2019
127
fast becoming a sort of all-comers’ affairs as graduates of other disciplines are constantly
making in-roads without any hindrance. The Education graduate employment market is thus
becoming a classic example of contestable market. It, therefore, follows that efforts need be
made to minimise the production, at least, at the first degree level of Education courses.
The various skills acquisition programme for the unemployed graduates at government, private
and public-private partnership levels should be intensified while entrepreneurship courses at
undergraduate level should be extended to postgraduate level. There may also be a need to
enrich the entrepreneurship courses with Engineering and Medical-related courses to broaden
employment options for the graduates. Equally relevant is the need to institutionalise a
continuous interaction between graduate education producers and users/demanders of
graduates to ensure the marketability and usefulness of graduate education in Nigeria and also
to ensure the exportability of some of the graduates especially the Medical and Engineering
graduates.
References
Adesugba, M. A., and G. Mavrotas (2016a), Delving Deeper into the Agricultural
Transformation and Youth Employment Nexus: The Nigerian Case, Nigeria Strategy
Support Program Working Paper 31. Washington DC: International Food Policy
Research Institute
Adesugba, Margaret and George Mavrotas (2016b), Youth Employment, Agricultural
Transformation and Rural Labour Dynamics in Nigeria, International Food Policy
Research Institute Discussion Paper 01579, December.
Bertlett, Will, Jens Johansen and Debora Gatelli (2012), Skills Gaps and Mismatches in the
Western Balkans: A Comparative Analysis in Mihail Arandarenko and Will Bartlett
(eds.), Labour Market and Skills in the Western Balkans, Belgrade: Foundation for the
Advancement of Economics.
Central Bank of Nigeria (2017), Statistical Bulletin, (Abuja: Central Bank of Nigeria).
Central Bank of Nigeria (2014), Statistical Bulletin, (Abuja: Central Bank of Nigeria).
Dablen, Andrew, Bankole Oni and Olatunde A. Adekola (2000), Labour Market Prospects of
University Graduates in Nigeria, (Abuja: World Bank).
Federal Republic of Nigeria (2001), National Youth Policy and Strategic Plan of Action, Abuja:
Federal Ministry of Youth Development.
Federal Republic of Nigeria (2009), Second National Youth Policy Document, Abuja: Federal
Ministry of Youth Development
Green, F. (2013), Skills and Skilled Work: An Economic and Social Analysis, Oxford:
Oxford University Press.
Humal, Katrin, (2013), Education-Occupation Mismatch and its Effect on Unemployment in
Sweden. Unpublished Project
African Journal of Economic Review, Volume VII, Issue 2, July 2019
128
ILO (2014), Skills Mismatch in Europe, (Geneva: International Labour Office)
Khalifa, Sherif (2013). Labour Mismatch, Skill Obsolescence and Unemployment Persistence.
Journal of Quantitative Economics, Vol. 11 Nos.1&2
McGuinness, S. (2006), Overeducation in the Labour Market, Journal of Economic Surveys,
20(3): 387-418.
National Bureau of Statistics (2018), Labour Force Statistics-Volume I: Unemployment and
Underemployment (Q4 2017-Q32018), (Abuja: National Bureau of Statistics).
National Bureau of Statistics/Central Bank of Nigeria (2017), Selected Banking Sector Data:
Sectorial Breakdown of Credit, ePayment Channels, Deposits and Domestic Credit
Breakdown and Staff Strength (Q3-2017), (Abuja: National Bureau of Statistics).
National Bureau of Statistics (2014), The Review of Definition and Methodology for Computing
Unemployment Statistics in Nigeria. Report of National Stakeholders’ Workshop held
at Ayalla Hotel, Garki, Abuja, 8-10, September, 2014. (Abuja: National Bureau of
Statistics).
National Bureau of Statistics (2016), Unemployment/Underemployment Report Quarter 3,
December 2016, (Abuja: National Bureau of Statistics).
National Bureau of Statistics and Federal Ministry of Youth Development (2013), 2012
National Baseline Youth Survey, (Abuja: National Bureau of Statistics).
Obiols-Homs F. and Sanchez-Marcos V., (2016) Education Mismatch and Unemployment.
Barcelona GSE Working Paper Series Working Paper no. 807
Phillips Consulting (2014), Education and Employability Survey Report, (Phillips Consulting:
Lagos).
Pitan, Oluyomi S. and S.O. Adedeji (2012), Skills Mismatch among University Graduates in
the Nigerian Labour Market, US-China Education Review, A 1(2012) 90-98.
Restrepo, Pascual, (2015).Skill Mismatch and Structural Unemployment. MIT Macro
Seminar Paper
Sengupta, Anindita (2017), Mismatch between Skills and Jobs in Indian Labour Market during
the Post-Reform Era: Estimates with Unit Level Data, paper presented at a Conference
on Experiences and Chanllenges in Measuring Income, Inequality and Poverty in South
Asia, New Delhi, November 23-25, 2017.
Shu’ara, Jamila (2010), Higher Education Statistics-Nigerian Experience in Data Collection,
paper presented at the UNESCO Institute of Statistics Workshop on Education
Statistics in Anglophone Countries, Windhoek, 17-21 October 2010. Retrieved on
29/05/2017 from http://www.uis.unesco.org
Stutern (2016), The Nigerian Graduate Report, (Lagos: Stutern)

African Journal of Economic Review, Volume VII, Issue 2, July 2019
129
Appendix
Table 1.1: Unemployment Rates across Education Groups in Nigeria 2010-2018)
2010 2011 2012 2013 2014 2015 2016 2017 2018*
All
Groups
5.1 6.0 10.6 10.0 7.8 9.0 13.4 17.45 22.5
Never
Attended
4.3
6.7
11.3
9.8
7.9 9.2 13.5 16.9 21.1
Below
Primary
5.6
6.9
8.3
5.6 14.7 17.3 20.1 24.8
Primary
5.2
5.4
7.6
6.8
5.4 6.3 9.4 12.9 19.8
Secondary
5.6
6.6
10.8
11.0
8.6 9.7 12.1 16.9 21.4
Post-
Secondary
5.3
4.4
13.2
12.4
9.4 10.6 21.1 25.4 30.8
Source: Labour Force Statistics: Unemployment and Underemployment (Several Volumes),
(Abuja: National Bureau of Statistics)
*Each entry in the cells below is an average of three quarters’ rates (1st, 2nd & 3rd).
0
5
10
15
20
2012 2013 2014 2015 2016
Figure 5.2: Unemployment Rates at Aggregate and No Education Levels (2012-2016)
Aggregate_Unemployment No_Education
0
5
10
15
20
2012 2013 2014 2015 2016
Figure 5.3: Unemployment Ratess at Aggregate and Below Primary Education
Levels (2012-2016)
Aggregate_Unemployment
Below_Primary
African Journal of Economic Review, Volume VII, Issue 2, July 2019
130
0
5
10
15
2012 2013 2014 2015 2016
Figure 5.4: Unemployment Rates at Aggregate and Primary Education Levels
(2012-2016)
Aggregate_Unemployment Primary
0
5
10
15
20
2012 2013 2014 2015 2016
Figure 5.5: Unemployment Rates at Aggregate and Secondary Education Levels
(2012-2016)
Aggregate_Unemployment Secondary
0
5
10
15
20
25
2012 2013 2014 2015 2016
Figure 5.6: Unemployment Rates at Aggregate and Post Secondary Levels (2012-2016)
Aggregate_Unemployment Post_Secondary