Characterisation of Gamma-Prime Across Inertia … of across inertia friction welded Alloy 720Li ......
8
Characterisation of across inertia friction welded Alloy 720Li M. Preuss 1 , J. Quinta da Fonseca 1 , I. Kyriakoglou 2 , P.J. Withers 1 , G.J. Baxter 3 1 Manchester Materials Science Centre, Univ. of Manchester & UMIST, Grosvenor St, Manchester, M1 7HS, United Kingdom 2 School of Engineering, Metallurgy and Materials, The University of Birmingham, Edgbaston, Birmingham, B15 2TT, United Kingdom 3 Rolls-Royce plc., Derby, DE24 8BJ, United Kingdom Keywords: inertia friction welding, Alloy 720Li, gamma prime Abstract A comprehensive characterization of γ′ in inertia friction welded Alloy 720Li has been undertaken to quantify the dramatic variation of the γ′ microstructure in the heat affected zone (HAZ) and the effect of the post weld heat treatment (PWHT). Experiments were performed on samples in the as-welded and two different PWHT conditions. High energy synchrotron diffraction was used to investigate the overall variation of γ′ volume fraction across the weld line with a high spatial resolution. During this experiment it was also possible to determine the misfit between γ and γ′ as a function of position in the HAZ and the base material. In addition high and ultra high resolution field emission gun scanning electron microscopy (FEGSEM) studies were carried out in order to individually characterize primary, secondary, tertiary γ′ and γ′ that had reprecipitated upon cooling at the end of the friction welding process. To study the relation between γ′ variation and any changes of strength in the welds, microhardness tests were performed on the three samples. The high energy synchrotron diffraction measurements revealed that in the as-welded condition the HAZ was depleted in γ′ with a trough observed at about 1.5mm from the weld line. No variation in γ′ volume fraction was observed in the two PWHT conditions. FEGSEM studies revealed that at the weld line primary, secondary and tertiary γ′ had been dissolved during the welding process and that reprecipitated γ′ could be observed, even in the as-welded condition. The reprecipitated γ′ appeared to be smallest not at the weld line but at around 1mm axially away from it. Between 1 and 4mm from the weld line, significant coarsening of tertiary was observed even though the welding process had taken only a few seconds to complete. The recorded microhardness of the as-welded sample can be understood in terms of γ′ depletion and the non-optimal particle size of the fine tertiary and reprecipitated γ′. Both PWHT conditions displayed a pronounced microhardness increase towards the weld line that can be explained by the large volume fraction of reprecipitated and coarsened γ′ in this region. Measurements of the lattice misfit between γ and γ′ showed a variation in the HAZ of the welds. A γ/γ′ misfit between 0.11% to 0.15% was observed in the base material of the three samples studied and a minimum of about 0.05% misfit was measured at about 1mm from the weld line. In all cases the lattice spacing of the matrix (γ) was smaller than the lattice spacing of the coherent γ′ precipitates, i.e. representing a positive γ/γ′ misfit. At the moment the nature of the γ/γ′ misfit variation is not clear but it can be assumed that it is related to the temperature history that the material experienced in this region. Introduction In order to meet the demand for better high temperature properties, the new generation of rotor disk nickel-base Superalloys has a significantly higher volume fraction of γ′ than conventional Superalloys. These alloys are usually very difficult to weld and are prone to micro-cracking as solidification takes place during welding [1, 2]. Therefore, inertia friction welding (IFW) is a very attractive welding process since it does not involve any melting, provided optimum welding parameters are chosen. In IFW, one of the work-pieces is connected to a flywheel and the other is restrained from rotating. The flywheel is accelerated to a predetermined rotational speed, then disengaged and the work-pieces are forced together under pressure. The kinetic energy stored in the rotating flywheel is dissipated as heat through friction/shearing at the weld interface. In this way, it is possible to join advanced nickel-base Superalloys like RR1000 and Alloy 720Li, which produce unacceptable welds by electron beam welding [3]. Since the friction welding process only takes a few seconds the material in the heat affected zone (HAZ) experiences extreme heating and cooling rates. This results in a heavily modified HAZ microstructure. These microstructural changes include changes in the γ′ distributions, γ grain size, misfit between γ and γ′ and work hardening [4, 5]. Hardness and microstructural mapping of as- welded conditions of IFWs are essential for understanding the welding process. They can support the development of optimum welding parameters and give indications of how different Superalloys behave during welding. Another important aspect of inertia friction welding nickel-base Superalloys is the post weld heat treatment (PWHT), which reduces the residual stresses generated during welding. It is a critical step in the process because it is important to relieve the residual stresses without compromising the microstructure/ mechanical properties. In terms of microstructural changes, the PWHT mainly effects the distribution of fine γ′, which, in turn, has a significant effect on the hardness of the HAZ [4]. Experimental Materials and Specimens The inertia friction welded material investigated was Alloy 720Li whose nominal chemical composition is given in Table 1. The material used for the welding trials was cast and wrought material solution heat treated for 4 hours at 1105°C (below the γ′ solvus) and subsequently oil quenched. A stress relief anneal was carried out for 8 hours at 760°C before machining 143mm outer diameter rings with a wall thickness of 10mm. In this condition, Alloy 720Li displays a tri-modal γ′ distribution of intergranular so- called primary γ′ (1-2µm), intragranular secondary (100-300nm) and fine tertiary (10-50nm) γ′ [6]. These rings were then inertia friction welded at Manufacturing Technology, Inc., South Bend USA. 477 Superalloys 2004 Edited by K.A. Green, T.M. Pollock, H. Harada, TMS (The Minerals, Metals & Materials Society), 2004 T.E. Howson, R.C. Reed, J.J. Schirra, and S, Walston
Transcript of Characterisation of Gamma-Prime Across Inertia … of across inertia friction welded Alloy 720Li ......

Characterisation of �� across inertia friction welded Alloy 720Li
M. Preuss1, J. Quinta da Fonseca1, I. Kyriakoglou2, P.J. Withers1, G.J. Baxter3 1 Manchester Materials Science Centre, Univ. of Manchester & UMIST, Grosvenor St, Manchester, M1 7HS, United Kingdom
2 School of Engineering, Metallurgy and Materials, The University of Birmingham, Edgbaston, Birmingham, B15 2TT, United Kingdom 3 Rolls-Royce plc., Derby, DE24 8BJ, United Kingdom
Keywords: inertia friction welding, Alloy 720Li, gamma prime
Abstract
A comprehensive characterization of γ′ in inertia friction welded Alloy 720Li has been undertaken to quantify the dramatic variation of the γ′ microstructure in the heat affected zone (HAZ) and the effect of the post weld heat treatment (PWHT). Experiments were performed on samples in the as-welded and two different PWHT conditions. High energy synchrotron diffraction was used to investigate the overall variation of γ′ volume fraction across the weld line with a high spatial resolution. During this experiment it was also possible to determine the misfit between γ and γ′ as a function of position in the HAZ and the base material. In addition high and ultra high resolution field emission gun scanning electron microscopy (FEGSEM) studies were carried out in order to individually characterize primary, secondary, tertiary γ′ and γ′ that had reprecipitated upon cooling at the end of the friction welding process. To study the relation between γ′ variation and any changes of strength in the welds, microhardness tests were performed on the three samples. The high energy synchrotron diffraction measurements revealed that in the as-welded condition the HAZ was depleted in γ′ with a trough observed at about 1.5mm from the weld line. No variation in γ′ volume fraction was observed in the two PWHT conditions. FEGSEM studies revealed that at the weld line primary, secondary and tertiary γ′ had been dissolved during the welding process and that reprecipitated γ′ could be observed, even in the as-welded condition. The reprecipitated γ′ appeared to be smallest not at the weld line but at around 1mm axially away from it. Between 1 and 4mm from the weld line, significant coarsening of tertiary was observed even though the welding process had taken only a few seconds to complete. The recorded microhardness of the as-welded sample can be understood in terms of γ′ depletion and the non-optimal particle size of the fine tertiary and reprecipitated γ′. Both PWHT conditions displayed a pronounced microhardness increase towards the weld line that can be explained by the large volume fraction of reprecipitated and coarsened γ′ in this region. Measurements of the lattice misfit between γ and γ′ showed a variation in the HAZ of the welds. A γ/γ′ misfit between 0.11% to 0.15% was observed in the base material of the three samples studied and a minimum of about 0.05% misfit was measured at about 1mm from the weld line. In all cases the lattice spacing of the matrix (γ) was smaller than the lattice spacing of the coherent γ′ precipitates, i.e. representing a positive γ/γ′ misfit. At the moment the nature of the γ/γ′ misfit variation is not clear but it can be assumed that it is related to the temperature history that the material experienced in this region.
Introduction
In order to meet the demand for better high temperature properties, the new generation of rotor disk nickel-base Superalloys has a significantly higher volume fraction of γ ′ than conventional Superalloys. These alloys are usually very difficult to weld and are prone to micro-cracking as solidification takes place during welding [1, 2]. Therefore, inertia friction welding (IFW) is a very attractive welding process since it does not involve any melting, provided optimum welding parameters are chosen. In IFW, one of the work-pieces is connected to a flywheel and the other is restrained from rotating. The flywheel is accelerated to a predetermined rotational speed, then disengaged and the work-pieces are forced together under pressure. The kinetic energy stored in the rotating flywheel is dissipated as heat through friction/shearing at the weld interface. In this way, it is possible to join advanced nickel-base Superalloys like RR1000 and Alloy 720Li, which produce unacceptable welds by electron beam welding [3]. Since the friction welding process only takes a few seconds the material in the heat affected zone (HAZ) experiences extreme heating and cooling rates. This results in a heavily modified HAZ microstructure. These microstructural changes include changes in the γ′ distributions, γ grain size, misfit between γ and γ′ and work hardening [4, 5]. Hardness and microstructural mapping of as-welded conditions of IFWs are essential for understanding the welding process. They can support the development of optimum welding parameters and give indications of how different Superalloys behave during welding. Another important aspect of inertia friction welding nickel-base Superalloys is the post weld heat treatment (PWHT), which reduces the residual stresses generated during welding. It is a critical step in the process because it is important to relieve the residual stresses without compromising the microstructure/ mechanical properties. In terms of microstructural changes, the PWHT mainly effects the distribution of fine γ′, which, in turn, has a significant effect on the hardness of the HAZ [4].
Experimental Materials and Specimens The inertia friction welded material investigated was Alloy 720Li whose nominal chemical composition is given in Table 1. The material used for the welding trials was cast and wrought material solution heat treated for 4 hours at 1105°C (below the γ′ solvus) and subsequently oil quenched. A stress relief anneal was carried out for 8 hours at 760°C before machining 143mm outer diameter rings with a wall thickness of 10mm. In this condition, Alloy 720Li displays a tri-modal γ′ distribution of intergranular so-called primary γ′ (1-2µm), intragranular secondary (100-300nm) and fine tertiary (10-50nm) γ′ [6]. These rings were then inertia friction welded at Manufacturing Technology, Inc., South Bend USA.
477
Superalloys 2004Edited by K.A. Green, T.M. Pollock, H. Harada,
TMS (The Minerals, Metals & Materials Society), 2004T.E. Howson, R.C. Reed, J.J. Schirra, and S, Walston

Table1: Chemical composition (wt%) of Alloy 720Li: Ni Cr Co Mo W Al Ti C B bal 16 15 3 1.25 2.5 5.0 0.015 0.015 For the work presented in this paper, small samples including the weld line were cut from one weld in the as-welded condition. Figure 1 shows a) an example of an Alloy 720Li inertia friction weld and b) illustrates the direction the small samples were taken from the weld. In order to study the affect of the PWHT on the γ′ distribution, identically sized slices were heat treated in tube furnaces under argon atmosphere for either 8 hours at 760°C (PW1) or 2 hours at 810°C (PW2).
a) b) Fig.1: a) Example of a 143mm inertia friction weld (Alloy 720Li) in the as-welded condition, b) illustration of the direction the small samples were taken from the weld for metallurgical studies. The flash on the inner and outer diameter at the weld line results from the material being ejected during the friction welding process. Hardness testing 5mm thick samples in the as-welded and the two PWHT conditions were ground and polished using colloidal silica for the final polishing step. In order to study the microstructure after hardness testing, γ′ was dissolved from the polished surfaces using an etchant, the composition of which is given in Table 2. Hardness testing was then carried out under a load of 1kg using a calibrated Vickers hardness indentation machine. The polished and etched samples were aligned with the indented surface perpendicular to the hoop direction. For each sample, measurements were carried out on a grid of 5 lines parallel to the axial direction and spaced greater than 4 indentations apart. Measurements were taken from the weld line to a distance 6 mm away from it, with smaller increments close to the weld line. The accuracy of the axial position of the indentation marks was estimated to be within 10µm. The results presented are the average of the 5 measurements per axial position. Table2: Chemical composition of the γ′-etchant
Part 1: Part 2: 150 ml H2O 15 ml HNO3 150 ml HCL 25 ml H2O 2.5 g MoO3 30 ml Part 1
Electron microscopy Since the γ′ distribution is known to vary dramatically over a few millimeters in inertia friction welded nickel-base Superalloys [4], spatial accuracy during microstructural studies is of great
importance. High resolution FEGSEM studies on samples etched according to [4] enable one to study γ′ with a resolution of a few nanometers. Simpler sample preparation means that a FEGSEM gives better spatial accuracy in an inertia friction welded sample compared to transmission electron microscopy,. For this work a Philips XL30 FEGSEM and a recently acquired FEI Sirion FEGSEM were used to analyze the axial changes in γ′ microstructure of each sample. In case of the FEI Sirion FEGSEM a through lens detector could be facilitated that gave a superior resolution compared to the Philips XL30 FEGSEM using the secondary detector mode. The hardness indentation marks were used as reference markers to determine axial position in the FEGSEM. The volume fraction and precipitation size of primary γ′ was determined by using the linear intercept method on five images per axial position. In order to determine the mean volume fraction and particle size of secondary γ′, image analysis was carried out using the Kontron KS 400 software package. Five images at each axial position were taken within γ grains, avoiding primary γ′. Consequently the determined volume fractions of secondary γ′ should be regarded as values in the center of γ grains and not a true overall value. The quantitative analysis of tertiary γ′ proved to be more difficult because the resolution of the Philips XL30 FEGSEM was insufficient. Although the FEI Sirion FEGSEM might have sufficient resolution to study tertiary or reprecipitated γ′, it was felt that in terms of image analysis more work has to be carried out before reliable results can be obtained. High energy synchrotron diffraction By mapping the (100) or (110) superlattice reflection together with the (200) or (220) reflection across the weld line, a significant amount of information about the variation of γ′ volume fraction and lattice misfit between γ and γ′ can be obtained. To this end, high energy synchrotron x-ray diffraction profile measurements were carried out on the ID11 beam line at the European Synchrotron Radiation Facility (ESRF) in Grenoble, France using a CCD area detector (2000x2000pixel, 16bit CCD camera). Due to the fibre optics, the CCD camera has a known distortion, which is corrected for when using the analysis software. However, a slight mismatch of the lattice parameter measured on different diffraction peaks was found when measuring a Silicon calibration sample. For this reason, measurements of the calibration sample were undertaken between each scan of a weld sample. The calibration measurements were then used to eliminate any distortion still observed with the CCD camera used during the experiment. Measurements were made in transmission on slices cut from the inertia welded ring so as to contain the axial and radial directions and then electropolished to an average thickness of 2mm. A monochromatic beam of 50 keV energy (λ = 0.241Å) was stopped down by slits to 150 µm in the axial and 1.5 mm in the radial direction and scanned (axially) across the weld. The CCD detector was set up in a way that diffraction peaks between the (100) superlattice reflection and the (220) reflections could be recorded simultaneously. In order to achieve the maximum resolution with the given area detector, the camera was placed off-center with the largest possible camera length. In this way only parts of the Debye-Scherrer cones were recorded during the scans. The high intensity of the synchrotron beam allowed accurate measurements of the (100) and (110) superlattice reflection, arising from the ordered γ′ phase (LI2 structure). Since the (100) and (110) reflections were systematically absent for the disordered γ matrix phase, by
+z
-z
HOOP
AXIAL
sample takenfrom the weld
478

normalizing the integrated intensity of the (100) or (110) superlattice reflections with the integrated intensity of the (200) or (220) reflections, any influence of the texture on the measurement could be eliminated and the obtained value related to the volume fraction of γ′ [7, 8, 9]. Because the main reflections, such as the (200) peak, consist of two reflections, namely the (200)γ and (200)γ′ reflections, the lattice misfit between the two phases can be measured by determining the position of each peak. For relatively large misfits between γ and γ′, this can be done on a synchrotron beam line by scanning the double peaks with a high resolution. When small coherency strains are to be measured, the misfit can be determined by measuring the position of the (100)γ′ superlattice reflection, together with the (200) reflection. This allows the determination of the position of the (200)γ′ reflection from the superlattice peak so that the position of the (200)γ can be deduced from a double Gaussian fit with the (200)γ′ position known. Once the positions of the overlapping double reflection were determined, it was possible to calculate the lattice misfit εc using equation 1:
γ
γγεd
ddc
−= '
(1)
where dγ′ is the lattice spacing of the γ′ phase and dγ is the lattice spacing of the γ matrix.
Results and Discussion Microhardness profiles
420
440
460
480
500
520
HV1
0 1 2 3 4 5 6
z/mm
awPW1PW2
Fig.2: Microhardness profile as a function of axial position for the as-welded condition and after PWHT for 8 hours at 760°C (PW1) and for 2 hours at 810°C (PW2). Each hardness value is an average of 5 measurement points with an average standard deviation of 7HV1. It can be seen in Figure 2 that the three conditions all exhibit a hardness of about 460HV1 in the base material (z > 4mm). The as-welded sample displays a hardness trough of about 420HV1 at 1.5 from the weld line. At the weld line, the as-welded sample shows a hardness of 475HV1, which is slightly higher than in the base material. In contrast to the as-welded condition, both PWHT samples show no indication of a hardness trough in the HAZ. Instead, the hardness remains relatively constant beyond 1.5mm
from the weld line. PW1 and PW2 exhibit a significant hardness peak between the weld line and 1.5mm from it. In this region, the hardness profiles resemble that of the as-welded condition but shifted to higher hardness by about 20-30HV1. In the following sections, emphasis is placed on characterizing the variation of γ′ across the weld line in order to gain a better understanding of the hardness profiles in the as-welded and PWHT conditions. γ′ distribution Figure 3 compares the hardness profile with the normalized intensity profile of the (100) superlattice reflection (measured by using high energy synchrotron diffraction) for the as-welded condition. A trough of the normalized (100) intensity can be observed, which coincides with the corresponding trough in hardness. This result suggests that the loss of hardness in the HAZ can be attributed primarily to γ′ depletion. It is interesting to note that, according to the normalized (100) intensity profile, the volume fraction of γ′ seems to increase between z = 1mm and the weld line. It should also be noted that the normalized intensity of the (110) superlattice reflection gave essentially the same profile with a minimum observed at z = 1.2mm. Previous high energy synchrotron measurements carried out on inertia friction welded RR1000 (similar γ′ volume fraction) in the as-welded condition showed a similar profile [4] with an trough in intensity close to the weld line and an intensity increase towards the weld line.
410
420
430
440
450
460
470
480
HV1
0.010
0.015
0.020
0.025
I(100)/I(200)
0 1 2 3 4 5 6
z/mm
0 1 2 3 4 5 6
HV1
I(100)/I(200)
as-welded
Fig.3: Hardness profile and normalized (100) intensity as a function of axial position (z) for the as-welded condition of inertia friction welded Alloy 720Li. Both profile show a trough between 1 and 1.5mm from the weld line. Figure 3 shows that when approaching the weld line, the hardness starts to decrease from about 2.5mm away. This position coincides with the point at which the γ′ volume fraction starts to drop significantly, as indicated by the normalized (100) intensity. However, Figure 3 also shows a slightly lower γ′ volume fraction between 2.5 and 3.5mm from the weld line compared to the base material, which is not reflected in the hardness profile. Figure 4 compares the normalized (100) intensity profiles for the as-welded and the two PWHT conditions, PW1 and PW2. It is evident that, in contrast to the as-welded condition, neither PWHT samples displayed any γ′ depletion in the HAZ. This is an important finding, since previous studies of inertia friction welded
479

RR1000 had shown that for that alloy the conventional PWHT was not sufficient to fully reprecipitate γ′.
0.010
0.012
0.014
0.016
0.018
0.020
0.022
I(10
0)/I(
200)
-2 -1 0 1 2 3 4 5 6
z/mm
as-welded
PW1
PW2
Fig.4: Normalized (100) intensity as a function of axial position (z) for the as-welded, PW1 (8h at 760°C) and PW2 (2h at 810°C) conditions. Whereas the as-welded profile clearly indicates a γ′ depleted region between the weld line and 3.5mm, no γ′ depletion was evident in the HAZ for either PWHT. While the results shown in Figure 4 indicate that the diffraction method gives a useful indication of the overall γ′ content it can not distinguish between the different families of γ′. In order to investigate the γ′ distribution of primary, secondary, tertiary and reprecipitated γ′, high resolution FEGSEM studies were carried out.
250nm
a)
250nm
b)
250nm
c)
250nm
d) Fig.5: Typical FEGSEM images of intragranular γ′ in the as-welded sample; a) weld line, b) 0.5mm, c) 1mm and d) 4mm from the weld line Figure 5a-d shows typical high resolution FEGSEM (Philips XL30) images of γ′ for the as-welded condition as a function of distance from the weld line. Even though the resolution of the Philips FEGSEM images is not sufficient to carry out a quantitative analysis of the very fine intragranular γ′, Figure 5a clearly indicates a relatively large volume fraction of fine γ′ at the weld line. A comparison of the very fine γ′ at the weld line (Figure 5a) and at z = 4mm (Figure 5d) demonstrates the considerably smaller precipitation size of the fine γ′ at the weld line. Since no primary and secondary γ′ was observed at the weld line, it seems that the driving force for the reprecipitation of γ′ was large enough even though the material was exposed to severe cooling conditions at the end of the inertia friction welding process. Figure 5b demonstrates that 0.5mm from the weld line secondary γ′ (precipitation size of about 200-300nm) is still apparent but tertiary γ′ seems to have been fully dissolved during the joining process. Further from the weld line, at z = 1mm (Figure 5c), both secondary and a low volume fraction of tertiary γ′ can be observed. In order to have a clearer picture of the reprecipitation of γ′ in the near weld line region ultra high resolution images were recorded on a FEI Sirion FEGSEM. Because the Sirion is equipped with a through lens detector and a 2500x2000 pixel camera, it is possible to resolve features of a few nanometers. Figure 6a-c displays the fine γ′ distribution at a) the weld line b) 0.5mm and c) 1mm from the weld line in the as-welded condition. The high magnification images (100000x) display a relatively high volume fraction of
480
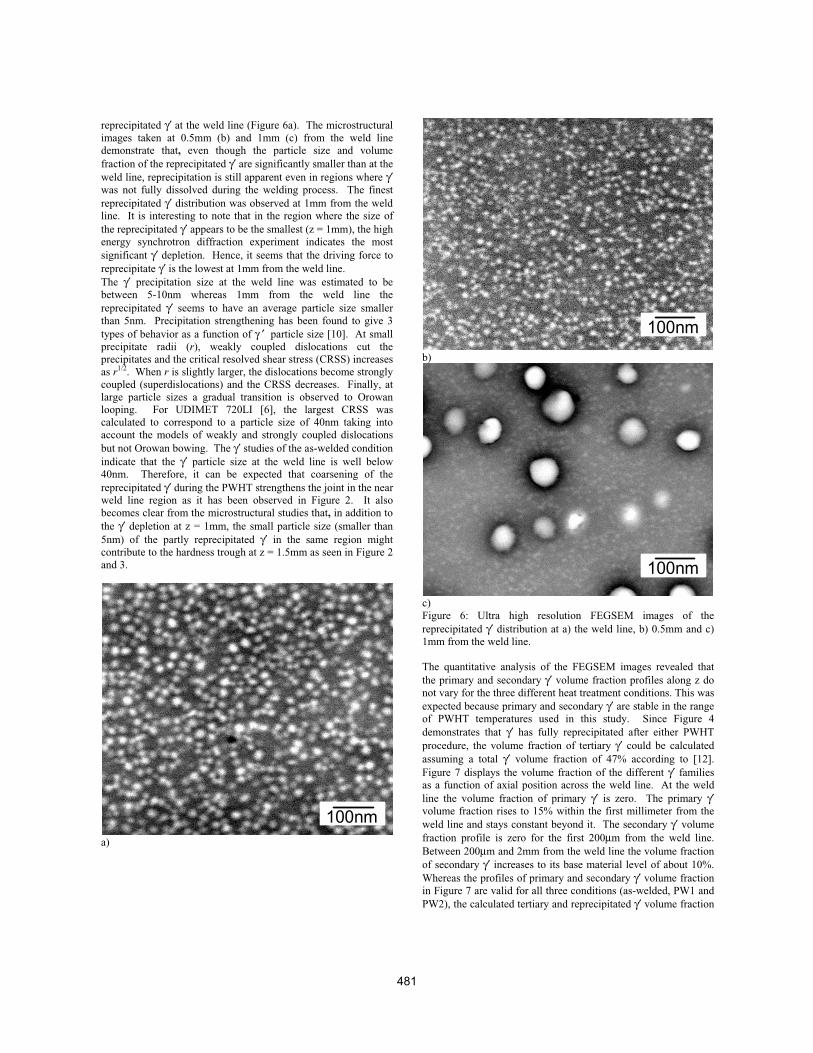
reprecipitated γ′ at the weld line (Figure 6a). The microstructural images taken at 0.5mm (b) and 1mm (c) from the weld line demonstrate that, even though the particle size and volume fraction of the reprecipitated γ′ are significantly smaller than at the weld line, reprecipitation is still apparent even in regions where γ′ was not fully dissolved during the welding process. The finest reprecipitated γ′ distribution was observed at 1mm from the weld line. It is interesting to note that in the region where the size of the reprecipitated γ′ appears to be the smallest (z = 1mm), the high energy synchrotron diffraction experiment indicates the most significant γ′ depletion. Hence, it seems that the driving force to reprecipitate γ′ is the lowest at 1mm from the weld line. The γ′ precipitation size at the weld line was estimated to be between 5-10nm whereas 1mm from the weld line the reprecipitated γ′ seems to have an average particle size smaller than 5nm. Precipitation strengthening has been found to give 3 types of behavior as a function of γ ′ particle size [10]. At small precipitate radii (r), weakly coupled dislocations cut the precipitates and the critical resolved shear stress (CRSS) increases as r1/2. When r is slightly larger, the dislocations become strongly coupled (superdislocations) and the CRSS decreases. Finally, at large particle sizes a gradual transition is observed to Orowan looping. For UDIMET 720LI [6], the largest CRSS was calculated to correspond to a particle size of 40nm taking into account the models of weakly and strongly coupled dislocations but not Orowan bowing. The γ′ studies of the as-welded condition indicate that the γ′ particle size at the weld line is well below 40nm. Therefore, it can be expected that coarsening of the reprecipitated γ′ during the PWHT strengthens the joint in the near weld line region as it has been observed in Figure 2. It also becomes clear from the microstructural studies that, in addition to the γ′ depletion at z = 1mm, the small particle size (smaller than 5nm) of the partly reprecipitated γ′ in the same region might contribute to the hardness trough at z = 1.5mm as seen in Figure 2 and 3.
a)
b)
c) Figure 6: Ultra high resolution FEGSEM images of the reprecipitated γ′ distribution at a) the weld line, b) 0.5mm and c) 1mm from the weld line. The quantitative analysis of the FEGSEM images revealed that the primary and secondary γ′ volume fraction profiles along z do not vary for the three different heat treatment conditions. This was expected because primary and secondary γ′ are stable in the range of PWHT temperatures used in this study. Since Figure 4 demonstrates that γ′ has fully reprecipitated after either PWHT procedure, the volume fraction of tertiary γ′ could be calculated assuming a total γ′ volume fraction of 47% according to [12]. Figure 7 displays the volume fraction of the different γ′ families as a function of axial position across the weld line. At the weld line the volume fraction of primary γ′ is zero. The primary γ′ volume fraction rises to 15% within the first millimeter from the weld line and stays constant beyond it. The secondary γ′ volume fraction profile is zero for the first 200µm from the weld line. Between 200µm and 2mm from the weld line the volume fraction of secondary γ′ increases to its base material level of about 10%. Whereas the profiles of primary and secondary γ′ volume fraction in Figure 7 are valid for all three conditions (as-welded, PW1 and PW2), the calculated tertiary and reprecipitated γ′ volume fraction
100nm
100nm
100nm
481

is only valid for the PWHT conditions. It can be seen in Figure 7 that between the weld line and 2mm from it, the calculated volume fraction of very fine γ′ increases dramatically towards the weld line. When comparing the calculated fine γ′ profile with the hardness profiles of PW1 and PW2 it becomes apparent that the hardness increase in the near weld line region can be attributed to the refined and fully reprecipitated γ′ distribution.
0
10
20
30
40
50
vol.%
0 1 2 3 4
z/mm
primary (aw, PW1, PW2)
secondary (aw, PW1, PW2)
tertiary + reprecipated(PW1, PW2)
Figure 7: Primary, secondary and tertiary γ′ volume fraction as a function of axial position. Note that the profiles shown here for primary and secondary γ′ were measured in the as-welded condition. Even though the hardness peak in the near weld line region is well explained by the high volume fraction of fine γ′, the hardness profiles shown in Figure 2 also indicate a HAZ of about 4mm, that is not reflected in Figure 7. Figure 8a and b are ultra high resolution images of the fine γ′ distribution in the PW2 sample taken at z =1.5mm and 6mm. The comparison reveals that, even though the combined volume fraction of tertiary and reprecipitated γ′ seems to stay constant beyond 2mm from the weld line, the content of tertiary and reprecipitated γ′ still varies individually. In Figure 8a, tertiary and reprecipitated γ′ can be clearly distinguished by their different mean particle size, whereas in the base material (z = 7mm, Figure 8b) only tertiary γ′ can be observed. The comparison of the two positions also reveals significant coarsening of tertiary γ′ at 1.5mm from the weld line. The tertiary γ′ coarsening can be observed in all three samples (as-welded, PW1 and PW2) between 1mm and 4mm from the weld line. The degree of coarsening is surprising since the material was only briefly exposed to high temperatures (range of seconds). However, at z = 1.5mm tertiary γ′ has grown to a precipitation size of 50-80nm compared to 20-30nm in the base material. It seems that the expected loss of strength between 1mm and 4mm from the weld line due to tertiary γ′ coarsening is compensated by the fine reprecipitated γ′, which is found between the relatively coarse tertiary γ′.
a)
b) Figure 8: Ultra high resolution FEGSEM images of a) coarsened tertiary and reprecipitated γ′ at z =1.5mm from the weld line (as-welded condition; b) only tertiary γ′ in the base material (z = 7mm).
100nm
tertiary γ′
reprecipitated γ′
100nm
482

γ/γ′ misfit
0.05
0.10
0.15
0.20
0.25
γ γ/ ' misfit/%
-2 -1 0 1 2 3 4 5 6
z/mm
as-welded
PW1
PW2
Figure 9: Misfit between γ and γ′ as a function of axial position across the weld line in the as-welded conditions and after PWHT for 8 hours at 760°C (PW1) and for 2 hours at 810°C (PW2). The weld line is located at z = 0mm. Note the reduced misfit between γ and γ′ in all three conditions at around 1mm from the weld line. The high energy synchrotron diffraction scans on ID11 at the ESRF, Grenoble, France, were also used to measure the lattice misfit between the γ matrix and the coherent γ′ precipitates. As mentioned before, since the lattice misfit was expected to be relatively small, the recorded position of the superlattice reflections were used to deconvolute the corresponding γ/γ′ double peaks. Figure 9 plots the lattice misfit between γ and γ′ across the weld line for the as-welded and the two PWHT conditions. In this case the misfit was determined by measuring the d-spacing of the (100) reflection and using this information to deconvolute the (200)γ and (200)γ′ reflection. The mean misfit of the base material between the two phases was determined to be 0.13% in the as-welded condition, 0.12% when the material was PWHT for 8 hours at 760°C (PW1) and 0.10% when the material had been exposed to a 2 hours at 810°C PWHT. It is worth noting again that the base material was aged for 8 hours at 760°C prior welding and any PWHT represented an additional annealing/aging procedure for the base material. It is also important to realise that a considerable scatter of the lattice misfit was observed in the base material. It is therefore interesting to note that, despite this scatter, the measurements in the base material indicate a slight decrease of lattice misfit with additional aging time. In the HAZ of the welded samples, the γ/γ′ misfit varies significantly. The most pronounced variation can be found in the as-welded condition, which displays an average 0.17% misfit around the weld line, a minimum γ/γ′ misfit at about 1mm from the weld line (0.05%) and a slight peak of 0.18% misfit at z = 2.5mm. It is interesting to note that the slight hardness peak observed around 2.5mm from the weld line coincides with the γ/γ′ misfit peak in the same axial position. When comparing with Figure 3 and 4 it becomes apparent that in the region of most pronounced γ′ depletion (z = 1mm), the γ/γ′ misfit seems to be smallest. This could suggest that the misfit in this region is largely governed by γ′, which had not been dissolved during welding but had been
exposed to a very high temperature during process. Both PWHT’s seem to relieve the high lattice misfit regions observed in the as-welded condition but do not change the low misfit region seen at 1mm from the weld line. This indicates that the γ′ chemistry is more stable in the low than in the high lattice misfit region.
Conclusion In this paper γ′ in inertia friction welded Alloy 720Li has been studied in detail in the as-welded and two different PWHT conditions. Hardness profiles have been recorded in order to map the variation of strength across the weld line. Subsequently, the microstructure has been studied by means of high-energy synchrotron diffraction and high resolution electron microscopy. The conclusions can be summarized as follows: 1. In the as-welded condition inertia friction welded Alloy
720Li exhibits a hardness trough in the HAZ approximately 1mm from the weld line.
2. In the as-welded condition, the volume fraction of γ′ appears to be the lowest in the region of the hardness trough and not at the weld line.
3. The region of the hardness trough also coincides with the smallest size of reprecipitated γ′ in the HAZ.
4. Between 1mm and 4mm from the weld line significant coarsening of tertiary γ′ can be observed.
5. After PWHT, a steep hardness increase is observed in the HAZ towards the weld line. The maximum hardness is about 10% higher than in the base material
6. The as-welded condition exhibits slightly increased lattice misfit between γ and γ′ at the weld line and 2.5mm from it, which seems to increase the strength of the material. The misfit peaks disappear during PWHT.
Acknowledgement
The authors would like to thank Dr. J. Wright and Dr. G. Vaughan (ESRF, ID11) and M. Faulkner (Manchester Materials Science Center) for experimental assistance. The work was financially supported by EPSRC (GR/M63836 and GR/S06820), Rolls-Royce plc and a Royal Society-Wolfson Merit Award (PJW).
References [1]: J.K. Tien and T. Caulfield (eds): Superalloys,
Supercomposites and Superceramics, Academic Press INC (London) LTD, 1989, pp. 142-143.
[2]: C.T. Sims and W.C. Hagel (eds.): The Superalloys, John Wiley, New York, 1972, pp. 509-532.
[3]: G.H. Gessinger: Powder Metallurgy of Superalloys, Butterworths, London, 1984, 293-327.
[4]:M. Preuss, J.W.L. Pang, P.J. Withers, G.J. Baxter: Met. and Mat. Trans. A, 33A, 2002, 3115-3125.
[5]:G.J. Baxter, M. Preuss, P.J. Withers, Int. Conf. on The Microstructure and Performance of Joints in High-Temperature Alloys, London, UK, November 2002, to be published in Science and Technology of Welding and Joining
[6]:M.P. Jackson and R.C. Reed: Mater. Sci. Eng. A, vol. 259, 1999, pp. 85-97.
[7]: A. Royer, P. Bastie and M. Véron: Scr. Mater., Vol 37, pp. 1199-1205.
[8]:A. Royer, P. Bastie and M. Véron: Scr. Mater., Vol 40, pp. 955-961.
483

[9]: A. Royer, P. Bastie and M. Véron: Acta Mater., vol. 46, 1998,
pp. 5357-5368. [10]: B. Reppich, P. Schepp and G. Wehner: Acta Metall., 30,
1982, pp. 95-104. [12 ]: R.J Mitchell, M. Preuss, S. Tin: to be published in
Superalloy 2004.
484