CHARACTER │ LEADERSHIP │ INFLUENCE │ BREAKTHROUGH · • Camping Program 6.0 Parent, Teacher...
16
CHARACTER │ LEADERSHIP │ INFLUENCE │ BREAKTHROUGH 1
Transcript of CHARACTER │ LEADERSHIP │ INFLUENCE │ BREAKTHROUGH · • Camping Program 6.0 Parent, Teacher...

CH AR AC T E R │ L E AD E R S H I P │ I NFL UE N CE │ B RE AK T H R O UG H 1

CH AR AC T E R │ L E AD E R S H I P │ I NFL UE N CE │ B RE AK T H R O UG H 2
Headmaster’s Foreword It is with great pleasure that I present the Annual Report for 2017 to our College community. The following report provides information and data on a range of key indicators within the College and serves a dual role in meeting State and Federal legislation regarding statutory requirements, as well as providing the wider College community with a snapshot of our College achievements in 2017. Our College was established in 1989 as a result of obedience to the word given to Pastor Claude Fingleton and as a ministry of the Cathedral of Praise Church to provide quality Christian education to the wider community of Rockhampton and the Capricorn region. The school officially commenced in 1989 with two teachers and 29 students and has steadily grown in both size and influence since that time and has earned a reputation as a quality education provider within the wider community. The governance of Heights College is seamlessly aligned with the local sponsoring church, with the senior pastor holding the position of Chairman of the Board and each board representative being required to be a member of Cathedral of Praise Church.
Heights College seeks to provide a distinctively Christian education grounded on biblical values and the promotion of a caring, positive, challenging and engaging learning environment for all students. Our values of honour, integrity, love, service and excellence we seek to nurture in students in all that they do throughout their school journey. The College seeks to develop the whole child: intellectually, physically, spiritually, emotionally, and socially.
The College credo, 'For Excellence, For Greatness, For Christ' is the motivation applied to all facets of the College. Heights College is proud of its well-equipped classrooms, technological resources, landscaped grounds and integrated curriculum across four sub-schools: Kindergarten, Primary, Middle and Senior.
A diverse and rich sports program with many successful teams and a vibrant creative arts program are available for students from Primary school up. Alternative pathways in Senior such as student university partnerships and school based apprenticeships provide the opportunity for all students to develop their talents and abilities.
We are truly thankful for the achievements, celebrations and accomplishments of 2017 and are pleased to share some of these with you through this report.
For Excellence, For Greatness, For Christ,
Mr Darren Lawson Headmaster

CH AR AC T E R │ L E AD E R S H I P │ I NFL UE N CE │ B RE AK T H R O UG H 3
1.0 General School Information
Heights College is situated in Rockhampton on the corner of Yaamba Road and Carlton Street, directly opposite CQUniversity. It is located close to the Bruce Highway and is serviced by bus services both
locally and from Gracemere, the Caves and Capricorn Coast. Heights College also runs its own fleet of buses with a door-to-door service. In 2017, our student enrolment in Kindergarten – Year 12 was 793 students.
College Address: 276 Carlton Street, Kawana, North Rockhampton Postal Address: PO Box 5671, Red Hill Rockhampton, Queensland 4701 Phone: 07 4936 1076 Fax: 07 4936 3952 Website: www.heights.qld.edu.au Year Levels Offered: Kindergarten to Year 12 (Co-educational) School Sector: Independent Enrolments: 793 College Structure: Primary School – Kindergarten to Year 6 Middle School – Years 7, 8, 9 Senior School – Years 10, 11, 12 Affiliations: Heights College is an independent Christian College that is an
affiliated member of ISQ (Independent Schools Queensland) and ACS (Associated Christian Schools).
CH AR AC T E R │ L E AD E R S H I P │ I NFL UE N CE │ B RE AK T H R O UG H 4
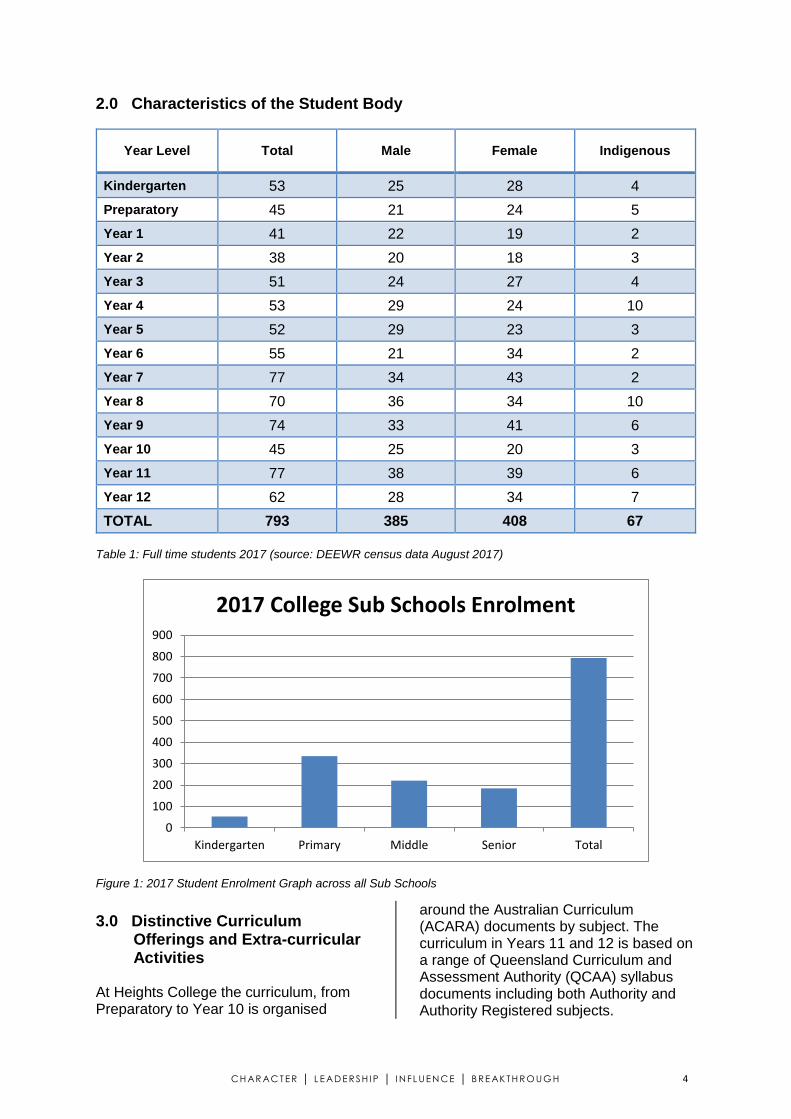
2.0 Characteristics of the Student Body
Year Level Total Male Female Indigenous
Kindergarten 53 25 28 4
Preparatory 45 21 24 5
Year 1 41 22 19 2
Year 2 38 20 18 3
Year 3 51 24 27 4
Year 4 53 29 24 10
Year 5 52 29 23 3
Year 6 55 21 34 2
Year 7 77 34 43 2
Year 8 70 36 34 10
Year 9 74 33 41 6
Year 10 45 25 20 3
Year 11 77 38 39 6
Year 12 62 28 34 7
TOTAL 793 385 408 67
Table 1: Full time students 2017 (source: DEEWR census data August 2017)
Figure 1: 2017 Student Enrolment Graph across all Sub Schools
3.0 Distinctive Curriculum Offerings and Extra-curricular Activities
At Heights College the curriculum, from Preparatory to Year 10 is organised
around the Australian Curriculum (ACARA) documents by subject. The curriculum in Years 11 and 12 is based on a range of Queensland Curriculum and Assessment Authority (QCAA) syllabus documents including both Authority and Authority Registered subjects.
0
100
200
300
400
500
600
700
800
900
Kindergarten Primary Middle Senior Total
2017 College Sub Schools Enrolment
CH AR AC T E R │ L E AD E R S H I P │ I NFL UE N CE │ B RE AK T H R O UG H 5
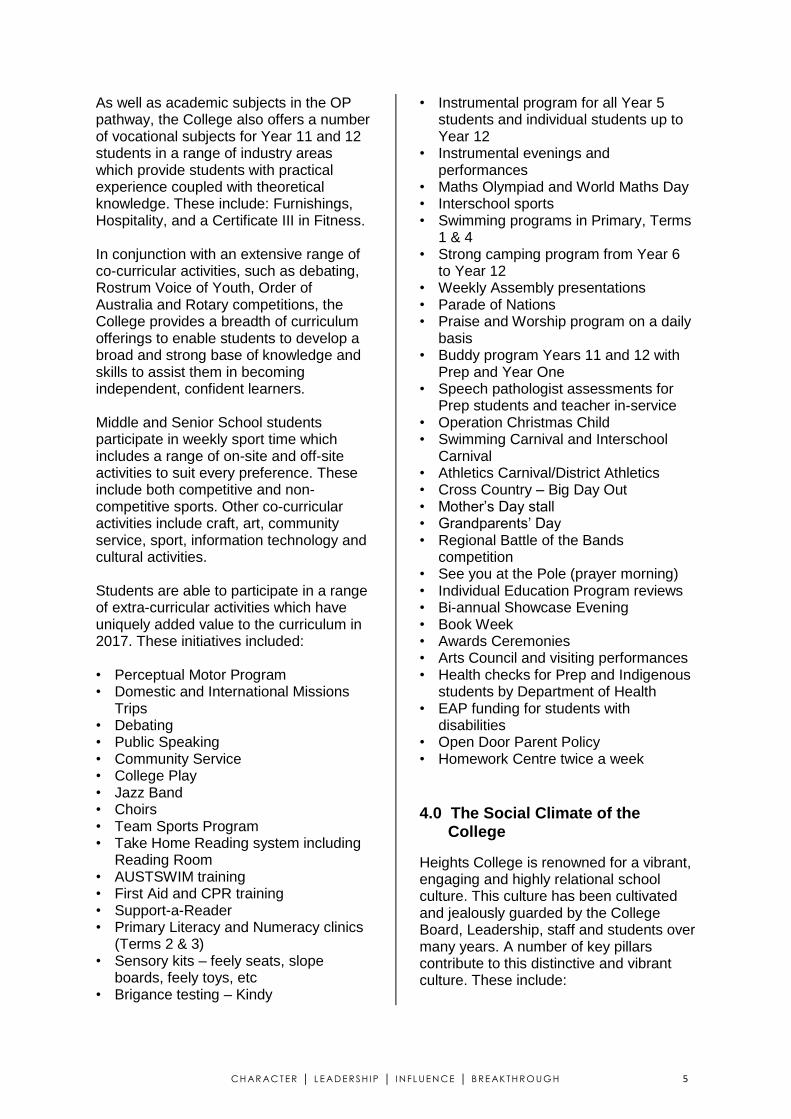
As well as academic subjects in the OP pathway, the College also offers a number of vocational subjects for Year 11 and 12 students in a range of industry areas which provide students with practical experience coupled with theoretical knowledge. These include: Furnishings, Hospitality, and a Certificate III in Fitness. In conjunction with an extensive range of co-curricular activities, such as debating, Rostrum Voice of Youth, Order of Australia and Rotary competitions, the College provides a breadth of curriculum offerings to enable students to develop a broad and strong base of knowledge and skills to assist them in becoming independent, confident learners. Middle and Senior School students participate in weekly sport time which includes a range of on-site and off-site activities to suit every preference. These include both competitive and non-competitive sports. Other co-curricular activities include craft, art, community service, sport, information technology and cultural activities. Students are able to participate in a range of extra-curricular activities which have uniquely added value to the curriculum in 2017. These initiatives included: • Perceptual Motor Program • Domestic and International Missions
Trips • Debating • Public Speaking • Community Service • College Play • Jazz Band • Choirs • Team Sports Program • Take Home Reading system including
Reading Room • AUSTSWIM training • First Aid and CPR training • Support-a-Reader • Primary Literacy and Numeracy clinics
(Terms 2 & 3) • Sensory kits – feely seats, slope
boards, feely toys, etc • Brigance testing – Kindy
• Instrumental program for all Year 5 students and individual students up to Year 12
• Instrumental evenings and performances
• Maths Olympiad and World Maths Day • Interschool sports • Swimming programs in Primary, Terms
1 & 4 • Strong camping program from Year 6
to Year 12 • Weekly Assembly presentations • Parade of Nations • Praise and Worship program on a daily
basis • Buddy program Years 11 and 12 with
Prep and Year One • Speech pathologist assessments for
Prep students and teacher in-service • Operation Christmas Child • Swimming Carnival and Interschool
Carnival • Athletics Carnival/District Athletics • Cross Country – Big Day Out • Mother’s Day stall • Grandparents’ Day • Regional Battle of the Bands
competition • See you at the Pole (prayer morning) • Individual Education Program reviews • Bi-annual Showcase Evening • Book Week • Awards Ceremonies • Arts Council and visiting performances • Health checks for Prep and Indigenous
students by Department of Health • EAP funding for students with
disabilities • Open Door Parent Policy • Homework Centre twice a week
4.0 The Social Climate of the
College
Heights College is renowned for a vibrant, engaging and highly relational school culture. This culture has been cultivated and jealously guarded by the College Board, Leadership, staff and students over many years. A number of key pillars contribute to this distinctive and vibrant culture. These include:

CH AR AC T E R │ L E AD E R S H I P │ I NFL UE N CE │ B RE AK T H R O UG H 6
• Daily Praise and Worship across the College
• Student Welfare Program • Student Services Coordination • School Chaplaincy • EXTRA/Sport Program • Anti-Bullying Policy • Service opportunities – both locally and
internationally • Community celebrations and events
including Grandparents’ Day and Showcase Evening
5.0 Parental Involvement • Support-A-Reader Program (Prep-6) • Perceptual Motor Program (Kindy-
Prep) • Coaching of Sporting Teams • Musical involvement • Open policy for class involvement • Volunteers for Tuckshop, Reading and
assistance in classrooms • Camping Program
6.0 Parent, Teacher and Student
Satisfaction with the College
The College surveyed a number of staff, students and teachers regarding their satisfaction with the College and hosted a number of parent and staff forums, student workshops and whole school surveys to assist in our College’s development of a strategic plan. The following table highlights overall satisfaction across five key areas from our most recent survey:
Satisfied/ Highly Satisfied
Mission and Values 93%
Student Outcomes 83.95%
Student Welfare 85.78%
School Leadership 94%
Communication 86.45%
Table 2: Staff/Parent/Student Survey Details 2013 (source: Heights College School Survey 2013)
7.0 Achievements in 2017 In 2017 we saw the completion of our new Kindergarten which opened in Semester 2 with one full-time and two part-time Kindergarten classes and our Wrap Around Kindy Care program. Our Hospitality Centre was near completion at end of 2017 and available for use by students in early 2018. Much of the planning, ground work and approval processes for these building projects was accomplished in 2016. We are very pleased to report that as a school, our Heights College NAPLAN results continue to significantly improve. This year we were above the Qld state average in 19 out of 20 areas and equal in one area. We were above the Australian average in 17 out of 20 areas, equal in one area and just below in two. For the third year in a row, Heights College was named by ACARA as one of the top NAPLAN improvers in the country. The NAPLAN results of Heights College put us in the top 4% of schools in Australia for producing student improvement from Years 3 to 5 and Years 7 to 9. Our College continued to experience breakthrough within our sporting programs, winning district premierships and contributing many students to representative teams at both district, regional, state and national level. Special congratulations to Ty Hartwell who was chosen to represent Australia in Swimming. Students’ success was also evidenced in successful Debating teams, Battle of the Bands, Maths Competitions, Eisteddfods and other cultural events. The College participated in a diverse range of music and cultural performances, year level camps, excursions and theme days.
CH AR AC T E R │ L E AD E R S H I P │ I NFL UE N CE │ B RE AK T H R O UG H 7
8.0 School income broken down by Funding Source
Please refer to the My School website http://www.myschool.edu.au/ for information relating to Heights College financial information.
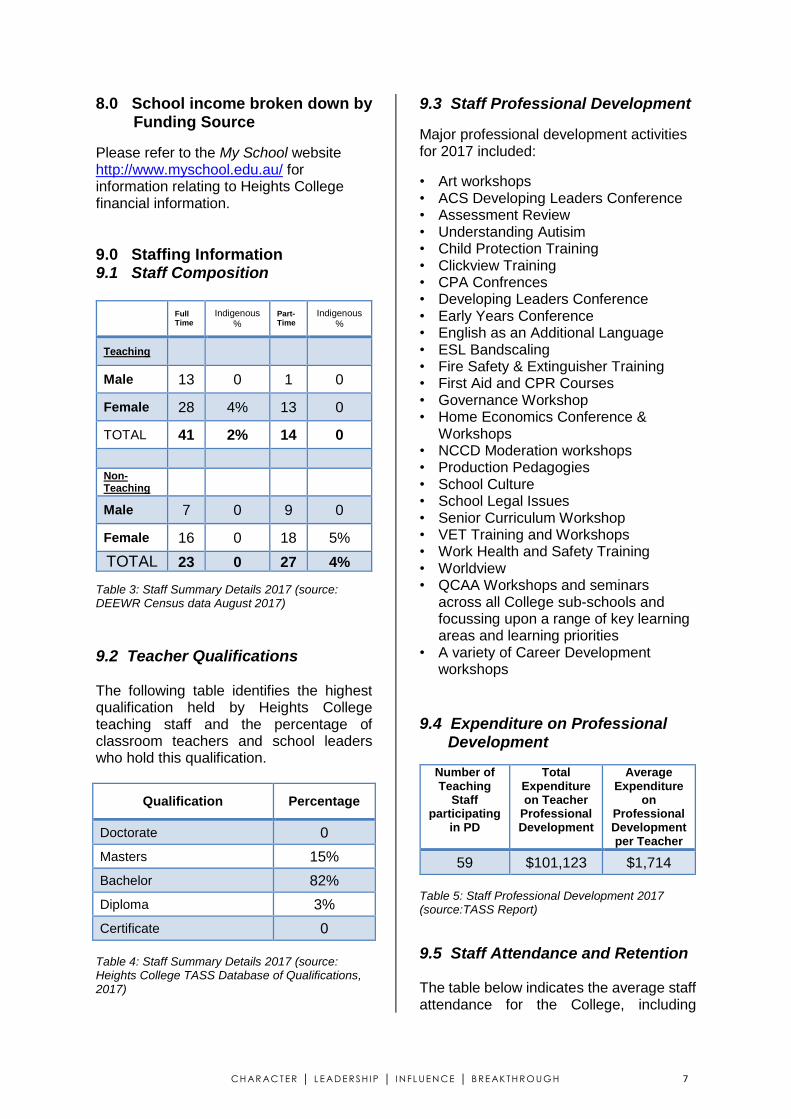
9.0 Staffing Information 9.1 Staff Composition
Full Time
Indigenous %
Part-Time
Indigenous %
Teaching
Male 13 0 1 0
Female 28 4% 13 0
TOTAL 41 2% 14 0
Non-Teaching
Male 7 0 9 0
Female 16 0 18 5%
TOTAL 23 0 27 4%
Table 3: Staff Summary Details 2017 (source: DEEWR Census data August 2017)
9.2 Teacher Qualifications The following table identifies the highest qualification held by Heights College teaching staff and the percentage of classroom teachers and school leaders who hold this qualification.
Qualification Percentage
Doctorate 0
Masters 15%
Bachelor 82%
Diploma 3%
Certificate 0
Table 4: Staff Summary Details 2017 (source: Heights College TASS Database of Qualifications, 2017)
9.3 Staff Professional Development
Major professional development activities for 2017 included:
• Art workshops • ACS Developing Leaders Conference • Assessment Review • Understanding Autisim • Child Protection Training • Clickview Training • CPA Confrences • Developing Leaders Conference • Early Years Conference • English as an Additional Language • ESL Bandscaling • Fire Safety & Extinguisher Training • First Aid and CPR Courses • Governance Workshop • Home Economics Conference &
Workshops • NCCD Moderation workshops • Production Pedagogies • School Culture • School Legal Issues • Senior Curriculum Workshop • VET Training and Workshops • Work Health and Safety Training • Worldview • QCAA Workshops and seminars
across all College sub-schools and focussing upon a range of key learning areas and learning priorities
• A variety of Career Development workshops
9.4 Expenditure on Professional
Development
Number of Teaching
Staff participating
in PD
Total Expenditure on Teacher
Professional Development
Average Expenditure
on Professional Development per Teacher
59 $101,123 $1,714
Table 5: Staff Professional Development 2017 (source:TASS Report)
9.5 Staff Attendance and Retention The table below indicates the average staff attendance for the College, including
CH AR AC T E R │ L E AD E R S H I P │ I NFL UE N CE │ B RE AK T H R O UG H 8
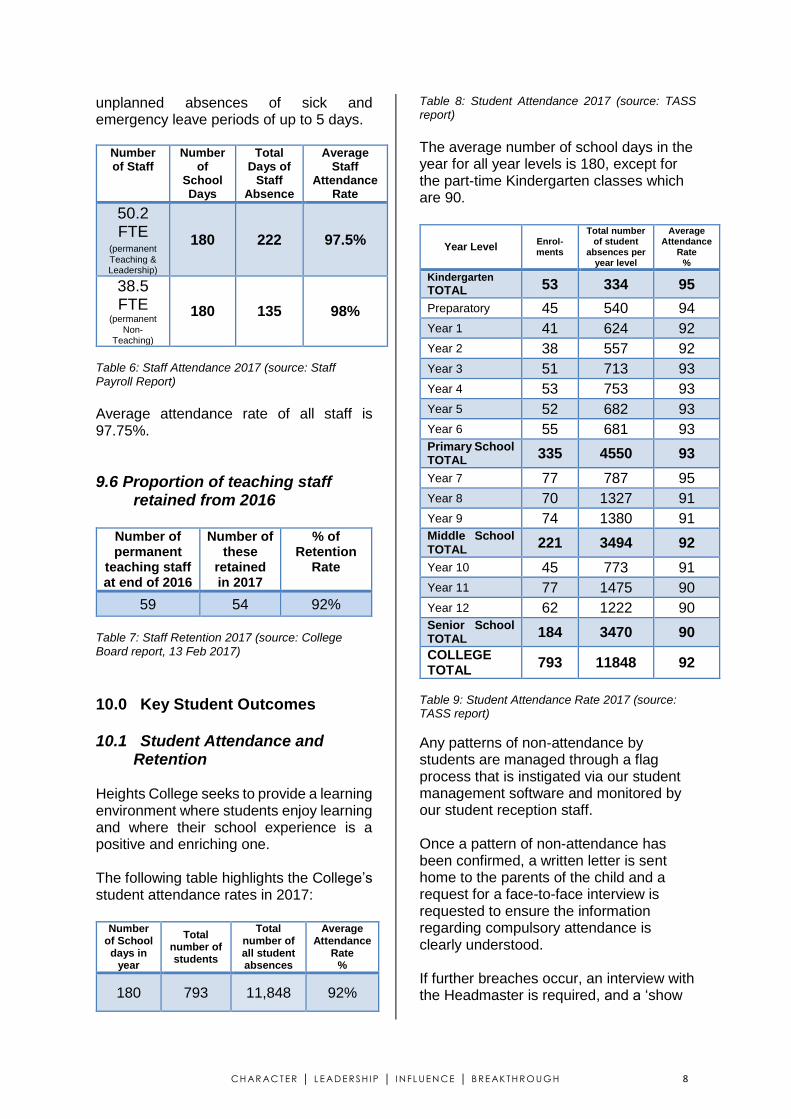
unplanned absences of sick and emergency leave periods of up to 5 days.
Number of Staff
Number of
School Days
Total Days of
Staff Absence
Average Staff
Attendance Rate
50.2 FTE
(permanent Teaching & Leadership)
180 222 97.5%
38.5 FTE
(permanent Non-
Teaching)
180 135 98%
Table 6: Staff Attendance 2017 (source: Staff Payroll Report)
Average attendance rate of all staff is 97.75%.
9.6 Proportion of teaching staff retained from 2016
Number of permanent
teaching staff at end of 2016
Number of these
retained in 2017
% of Retention
Rate
59 54 92%
Table 7: Staff Retention 2017 (source: College Board report, 13 Feb 2017)
10.0 Key Student Outcomes 10.1 Student Attendance and
Retention Heights College seeks to provide a learning environment where students enjoy learning and where their school experience is a positive and enriching one. The following table highlights the College’s student attendance rates in 2017:
Number
of School days in
year
Total number of students
Total number of all student absences
Average Attendance
Rate %
180 793 11,848 92%
Table 8: Student Attendance 2017 (source: TASS report)
The average number of school days in the year for all year levels is 180, except for the part-time Kindergarten classes which are 90.
Year Level Enrol-ments
Total number of student
absences per year level
Average Attendance
Rate %
Kindergarten TOTAL 53 334 95
Preparatory 45 540 94
Year 1 41 624 92
Year 2 38 557 92
Year 3 51 713 93
Year 4 53 753 93
Year 5 52 682 93
Year 6 55 681 93 Primary School TOTAL 335 4550 93
Year 7 77 787 95
Year 8 70 1327 91
Year 9 74 1380 91 Middle School TOTAL 221 3494 92
Year 10 45 773 91
Year 11 77 1475 90
Year 12 62 1222 90 Senior School TOTAL 184 3470 90
COLLEGE TOTAL 793 11848 92
Table 9: Student Attendance Rate 2017 (source: TASS report)
Any patterns of non-attendance by students are managed through a flag process that is instigated via our student management software and monitored by our student reception staff. Once a pattern of non-attendance has been confirmed, a written letter is sent home to the parents of the child and a request for a face-to-face interview is requested to ensure the information regarding compulsory attendance is clearly understood. If further breaches occur, an interview with the Headmaster is required, and a ‘show

CH AR AC T E R │ L E AD E R S H I P │ I NFL UE N CE │ B RE AK T H R O UG H 9
cause’ procedure is carefully followed regarding the student.
10.2 National Assessment Program – Literacy and Numeracy (NAPLAN) Results for 2017
For the past few years ACARA (Australian Curriculum, Assessment and Reporting Authority) has released information on schools demonstrating substantially above average gain in their NAPLAN results as students progress from Year 3 to Year 5 and from Year 7 to Year 9. These schools are in the top 4% in the country for these gains.
For 2017, Heights College was identified for the third year in a row by ACARA as a school that had demonstrated substantially above average gain in NAPLAN results. By measuring the gain from Years 3 to 5 and from Years 7 to 9, with at least 70% of the students having taken NAPLAN at the school two years earlier, ACARA measured how much difference the school has made to those students’ achievement levels.
We are very pleased to be named in the top 4% of schools for the third year in a row for achieving NAPLAN gains. We aim to continue to improve learning outcomes for all our students. We congratulate staff and students at Heights College for their achievements in this testing.
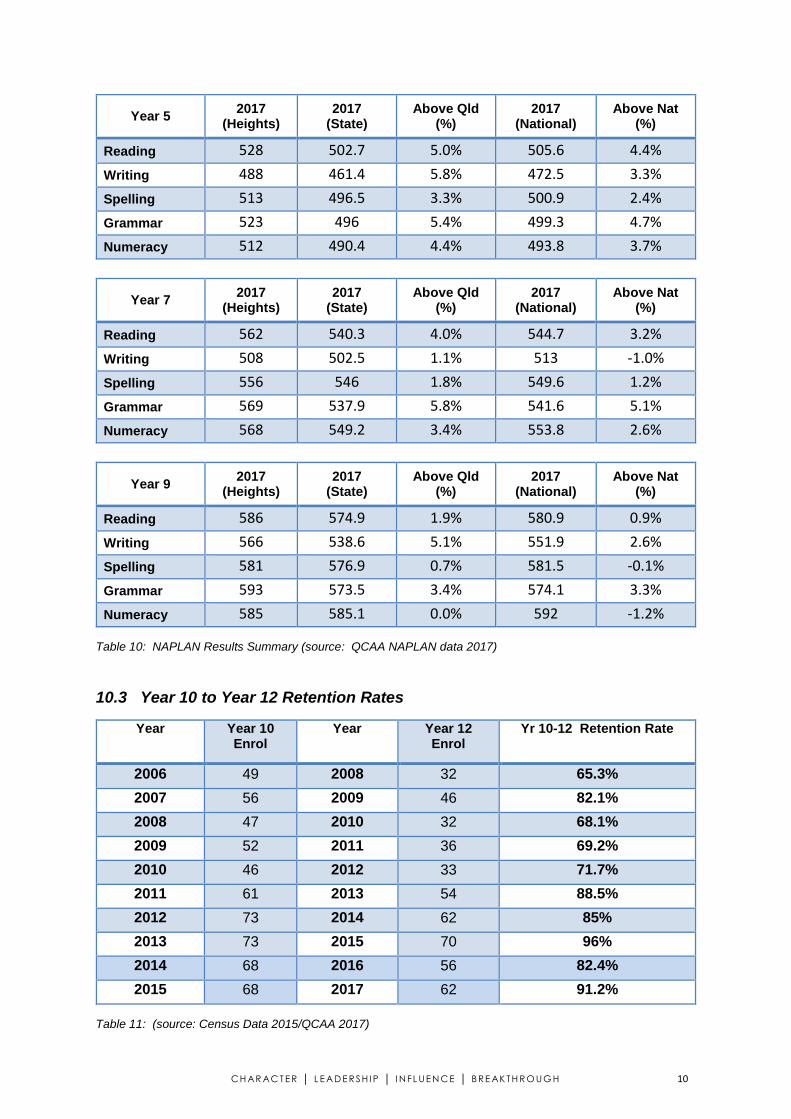
The results of the 2017 NAPLAN testing of the College’s Yr 3, 5, 7 and 9 cohorts are listed in the tables below. The tables display the raw score of each year level at Heights and the College’s performance against State and National benchmarks. Each year’s NAPLAN figures are part of a trend in time, whether rising, falling or holding relatively stable. We have been systematically reviewing teaching/learning processes and pedagogies across key learning areas over the whole school, in order to enhance student learning outcomes. In 2017 Heights College was above the Queensland average in 19 out of 20 NAPLAN categories and above the Australian average in 17 out of the 20 categories. The College Executive, senior leadership team and curriculum coordinators regularly review and analyse the learning outcomes and academic achievements of all students against State and National benchmarks, to ensure that our standards of learning increase in excellence. The College also provides annual analysis with summarised five year trend data on NAPLAN results, to assist in remediation and improved standards of achievement throughout the College.
Year 3 2017
(Heights) 2017
(State) Above Qld
(%) 2017
(National) Above Nat
(%)
Reading 444 425.2 4.4% 431.3 2.9%
Writing 437 402.3 8.6% 413.6 5.7%
Spelling 422 408.7 3.3% 416.2 1.4%
Grammar 460 437 5.3% 439.3 4.7%
Numeracy 422 402 5.0% 409.4 3.1%
CH AR AC T E R │ L E AD E R S H I P │ I NFL UE N CE │ B RE AK T H R O UG H 10
Year 5 2017
(Heights) 2017
(State) Above Qld
(%) 2017
(National) Above Nat
(%)
Reading 528 502.7 5.0% 505.6 4.4%
Writing 488 461.4 5.8% 472.5 3.3%
Spelling 513 496.5 3.3% 500.9 2.4%
Grammar 523 496 5.4% 499.3 4.7%
Numeracy 512 490.4 4.4% 493.8 3.7%
Year 7 2017
(Heights) 2017
(State) Above Qld
(%) 2017
(National) Above Nat
(%)
Reading 562 540.3 4.0% 544.7 3.2%
Writing 508 502.5 1.1% 513 -1.0%
Spelling 556 546 1.8% 549.6 1.2%
Grammar 569 537.9 5.8% 541.6 5.1%
Numeracy 568 549.2 3.4% 553.8 2.6%
Year 9 2017
(Heights) 2017
(State) Above Qld
(%) 2017
(National) Above Nat
(%)
Reading 586 574.9 1.9% 580.9 0.9%
Writing 566 538.6 5.1% 551.9 2.6%
Spelling 581 576.9 0.7% 581.5 -0.1%
Grammar 593 573.5 3.4% 574.1 3.3%
Numeracy 585 585.1 0.0% 592 -1.2%
Table 10: NAPLAN Results Summary (source: QCAA NAPLAN data 2017)
10.3 Year 10 to Year 12 Retention Rates
Year Year 10 Enrol
Year Year 12 Enrol
Yr 10-12 Retention Rate
2006 49 2008 32 65.3%
2007 56 2009 46 82.1%
2008 47 2010 32 68.1%
2009 52 2011 36 69.2%
2010 46 2012 33 71.7%
2011 61 2013 54 88.5%
2012 73 2014 62 85%
2013 73 2015 70 96%
2014 68 2016 56 82.4%
2015 68 2017 62 91.2%
Table 11: (source: Census Data 2015/QCAA 2017)

CH AR AC T E R │ L E AD E R S H I P │ I NFL UE N CE │ B RE AK T H R O UG H 11
10.4 Year 12 Outcomes (2017 Cohort)
Outcomes for our Year 12 cohort of 2017
Number of students awarded a Senior Education Profile 61
Number of students awarded a Queensland Certificate of Individual Achievement 0
Number of students who received an Overall Position (OP) 41
Number of students who are completing or completed a School-Based Apprenticeship or Traineeship (SAT)
4
Number of students awarded one or more Vocational Education and Training (VET) qualifications
24
Number of students awarded a Queensland Certificate of Education at the end of Year 12
49
Number of students awarded an International Baccalaureate Diploma (IBD) 0
Percentage of Year 12 students who received an OP1-15 or an IBD 66%
Percentage of Year 12 students who are completing or completed a SAT or were awarded one or more of the following: QCE, IBD, VET qualification
85%
Percentage of Queensland Tertiary Admissions Centre (QTAC) applicants receiving an offer
96%
Table 12: 2017 Learner Outcomes – (source: QCAA 2017 School Learner Report for Heights College)
10.5 Year 12 Performance for 2017 The Year 12 cohort of 2017 achieved possibly our best ever results at the top end of their Overall Position (OP) rankings with 20% receiving an OP 1-3. Three (3) students (over 7%) in the cohort received an OP 1. The Year 12 performance for 2017 resulted in 66% of eligible students gaining an OP score between 1 and 15 and 54% receiving an OP of 10 or better. 25% of the OP eligible senior class achieved between a 1 and 5.
Figure 2: OP Groupings 2017 (source: QCAA 2017 School Learner Report for Heights College)
Overall Position
1-5 6-10 11-15 16-20 21-25
Percentage of OP-eligible cohort
25% 29% 12% 29% 5%
10.6 Next Step Survey –
2016 Cohort of Senior Students This report is based on the findings of the Queensland Government Next Step survey, which targeted all students who completed Year 12 and gained a Senior Statement in 2016, whether they attended a Government, Catholic or independent school, or a TAFE secondary college. The Queensland Government Statistician’s Office conducted the survey between March and June 2017, approximately six months after the young people left school. Responses were predominantly collected via computer-assisted telephone interviewing and an online survey. The survey results were compiled and reported on by the Next Step team, Department of Education and Training.
25%
29%
12%
34%
OP Groupings
1 - 5
6 - 10
11 - 15
16 - 25

CH AR AC T E R │ L E AD E R S H I P │ I NFL UE N CE │ B RE AK T H R O UG H 12
Table 13 reports the response rate for Heights College. It expresses the number of respondents from Heights College senior class of 2016 who completed the Queensland Government Next Step Survey.
Number of
Respondents Number of students
who completed
Year 12
Response rate (%)
46 56 82.1%
Table 13: (source: NextStep 2017 for Heights College, DET)
10.6.1 Main Destination Figure 1 reports the main destinations of Year 12 graduates from Heights College in 2016. The pathways of Year 12 completers were categorised into 10 main destinations. Year 12 completers who were both studying and working were reported as studying for their main destination.
Figure 3 compares the main destinations of Year 12 completers from Heights College with those of Central Queensland and all schools Statewide. Differences may reflect diversity in the types of students attending different schools, regional variation in labour markets and access to university and VET providers. Regional areas are based on the Australian Statistical Geography Standard.

CH AR AC T E R │ L E AD E R S H I P │ I NFL UE N CE │ B RE AK T H R O UG H 13
10.6.2 Comparison over time of main destinations of Year 12 completers for Heights College
Figure 4 compares the main destinations of all Year 12 students for Heights College against previous years.

11.0 Technology and Innovation in Education
2017 has been a year of infrastructure upgrades laying foundations for future years technology deployments with:
The increase of internet data bandwidth by a factor of 10, from 20Mbps to 200/200Mbps (uncontested).
The College has installed a new College-wide print/photocopy system for students and staff to allow for flexibility, but controlling printing and reducing paper wastage.
Deployment of new fibre and networking hardware in a number of the secondary school buildings, including the newer Wi-Fi standard of 802.11AC to a wide area of the school.
Computer numbers remained at similar level to the previous year. A total of 650 computer units with 500 allocated to students use in dedicated computer laboratories, library and GLA’s across the school. 2017 saw a continuation of the college mandatory BYOD (Bring Your Own Device) program for secondary students from Year 7 through to Year 12. Heights College provided software licenses for Microsoft Office and Adobe Creative Cloud products for the student option of device/s (laptop, tablets). The Primary area current device inventory across five (5) shared IPAD trolleys. Each trolley has approximately 25-30 IPADs that were used for one or two Grade levels
(Prep, Years 1-2, Years 3-4, Year 5 and Year 6). Each Primary teacher also has access to their own IPAD to assist with the use of these devices. Technology for teachers has been maintained in 2017. All Teaching staff use laptops allowing them to be more mobile and continue to be effective, with Secondary teachers laptop device being refreshed. Students have continued to greatly benefit in 2017 from increased connection speeds for internet and network connectivity available in the classroom. There has been the supply of a diverse array of technology related learning experiences including content generation, word processing, information research, multimedia applications, internet access, Soundwaves and other educational software programs, financial planning strategies, graphic art design and multimedia presentations.
12.0 The Heights Way The Heights Way continued during 2017 as a thematic framework for each of the four terms of the year, to reinforce the distinctive culture of Heights College and to describe the way we do things at Heights. Each term of the academic year has a central focus: Character, Leadership, Influence and Breakthrough, and these themes are the integrating context in which to achieve the College purpose of providing education that inspires character and leadership.

Character is moral excellence, it is made in the
small moments of our lives and it is often
described as who we are when no one is looking.
“Someone with good character is like an
immovable rock. You will always be able to go
back to them, no matter how many storms and
trials come their way, you will still know where
they are and where they stand in any given
situation. They don’t change according to the
situation; they always remain faithful to those
around them.” Year 12 Heights Student – 2005
“Leadership is influence.” “Leaders must be close
enough to relate to others, but far enough ahead
to motivate them.” John Maxwell Students at
Heights College are encouraged to develop their
leadership skills through their relationships with
others and ability to use the giftings they have to
their full potential in the situation they may be
placed in.
Influence – Connect with people, be an
influencer. “The only inheritance that a person
will leave that has eternal value is their
influence.” Every student is encouraged to be
aware of the influence they have on their peers,
other students, community members, staff and
family through their words, actions and
thoughts.
Breakthrough – Reach for the sky – fly high.
“Develop success from failures. Discouragement
and failure are two of the surest stepping stones
to success.” Dale Carnegie. Students are
encouraged to achieve breakthrough in an area
of their lives, whether it be physical, academic,
spiritual, emotional etc., through persistence,
prayer and practise.

13.0 Capital Works In 2017, we had two major projects underway, with our new Kindergarten being completed in July and our Hospitality Centre almost finished by the end of December. We acknowledge and thank the Australian Commonwealth and Queensland State Governments for providing funding towards our Hospitality Centre. We have also set things in motion for a third oval to be constructed on our campus in 2018. The College continues to invest heavily in IT infrastructure as part of our continued support of our BYOD program.