CHARACTER ASSOCIATION AND GENETIC DIVERSITY ANALYSIS … · CHARACTER ASSOCIATION AND GENETIC...
116
CHARACTER ASSOCIATION AND GENETIC DIVERSITY ANALYSIS OF SPONGE GOURD (Luffa cylindrica L.) JASMIN AKTER DEPARTMENT OF GENETICS AND PLANT BREEDING SHER-E-BANGLA AGRICULTURAL UNIVERSITY DHAKA-1207, BANGLADESH JUNE 2015
Transcript of CHARACTER ASSOCIATION AND GENETIC DIVERSITY ANALYSIS … · CHARACTER ASSOCIATION AND GENETIC...

CHARACTER ASSOCIATION AND GENETIC DIVERSITY ANALYSIS
OF SPONGE GOURD (Luffa cylindrica L.)
JASMIN AKTER
DEPARTMENT OF GENETICS AND PLANT BREEDING
SHER-E-BANGLA AGRICULTURAL UNIVERSITY
DHAKA-1207, BANGLADESH
JUNE 2015

CHARACTER ASSOCIATION AND GENETIC DIVERSITY ANALYSIS
OF SPONGE GOURD (Luffa cylindrica L.)
BY
JASMIN AKTER
REGISTRATION NO: 09-03663
A Thesis
submitted to the Faculty of Agriculture,
Sher-e-Bangla Agricultural University, Dhaka
MASTER OF SCIENCE
IN
GENETICS AND PLANT BREEDING
SEMESTER: January-June, 2015
Approved by:
(Professor Dr. Md. Sarowar Hossain) (Professor Dr. Md. Shahidur Rashid Bhuiyan)
Supervisor Co-supervisor
(Professor Dr. Md. Sarowar Hossain)
Chairman
Examination Committee

Professor Dr. Md. Sarowar Hossain
Department Genetics and Plant Breeding Sher-e Bangla Agricultural University
Dhaka-1207, Bangladesh
Mob: +8801552499169
E-mail:[email protected]
CERTIFICATE
This is to certify that thesis entitled, “CHARACTER ASSOCIATION AND
GENETIC DIVERSITY ANALYSIS OF SPONGE GOURD (Luffa cylindrica L.)” submitted to the Faculty of Agriculture, Sher-e-Bangla Agricultural University, Dhaka,
in partial fulfillment of the requirements for the degree of MASTER OF SCIENCE in
GENETICS AND PLANT BREEDING, embodies the result of a piece of bona fide
research work carried out by JASMIN AKTER, Registration No. 09-03663 under my
supervision and guidance. No part of the thesis has been submitted for any other degree
or diploma.
I further certify that such help or source of information, as has been availed of
during the course of this investigation has duly been acknowledged.
Dated: June, 2015 (Prof. Dr. Md. Sarowar Hossain)
Place: Dhaka, Bangladesh Supervisor

DEDICATED
TO
MY PARENTS

i
LIST OF ABBREVIATED TERMS
FULL WORD ABBREVIATION
Agriculture Agric.
Agricultural Agril.
Agronomy Agron
Agro-Ecological Zone AEZ
Analysis of variance ANOVA
And others et al.
Bangladesh BD
Bangladesh Agricultural Research Institute BARI
Bangladesh Bureau of Statistics BBS
By the way Via
Centimeter cm
Degree Celsius ⁰C
Degrees of Freedom df
Environmental variance e
Etcetera etc.
Food and Agricultural Organization FAO
Genetic Advance GA
Genotypic coefficient of variation GCV
Genotypic variance g
Gram g
Heritability in broad sense hb

ii
LIST OF ABBREVIATED TERMS (Contd.)
FULL WORD ABBREVIATION
Indian Agricultural Research Institute IARI
International Center for Agricultural
Research in Dry Areas ICARDA
Journal J.
Kilogram Kg
Mean sum of square MS
Meter m
Murate of Potash MP
Namely Viz
Number No.
Phenotypic variance p
Percentage of Coefficient of Variation CV%
Percentage %
Phenotypic coefficient of variation PCV
Randomized Complete Block Design RCBD
Sher-e-Bangla Agricultural University SAU
Square meter m2
Triple Super Phosphate TSP

iii
ACKNOWLEDGEMENTS
All the praises are due to the almighty Allah, who blessed me to complete this work
successfully. My sincere gratitude and appreciation to my reverend supervisor and
chairman of examination committee Professor Dr. Md. Sarowar Hossain, Department of
Genetics and Plant Breeding, Sher-e-Bangla Agricultural University, for his scholastic
supervision, helpful commentary and unvarying inspiration throughout the field research
and preparation of this thesis.
My earnest indebtedness to my Co-supervisor Professor Dr. Md. Shahidur Rashid
Bhuiyan, Department of Genetics and Plant Breeding, SAU for his continuous support,
constructive criticism, and valuable suggestions.
I am highly grateful to Professor Dr. Firoz Mahmud, Professor Dr. Naheed Zeba and all
other teachers of my department for their excellent guidance and encouragement during
the whole period of study.
I would like to thank all the staffs of the Department of Genetics and Plant Breeding and
the staffs of the library of Sher-e-Bangla Agricultural University for their nice
cooperation. I am also thankful to the farm workers for their excellent services in my field.
I should acknowledge the encouragement I have received from my beloved father
throughout my life. I am also thankful to my younger sister Popy and brother Tanim, my
aunts, uncles and cousins, and my friend Nitol, Keya, Onom, Tanvi, Shaon, for their
support.
Naim has sustained me through some very difficult times and shared my work to finish this
in timely fashion. I am, indeed, proud and delighted for my father and mother for their
unparallel affections and for numerous sacrifices they have made for my study. This work
is dedicated to him along with my beloved parents.
June, 2015
SAU, Dhaka The Author

i
LIST OF ABBREVIATED TERMS
ABBREVIATION FULL WORD
% Percentage
⁰C Degree Celsius
p Phenotypic variance
g Genotypic variance
e Environmental variance
h b Heritability in broad sense
AEZ Agro-Ecological Zone
Agric. Agriculture
Agril. Agricultural
Agron. Agronomy
ANOVA Analysis of variance
BARI Bangladesh Agricultural Research Institute
BBS Bangladesh Bureau of Statistics
BD Bangladesh
cm Centimeter
CV% Percentage of Coefficient of Variation
Df Degrees of Freedom
et al. And others
etc. Etcetera
FAO Food and Agricultural Organization
gm Gram
GA Genetic Advance
GCV Genotypic coefficient of variation
IARI Indian Agricultural Research Institute
ICARDA International Center for Agricultural
Research in Dry Areas
J. Journal
Kg Kilogram
m Meter
MS Mean sum of square
m2 Square meter

ii
LIST OF ABBREVIATED TERMS (Contd.)
ABBREVIATION FULL WORD .
MP Murate of Potash
No. Number
PCV Phenotypic coefficient of variation
RCBD Randomized Complete Block Design
SAU Sher-e-Bangla Agricultural University
TSP Triple Super Phosphate
Via By the way
Viz Namely

iii
ACKNOWLEDGEMENTS
All the praises are due to the almighty Allah, who blessed me to complete this work
successfully. My sincere gratitude and appreciation to my reverend supervisor
Professor Dr. Md. Sarowar Hossain, Department of Genetics and Plant Breeding,
Sher-e-Bangla Agricultural University, for his scholastic supervision, helpful
commentary and unvarying inspiration throughout the field research and preparation
of this thesis.
My earnest indebtedness to my Co-supervisor Professor Dr. Md. Shahidur Rashid
Bhuiyan, Department of Genetics and Plant Breeding, SAU for his continuous
support, constructive criticism, and valuable suggestions.
I am highly grateful to Professor Dr. Firoz Mahmud, Professor Dr. Naheed Zeba and
all other teachers of my department for their excellent guidance and encouragement
during the whole period of study.
I would like to thank all the staffs of the Department of Genetics and Plant Breeding
and the staffs of the library of Sher-e-Bangla Agricultural University for their nice
cooperation. I am also thankful to the farm workers for their excellent services in my
field.
I should acknowledge the encouragement I have received from my beloved father
throughout my life. I am also thankful to my younger sister Popy and brother Tanim,
my aunts, uncles and cousins, and my friend Nitol, Keya, Onom, Tanvi, Shaon, for
their support.
Naim has sustained me through some very difficult times and shared my work to finish
this in timely fashion. I am, indeed, proud and delighted for my father and mother for
their unparallel affections and for numerous sacrifices they have made for my study.
This work is dedicated to him along with my beloved parents.
November 2014, SAU, Dhaka The Author

iv
CONTENTS
CHAPTER TITLE PAGE NO.
LIST OF ABBREVIATED TERMS i-ii
ACKNOWLEDGEMENT iii
LIST OF CONTENTS iv-ix
LIST OF TABLES x
LIST OF FIGURES xi
LIST OF PLATES xii
LIST OF APPENDICES xiii
ABSTRACT xiv
I INTRODUCTION 1-3
II REVIEW OF LITERATURE 4-16
2.1 Morphological characterization 4-7
2.2 Genetic diversity 8-16
III MATERIALS AND METHODS 17-34
3.1 Experimental site 17
3.2 Climate 17
3.3 Characteristics of soil 17
3.4 Genotype 17
3.5 Design and layout 17
3.6 Raising of seedling 18
3.7 Land preparation 19
3.8 Pit preparation 19
3.9 Application of manures and fertilizers 19
3.10 Transplanting of seedling 19
3.11 Intercultural operations 19-22
3.11.1 Thinning out and Gap filling 19
3.11.2 Weeding and Mulching 22
3.11.3 Irrigation 22

v
CONTENTS (Contd.)
CHAPTER TITLE PAGE NO.
3.12 Penndel preparation 22
3.13 Plant protection measures 22
3.14 Harvesting 22
3.15 Data collection 22-28
3.15.1 Seed germination 22
3.15.2 Leaf length 22
3.15.3 Internodes length 24
3.15.4 Leaf blade lobbing 24
3.15.5 Leaf Shape 24
3.15.6 Days to first male flowering 24
3.15.7 Days to first female flowering 25
3.15.8 Node number of first male flower 25
3.15.9 Node number of first female flower 25
3.15.10 Sex ratio 25
3.15.11 Length of fruit 25
3.15.12 Perimeter of fruit 25
3.15.13 Average fruit weight 25
3.15.14 Petiole length 25
3.15.15 Shape of fruit 25
3.15.16 Stem-end fruit Shape 26
3.15.17 Blossom-end fruit shape 26
3.15.18 Peduncle length 26
3.15.19 Number of fruit per plant 26
3.15.20 Number of seed per fruit 27
3.15.21 Seed cot color 27
3.15.22 Seed length 27
3.15.23 Seed breadth 27
3.15.24 Seed thickness 28
3.15.25 Hundred-seed weight 28
3.15.26 Yield per plant 28

vi
CONTENTS (Contd.)
CHAPTER TITLE PAGE NO.
3.16 Statistical analysis 28-31
3.16.1 Variability of Sponge Gourd genotypes 29
3.16.1.1 Estimation of Phenotypic and Genotypic Variance 29
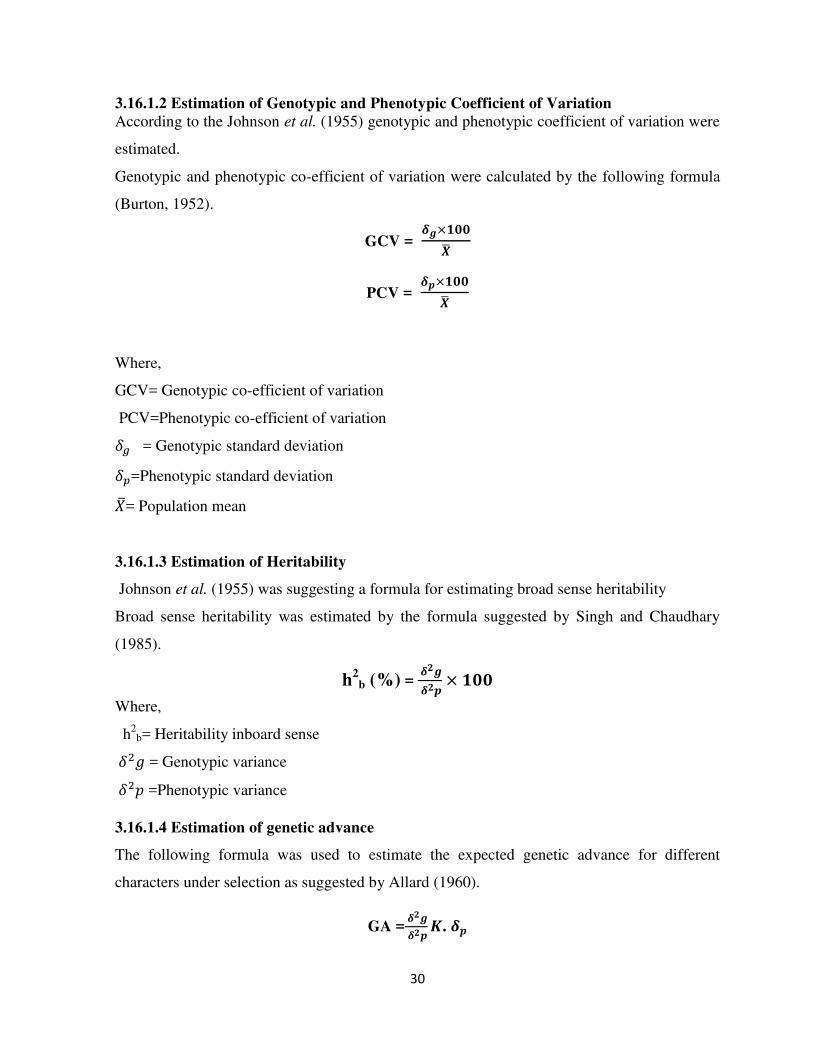
3.16.1.2 Estimation of Genotypic and Phenotypic Coefficient
of Variation
30
3.16.1.3 Estimation of heritability 30
3.16.1.4 Estimation of genetic advance 30
3.16.1.5 Estimation of genetic percent of mean 31
3.16.1.6 Estimation of simple correlation co-efficient 31
3.16.1.7 Path co-efficient analysis 31
3.16.2 Genetic diversity analysis 32-34
3.16.2.1 Principal Component Analysis (PCA) 32
3.16.2.2 Principal Coordinate Analysis (PCO) 32
3.16.2.3 Clustering 33
3.16.2.4 Canonical Variate Analysis (CVA) 33
3.16.2.5 Cluster diagram 34
3.16.2.6 Selection of genotypes for future hybridization
programme
34
IV RESULT ND DISCUSSION 35-77
4.1 Characterization of sponge gourd 35-47
4.1.1 Morphological characterization 35-40
4.1.1.1 Leaf blade lobbing 35
4.1.1.2 Leaf shape 35
4.1.1.3 Fruit color 35
4.1.1.4 Blossom-end fruit shape 39
4.1.1.5 Stem-end fruit Shape 39
4.1.1.6 Fruit shape 39
4.1.1.7 Seed color 39
4.1.2 Characterization of sponge gourd on basis of yield
and yield contributing traits
41-47
4.1.2.1 Days to seed germination 41
4.1.2.2 Internodes length (cm) 41

vii
CONTENTS (Contd.)
CHAPTER TITLE PAGE NO.
4.1.2.3 Leaf length (cm) 41
4.1.2.4 Leaf breadth (cm) 41
4.1.2.5 Petiole length (cm) 41
4.1.2.6 Days to first male flowering 44
4.1.2.7 Days to first Days to first female flowering 44
4.1.2.8 Node number for first male flower 44
4.1.2.9 Node number for first female flower 44
4.1.2.10 Sex ratio (male: female) 44
4.1.2.11 Length of fruit (cm) 44
4.1.2.12 Fruit perimeter (cm) 45
4.1.2.13 Peduncle length (cm) 45
4.1.2.14 Number of fruit per plant 45
4.1.2.15 Fruit weight 45
4.1.2.16 Yield per plant (kg) 46
4.1.2.17 Number of seeds per fruit 46
4.1.2.18 Seed length (cm) 46
4.1.2.19 Seed breadth (cm) 46
4.1.2.20 Seed thickness (cm) 46
4.1.2.21 Hundred seed weight (gm) 47
4.2 Variability of sponge gourd on the basis of yield and
yield contributing characters
47-53
4.2.1 Days to seed germination 47
4.2.2 Internodes length (cm) 47
4.2.3 Leaf length 47
4.2.4 Leaf breadth (cm) 49
4. 2.5 Petiole length (cm) 49
4.2.6 Days to first male flowering 49
4.2.7 Days to first female flowering 50
4.2.8 Node number for first male flower 50
4.2.9 Node number for first female flower 50
4.2.10 Sex ratio (male: female) 51

viii
CONTENTS (Contd.)
CHAPTER TITLE PAGE NO.
4.2.11 Length of fruit (cm) 51
4.2.12 Fruit perimeter (cm) 51
4.2.13 Peduncle length (cm) 51
4.2.14 Number of fruit per plant 52
4.2.15 Fruit weight 52
4.2.16 Yield per plant (kg) 52
4.2.17 Number of seeds per fruit 52
4.2.18 Seed length (cm) 53
4.2.19 Seed breadth (cm) 53
4.2.20 Seed thickness (cm) 53
4.2.21 Hundred seed weight (gm) 53
4.3 Correlation Co-efficient 54-59
4.3.1 Days to first male flowering 54
4.3.2 Days to first female flowering 54
4.3.3 Node number of 1st male flower 56
4.3.4 Node number of 1st female flower 56
4.3.5 Number of fruit per plant 56
4.3.6 Fruit length (cm) 57
4.3.7 Fruit weight (kg) 57
4.3.8 100 seed weight 57
4.3.9 Perimeter of the fruit (cm) 58
4.3.10 Sex ratio 58
4.3.11 Days to seed germination 59
4.3.12 No. of seed per fruit 58
4.3.13 Seed length (cm) 59
4.3.14 Seed breadth (cm) 59
4.4 Path Analysis 59-65
4.4.1 Days to first male flowering 59
4.4.2 Days to first female flowering 62
4.4.3 Node number of 1st male flower 62
4.4.4 Node number of 1st female flower 62

ix
CONTENTS (Contd.)
CHAPTER TITLE PAGE NO.
4.4.5 Number of fruit per plant 63
4.4.6 Fruit length (cm) 63
4.4.7 Fruit weight (kg) 63
4.4.8 Hundred seed weight 63
4.4.9 Perimeter of fruit 64
4.4.10 Sex ratio 64
4.4.11 Days to seed germination 64
4.4.12 No. of seed per fruit 65
4.4.13 Seed length (cm) 65
4.4.14 Seed breadth (cm) 65
4.5 Diversity of the sponge gourd genotypes 66-72
4.5.1 Construction of scatter diagram 66
4.5.2 Principal component analysis 66
4.5.3 Principal coordinate analysis 72
4.5.4 Canonical variate analysis 72
4.5.5 Non-hierarchical clustering 75-76
4.5.5.1 Cluster I 76
4.5.5.2 Cluster II 76
4.5.5.3 Cluster III 76
4.5.5.4 Cluster IV 76
4.5.5.5 Cluster V 76
4.6 Comparison of different multivariate techniques 77
4.7 Selection of parents for future hybridization 77
V SUMMARY AND CONCLUSION 78-80
REFERENCES 81-90
APPENDICES 91-95

x
LIST OF TABLES
TABLE TITLE PAGE NO.
1 Sources of 16 sponge gourd genotypes 18
2 Doses of manure and fertilizers used in the present study 20
3 Characterization of 16 sponge gourd genotype 36
4 Mean performance of 16 sponge gourd varieties based on
different morphological traits related to yield
42-43
5 Estimation of genetic parameters for morphological
characters related to yield 48
6 Coefficients of phenotypic and genotypic correlation
among different yield components 55
7 Partitioning of genotypic into direct and indirect effects
of morphological characters of 16 sponge gourd
genotypes by path coefficient analysis
60
8 Partitioning of phenotypic into direct and indirect effects
of morphological characters of 16 sponge gourd
genotypes by path coefficient analysis
61
9 Eigen value, % variance and cumulative (%) total
variance of the principal components
67
10 Number, percent and name of genotypes in different
cluster 70
11 Number, percent and name of genotypes in different
cluster 71
12 Number, percent and name of genotypes in different
cluster 73

xi
LIST OF FIGURES
TABLE TITLE PAGE NO.
1 Different types of leaf shape 24
2 Stem-end fruit shape 26
3 Blossom-end fruit shape 27
4 Scatter diagram of 16 sponge gourd genotypes of based
on their principal component scores
68
5 Cluster diagram showing the average intra and inter
cluster distances (D = 2D Values ) of 16 sponge gourd
genotypes
74

xii
LIST OF PLATES
TABLE TITLE PAGE NO.
1 Showing raising seedling in poly bag 21
2 Seedling after transplanting in field 21
3 Field view of experimental site 23
4 Different leaf morphology (showing different type of leaf
lobbing and shape ) of 16 sponge gourd 37
5 Different fruit morphology (showing fruit shape) of 16
sponge gourd 38
6 Seed of 16 sponge gourd genotype 40
xiii
LIST OF APPENDICES
APPENDIX TITLE PAGE NO.
I Map showing the experimental site under study 91
II Monthly average Temperature, Relative Humidity and
Total Rainfall of the experimental site during the period
from April 2014 to September 2014
92
III Morphological, physical and chemical characteristics of
initial soil (0-15cm depth) of the experimental site
A. Physical composition of the soil
B. Chemical composition of the soil
93-94
IV Analysis of variance for different morphological plant
characters of 16 sponge gourd varieties 95

xiv
CHARACTER ASSOCIATION, GENETIC DIVERSITY, CORRELATION
AND PATH ANALYSIS OF SPONGE GOURD (Luffa cylindrica L.)
BY
JASMIN AKTER
ABSTRACT
An experiment was carried out at the Sher-e-Bangla Agricultural University farm,
Bangladesh during April 2014 to September 2014 to study on character association,
genetic diversity, genotypic coefficient of variance, phenotypic coefficient of
variance, heritability, genetic advance, genetic advance percent of mean, path and
cluster analysis and inter genotype distance study of 16 sponge gourd genotype.
Significant genotypic differences were observed for all the yield and yield
contributing characters studied. The phenotypic coefficient of variation was higher
than genotypic coefficient of variation in most of the characters. Heritability estimates
higher in internodes length, days of 1st male flowering, days of 1st female flowering,
node no. of 1st male flower, node no. of 1st female flower, number of fruit per plant,
fruit length, petiole length, peduncle length, number of seed per fruit. The expected
genetic advance as percentage of mean ranged from 6.24 to 76.60. Multivariate
analysis was performed through principal component analysis (PCA); Principal
Coordinate Analysis, Cluster analysis and Canonical Variate Analysis were used to
classify 16 sponge gourd genotypes. From PCA, D2 and cluster analysis, the
genotypes were grouped into five different clusters. Genotype G5 showed minimum
days to first female flowering from cluster IV, G10 produces maximum number of
fruit in a plant, maximum fruit weight and yield per plant from cluster V, G12 highest
fruit perimeter from cluster III. Therefore considering these group distance and other
agronomic performances for inter genotypic crosses between G10 and G5 and G12
and G10 are suggested for future breeding programme.
1
CHAPTER I
INTRODUCTION
Vegetable crop sponge gourd is from the Cucurbitaceae family which comprising of about 130
genera and more than 900 species of which only a few are cultivated (Jeffrey C., 1962). There
is a tremendous genetic diversity within the family, and the extent of adaptation for cucurbit
species ranges from arid deserts to the tropical and subtropical regions and finally spreading
out to the temperate zone (Whitaker and Davis, 1962). In India, cucurbits are cultivated in
several commercial cropping systems and also as popular kitchen garden crops. 5.6% of the
total vegetable production of Bangladesh comes from cucurbitaceae family and these
vegetables are highly utilized for culinary purposes.
A very important vegetable of the Cucurbitaceae family is Sponge gourd (Luffa cylindrica L.)
which have 26 chromosome (2n = 26) under the order cucurbitales, subclass polypatae and
class Dicotyledon (Hooker, 1979). It is an annually cultivated herbaceous climbing type
monoecious vegetable crop. It is probably originated in the tropical Asia and Africa. Now it is
extended to the Indian subcontinent, China, America and other countries of the world.
In Bangladesh sponge gourd is named as ‘Dhundal’ which is smooth, loofash vegetable and
spongy in nature. It is mainly used in Bangladesh as vegetable. It is also used for different
purposes in many countries. The tender fruit is easily digestible and increase appetite and
used as vegetable when consumed (Okusanya et al., 1981). Besides being a vegetable, the
mature, dry fruit consists of a hard shell surrounding a dense network of cellulose, stiff fibers
(sponge) which is a good source of fiber used in industries for cleaning and filter the glass
wares, motor car, bath and body bathing accessories and, kitchen utensils (Shah et al., 1980;
Oboh and Aluyor, 2009). Matured fibers are generally used in manufacturing slippers or
baskets, washing ships and decks and used as inner cloth of bonnet, shoe mats (Lee and Yoo,
2006). The fibrous vascular system inside the fruit after been separated from the skin, flesh
and seeds, can be used as a component of shock absorbers, as a bathroom sponge, as a utensils
cleaning sponge, as a sound proof linings, for making crafts, as packing materials, as filters in
factories and as a part of soles of shoes (Bal et al., 2004). They can also be used for cleaning
floors or cars without scratching. The small ones are softer and good for washing the face and

2
larger ones for the body. They can also be recycled into pillows or mats when they finally
wear down (Newton, 2006). It is also used as absorbent (Altinisik et al., 2010). The cellulose
content of sponge gourd varies from 55 to 90%, hemicelluloses content is around 8 and 22%
and the lignin content is within the range of 10 and 23%. It is also containing ash 2.4%
(Satyanarayana et al., 2007; Tanobe et al., 2005). Sponge gourd consider as a highly nutritive
vegetable because it contains carbohydrate 2.9 g, protein 1.2 g, moisture of 93.2 g, fat 0.20 g,
minerals (calcium 36 mg, phosphorus 19 mg and ferrous 1.1 mg) vitamins (thiamin 0.02 mg,
riboflavin 0.06 mg, niacin 0.4 mg and carotene 120 mg), and fibers 0.20 g per 100 g of edible
portion (Gopalan et al., 1999).
In our country vegetable production is not uniform round the year due to climatic and edaphic
factors. During the winter season vegetables are produced on large scale. There is a scarcity of
vegetables during summer or rainy season and only few types of vegetables are produced
during the period from April to October. Among these vegetables, sponge gourd contributes a
significant portion of vegetable production during lean period of vegetable supply in summer
and rainy season of Bangladesh.
Morphological characterization is important to identify a species, to classify the species into
different group and to give an idea about the crop canopy. Variability is a desirable goal in
germplasm collection since the material conserved in such collection represents the stock
material for breeding programme. Knowledge of the interrelationship between yield and yield
contributing characters is necessary. Thus, determination of correlation among the characters
is a matter of considerable importance in selection of correlated response.
In crop improvement programme, genetic diversity has been considered as an important factor
and an essential pre-requisite for hybridization programme. If the genotypes are identified on
the basis of diverse analysis, the resulting recombinants through hybridization would be more
promising. Several methods of multivariate analysis such as D2 cluster and factor analysis
have been proved to be useful in selecting germplasm for hybridization. Mahalanobis (1936)
D2 analysis has been successfully used in measuring the diversity in several cucurbitaceous
crops (Masud et al., 2001; Badade et al., 2001; Rasheed et al., 2002).
A good number of local races of sponge gourd are present in Bangladesh. But till now there is
no recommended or released varieties are available to the farmer. Effective research was not

3
made in the past to evaluate the potentialities of the available genotype. Sponge gourd is a
monoecious vegetable, but different sex form like staminate, pistillate, hermaphrodite etc. is
commonly found in nature (Takahashi, 1980). There is wide variability in fruit shape and
color and size of fruit, ranging from a few centimeters to one meter, as traits are complex and
controlled by several genes (Beyer et al., 2002; Zalapa et al. 2006). It is a cross pollinated
vegetable, thus, its natural population has tremendous variability for fruit color, shape, taste
etc. in any crop improvement programme evaluation of genotypes to assess the existing
variability is considered as preliminary step. In order to pursue an effective breeding
programme, the present investigation was carried out to gather information on the following
sectors:
1. To characterize the genotypes on the basis of different morphological and yield contributing
characters,
2. To know the genetic variability for different quantative traits involved among sponge gourd
genotypes,
3. To assess the genetic diversity among the materials,
4. To select the highly potential genetically diverged parents for using it in the future
hybridization programme.

4
CHAPTER II
REVIEW OF LITERATURE
Though sponge gourd is an important vegetable cultivated in Bangladesh, there are few
reports related to the present study in this country as well as other countries of the world.
Therefore, the literature relevant to the present study on sponge gourd and some other related
vegetables under the family Cucurbitaceae are reviewed in this chapter under the following
headings.
2.1 Morphological Characterization
Emina et al. (2014); found that, qualitative traits of fruit such as color, shape and texture,
much variation. Coefficient of variation were highest for fruit length, fruit weight and number
of fruits per plant (CV=56.69- 161.32%), while they were the lowest for leaf length
(CV=20.65%). Morphological characterization is needed to facilitate the use of cucurbit
varieties in breeding work.
Kumar et al. (2013); stated in their experimental work that, highest phenotypic and genotypic
variations were observed for total yield per vine followed by average weight of fruit, seed
number in per fruit and total soluble solids. They said, average weight of fruit number of seeds
per fruit and specific gravity showed high heritability with high genetic advance. Total yield
per vine was found positively and significantly correlated with number of fruits per vine,
average fruit weight and number of seeds per fruit. Path coefficient analysis revealed that,
number of primary branches, average fruit diameter, and fruits per vine, average fruit weight
and total soluble solids showed positive direct effects on total yield per vine. Thus they
suggested selecting these traits for improving yield per vine in sponge gourd.
Gaffar (2008), conducted an experiment in Sher-e-Bangla Agricultural University with fifteen
genotypes of sponge gourd. He found that, the genotypic and phenotypic variances of leaf
length were 24.13 and 25.55, respectively. The GCV (20%) was slightly lower than PCV
(20.58%). Heritability for this trait was 97% with moderate genetic advance (9.83) and genetic
advance in percent of mean (40.03) was considerable for this trait indicating apparent
variation was due to genotypes.

5
Gaffar (2008), reported almost similar estimates of GCV and PCV (10.45% and 11.16%) and
heritability in broad sense was high (94%) with moderate genetic advance (3.19) for
internodes length in sponge gourd. Similar result was found by Singh el al. (2002).
Gaffar (2008), reported the PCV (36.68%) was very high to GCV (17.12%). The heritability
for petiole length was high (47%) with low genetic advance (1.77) in sponge gourd.
Kumar et al. (2007); conducted an experiment to study the path coefficient of 20 bottle gourd
(Lagenaria vulgaris) genotypes. From Path analysis they found that, number of branches per
vine, vine length, nodes number of first female flower and number of fruit per vine had
positive direct effect on fruit yield per vine.
Grubben (2004), concluded his experiment as that, male flower open earlier and close later
than female flowers, the ratio being approximately 9:1 in bottle gourd, although it is lower at
low temperature. Rashid (1993) said that, the male female flower ratio in cucurbits varied
from 4:1 to 60:1 according to the variety and environment. Bose and Som (1986) stated that,
the sex ratio in cucurbits varied from 5:1 to 25-30:1, the ratio of male: female flower was
changed by the climate and environmental factors.
Shah and Kale (2002), conducted an experiment on correlation co-efficient analysis of yield
components of 55 genotypes of ridge gourd. They found that, fruit weight per vine was
positively and significantly correlated with number of fruits per vine, average fruit weight,
number of female flower per vine and vine length which indicates the close association and
dependency of yield on these characters. The fruit weight is positively correlated with fruit
diameter and fruit number per vine, while it was negatively correlated with fruit length.
Singh et al. (2002); work with Ninety eight hybrids of cucumber derived from crosses
involving 14 male and 7 female parents and found that, fruit length, width and weight were
highly correlated with fruit yield. Genotypic correlation co-efficient were higher than the
phenotypic co-efficient which indicated strong association among these traits. Path coefficient
analysis also indicated that fruit weight had the highest direct effect on fruit yield.
Badade et al. (2001); carried out an experiment to study the correlation of 20 bottle gourd
(Lagenaria vulgaris) genotypes. Yield was found significantly negatively correlated with days
to first male and female flower appearance and weight of deformed fruits per vine and

6
positively correlated with number of branch per vine, number of fruits per vine at both
phenotypic and genotypic levels. Fruit length showed non-significant but positive correlation
with fruit yield.
Miah et al. (2000); described that, fruit yield showed positive and significant association with
average fruit weight, fruit breadth and number of nodes per vine in genotypic and phenotypic
correlation with days to male flowering. Path analysis revealed that, number of fruits per
plant, average fruit weight, days to male flowering and fruit length and showed positive and
direct effect on fruit yield.
Kumar et al. (1998); carried out an experiment on correlation and path analysis studies in
sweet gourd. They found positive and significant correlation of mean fruit weight, vine length,
total fruit in a plant and number of seeds in a fruit with yield per plant. They also found that
number of fruit per plant exhibited the highest direct effect on yield. High positive indirect
effects were exerted by mean fruit weight and number of fruits per plant.
Li et al. (1997); got days to flowering and vine length was negatively correlated to yield.
Average fruit weight, number of fruits per plant, leaf area and fruiting rate of cucumber
genotypes were positively correlated to yield. From path analysis, they also concluded that,
fruits per plant and average fruit weight affected the yield directly.
Paranjape and Rajpute (1995) stated that, the genotypic correlation of 21 bitter gourd
genotypes revealed yield was mainly contributed by average fruit weight and fruit length and
number of fruits per vine. The physiological attributes like vine length, primary branches and
average leaf area were mutually associated with yield.
Akand (1993), in ridge gourd observed that, in five parental lines first male flower opened
within 42 to 46 days, and the first female flower opened within 48 to 52 days, while for
hybrids it ranged from 40 to 45 days and 43 to 51 days for male and female flower anthesis,
respectively.
Latif (1993), noted in ridge gourd that the number of days to male flower opening of five
parental lines and for their hybrids ranged from 46 to 49 and 46 to 51 days, and that for female
flowers it ranged from 51 to 54 and 50 to 55 days, respectively. Female flowering was late as
compared to male flowering in all genotypes and hybrids tested.

7
Akand (1993), studied mean performance of fruits per plant of 20 ridge gourd hybrids and
their parents. He reported that the total number of fruits per plant ranged from 5.22 to 6.11.
Latif (1993), noted that the range of yield per plant of 5 ridge gourd inbred lines and their 10,
F1 hybrids was 1.01 kg to 2.14 kg. After evaluation of 20 hybrids of ridge gourd and their
parents.Akand (1993) reported that the range of yield per plant was 2.15 to 3.85 kg. Rashid
(1993) noted that, the length of ridge gourd fruit varied from 15 to 40cm.
Rahman et al. (1990, 1991); reported variations in fruit weight among a number of genotypes
of ridge gourd. They reported that the average weight per fruit varied from 50 g to 95 g. The
genotypes with smallest fruits showed the highest fruit weight on the contrary longest fruits
did not have highest individual fruit weight.
Rahman et al. (1990, 1991); found significant variations in fruit length and breadth of ridge
gourd genotypes. They reported that fruit length varied from 11 to 16 cm and fruit breadth
varied from 2.8 to 4.1 cm. He also concluded that days to male flowering was earlier than
days to female flowering in the genotypes of ridge gourd studied. He observed significant
variation for days to first flowering among the genotypes of ridge gourd. They reported that
days to male and female flowering ranged from 35 to 37 days and 37 to 43 days, respectively.
In a study of Rahman et al. (1990) reported significant variation in biter gourd, ridge gourd,
sweet gourd genotypes for number of fruits per plant. He reported in ridge gourd that, the
average yield per plant varied from 1.83 kg to 3.00 kg with no significant difference. They
also mentioned that weight per fruit appeared to be unrelated with yield per plant.
Krishna Prasad and Singh (1989), noted in ridge gourd that the number of node at which first
male and female flowers opened was an average of 7 to 16. He also observed that, the range of
total number of fruits per plant of 11 varieties of ridge gourd was 26 to 86.
Mondal et al. (1989); studied the genetic variability of 31 watermelon genotypes and observed
a wide range of variability for days to first fruit harvest, number of fruits per plant, fruit
length, fruit diameter and fruit yield per plant.
Sahni et al. (1987); studied the genotypic and phenotypic variability in ribbed gourd and
found that for improvement by heterosis breeding fruit length and fruit breadth showed high

8
potentiality. They found non-additive gene effects in first female flowering node as well as
female flower number per stem in ridge gourd. They also studied genotypic and phenotypic
variability in ridge gourd and found that, heritability was high for most of the characters
studied and fruit weight was controlled by additive genes.
Arora et al. (1983); reported in sponge gourd that days to first male and female flowering
ranged from 56 to 118 days and 61 to 125 days, respectively. They also observed that, the
node number of first female flowers opened ranged from 8 to 20.
2.2 Genetic diversity
Khule et al. (2011); has done an experiment on sponge gourd and found that, the extent of
genetic variability present in a population mainly control the effective selection. The
estimation of genotypic and phenotypic coefficient of variation, heritability and its controlling
components are useful in designing crop improvement breeding progammes.
Yadav et al. (2009); studied about genetic variability, heritability and genetic advance for
different characters in 20 cucumber genotypes. The study resulted in that, existence of
considerable amount of genetic variability for all the traits except cavity of fruit at edible
stage. The maximum phenotypic and genotypic coefficient (PCV and GCV) was observed for
number of days to first female flower anthesis. High estimates of heritability (broad sense)
genotypic coefficient of variation (GCV) and genetic advance were observed for no. of fruit
per plant, fruit length and fruit weight.
Quamruzzaman et al. (2009); did an experiment to study about heterosis in bottle gourd in a
set of 13 F, with 26 parents. Results indicated highly significant differences for all the
characters among the materials studied. Heterosis was higher for number of fruits per plant,
yield per plant, medium in fruit length and fruit diameter, and individual fruit weight and
lower in days to 1st harvest. Hybrids (F1) 10 x 17 and 19 x 26 manifested highest heterosis
over midparent (73.1"A) and better parent (61.8%), respectively, for yield per plant.
Khan et al. (2008); assessed the genetic diversity among 64 pointed gourd genotypes through
multivariate analysis from an experiment conducted in Regional Agricultural Research
Station, lshurdi, Pabna during the growing season 2002-2003. The genotypes were grouped
into twelve clusters. The cluster V consisted of highest number of genotypes and it was nine,
the cluster VI and cluster VIII contained the lowest number of genotypes and it was two in

9
each. The clustering pattern of the genotypes under this study revealed that the genotypes
collected from the same location were grouped into different clusters. The genotypes of
Jessore were distributed in different clusters. The highest inter genotype distance as 366.3
observed between the genotypes P0022 and P0007 and the lowest 2.6 as observed between the
genotypes P0043 and P0044. Cluster V had the highest cluster mean value for internodes
length, fruit weight per plant and yield the highest inter-cluster distance was noticed between
cluster III and II (45.71) and the lowest between cluster VII and VI (3.33). The highest intra
cluster distance was computed for cluster III and that was lowest for the cluster II. The first
five axes accounted for 77.65% of the total variation among the 13 characters describing 64
pointed gourd genotypes. Fruit weight, seeds per fruit and fruit weight per plant contributed
maximum to the total divergence.
Sanwal et al. (2008); evaluated thirty eight indigenous collections of chow-chow for eight
quantitative and quality traits. On the basis of genetic divergence, relative magnitude of D2
values thirty-eight genotypes were grouped into seven clusters. The maximum genetic
divergence was observed between cluster III and VII followed by cluster II and VI. The
cluster V and VI displayed lowest degree of divergence. The minimum intra-cluster distance
was exhibited for cluster VI followed by cluster V. However, it was highest for cluster III. The
mean values were higher in cluster I and IV for two characters i.e. fruit length and average
fruit weight, while cluster II had high mean values for number of fruits/plant.
Quamruzzaman et al. (2008); conducted experiment at the farm of Olericulture Division HRC
and in different BARS, BARI during the summer season of 2005 on the genetic divergence
among thirty genotypes of ridge gourd (Luffa acutangula). The genotype RGN05, RGN06,
RGN07, RGN08, RGN13, RGN17, RGN18, RGN27 and RGN29 recorded highest cluster
mean values for days to 1st male flower open (56.0 days) and single fruit weight (141.0 g) and
RGNO3. RGN12 lowest mean values for days to 1st female flower open (27.0 days) and
single fruit weight (85.0 g). The role of days to 1st male flower open. Days to l
st female flower
open. Fruit diameter, single fruit weight and fruit number in PCA indicates their importance in
genetic divergence.
Gaffar (2008), carried out an experiment at the experimental farm of Sher-e-Bangla
Agricultural University with 15 sponge gourd genotypes. Among the characters the highest

10
GCV recorded for yield per plant (63.90) followed by top fruit perimeter (46.60) and average
fruit weight (39.52). Genotypes included in cluster I were suitable for yield per plant (6.55),
cluster III for having the highest mean value for inter node length (17.62), cluster V for leaf
length (30.43), leaf breadth (24.65), petiole length (13.28), days to first male flower (103.28),
days to first female flower (107.80) and other characters.
Gaffar (2008), reported that, the genotypic variance (10.67) was lower than phenotypic
variance (11.67) as well as the PCV (12.13%) was, slightly higher than GCV (11.67%) and
genetic advance (6.48) in sponge gourd.
Gaffar (2008), observed GCV (20.94%0 was slightly lower than the PCV (23.31%),
heritability in broad sense was high (94%) with moderate genetic advance (7.81) for this
character in sponge gourd.
Gaffar (2008), among 15 sponge gourd genotype found that, the genotypes were grouped into
five clusters. The highest intra cluster distance was noticed for the cluster III (0.999) and the
lowest for the cluster IV (0.439). The highest inter-cluster distance was observed between
cluster IV and V (7.163) where as the lowest was observed between cluster I and cluster IV
(2.258).
Kumar et al. (2007); conducted an experiment to study the path coefficient of 20 bottle gourd
(Lagenaria vulgaris) genotypes. From Path analysis they found that, number of branches per
vine, vine length, nodes number of first female flower and number of fruit per vine had
positive direct effect on fruit yield per vine.
Kabir (2007), conducted an experiment on variability and estimation of genetic parameter,
correlation, path analysis and genetic diversity of 24 accessions of pointed gourd with respect
of different parameter such as days to flower, fruit length, fruit breadth, single fruit weight,
pulp seed ratio, and number of fruits per plant, weight of fruit per plant and yield of fruit.
However, the highest performance in weight of fruits per plant, single fruit weight and yield.
The accession PG020 showed days require to first flowering (49.86% and 52.41%), fruit
length (7.4% and 7.42%), fruit breadth (23.56% and 26.79%), single fruit weight (172.27%
and 173.28%), and weight of fruit per plant (161.87% and 167.85%) recorded moderate GCV
and PCV. However, the highest genotypic and phenotypic co-efficient were recorded in the
parameter number of fruits per plant (5415.55% and 5623.67%) and second highest was

11
recorded from yield of fruits ton per hectare (410.30% and 41(08%). Path analysis indicates
fruit breadth, number of fruits per plant and single fruit breadth, number of fruits per plant and
contributed to the yield of pointed gourd accessions. Correlation coefficient indicated that fruit
yield per plant was highly significant and there was a positive association with weight of fruit
per fruit weight.
Kabir (2007), reported that genetic divergence studied 24 accessions of pointed gourd. The
accessions were grouped into five clusters. The cluster I and III had the highest number of
accessions (six) followed by cluster V (five), cluster II (four) & Cluster IV (three). The
highest intra cluster distance was computed for cluster IV (35.80) followed by cluster I
(28.12) and Cluster V (26.63). The minimum intra cluster distance was found in III (18.87).
Masud et al. (2006); carried a field experiment with seven inbred lines and their twenty-one
hybrids of bottle gourd. Result showed significant variation in seven characters of the twenty
eight populations. Variabilities were high in all seven characters indicating the possibilities of
improvement through selection. Specific combining ability variance were significant for all
characters while general combining estimates were significant for days to anthesis, fruit
length, fruit diameter and yield per plant which indicated the presence of dominance for all the
characters but additivity is for only few characters. Parent-two showed good GCA for
earliness and fruit length, Parent-five showed good GCA for fruit length only and parent-
seven showed good GCA for fruit diameter and fruit yield per plant. The cross involving
parent-three and parent-five, which is the best for earliness, fruit length (53.5%) and fruit yield
per plant (106.8%).
Karuppaiah et al. (2005); evaluated genetic divergence in 12 genotypes of bitter gourd
(Momordica charantia) grown in Annamalai, Tamil Nadu, India, during June-July 2001.
Using Mahalanobis D2 technique, the genotypes were grouped into clusters I (four genotypes),
II (one genotype), III (three genotypes) and IV (four genotypes). Among the four clusters,
cluster IV (LA-7, LA-9, LA-10 and LA-12) registered the highest mean values for vine length
(6.2 m), number of male flowers per plant (79.3), number of female flowers per plant (23.2),
yield per plant (5.2 kg), single fruit weight (242.2 g), fruit length (29.4 cm), number of fruits
per plant (24.1), number of seeds per fruit (52.3), fruit size index (173.2), and 100-seed weight

12
(18.6 g). Hence, it is desirable to involve LA-7, LA-9, La-10 and LA-12 of cluster IV in
breeding programmes.
Harshawardhan and Ram (2003), conducted an experiment on severity germplasms of musk
melon lines to elucidate genetic divergence using a non-hierarchical Euciden cluster analysis
for yield and its components. The genotypes were grouped into 11 clusters irrespective of
geographic and genetic diversity. Group VIII contained the largest number of 11 genotypes.
The maximum genetic distance occurred between cluster II and X.
Hazra et al. (2003); reported that genetic divergence studied on 167 accessions of pointed
gourd and grouped in eight non-overlapping clusters, with cluster IV comprising of the
highest number of accessions (37 accessions) and cluster VI comprising of the lowest number
of genotypes (six accessions). Inter cluster distance ranged from 1.25 in cluster I to 1.65 in
cluster VII. Cluster VIII and V were the most diverse as indicated by the maximum inter
cluster distance between them (6.04).
Chowdhury and Sharma (2002); studied genetic variation, heritability, genetic advance and
correlation for yield and yield components (vine length, number of nodes, node on which the
first flower appeared, number of fruits per plant, fruit length, fruit girth and fruit weight) in 12
Luffa acutangula cultivars. The genetic co-efficient of variation (GCV) was higher than the
phenotypic co-efficient variation (PCV) for all the characters. High values of variability, PCV,
GCV and genetic advance recorded for vine length, yield per hectare and fruit weight
indicating that these characters were controlled by additive gene effects. The correlation co-
efficient revealed that yield per hectare could be improved through selection for higher fruit
number per plant, fruit length and girth and individual fruit weight.
Banik (2003), found that the inter cluster distance was maximum between cluster II and IV
(17.74). Main vine length, node number for first female flower, nodes on main vine, fruit
length and number of seeds per fruit had the highest contribution towards the divergence.
Raseed et al. (2002); studied the genetic divergence of 47 pumpkin genotypes collected from
different parts of Bangladesh using Mahalanobis's D2 and principal component analyses. The
genotypes were grouped into seven clusters. Clusters III had the maximum (11) and cluster IV
and VII had the minimum (4) number of genotypes. The characters like fruit weight yield per
plant contributed maximum towards total divergence.

13
Masud et al. (2001); studied genetic divergence in 19 genotypes of sponge gourd (Luffa
cylindrica) collected from local and exotic sources. The genotypes were grouped into five
clusters. The genetic divergence of the genotypes did not follow their geographical
distribution and was fairly at random. There was no evidence of relationship between
geographical distribution and genetic divergence as estimated by D2 statistics. Maximum
intercluster distance (45.9) was observed between cluster II and V and minimum (10.3)
between cluster II and IV. Fruit length and diameter were significant contributors to genetic
divergence.
By Ram et al. (2001) Cluster analysis was performed in 167 Pointed gourd genotypes (T.
dioica) collected from different ecogeographic region of India. On the basis of different yield
contributing agro morphological traits, the genotypes were grouped into eight clusters which
were non-overlapping. Cluster IV comprising the most number of genotypes (37 accessions)
and cluster VI comprising the lowest number of genotypes (6 accessions). Intra-cluster
distance ranged from 1.258 in cluster I and 1.655 in cluster VII. Cluster VIII and V were the
most diverse as indicated by maximum inter cluster distance between them (6.049). The
results indicated the potential for wide scope of varietal improvement through hybridization
and selection due to the wide genetic diversity present in the accession studied.
By Badade et al. (2001) Genetic divergence using Mahalanobis's D
2 statistics was studied for
seven quantitative characters including yield per vine in a collection of twenty diverse
cultivars of bottle gourd. The cultivars differed significantly for almost all of the characters
and were grouped into 10 clusters based on the similarities of D2 value. Considerable diversity
within and between clusters was noted and it was observed for the characters viz. vine length,
no. of branches, fruit/vine, length and diameter of fruit and yield per vine. Rashid (2000)
found no relationship between geographic distribution and genetic diversity in pumpkin. The
result suggested that geographic isolation in not the only factor causing genetic diversity and
this point should be considered in selecting parents for hybridization.
Dora (2001), studied eleven genotypes of T. dioica and the genotypes were grouped into four
clusters based on Mahalanobis's D2 statistics and found that inter cluster distances were
greater than intra cluster distances, indicating considerable genetic diversity among genotypes.
The highest D2 value (984.3) was recorded between cluster II and IV.

14
Ramos et al. (2000); evaluated the genetic diversity of 40 squash accessions collected from
distinct areas of the Northeast region of Brazil. The data were analyzed using canonic variable
and Tocher cluster analysis adopting Mahalanobis D2 general distance. It was observed that
65% of the accessions were clustered in a group. The disperse results based on the first four
canonic variables (71 % of total variability) did not permit a correlation between genetic
diversity and eco-geographical origin.
Masud et al. (1995); carried out an experiment to study the genetic divergence among 27
genotypes of pumpkin (Cucurbita moschata) collected from eight districts of Bangladesh was
grouped into seven cluster. No relationship was found between genetic divergence and
geographic distribution of the genotypes. Maximum inter cluster distance was observed
between cluster II & VII and was minimum between V & VI. Number of fruits per plant and
yield per plant showed maximum contribution to the total divergence. The results obtained by
D2 analysis were confirmed by principal component analysis.
Varalaksmi et al. (1994); conducted an experiment with 58 genotypes of ridge gourd collected
from different regions of India to analyze genetic divergence. Nineteen (19) quantitative
characters were selected to study genetic divergence using Mahalanobi's 02 statistics and
Tocher method to form cluster. The 58 genotypes were grouped into five clusters but, in
general, there was no association between geographical distance and genetic divergence.
There was substantial variation in cluster means for whole plant sex ratio, fruit number per
plant, fruit weight and yield per plant. The intercluster D2 value indicated that cluster Ill was
most divergent from the other clusters.
Varghese (1991), reported an experiment on the variability among 48 snake gourd genotypes
in respect of different yield contributing, characters and found significant differences among
the characters. Main vine length varied from 3.035 to 7.85 m with high heritability (97.0%), In
case of number of branches per vine, heritability was 91.0%. Moderate GCV and PCV in fruit
length and breadth (32.15 and 32.51; 20.26 and 21.23) was also observed in snake gourd
germplasm. Narrow differences between GCV and PCV in fruit weight with high heritability
also observed. GCV and PCV for yield per plant were 30.0 and 31.33 respectively. 100 seed
weight varied from 20.0 to 41.0 g with high heritability 97.8% in snake gourd.

15
Abusaleha and Dutta (1990), the genotypic and phenotypic coefficient of variations were of
the same magnitude indicated the absence of environmental interaction on the characters. The
difference between GCV and PCV were observed to be comparatively low for all characters
which suggested all these characters had less influence by environment.
Kadam and Kale (1987), observed highly significant difference between cultivars suggesting
considerable divergence among 30 ridge gourd cultivars. The 30 cultivars were grouped into
20 clusters based on their D2 values. Cluster A having two cultivars had the lowest intra-
cluster D2 values (8.22) while clusters I which has two cultivars had the highest intra-cluster
value of 18.59. The highest inter-cluster distance was observed between clusters E and M
(387.11) and it was minimum between cluster D and G (19.79).
Mathew el al. (1986); studied genetic distance among five botanical varieties of Cucumis
melo. The genetic distance was calculated for nodes to first female flower, fruit weight, seeds
per fruit and fruits per plant. Total D2 was estimated according to Mahalanobis (1936). The
magnitude of D2 indicated closeness among the varieties. The character fruits per plant
contributed maximum to total divergence (80%). Seeds per fruit did not contribute to the total
divergence and concluded that selection of botanical varieties based on fruits per plant would
be a logical step in the selection of divergence parents in crop improvement programme.
Mangal et al. (1981); noticed that in bitter gourd significant variation for fruit length and
diameter present and high heritability in bitter gourd for vine length.
Ramachandran et al. (1981); grouped 25 bitter gourd germplasm into ten clusters based on
their D2 values. The inter-cluster distance value observed was maximum between cluster VI
and VIII (8569.31) and the minimum was between cluster II and III (393.62). The co-efficient
of variation estimated for different characters among the 10 clusters showed greater role for
yield per plant (38.84), fruits per plant (25.68), female flowers per plant (19.82) and fruit
length (19.05) in determining the inter-cluster distance. It was further observed that the
character yield per plant, fruits per plant and female flowers per plant and fruit length
contributed predominantly to divergence.
Guar et al. (1978); studied genetic diversity is one of the important tools to quantify genetic
variability in both self and cross-pollinated crops Twenty six genotypes of snake gourd were
tested using multivariate analysis and the genotypes were grouped into seven distinct clusters.
16
No relationship was found between genetic divergence and geographic all distribution of
genotypes. The highest inter genotypes distance was observed between the genotypes SG 026
and SG 0.10 (1.897).
Johnson et al. (1955); suggested that heritability estimates in conjunction with genetic
advance were reliable in predicting the resultant effect for selecting the best individual. The
expected genetic advance expressed in percentage of mean was high for characters such as
marketable fruit yield per plant, number of fruit per plant, fruit length and number of seeds per
fruit while, days to appear first male flower, days to appear first female flower and fruit
diameter had low expected genetic advance expressed in percentage of mean. Based on these
findings it was suggested that more emphasis should be given to marketable fruit yield per
plant, fruit length and number of fruit per plant in selection programme aiming to improve
fruit yield in sponge gourd.
According to Burton (1952) a character having high GCV value with high heritability would
be more valuable in the selection programme. High heritability value couple with high to
magnitude value were observed for marketable fruit yield per plant, number of fruit per plant,
fruit length and number of seeds per fruit there by indicating less environmental influence on
these characters.

17
CHAPTER III
MATERIALS AND METHODS
3.1 Experimental Site
The experiment was conducted at the experimental farm of Sher-e-Bangla Agricultural
University, Dhaka-1207, during 25th
April 2014 to September 2014. The Location of the
experimental site was situated at 23°74'N latitude and 90°35'E longitude at an altitude of 8.6
meter above the sea level. The physical and chemical characteristics of the soil have been
presented in Appendix I.
3.2 Climate
Area has subtropical climate, characterized by high temperature, high relative humidity and
heavy rainfall. Kharif season (April-September) and scanty rainfall associated with
moderately low temperature during, the Kharif season (April-September). Meteorological
information regarding temperature, relative humidity, rainfall and sunshine hours prevailed at
the experimental site during the study period was presented in Appendix 2.
3.3 Characteristics of soil
Soil of the experimental site belongs to the general soil type, Shallow Red Brown Terrace
Soils under Tejgaon Series. 'Lop soils were clay loam in texture, olive-gray with common fine
to medium distinct dark yellowish brown mottles. Soil pH ranged from 5.47 to 5.63, organic
matter 0.82%. Experimental area was flat having available irrigation and drainage system and
above flood level. Soil samples from 0-15 cm depths were collected from experimental field.
The analyses were done by Soil Resource and Development Institute (SRDI) Dhaka.
Physicochemical properties of the soil are presented in Appendix 3.
3.4 Genotypes
A total number of 16 (Sixteen) genotypes were used in this experiment. The seeds of the
fifteen genotypes were collected from several area and market of Bangladesh. Sources of
genotypes are presented in Table1.
3.5 Design and Layout
The experiment was laid out in Randomized complete Block Design (RCBD). The total area

18
Table 1. Sources of 16 sponge gourd genotypes
SI. NO. DESIGNATION GENOTYPES SOURCES
01 G-01 BD-8427 PGRC,BARI
02 G-02 BD -1699 PGRC,BARI
03 G-03 BD -2360 PGRC,BARI
04 G-04 BD -1719 PGRC,BARI
05 G-05 BD -2376 PGRC,BARI
06 G-06 BD -1718 PGRC,BARI
07 G-07 BD -2361 PGRC,BARI
08 G-08 BD -2374 PGRC,BARI
09 G-09 BD -2363 PGRC,BARI
10 G-10 BD -8421 PGRC,BARI
11 G-11 BD -2370 PGRC,BARI
12 G-12 BD -2375 PGRC,BARI
13 G-13 BD -2398 PGRC,BARI
14 G-14 BD -2371 PGRC,BARI
15 G-15 Sreepur, Gazipur GAZIPUR
16 G-16 BD -1715 PGRC,BARI
of the experiment was 468 m2
(36m x 13m) and the distance between two units was 1 m of 16
genotypes with the spacing of 1.8 m x 1.25 m. The thirty four genotypes were distributed to
each plot within each unit randomly.
3.6 Raising of Seedling
Individual poly bag was prepared for different varieties following standard method of poly
bag soil preparation. Seeds were sown in well prepared poly bag seed beds on 25th April
2014. The seeds were sown at about 1.25 cm depth and were covered uniformly with light soil
for proper germination. Heptachlor was dusted over the seedbed to prevent the seedling
mainly from an attack. The seed bed was watered as and when necessary for proper
germination as well for normal growth of the seedling. After germination shading was
arranged to protect the young seedling from scorching sunshine and was kept exposed during

19
night, morning and afternoon. Proper nursing was done for developing healthy seedlings. At
the attainment of 20 days of age the seedlings were transplanted to the Experimental Plot.
Rising of seedling in poly bag is given in Plate 1.
3.7 Land Preparation
The experimental plot was prepared by several ploughing and cross ploughing followed by
laddering and harrowing with power tiller and country plough to bring about good tilth.
Weeds and other stubbles were removed carefully from the experimental plot and leveled
properly. The final land preparation was done on the first week of May, 2014.
3.8 Pit preparation
After final land preparation, pits of 30 cm x 30 cm x 50 cm were prepared in each plot with a
spacing of 3m x 3 m. Pits were kept open in the sun for 7 days. To control field cricket,
Furadan 5G was also mixed with the soils of each pit before transplanting of seedling.
3.9 Application of manures and fertilizers
Total cow dung, half of TSP and one third MOP were applied in the field during final land
preparation Remaining TSP and one third MOP and whole gypsum and zinc oxide and one
third of urea were applied in pit one week prior to transplantation Remaining urea and MOP
were applied as top dressing in four installments at 20, 40, 60 and 75 days after transplanting
Doses of manure and 8 fertilizers used in the study are shown in Table 2.
3.10 Transplanting of Seedling
Within 20 days germination of seeds was completed and the seedlings of different accessions
were planted in the pit on13 May, 2014. In each pit two seedlings were planted and the soil
around the plant was firmly pressed by hand. Field view of plants after transplanting of
seedling is presented in Plate 2.
3.11 Intercultural operations
The following intercultural operations were done throughout the cropping season for proper
growth and development of the plants.
3.11.1Thinning out and Gap filling
Only one healthy seedling was kept per pit for the proper development and for avoiding crowd
environment. For this whenever need thinning and gap filling was done.

20
Table 2. Doses of manure and fertilizers used in the present study
Fertilizer
Total
Amount
Basal dose
/Decimal
Dose of fertilizer per Pit
7-10 DBT 10-15 DAT 30-35 DAT 50-55 DAT 70-75 DAT
Cow dung 30 Kg 20kg 5 kg - - - -
TSP 700 g 350 g 35 g - - - -
Urea 700 g - - 25 g 25 g 25 g 25 g
MOP 600 g 200 g 30 g 20 g - - -
Gypsum 400 g 400 g - - - - -
Zn
fertilizer 50 g 50 g - - - - -
Borax 40 g 4 g - - - - -
MgO 50 g - 5 g - - - -

21
Plate 1. Showing raising of seedling in poly bag
Plate 2. Seedling after transplanting in field

22
3.11.2 Weeding and mulching
Several weeding and mulching were done as per requirement. At the very first stage, weeding
was done for ease of aeration and less competition seedling growth and mulch was provided
after an irrigation to prevent crust formation and facilitate good aeration.
3.11.3 Irrigation
In the early stage of transplanting, watering was done twice daily by water cane. After
adopting in the field sprinkler irrigation was given by pipe.
3.12 Penndel preparation
Penndel was made with bamboo and wire for proper growth and development of the sponge
gourd plants. A field view of experimental site and plant with fruit is given in plate 3.
3.13 Plant protection measures
At seedling stage, especially at cotyledonary leaves, the seedling was attacked by different
insects. In primary stage of infestation, ash was used. Besides that Malathion was used in case
of severe infestation. Fruit fly caused serious damage to the fruits. Preventive and curative
measures were taken against the attack of fruit fly.
3.14 Harvesting
Harvesting of fruits was started from the 15 July, 2014 and continued up to 25 October, 2014.
Sponge gourd fruits were picked on the basis of horticultural maturity, Size, color and age
being determined for the purpose of consumption as the sponge gourd grew rapidly and soon
get beyond the marketable stage. Picking at three days interval was done throughout the
harvesting period. Fruits were picked with a sharp knife and care was taken to avoid injury of
the vine. A view of field during harvesting stage is given in plate 3.
3.15 Data collection
Data on following parameters were recorded from the studied plants during the experiment.
The details of data recording are given below on individual plant basis.
3.15.1 Seed germination
Days of seed germination for each genotype was recorded.
3.15.2 Leaf length
The length of three matured leaves were measured by a measuring scale from leaf base to the
tip and expressed in centimeter.

23
Plate 3. Field view of experimental site

24
3.15.3 Internodes length
Average length of inter node from the 10th node to the 15th node was measured in cm.
3.15.4 Leaf blade lobbing
The data were recorded by observing leaf structure phenotypically as per as the following
structure:
1. Weak 2. Intermediate 3. Strong
3.15.5 Leaf shape
The data were recorded by observing leaf shape phenotypically as per as the following
structure (Figure 1).
1. Ovate 2. Orbicular 3. Reni form
3.15.6 Days to first male flowering
Each germplasm was keenly observed for appearance of male flower and days to first male
flower opening were recorded in each case.
Ovate Orbicular
Reni form
Figure 1. Different types of leaf shape

25
3.15.7 Days to first female flowering
Each germplasm was keenly observed for appearance of female flower and days to first
female follower opening were recorded in each case.
3.15.8 Node number of first male flower opening
The order of node at which male flower appeared was recorded by counting the number of
nodes from ground level.
3.15.9 Node number of first female flower opening
The order of nodes at which first female flower appeared was recorded by counting the
number of nodes in each replication.
3.15.10 Sex ratio
Male flower and female flower ratio of in each germplasm was recorded.
3.15.11 Length of fruit (cm)
Three randomly selected fruits from selected plants of each germplasm were taken and mean
length was measured at harvest.
3.15.12 Perimeter of fruit (cm)
Diameter of three randomly selected green fruits from selected plants of each genotype was
measured in centimeter.
3.15.13 Average fruit weight (g)
Weight of three randomly selected fruits at horticultural maturity stage from each germplasm
was taken in gram and mean was calculated.
3.15.14 Petiole length (cm)
The lengths of petiole of three mature leaves were measured in centimeter with the help of
measuring scale and then mean was recorded.
3.15.15 Shape of fruit
The fruit of different genotypes showed differences in their shape. The fruit of every genotype
was recorded as per as the following shapes:
1. Elongate tapered 4. Elongate slim
2. Elliptical 5. Elongate elliptical
3. Oblong blocky

26
3.15.16 Stem-end fruit shape
Stem-end fruit shape was recorded by watching under the following structure (Figure 2).
Depressed Flattened
Rounded Pointed
Figure 2. Stem-end fruit shape
3.15.17 Blossom-end fruit shape
Blossom-end fruit shape was recorded by watching the following structure of the fruits
(Figure 3).
3.15.18 Peduncle length (cm)
Three randomly selected fruits were taken from selected plants of each germplasm and mean
peduncle length was measured in centimeter. Number of stripe per fruit: Three randomly
selected fruits were taken from selected plants of each germplasm and mean number of stripe
per fruit was recorded.
3.15.19 Number of fruits per plant
The total number of fruits of selected plants from each germplasm was recorded and mean
was found out.

27
Depressed Flattened
Pointed Rounded
Figure 3. Blossom-end fruit shape
3.15.20 Number of seed in the fruit
Amount of seed was observing by cutting five fruits of every genotype. By observing amount
of seed in the fruit the data were recorded.
3.15.21 Seed coat color
Different seed coat color was recorded.
3.15.22 Seed length (cm)
Average lengths of three mature seeds of each germplasm were measured in centimeter and
mean was calculated.
3.15.23 Seed breadth (cm)
Average breadth of three mature seeds of each germplasm was measured in centimeter and
mean was calculated.

28
3.15.24 Seed thickness (cm)
Three randomly selected seeds from selected plants of each germplasm were measured in
milimeter and mean was calculated.
3.15.25 Hundred-seed weight (g)
Hundred seeds were weighed by electric balance in gram.
3.15.26 Yield per plant (kg)
Weight of fruits of selected plants from each germplasm was weighed in kilogram
3.16 Statistical analysis
Genetic divergence is one of the most important parameters evaluated by plant breeders in
starting a breeding program. This is a necessary, but not sufficient, condition for the
occurrence of heterosis and the generation of a population with broad genetic variability.
Subsequently, heterosis is directly proportional to genetic divergence and to dominance
squared (Falconer, 1981; Cruz, 1990; Ferreira, 1993) and is also associated with adaptation. A
second approach is to use multivariate methods to estimate genetic divergence and then
predict hybrid performance. In this case, it is not necessary to make crosses. Furthermore, a
large number of materials may be successfully evaluated (Hallauer and Miranda Filho, 1981).
In the latter approach, a large number of traits must be measured. A canonical variate
technique is often used to reduce the number of these traits, through a linear combination of
them, without a significant loss of the total variation. Additionally, this technique takes into
account the structure of residual covariance. Thus, it allows plant breeders to obtain
information about traits that are important for genetic divergence among varieties.
The concept of D
2 statistics was originally developed by P. C. Mahalanobis in 1928. He used
this technique in the study of Anthropometry and Psychometry. Rao (1952) suggested the
application of this technique for the assessment of genetic diversity in plant breeding; now this
technique is extensively used plant breeding and genetics for the study of genetic divergence
in the various breeding materials. This is one of the potent techniques of measuring genetic
divergence; in plant breeding, Genetic diversity plays an important because hybrids between
lines of diverse origin, generally, display a greater heterosis than those between closely related
parents. This has been observed in Maize, alfalfa, cotton and several other crops. Genetic
diversity arises due to geographical separation or due to genetic barriers to cross ability.

29
Statistical analysis such as Mahalanobis D2 and Canonical Variate Analysis (CVA), which
quantity the differences among several quantitative traits are efficient method of evaluating
genetic diversity. Mean data of each quantitative character were subjected to both univariate
and multivariate analysis. For univariate analysis of variance, analysis was done individually
and least of significance was done by F- Test (Pence and Shukhatme, 1978). Mean, range, co-
efficient of variation (CV) and correlation was estimated using MSTAT computer program.
Multivariate analysis viz, Principal Component Analysis (PGA), Principal Coordinate
Analysis (PCO), Cluster Analysis (CLU) and Canonical Variate Analysis (CVA) were done
by using GENSTAT program.
The hierarchical nature of the grouping into various number of classes could impose undue
constrains and the statistical properties of the resulting groups were not at all clear Peyne et al.
(1989). Therefore, they have suggested non-hierarchical classification, as an alternative
approach to optimize some suitability choosing criteria directly from the data matrix. Peyne et
al. (1989) also reported that the squared distance between means were Mahalanobis's D2
statistics when all the dimensions were used, could be computed principal coordinate analysis
(PCO) they also commended the Canonical Variate Analysis (CVA) for discriminatory
purpose.
3.16.1 Variability of Sponge Gourd Genotypes
3.16.1.1 Estimation of Phenotypic and Genotypic Variance
Genotypic and of variances were estimated by Johnson et al. (1955) genotypic variance �2� were obtained by subtracting genotype mean sum of square and dividing by the
number of replication as given below:
Genotypic Variance ( � � = � �−� � � � � � �
Where,
GS = Genotypic mean sum of squire
EMS = Error mean sum of squire
The phenotypic variances ( δ2p) were come from by adding genotypic variances ( δ2g) with
error variance ( δ2e ) as shown by the given formula:
� = � + �
30
3.16.1.2 Estimation of Genotypic and Phenotypic Coefficient of Variation
According to the Johnson et al. (1955) genotypic and phenotypic coefficient of variation were
estimated.
Genotypic and phenotypic co-efficient of variation were calculated by the following formula
(Burton, 1952).
GCV = ��×�̅
PCV = ��×�̅
Where,
GCV= Genotypic co-efficient of variation
PCV=Phenotypic co-efficient of variation �� = Genotypic standard deviation ��=Phenotypic standard deviation �̅= Population mean
3.16.1.3 Estimation of Heritability
Johnson et al. (1955) was suggesting a formula for estimating broad sense heritability
Broad sense heritability was estimated by the formula suggested by Singh and Chaudhary
(1985).
h2
b (%) = � � � � ×
Where,
h2
b= Heritability inboard sense �2� = Genotypic variance �2� =Phenotypic variance
3.16.1.4 Estimation of genetic advance
The following formula was used to estimate the expected genetic advance for different
characters under selection as suggested by Allard (1960).
GA = � � � � �. ��

31
Where,
GA= Genetic advance ��2=Genotypic variance ��2=Phenotypic variance ��=Phenotypic standard deviation
K= Selection differential which is equal to 2.06 at 5% selection intensity
3.16.1.5 Estimation of genetic advance in percentage of mean
Genetic advance in percentage of mean was calculated by the following formula given by
Comstock and Robinson (1952).
Genetic Advance in percentage of mean = � � ��� ×
3.16.1.6 Estimation of simple correlation co-efficient
Simple correlation (r) was estimated from the replicated data with the help of following
formula (Singh and Chaudhary, 1985).
r =���√� .�
Where,
COVxy =Covariance of x and y traits
Vx= Variance of x traits
Vy=Variance of y traits
3.16.1.7 Path co-efficient analysis
Path co-efficient analysis was done according to the procedure employed by Dewey and Lu
(1959) also quoted in Singh and Chaudhary (1985) and Dabholkar (1992), using simple
correlation values. In path analysis, correlation co-efficient is partitioned into direct and
indirect independent variables on the dependent variable.
In order to estimate direct and indirect effect of the correlated characters, say, xl, x2 and x3
yield y,a set of simultaneous equations (three equations in this example) is required to be
formulated as shown below:
ryxl=Pyxl+Pyx2rxlx2+Pyx3 rx1x3
ryx2= Pyxlrx1x2+Pyx2 +PYX3 rx2x3
ryx3=Pyxlrx1x3+Pyx2rx2x3+Pyx3
32
Where, r´s denotes simple correlation co-efficient and P´s denote path co-efficient
(Unknown). P´s in the above equation may be conveniently solved by arranging them in
matrix from.
Total correlation, say between x1 and y is thus partitioned follows:
Pyx1= the direct effect of x1 via x2 on y.
Pyx2rx1x2= the indirect effect of x1 via x2 on y.
Pyx3rx1x3= the indirect effect of x1 via x3 on y.
After calculating the direct and indirect effect of the characters, residual effect (R) was
calculated by using the formula given below (Singh and Chaudhary, 1985).
Where,
P2
RY = Pij+ riy
P2RY= (R
2); and hence residual effect, R= (P
2RY)
1/2
Pij=Direct effect of the character on yield
riy= Correlation of the character with yield
3.16.2 Genetic Diversity Analysis
3.16.2.1 Principal Component Analysis (PCA)
It is a way of identifying patterns in data, and expressing the data in such a way as to
highlight their similarities and differences. Since patterns in data can be hard to find in data of
high dimension, where the luxury of graphical representation is not available, PCA is a
powerful tool for analyzing data. The purpose of principal component analysis it to derive a
small number of linear combinations (principal components) of a set of variables that retain as
much of the information in the original variables as possible. Principal Component Analysis
(PCA) one of the multivariate techniques, is used to niter-relationships among several
characters. It can be done from the sum of squares and products matrix for the characters.
Principal components were computed from the correlation matrix and genotype scores
obtained for the first components and succeeding components with latent roots greater than
unity (Jeger et al. 1983). Contributions of different morphological characters towards
divergence were discussed from the latent vectors of the first two principal components.
3.16.2.2 Principal Coordinate Analysis (PCO)
Principal coordinate Analysis is equivalent to PCA but is used to calculate inter unit distances.
33
Through the use of all dimensions of P it gives the minimum distance between each pair of the
points using similarity matrix (Digby et al. 1989).
3.16.2.3 Clustering
The word cluster analysis (first used by Tryon, 1939) is a number of different algorithms and
methods for grouping objects of similar kind into respective categories. In multivariate
analysis, cluster analysis refers to methods used to divide up objects into similar groups, or,
more precisely, groups whose members are all close to one another on various dimensions
being measured. In cluster analysis, one does not start with any apriority notion of group
characteristics. The definition of clusters emerges entirely from the cluster analysis-i.e. from
the process of identifying "clumps" of objects.
Cluster analysis is an exploratory data analysis tool for solving classification problems. Its
object is to sort cases (People, plant, things, events, etc) into groups, or clusters, so that the
degree of association is strong between members of the same cluster and weak between
members of different clusters. Each cluster thus describes, in terms of the data collected, the
class to which its members belong; and this description may be abstracted through use from
the particular to the general class or type.
To divide the genotypes of a data set into some number of mutually exclusive groups
clustering was done using non-hierarchical classification. In GENSTAT, algorithm was used
to search for optimal values of chosen criteria which proceed as follows:
Starting from some initial classification of the genotypes in required number of group, the
algorithm repeatedly transferred genotypes from one group to another so long as such transfer
improved the value of the criterion when no further transfer could be found to improve the
criterion, he algorithm switched to a second stage, which examined the effect of swapping two
genotypes of different classes and so on.
3.16.2.4 Canonical Variate Analysis (CVA)
Discriminate function or canonical variate analysis attempt to establish whether a set of
variables can be used to distinguish between two or more groups.
Canonical variate analysis complementary to D2 statistic is sort of multivariate analysis where
canonical vectors and roots representing different axes of differentiation and the amount of
variation accounted for by each of such axes respectively and derived. Canonical variate

34
analysis computed linear combination of original variability that maximized the ratio between
ground and within group variations, thereby giving functions of the original variables that
could be used to discriminate between the groups. Thus in this analysis, a series of orthogonal
transformation sequentially maximized the ratio of the groups to within group variations.
Several techniques that seek to illuminate the ways in which sets of variables are related one
another. The term refers to regression analysis, MANOVA, discrimination analysis, and, most
often, to canonical correlation analysis.
3.16.2.5 Cluster diagram
In D2 analysis a line diagram is constructed with the help of D
2 values which is known as
cluster diagram. The squires roots of average intra and inter cluster D2 value are used in the
construction of cluster diagram. This diagram provides information on the following aspects:
i) Depicts of the genetic diversity in an easily understandable manner.
ii) The number of cluster represents the number of groups in which a population can be
classified on the basis of D2 analysis.
iii) The distance between two clusters in the measure of the degree of diversification. The
greater the distance between two cluster the greater the divergence and vice versa.
iv) The genotypes filling in the same cluster are more closely related then those belonging to
another cluster. In other words, the genotypes grouped together in one cluster are less
divergent than those which are placed in different cluster.
v) It provides information about relationship between various clusters.
A cluster diagram was drawn using the values √�2 of intra and inter-cluster distance. The
diagram represented the brief idea of the patter diversity among the genotypes and
relationships between different genotypes included in the cluster.
3.16.2.6 Selection of Genotypes for Future Hybridization Programme
Genotypes were selected from the study for future hybridization programme considering
genetic variability and other performances related to yield (kg), number of fruit per plant,
color of fruit and presence and absence of prickle, number of primary branches, number of
secondary branches, no. of flower per days to first flowering, weight per fruit (g), percent
insect infestation of plants, curvature of the fruit, infestation of fruit length (cm) and fruit
circumference (cm).

35
CHAPTER IV
RESULT AND DISCUSSION
4.1 Characterization of sponge gourd
4.1.1 Morphological characterization
4.1.1.1 Leaf blade lobbing
Leaf blade lobbing is an important character for further breeding programme. By leaf blade
lobbing a breeder can know the rate of photosynthesis strong leaves can help a greater
opportunity to get maximum sunlight than the weaker leaves. Among the 16 genotypes, five
genotypes (G1, G6, G9, G12 and G15) were observed weaker leaf blade; five genotypes (G5,
G8, G10, G13 and G16) were strong leaf blade and rest of the genotypes was intermediate
habit in their leaf blade lobbing (Table 3). The strong leaf blade lobbing genotypes were
produced better yield than the intermediate and weaker leaves holder genotypes (Table 3). A
comparative leaf blade lobbing morphology of 16 genotypes are presented in Plate 4.
4.1.1.2 Leaf shape
For sponge gourd leaf shape is an important trait. Various types of leaves are found sponge
gourd. From the sixteen genotypes reniform, ovate and orbicular shaped sponge gourd were
observed (Table 3). Among the sixteen genotypes G5, G8, G13 and G16 produced reniform
leaf, genotypes G1, G6, G9, G12 and G15 produced orbicular leaves and the rest of genotype
produce ovate leaves (Table 3). The ovate and reniform leaves holder genotypes were shown
better yield than the ovate and orbicular leaf shaped genotypes (Table 3). A comparative leaf
shape of 16 genotypes is also presented in Plate 4.
4.1.1.3 Fruit color
Fruit color is one of the important traits in sponge gourd for consumer preference marketing.
Generally light green, green, and dark green color fruits are commonly found in the market. In
the present study, fruit colors were classified in distinct groups: like light green, green, and
dark green (Table 3). Among the sixteen genotypes, nine (G3, G4, G5, G8, G9, G13 and G15)
produced light green fruit and another four genotypes (G6, G7, G9 and G12) produced green
fruits and the rest of the genotypes were produced dark green. This variation offered a good
scope for breeding of consumer preference attributes (Plate 5).

36
Table 3. Characterization of 16 sponge gourd genotype
No. of
Genotype
Leaf lobbing Leaf shape Fruit color Blossom-end
Fruit shape
Stem-end fruit
shape
Fruit shape Seed color
G1 weaker orbicular dark green pointed pointed elongated tapered black
G2 intermediate ovate dark green rounded rounded oblong blocky black
G3 intermediate ovate light green rounded rounded oblong blocky black
G4 intermediate ovate light green rounded pointed elliptical black
G5 strong reniform light green rounded flattened elliptical brown
G6 weaker orbicular green pointed rounded elongated tapered black
G7 intermediate ovate green pointed rounded elongated tapered brown
G8 strong reniform light green rounded rounded oblong blocky black
G9 weaker orbicular light green rounded rounded elongated tapered brown
G10 strong ovate dark green pointed pointed elliptical white
G11 intermediate ovate dark green rounded pointed elliptical black
G12 weaker orbicular green flattened flattened elliptical black
G13 strong reniform light green rounded pointed elliptical black
G14 intermediate ovate dark green flattened rounded elongated tapered black
G15 weaker orbicular light green rounded flattened elliptical brown
G16 strong reniform dark green rounded pointed elliptical black

37
G1 G2 G3 G4
G5 G6 G7 G8
G9 G10 G11 G12
G13 G14 G15 G16
Plate 4. Different leaf morphology (showing different type of leaf lobbing and shape) of
16 sponge gourd

38
G1 G2 G3 G4
G5 G6 G7 G8
G9 G10 G11 G12
G13 G14 G15 G16
Plate 5. Different fruit morphology (showing fruit shape) of 16 sponge gourd

39
4.1.1 .4 Blossom-end Fruit shape
Blossom end shape is an important trait for sponge gourd. Fruit shape is divided into three
groups. One was rounded which includes the genotypes G2, G3, G4, G5, G8, G9, G11, G13,
G15 and G16. Another was pointed which includes the genotypes G1, G6, G7, G9 and G10
and G12 and G14 was flattened (Table 3).
4.1.1.5 Stem-end Fruit Shape
Stem-end shape is another important feature for sponge gourd. It helps to attract customer.
Stem end fruit was divided into four groups: depressed, rounded, pointed, and flattened (Table
3). Genotype G2, G3, G6, G7, G8, G9 and G14 produced rounded end, genotype G1, G4,
G10, G11 and G13 produces pointed end and G5, G12, G15 and G16 produced flattened end.
4.1.1.6 Fruit shape
Fruit shape is an important feature for marketing. Various types of sponge gourd were found.
From the sixteen genotype oblong blocky, elongate slim, elongated tapered and elongate
elliptical shape were observed. The genotypes G1, G6, G7, G9 and G14 produced elongated
tapered genotypes G2, G3 and G8 produced oblong blocky fruits and G4, G5, G11, G12, G13,
G15 and G16 elliptical fruits and the rest of the genotype produced G10 elongate type (Table
3).
4.1.1.7 Seed color
Brown, black and white color seeds are common in sponge gourd. However, variations were
found in present study and that were classified in several groups. G5, G7, G9, G15 and G16
produced brown seed; white seeds were produced by G10 and black seeds were produced by
rest of genotype (Table 3 and Plate 6).

40
Plate 6. Seed of 16 sponge gourd genotype ( G1-G16 chronologically )

41
4.1.2 Characterization of sponge gourd on basis of yield and yield contributing traits
4.1.2.1 Days to seed germination
The analysis of variance indicates that significant difference was present among the sponge
gourd genotype for seed germination (Table 4), Minimum days (5.00) for seed germination
was recorded in G1 and maximum days (8.00) to seed germination was recorded in genotype
number G3, G3, G7, G8, G9, G11, G12, G13 and G14 (Table 4). Gaffar (2008) found
significant difference in seed germination of sponge gourd which varied from 1 to 2 weeks.
4.1.2.2 Internodes length (cm)
Significant difference was observed in case of internodes length of sponge gourd (Table 4).
The mean value of internodes length was 12.82 cm. The length varied from 7.53 to 17.57 cm
(Table 4), the minimum length was found in G12 and the maximum length was found in G7.
Rahman (2005) evaluated thirty nine genotypes of sponge gourd of diverse origin and reported
that Internodes length of main stem varied from 10.66 to 17.33 cm. Gaffar (2008) found that,
the internodes length varied from 13.14 to 18.96 cm.
4.1.2.3 Leaf length (cm)
It was observed that leaf length varied from 8.00 to 16.93 cm with a mean value of 12.36 cm,
the minimum leaf length was recorded in Gl2 and the maximum leaf length was recorded in
G14, which differed significantly (Table 4). Gaffar (2008) found that, leaf length varied from
16.45 to 32.08 cm with a mean value of 24.56 cm.
4.1.2.4 Leaf breadth (cm)
The maximum leaf breadth was observed 18.20 in G3 and minimum was 9.50 recorded in G12
with mean value 13.88. Rahman (2005) observed thirty none genotypes of sponge gourd and
found leaf breadth varied from 17.21 to 26.43 cm. Gaffar (2008) found that, the leaf breadth
varied from 13.41 to 27.23 cm.
4.1.2.5 Petiole length (cm)
Petiole length varied significantly among the genotype and ranged from 1.50 to 10.67 cm
(Table 4). The mean value of this character was 6.53. Haque (1971) found that, petiole length
varies in bottle gourd; sweet gourd and white gourd were 13.84 cm, 14.53 cm and 12.14 cm,
respectively. The lowest value of petiole length was recorded in G7 and highest value in G4
(Table 4).

42
Table 4. Mean performance of 16 sponge gourd varieties based on different morphological traits related to yield
Variety Days to
seed
germinatio
n
Internodes
length
(cm)
Leaf
length
(cm)
Leaf
breadth
(cm)
Petiole
length
(cm)
Days of 1st
male
flowering
Days of
1st female
flowering
Node no.
for 1st
male
flower
Node no.
for 1st
female
flower
Sex
ratio
Length of
fruit
(cm)
G1 5.000 12.20 13.00 13.20 9.333 70.00 81.00 29.00 23.00 29.00 21.17
G2 8.000 14.87 12.17 13.50 10.67 72.00 80.00 29.00 23.00 31.00 22.93
G3 8.000 9.867 15.57 18.20 6.333 65.00 77.00 17.00 14.00 30.00 23.20
G4 7.000 17.57 12.37 12.50 10.33 78.00 90.00 18.00 10.00 27.00 38.00
G5 7.000 12.07 11.43 10.60 6.330 53.00 61.00 13.00 18.00 24.00 24.50
G6 7.000 14.37 14.27 17.80 6.000 68.00 75.00 22.00 10.00 29.0 36.17
G7 8.000 17.40 10.30 11.50 1.500 62.00 70.00 16.00 20.00 26.00 45.33
G8 8.000 16.43 13.00 12.40 2.830 58.00 69.00 18.00 14.00 26.00 25.17
G9 8.000 9.23 10.10 15.50 4.833 64.00 76.00 24.00 13.00 28.00 21.67
G10 6.000 8.47 14.27 17.50 8.330 57.00 68.00 13.00 13.00 25.00 48.60
G11 8.000 16.23 9.633 10.20 5.500 81.00 95.00 16.00 18.00 23.00 29.70
G12 8.000 7.53 8.000 9.50 6.167 78.00 85.00 27.00 9.000 30.00 15.10
G13 8.000 10.20 11.87 15.40 7.333 77.00 91.00 12.00 13.00 22.00 25.53
G14 8.000 10.80 16.93 14.50 7.330 82.00 95.00 13.00 12.00 30.00 21.33
G15 6.000 15.60 12.77 17.50 6.000 65.00 76.00 26.00 24.00 20.00 36.17
G16 6.000 12.37 12.17 12.30 5.667 74.00 86.00 18.00 19.00 25.00 23.63
LSD(0.05) 0.736 1.25 1.55 1.42 1.28 4.15 4.75 1.93 2.19 2.04 5.00
Standard
deviation 1.00 3.30 2.26 2.85 2.43 8.95 10.08 5.92 4.94 3.24 9.47
Standard
error (±) 0.25 0.82 0.56 0.71 0.61 2.24 2.52 1.48 1.24 0.81 2.37
Minimum 5.00 7.53 8.00 9.50 1.50 53.00 61.00 12.00 9.00 20.00 15.10
Maximum 8.00 17.57 16.93 18.20 10.67 82.00 95.00 29.00 24.00 31.00 48.60
Mean 7.25 12.82 12.36 13.88 6.53 69.00 79.69 19.44 15.81 26.56 28.64
Level of
significance ** ** ** ** ** ** ** ** ** ** **
CV (%) 6.09 5.83 7.52 6.11 11.76 3.61 3.57 5.95 8.32 4.60 10.47
** indicates significant at 0.01 probability level
Genotypes with the different letter (s) are significantly different.

43
Table 4. (Continued)
Variety Perimeter
of the fruit
(cm)
Peduncle
length
(cm)
Number of
fruit per
plant
Fruit
weight
(kg)
Yield per
plant
(kg)
Number
of seed
per fruit
Seed length
(cm)
Seed
breadth
(cm)
Seed
thickness
(cm)
100 seed
weight
(g)
G1 13.67 12.00 20.0 175.0 10.83 223.0 1.200 0.600 0.200 6.310
G2 20.00 8.000 9.00 397.7 11.00 202.0 1.150 0.700 0.200 6.400
G3 15.00 6.000 15.00 324.7 12.33 248.0 1.200 0.650 0.230 6.330
G4 9.670 10.00 12.00 324.7 14.00 450.0 1.100 0.610 0.120 6.370
G5 17.33 14.00 14.00 413.0 15.91 127.0 1.100 0.800 0.300 6.350
G6 11.00 7.000 16.00 240.7 15.63 306.0 1.300 0.700 0.200 6.300
G7 10.00 16.00 7.000 246.7 15.17 341.0 1.200 0.600 0.230 6.480
G8 9.000 14.00 16.00 328.7 14.00 352.0 1.200 0.650 0.220 6.360
G9 9.330 6.000 9.00 117.7 12.47 326.0 1.180 0.620 0.200 7.110
G10 15.67 9.000 25.0 491.0 17.67 450.0 1.050 0.550 0.200 7.160
G11 14.67 10.00 11.00 294.3 13.11 249.0 1.200 0.530 0.240 6.580
G12 22.67 8.000 10.00 224.3 8.670 60.00 1.150 0.630 0.170 6.380
G13 11.00 12.00 8.00 187.0 13.69 362.0 1.200 0.650 0.190 7.280
G14 13.67 8.000 12.00 238.0 15.87 435.0 1.220 0.570 0.230 6.470
G15 10.67 14.00 14.00 373.0 14.49 290.0 1.200 0.650 0.150 6.580
G16 8.000 13.00 11.00 253.3 16.00 418.0 b 1.300 0.700 0.210 6.360
LSD(0.05) 2.38 1.13 1.34 54.33 1.63 25.86 0.106 0.075 0.053 0.395
Standard
deviation 4.19 3.18 4.68 98.02 2.33 113.86 0.066 0.067 0.040 0.33
Standard
error (±) 1.05 0.80 1.17 24.51 0.584 28.47 0.016 0.017 0.010 0.08
Minimum 8.00 6.00 7.00 117.67 8.67 60.00 1.05 0.53 0.120 6.30
Maximum 22.67 16.00 25.00 491.00 17.67 450.00 1.30 0.80 0.300 7.28
Mean 13.21 10.44 13.06 289.35 13.80 302.44 1.18 0.64 0.206 6.55
Level of
significance ** ** ** ** ** ** ** ** ** **
CV (%) 10.81 6.50 6.14 11.26 7.10 5.13 5.44 6.29 10.43 3.63
** indicates significant at 0.01 probability level
Genotypes with the different letter (s) are significantly different.

44
4.1.2.6 Days to first male flowering
It is one of the most important plant characters. The maximum duration was observed 82.00 in
G14 and the minimum duration was 53.00 in G5 with mean value 69.00 (Table 4). Singh and
Lal (2005) in their study reported similar result. Banik (2003) and Joseph (1978) found
significant differences for days to first male flower opening in snake gourd.
4.1.2.7 Days to first female flowering
Another important character that influences the yield is days to first female flowering.
Analysis of variance indicated that, there was wide range of variability among the 16 Sponge
gourds (Table 4). The range varied from 61.00 days to 95.00 days. Genotype G5 showed early
female flowering and G11 showed late female flowing (Table 4). Arora et al. (1983) repotted
in sponge gourd that days to first female flowering varied from 61 to 85 days.
4.1.2.8 Node number for first male flower
Node number for first male flower significantly ranged from 12.00 to 29.00 (Table 4). The
mean value was the 19.44. The minimum value was recorded for G13 and the maximum value
was for G1and G2. Rahman (2005) found significant differences in yield for the nodal
position of first male flower in sponge gourd.
4.1.2.9 Node number for first female flower
Node number for first female flower ranged from 9.00 to 24.00 (Table 4). The mean value was
the 15.81. The minimum value was recorded for G12 and the maximum value was for G15.
Arora et al. (1983) observed in sponge gourd that the node number of first female flowers
opened ranged from 8 to 20.
4.1.2.10 Sex ratio (male: female)
Significant difference was also observed in this trait (Table 4). It ranged from 20.00 to 31.00.
The minimum value was found in G15 and the maximum value was found in G2 (Table 4).
The mean value was 26.56. Rahman (2005) found significant differences for sex ratio of
sponge gourd and it’s ranged from 15.09 to 26.88. Gaffar (2008) found sex ratio ranged in
sponge gourd from 21.93 to 31.84.
4.1.2.11 Length of fruit (cm)
Significant difference was observed in fruit length among 16 genotypes (Table 4). Among the
genotype studied, longest fruit (48.60 cm) was observed in G10 while the shortest fruit length

45
(15.10 cm) was recorded in G12 (Table 4). Significant variation for fruit length was noticed in
sponge gourd (Arora et al. 1983; Prosad and Singh, 1990), ribbed gourd, bottle gourd
(Rahman et al. 1991) and Gaffar (2008) in sponge gourd.
4.1.2.12 Perimeter of the Fruit (cm)
Perimeter of edible fruit at middle position varied significantly among 16 sponge gourd
genotypes and ranged from 8.00 to 22.67 cm. The mean value was 13.21 cm. The highest
diameter recorded in G12 and the lowest diameter were observed in G16 (Table 4). Rahman
(2005) also found significant differences for this character of sponge gourd. Gaffar (2008)
found in 15 sponge gourd genotypes that fruit perimeter ranged from 12.12 to 18.02 cm and
the mean value was 16.14.
4.1.2.13 Peduncle length (cm)
Peduncle length of edible fruit at middle position varied significantly among 16 sponge gourd
genotypes and ranged from 6.00 to 16.00 cm. The mean value was 10.44 cm. The highest
peduncle length recorded in G7 and the lowest Peduncle length were observed in G9 (Table
4). Rahman (2005) evaluated thirty nine genotypes of sponge gourd of diverse origin and
reported that, peduncle length varied from 7.23 to 17.06 cm. Gaffar (2008) found that,
peduncle length ranged from 12.12 to 18.02 cm. and mean value was 16.14 cm among 15
genotype of sponge gourd.
4.1.2.14 Number of fruits per plant
One of the most important yield contributing characters is number of fruits per plant. The
lowest number of fruits (7.00) per plant was recorded in G7 and the highest number of fruits
(25.00) was recorded in G10 (Table 4). Rahman (2005) observed thirty nine genotypes of
sponge gourd of diverse origin and reported fat number of fruits per plant varied from 4.50 to
15.17. Gaffar (2008) found in his experiment with 15 sponge gourd that, the lowest number of
fruits per plant was 7.32 and the highest number of fruits is 20.39.
4. 1.2.15 Fruit weight (g)
Significant difference was observed in average fruit weight among the 16 genotype of sponge
gourd ranging from 117.67 to 491.00 g. It is also an important yield contributing character.
The highest value was obtained from G10 and the lowest value was obtained from G12 is

46
given in (Table 4). These findings are in agreement with Rahman (2005). Gaffar (2008) in
sponge gourd found that fruit weight varied from 152.66 to 501.77 g.
4.1.2.16 Yield per plant (kg)
Significant difference was found among the 16 sponge gourd genotype for the yield per plant
(Table 4). The yield per plant ranged from 8.67 to 17.67 kg with the mean value of 13.80 kg
per plant. The lowest yield was found in G12 while G10 that showed highest yield per plant
(Table 4). This results support the findings of was the highest Abusaleha and Datta (1990) in
cucumber.
4.1.2.17 Number of seeds per fruit
Number of seeds per fruit also an important yield contributing character. Significant
difference was found among the 16 genotype in these traits (Table 4). Number of seeds per
fruit varies from 60.00 to 450.00 and the mean value is 302.44. Maximum no of seed was
recorded in G 10 and minimum number of seeds was recorded in G12 (Table 4). Gaffar (2008)
found that, seed number varies from 134.33 to 343.16 and the mean value is 222.51. Swami et
al. (1984) and Mannan (1992) also reported wide variability in snake gourd, bitter gourd and
musk melon. Rahman (2005) also find the similar result.
4.1.2.18 Seed length (cm)
The seed length varied from 1.05 to 1.30 cm. The lowest seed length was recorded in G10
and the highest length was recorded n G16 (Table 4). The mean value was 1.18 cm. Rahman
(2005) found significant differences for seed length of sponge gourd. Gaffar (2008) said in
his experiment that, seed length varied from 0.87 to 1.33 cm and mean value was 1.07 cm.
4.1.2.19 Seed breadth (cm)
Significant difference was found among 16 genotypes of sponge gourd. In this experiment it
was found that, highest seed breadth in G5 (0.80 cm) and the lowest was found in G11
(0.53cm) which are in (Table 4). This findings support with the agreement of Rahman (2005)
in sponge gourd as well as Gaffar (2008) found highest seed breadth 0.90 cm and lowest seed
breadth 0.070cm.
4.1.2.20 Seed thickness (cm)
The seed thickness varied from 0.120 to 0.300 cm. The highest thickness was recorded in
genotype G5 and the lowest value from G4 (Table 4). Rahman (2005) found non- significant

47
differences for sponge gourd. Gaffar (2007) also found non- significant differences for sponge
gourd seed thickness from 0.023 to 0.033 cm.
4.1.2.21 Hundred seed weight (g)
Hundred seed weight was recorded for 16 genotypes of sponge gourd. It varied from 6.30 to
7.28 g .The highest weight of 100 Seed weight was recorded in G6 and the lowest in G13
(Table 4). Rahman (2005) observed thirty nine genotypes of sponge gourd and reported that
hundred seed weight varied from 8.06 to 9.46 g. Gaffar (2008) found highest hundred seed
weight was 7.68g and lowest seed weight was 6.38g.
4.2 Variability of sponge gourd on the basis of yield and yield contributing characters
4.2.1 Days to seed germination
The phenotypic and genotypic variance was 1.13 and 0.935. Genotypic coefficient of variation
(GCV) was lower (13.34) than phenotypic coefficient of variation (14.66).Which indicated
that little role of environment on the performance of particular character. Heritability in broad
sense was 82.74 with low genetic advance (1.81) and genetic advance in percent of mean was
24.99 was considerable for this trait indicating apparent variation for genotype (Table 5).
Thus, selection can be done by considering this trait. This result also agrees with the findings
of Gaffar (2008).
4.2.2 Internodes length (cm)
The genotypic and phenotypic variances for internodes length were 10.69 and 11.25
respectively. The GCV and PCV were 25.49 % and 26.15 %, respectively (Table 5). Little
role were observed between genotypic and phenotypic variance as well as genotypic and
phenotypic co-efficient of variation indicating low environmental influences on this trait. The
heritability in broad sense for inter node length was high (95.04) with moderate genetic
advance (6.57) and genetic advance in percent of mean (51.20) was considerable for this trait
indicating apparent variation was due to genotypes. So selection based on this in trait would
be effective. This result also has agreement with the findings of Singh et al. (2002).
4.2.3 Leaf length (cm)
This character showed high heritability (84.76) and moderate genetic advance (4.16) and
genetic advance in percent of mean (33.63) which indicated character was controlled by

48
Table 5. Estimation of genetic parameters for morphological characters related to yield
Sl
No. Characters
Range Mean Mean sum
of square
(MS)
Phenotypic
variance
(2p)
Genotypic
variance
(2g)
PCV
(%)
GCV
(%)
Heritabi
lity (%) GA
GA
(%)
1 Days to seed germination 5.00-8.00 7.25 3.00 1.13 0.935 14.66 13.34 82.74 1.81 24.99
2 Inter node length (cm) 7.53-17.57 12.82 32.63 11.25 10.69 26.15 25.49 95.04 6.57 51.20
3 Leaf length (cm) 8.00 16.93 12.36 15.29 5.67 4.81 19.26 17.73 84.76 4.16 33.63
4 Leaf breath (cm) 9.50-18.20 13.88 24.38 8.61 7.89 21.13 20.23 91.63 5.54 39.90
5 Petiole length(cm) 1.50-10.67 6.53 17.68 6.29 5.70 38.39 36.55 90.62 4.68 71.67
6 Days to 1st male flowering 53.00-82.00 69.00 240.40 84.26 78.07 13.30 12.81 92.65 17.52 25.39
7 Days to 1st female
flowering 61.00-95.00 79.69 304.69 106.97 98.86
12.98 12.48 92.42 19.69 24.71
8 Node no. of 1st male flower 12.00-29.00 19.44 105.19 35.95 34.62 30.85 30.27 96.28 11.89 61.18
9 Node no. of 1st female
flower 9.00-24.00 15.81 73.29 25.58 23.85
31.99 30.89 93.24 9.71 61.44
10 Sex ratio 20.00-31.00 26.56 31.58 11.52 10.03 12.78 11.92 87.07 6.09 22.92
11 Fruit length (cm) 15.10-48.60 28.64 269.27 95.74 86.76 34.17 32.53 90.62 18.27 63.78
12 Perimeter of the fruit(cm) 8.00-22.67 13.21 52.66 18.91 16.88 32.92 31.10 89.26 8.00 60.53
13 Peduncle length(cm) 6.00-16.00 10.44 30.39 10.44 9.98 30.95 30.26 95.58 6.36 60.94
14 Number of fruit per plant 7.00-25.00 13.06 65.79 22.36 21.71 36.20 35.67 97.12 9.46 72.42
15 Fruit weight (kg) 117.67-
491.00 289.35 28825.35 10316.04 9254.66
35.10 33.25 89.71 187.7 64.87
16 Yield per plant(kg) 8.67-17.67 13.80 16.35 6.09 5.13 17.88 16.41 84.25 4.28 31.03
17 Number of seed per fruit 60.00-450.00 302.44 38892.38 13124.43 12883.97 37.88 37.53 98.17
231.6
7 76.60
18 Seed length(cm) 1.05-1.30 1.18 0.013 0.007 0.003 7.06 4.62 42.86 0.07 6.24
19 Seed breadth (cm) 0.53-0.80 0.638 0.013 0.006 0.004 11.80 9.49 64.71 0.100 15.72
20 Seed thickness (cm) 0.12-0.30 0.206 0.005 0.002 0.001 23.49 17.76 57.14 0.057 27.65
21 100 seed weight(g) 6.30-7.28 6.55 0.319 0.14 0.09 5.79 4.52 61.02 0.48 7.27
49
additive genes. Therefore the selection based on this character would be effective. Gaffar
(2008) observed in broad sense heritability was high (94%) with moderate genetic advance
(4.31) and genetic advance in percent of mean (21.82) which indicated character was
controlled by additive genes(Table 5). Therefore the selection based on this character would
be effective. Gaffar (2008) observed in broad sense heritability was high (94%) with moderate
genetic advance (7.81) for this character in sponge gourd. So selection based on this trait
would be effective.
4.2.4 Leaf breadth (cm)
This character showed high heritability (91.63) and moderate genetic advance (5.54) and
genetic advance in percent of mean (39.90) which indicated character was controlled by
additive genes (Table 5). Therefore the selection based on this character would be effective.
Gaffar (2008) observed in broad sense heritability was high (94%) with moderate genetic
advance (4.31) and genetic advance in percent of mean (21.82) which indicated character was
controlled by additive genes. Therefore the selection based on this character would be
effective.
4.2.5 Petiole length (cm)
The GCV and PCV were 38.39 % and 36.55 %, respectively. The PCV was very high to GCV
which indicated that there was highly environmental influence on the expression of this trait
(Table 5). The heritability in broad sense (h2b) for petiole length was high (90.62 %) with low
genetic advance (4.68 ) and genetic advance in percent of mean (71.67) was considerable for
this trait indicating apparent variation was due to genotypes. So selection based on this trait
would be effective. Gaffar (2008) found GCV and PCV were 17.12% and 36.68%; heritability
in broad sense (h2b) for petiole length was high (47%) with low genetic advance (1.77) and
GA in percent of mean is 16.47.
4.2.6 Days to first male flowering
The genotypic (78.07) and phenotypic (84.26) variances were very high and the GCV
(13.30%) and PCV (12.81%) were indicated high environmental effect upon the expression of
this trait (Table 5). Heritability (h2b) was high (92.65%). The genetic advance (17.52) and
genetic advance in percent of mean (25.39) was considerable for this trait indicating apparent
variation was due to genotypes. So selection based on this trait would be effective.

50
4.2.7 Days to first female flowering
Phenotypic variance (106.97) was moderately higher than genotypic variance (98.86). Also
narrow difference was observed between GCV (12.48%) and PCV (12.98%). Heritability was
high 92.42% (Table 5). The genetic advance (19.69) and genetic advance in percent of mean
(24.71) was considerable for this trait indicating apparent variation was due to genotypes.
Therefore, the plant breeder should select this trait for breeding purposes. The small difference
between GCV and PCV was observed in water melon by Rahman (2005). The genetic
advance Sharma and Dhankhar (1990) also (36.63) and found almost similar result genetic
advance in percent of mean (43.18) genotypes. So selection is considerable for this trait would
be effective. This result also findings of Rahman (2005).
4.2.8 Node number for first male flower
The genotypic variance and phenotypic variance were 34.62 and 35.95 respectively. The
difference between GCV (30.27%) and PCV (30.85%) was moderate which indicate that this
character was moderately influenced by environment on the expression of this character. The
heritability (h2b) was high 96.28% (Table 5). Saha et al. (1986) found significant difference in
node number for first male flowering in pumpkin genotypes. The genetic advance (11.89) and
genetic advance in percent of mean (61.18) was considerable for this trait indicating apparent
variation was due to genotypes. Gaffar (2008) also found genotypic variance and phenotypic
variance were 24.45 and 27.53, high 94%, difference between GCV (31.25%) and PCV
(3.16%). So selection based on this trait would be effective.
4.2.9 Node number for first female flower
The mean for this trait was 15.81. The genotypic variance (23.85) was moderately low than
phenotypic variance (25.58) as well as GCV (30.89%) was lower than PCV (31.99%)
indicating environmental influence on the expression of this trait. The heritability (h2b) for
this character was high (93.24%) (Table 5). The genetic advance (9.71) and genetic advance in
percent of mean (61.44) was considerable for this trait indicating apparent variation was due
to genotypes. Masud (1995) got the genetic advance (11.79) and genetic advance percent of
mean (58.88) was considerable for this trait indicating apparent variation. So, selection based
on this trait would be effective. This result also has the agreement with the findings of
Rahman (2005).

51
4.2.10 Sex ratio (male: female)
The genotypic variance (10.03) was lower than phenotypic variance (11.52) as well as the
PCV (12.78%) was, slightly higher than GCV (11.92%) and heritability (87.07). It indicated
that there was less environmental influence on the expression of this character (Table 5). The
genetic advance (6.09) and genetic advance in percent of mean is 22.92% showed apparent
variation. Selection based on this trait would be effective. These results are in agreement with
Bose and Som (1986), Rahman (2005) and Gaffar (2008).
4.2.11 Length of fruit (cm)
The GCV (24.04%) and PCV is (24.35%). It indicated that there was low environmental
influence on the expression of these traits. Heritability (h2b) was high (99%) (Table 5).
Rahman et al. (1986) reported similar result in bottle gourd. The genetic advance (18.27) and
genetic advance in percent of mean (63.78) was considerable for this trait indicating apparent
variation was due to genotypes. So selection based on this trait would be effective. This result
also has the agreement with the findings of Rahman (2005). Gaffar (2008) found GCV
(24.04%) and PCV (24.35%), high heritability (h2b) 99%.
4.2.12 Perimeter of fruit (cm)
The difference between GCV (31.10%) and PCV (32.92%) indicated the influence of
environment on expression of this trait. Heritability (h2b) was 89.26% (Table 5). Rahman et
al. (2005) reported almost similar result in sponge gourd. The genetic advance (8.00) and
genetic advance in percent of mean (60.53) was considerable for this trait indicating apparent
variation was due to genotypes. So selection based on this trait would be effective. This result
also has agreement with the findings of Rahman (2005).
4.2.13 Peduncle length (cm)
The genotypic variance was (9.98) and phenotypic variance was (10.44). The GCV and PCV
were (30.26%) and (30.95%), respectively. It indicated that there was very low environmental
influence on the expression of the traits (Table 5). The genetic advance (6.36), Heritability
(h2b) was high (95.58%) and genetic advance in percent of mean (58.53) was considerable for
this trait indicating apparent variation was due to genotypes. So selection based on this trait
would be effective. This result also has the agreement with the findings of Rahman (2005).
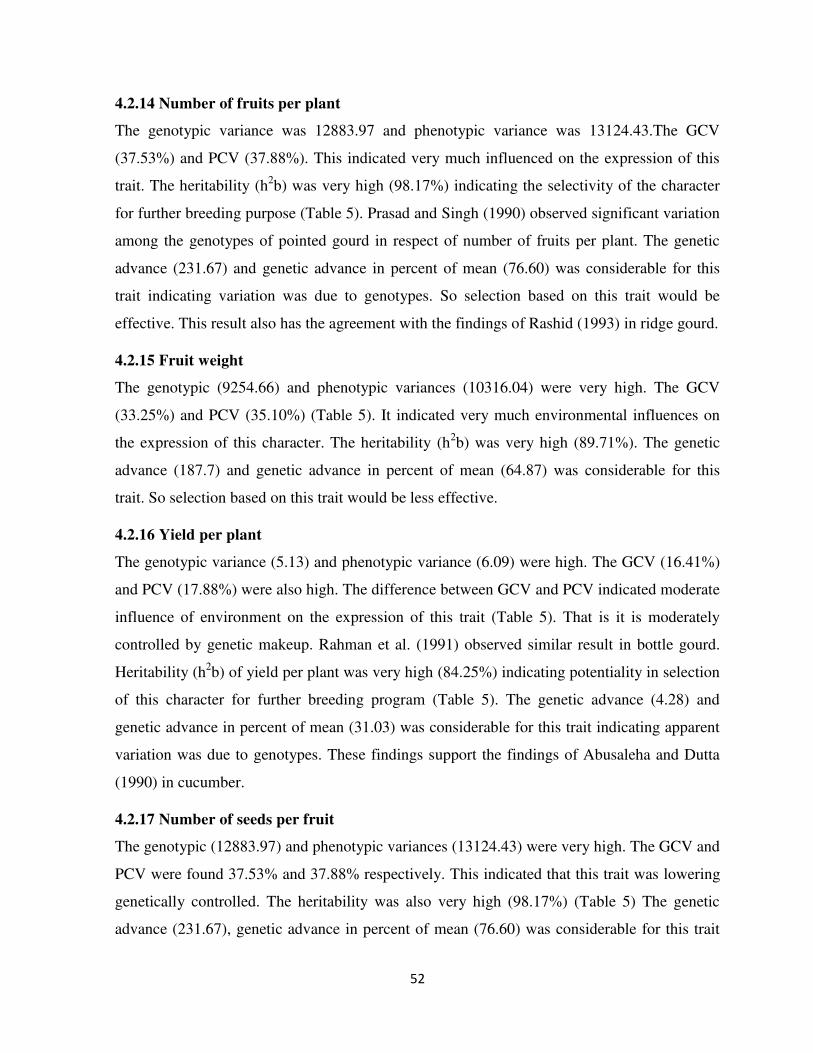
52
4.2.14 Number of fruits per plant
The genotypic variance was 12883.97 and phenotypic variance was 13124.43.The GCV
(37.53%) and PCV (37.88%). This indicated very much influenced on the expression of this
trait. The heritability (h2b) was very high (98.17%) indicating the selectivity of the character
for further breeding purpose (Table 5). Prasad and Singh (1990) observed significant variation
among the genotypes of pointed gourd in respect of number of fruits per plant. The genetic
advance (231.67) and genetic advance in percent of mean (76.60) was considerable for this
trait indicating variation was due to genotypes. So selection based on this trait would be
effective. This result also has the agreement with the findings of Rashid (1993) in ridge gourd.
4.2.15 Fruit weight
The genotypic (9254.66) and phenotypic variances (10316.04) were very high. The GCV
(33.25%) and PCV (35.10%) (Table 5). It indicated very much environmental influences on
the expression of this character. The heritability (h2b) was very high (89.71%). The genetic
advance (187.7) and genetic advance in percent of mean (64.87) was considerable for this
trait. So selection based on this trait would be less effective.
4.2.16 Yield per plant
The genotypic variance (5.13) and phenotypic variance (6.09) were high. The GCV (16.41%)
and PCV (17.88%) were also high. The difference between GCV and PCV indicated moderate
influence of environment on the expression of this trait (Table 5). That is it is moderately
controlled by genetic makeup. Rahman et al. (1991) observed similar result in bottle gourd.
Heritability (h2b) of yield per plant was very high (84.25%) indicating potentiality in selection
of this character for further breeding program (Table 5). The genetic advance (4.28) and
genetic advance in percent of mean (31.03) was considerable for this trait indicating apparent
variation was due to genotypes. These findings support the findings of Abusaleha and Dutta
(1990) in cucumber.
4.2.17 Number of seeds per fruit
The genotypic (12883.97) and phenotypic variances (13124.43) were very high. The GCV and
PCV were found 37.53% and 37.88% respectively. This indicated that this trait was lowering
genetically controlled. The heritability was also very high (98.17%) (Table 5) The genetic
advance (231.67), genetic advance in percent of mean (76.60) was considerable for this trait

53
indicating apparent variation was due to genotypes. Swamy et al. (1984) and Mannan (1992)
also reported wide variability in snake gourd, musk melon and bitter gourd.
4.2.18 Seed length
The genotypic variance (0.003) and phenotypic variance (0.007) were very low. The GCV
(4.62%) and PCV (7.06%) were low indicating this character was controlled by genetic
makeup. The estimated heritability was moderate (42.86%) (Table 5). The genetic advance
(0.07) and genetic advance in percent of mean (6.24%) was considerable for this trait
indicating apparent variation was due to genotypes.
4.2.19 Seed breadth
The genotypic and phenotypic variance were very low (0.004 and 0.006) with heritability
(64.71%). The GCV and PCV were low i.e. 9.49% and 11.80%, respectively (Table 5)
indicating very low environmental influence on this trait. The genetic advance (0.100) and
genetic advance in percent of mean (15.72) was considerable for apparent variation. Rahman
(2005) also reported wide variability among genotypes of sponge gourd.
4.2.20 Seed thickness
The genotypic and phenotypic variances were 0.001 and 0.002 respectively. The difference
between GCV (9.49%) and PCV (11.80%) were very high indicating this trait was genetically
controlled, Heritability (h2b) of this parameter was high (64.71%) (Table 5) The genetic
advance (0.100) and genetic advance in percent of mean (15.72) was considerable for this trait
indicating apparent variation was due to genotypes. Swamy et al. (1984) and Mannan (1992)
also reported wide variability among genotypes of snake gourd, musk melon and bitter gourd.
4.2.21 Hundred seed weight (g)
The genotypic (0.09) and phenotypic (0.14) variances were low. The GCV and PCV was
4.52% and 5.79%. Heritability in broad sense (61.02%) was low (Table 5). The differences
between GCV and PCV indicated low environmental influence on the expression of this trait
that was controlled genetically low 100 seed weight would be better for the purpose of
selecting a genotype in better trait. Varghese (1991) reported similar result in snake gourd.
The genetic advance (0.48) and genetic advance in percent of mean (7.27) was considerable
for this trait indicating apparent variation was due to genotypes.

54
4.3 Correlation Co-efficient
Yield is a character which depends upon several interdependent quantitative characters.
Selection for yield may not be effective unless the directly or indirectly influences of other
yield components are taken into consideration. When selection pressure is exercised for
improvement of any character highly associated with yield, it simultaneously affects a number
of other correlated traits. Hence knowledge regarding association of character with yield and
among themselves provides guidelines to the plant breeder for making improvement through
selection provide a clear understanding about the contribution in respect of establishing the
association by genetic and non genetic factors. Higher genotypic correlations than phenotypic
one might he due to modifying or masking effect of environment in the expression of the
character under study (Nandpuri et al. 1973). Results of genotypic and phenotypic correlation
co-efficient of yield and its contributing traits of sixteen genotype of sponge gourd were
estimated separately as vegetative character and reproductive character with yield is given
below (Table 6).
4.3.1 Days to first male flowering
The character showed highly significant and positive correlation with days to first female
flowering at phenotypic level (0.976) and phenotypic level (0.967) (Table 6). Fruit weight was
negatively correlated at genotypic (-0.442) and phenotypic (-0.438) level. Negative correlation
but insignificant was found with number of fruit per plant, node no. of 1st female flower, fruit
weight, 100 seed weight, seed breadth, yield per plant which suggest if days to first male
flowering increases this traits are decreased. Positive but insignificant correlation was found
with node no. of 1st male flower, perimeter of the fruit, number of seed per fruit, seed length
at genotypic level and at phenotypic level.
4.3.2 Days to first female flowering
Days to first female flowering showed significant and negative correlation with seed breadth
at genotypic level (-0.501) indicated that if days to first female flowering increases seed
breadth would be highly decreased (Table 6). Negative correlation were found with days to 1st
male flowering, node no. of 1st male flower, node no. of 1st female flower, number of fruit per
plant, fruit length, and perimeter of the fruit, fruit weight and yield per plant which suggested
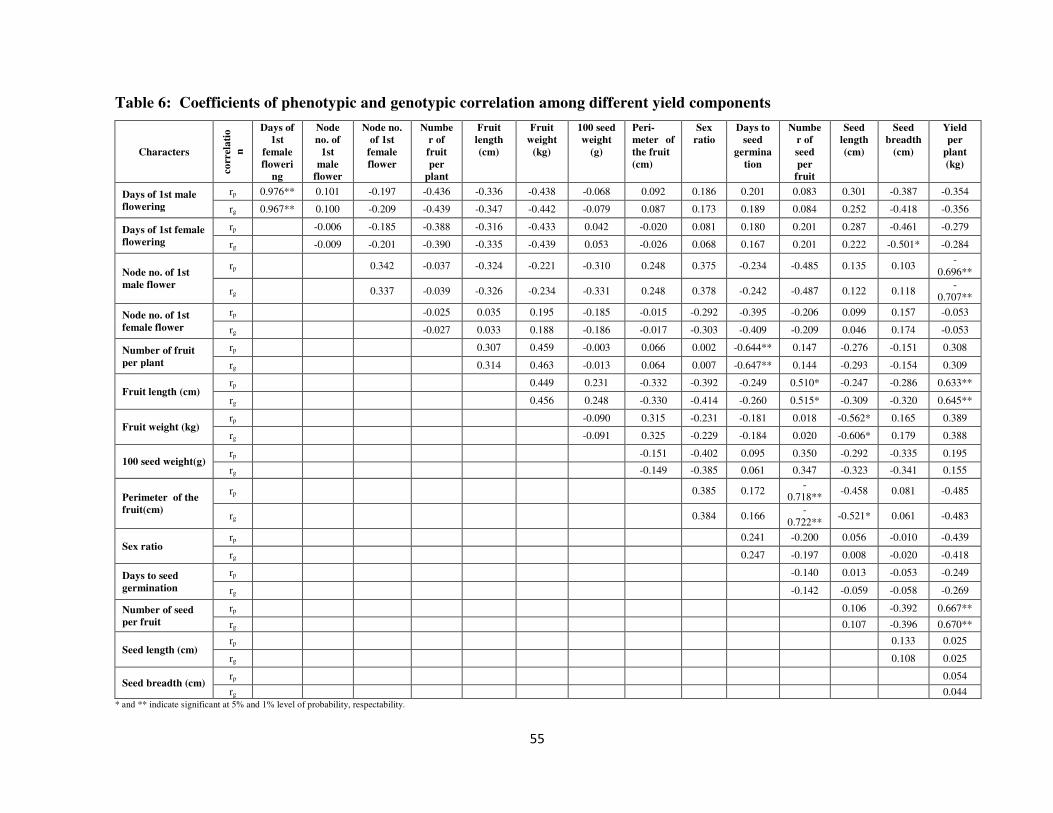
55
Table 6: Coefficients of phenotypic and genotypic correlation among different yield components
Characters
co
rrel
ati
o
n
Days of
1st
female
floweri
ng
Node
no. of
1st
male
flower
Node no.
of 1st
female
flower
Numbe
r of
fruit
per
plant
Fruit
length
(cm)
Fruit
weight
(kg)
100 seed
weight
(g)
Peri-
meter of
the fruit
(cm)
Sex
ratio
Days to
seed
germina
tion
Numbe
r of
seed
per
fruit
Seed
length
(cm)
Seed
breadth
(cm)
Yield
per
plant
(kg)
Days of 1st male
flowering
rp 0.976** 0.101 -0.197 -0.436 -0.336 -0.438 -0.068 0.092 0.186 0.201 0.083 0.301 -0.387 -0.354
rg 0.967** 0.100 -0.209 -0.439 -0.347 -0.442 -0.079 0.087 0.173 0.189 0.084 0.252 -0.418 -0.356
Days of 1st female
flowering
rp -0.006 -0.185 -0.388 -0.316 -0.433 0.042 -0.020 0.081 0.180 0.201 0.287 -0.461 -0.279
rg -0.009 -0.201 -0.390 -0.335 -0.439 0.053 -0.026 0.068 0.167 0.201 0.222 -0.501* -0.284
Node no. of 1st
male flower
rp 0.342 -0.037 -0.324 -0.221 -0.310 0.248 0.375 -0.234 -0.485 0.135 0.103 -
0.696**
rg 0.337 -0.039 -0.326 -0.234 -0.331 0.248 0.378 -0.242 -0.487 0.122 0.118 -
0.707**
Node no. of 1st
female flower
rp -0.025 0.035 0.195 -0.185 -0.015 -0.292 -0.395 -0.206 0.099 0.157 -0.053
rg -0.027 0.033 0.188 -0.186 -0.017 -0.303 -0.409 -0.209 0.046 0.174 -0.053
Number of fruit
per plant
rp 0.307 0.459 -0.003 0.066 0.002 -0.644** 0.147 -0.276 -0.151 0.308
rg 0.314 0.463 -0.013 0.064 0.007 -0.647** 0.144 -0.293 -0.154 0.309
Fruit length (cm) rp 0.449 0.231 -0.332 -0.392 -0.249 0.510* -0.247 -0.286 0.633**
rg 0.456 0.248 -0.330 -0.414 -0.260 0.515* -0.309 -0.320 0.645**
Fruit weight (kg) rp -0.090 0.315 -0.231 -0.181 0.018 -0.562* 0.165 0.389
rg -0.091 0.325 -0.229 -0.184 0.020 -0.606* 0.179 0.388
100 seed weight(g) rp -0.151 -0.402 0.095 0.350 -0.292 -0.335 0.195
rg -0.149 -0.385 0.061 0.347 -0.323 -0.341 0.155
Perimeter of the
fruit(cm)
rp 0.385 0.172 -
0.718** -0.458 0.081 -0.485
rg 0.384 0.166 -
0.722** -0.521* 0.061 -0.483
Sex ratio rp 0.241 -0.200 0.056 -0.010 -0.439
rg 0.247 -0.197 0.008 -0.020 -0.418
Days to seed
germination
rp -0.140 0.013 -0.053 -0.249
rg -0.142 -0.059 -0.058 -0.269
Number of seed
per fruit
rp 0.106 -0.392 0.667**
rg 0.107 -0.396 0.670**
Seed length (cm) rp 0.133 0.025
rg 0.108 0.025
Seed breadth (cm) rp 0.054
rg 0.044
* and ** indicate significant at 5% and 1% level of probability, respectability.

56
that days to first female flowering increases the number of fruit per plant decreased. Positive
association was found 100 seed weight, sex ratio, and days to seed germination, number of
seed per fruit, seed length and seed breadth both genotypic level and at phenotypic level. Khan
et al. (2009) reported the similar result.
4.3.3. Node number of 1
st male flower
Positive and highly significant correlation was found with yield per plant at both genotypic
(0.707) and phenotypic (0.696) level indicating if node number of 1st
male flower increases
yield per plant may increase. It also showed positive correlation with seed length, seed breath,
and perimeter of the fruit. It showed negative correlation with number of fruit per plant, fruit
length, and fruit weight, 100 seed weight at genotypic and phenotypic level. Narayankutty et
al. (2006) reported that yield is strongly correlated with fruit breadth in snake gourd. Khan et
al. (2009) found fruit breadth is positively correlated with fruit weight.
4.3.4. Node number of 1
st female flower
Positive but insignificant correlation was found with fruit length , fruit weight seed length,
seed breadth at both genotypic (0.035, 0.195, 0.099, 0.157) and phenotypic (0.033, 0.188,
0.046, 0.174) level indicating if node number of 1st
female flower may increase number of
fruit length, fruit weight seed length, seed breadth. It showed negative and insignificant
correlation with number of fruit per plant, hundred seed weight, perimeter of the fruit, sex
ratio, days to seed germination, number of seed per fruit and yield per plant at genotypic and
phenotypic level.
4.3.5. Number of fruit per plant
The character showed highly significant and negative correlation with days to seed
germination at both genotypic (-0.647) and phenotypic (-0.644) level indicated that the traits
were governed by same gene and simultaneous improvement would be effective. Number of
fruit per plant was positively correlated at genotypic and phenotypic level indicating
correlation with days of 1st female flowering, node no. of 1st male flower, node no. of 1st
female flower, number of fruit per plant, fruit length, fruit weight, perimeter of the fruit, sex
ratio, number of seed per fruit and yield per plant which indicates that number of fruit per
plant would be increased if these parameter increased. Negative but insignificant correlation

57
was found with seed length and seed breadth which suggests if fruit diameter increases
number of fruit per plant decreased.
4.3.6 Fruit length (cm)
Fruit length showed positive and highly significant correlation with yield per plant (0.633 and
0.645) and number of seed per fruit showed significant correlation (0.510 and 0.515) at both
genotypic and phenotypic level indicating if fruit length increased yield per plant and number
of seed per fruit would be highly increased (Table 6). Fruit length was positively correlated
with fruit weight and hundred seed weight at both genotypic and phenotypic level indicating if
fruit length increased fruit weight would be increased. It showed negative correlation with
seed length, perimeter of the fruit, sex ratio, days to seed germination and seed breadth at both
genotypic and phenotypic level. Narayankutty et al. (2006) reported that yield is strongly
correlated with fruit length in snake gourd. Chowdhury and Sarma (2002) studied Luffa
acutangula cultivars and observed that yield per hectare can be improved through selection of
fruit length.
4.3.7 Fruit weight (kg)
Fruit weight showed positive correlation with perimeter of the fruit, seed breadth and yield per
plant at both genotypic and phenotypic level (Table 6) indicated that if fruit weight increased,
then the seed length and breadth also increased. It showed negative correlation with sex ratio,
hundred seed weight and days to seed germination. But it showed negative and significant
correlation with seed length at both genotypic ( -0.606) and phenotypic level (-0.562) which
indicates that if fruit weight increased fruit length would be decreased. Narayankutty et al.
(2006) reported that yield is strongly correlated with fruit weight in snake gourd. Khan et al.
(2009) also found fruit weight has positive high correlation with yield. Husna (2009) also
found similar result in bottle gourd. Chowdhury and Sarma (2002) studied on Luffa
acutangula cultivars and observed that yield per hectare can be improved through selection of
individual fruit weight. Prasana et al. (2002) found in ridge gourd (Luffa acutatigula) fruit
yield per hectare was positively associated with fruit weight. Kumaresan et al. (2006) yield
per vine in snake gourd was positively associated with fruit weight.
4.3.8 Hundred seed weight
100 seed weight showed positive correlation with yield per plant (0.155 and 0.195), days to
58
seed germination (0.061 and 0.095) and number of seed per fruit (0.347 and 0.350) at both
genotypic and phenotypic level indicated that if 100 seed weight increases fruit yield per plant
would be highly increased. It showed negative correlation with seed length, seed breadth and
perimeter of the fruit (Table 6).
4.3.9 Perimeter of the fruit (cm)
Negative and highly significant correlation was found with number of seed per fruit at both
genotypic (-0.722) and phenotypic (-0.718) level indicating perimeter of fruit may decrease if
number of seed per fruit increased. It showed positive correlation with seed breadth, days to
germination and sex ratio. It showed negative correlation with yield per plant (-0.485 and -
0.483). But it showed negative and significant correlation with seed length at genotypic level
(-0.521). Narayankutty et al. (2006) reported that yield is strongly correlated with fruit breadth
in snake gourd. Khan et al. (2009) found fruit breadth is positively correlated with fruit
weight.
4.3.10 Sex ratio
Sex ratio or ratio of male and female flower showed positive correlation with days to seed
germination (0.247 and 0.241) and seed length (0.008 and 0.056) at both genotypic and
phenotypic level indicated that if sex ratio or ratio of male and female flower increases fruit
days to seed germination and seed length would be increased (Table 6). Negative correlation
was found with seed breadth, yield per plant and number of seed per plant which suggested
that if seed breadth, yield per plant and number of seed per plant increase the sex ratio or ratio
of male and female flower decreased. Khan et al. (2009) reported the similar result.
4.3.11 Days to seed germination
Days to seed germination showed negative correlation with yield per plant at both genotypic (-
0.269) and phenotypic (-0.249) level indicated that if days to germination increases fruit yield
per plant would be decreased (Table 6). Negative correlation was found with seed breadth
which suggested that if days to germination increases seed breadth decreased. Positive
association was found with seed length only in genotypic level.
4.3.12 No. of seed per fruit
No. of seed per fruit showed positive and highly significant correlation with yield per plant at
both genotypic (0.670) and phenotypic (0.667) level indicated that if no. of seed per fruit
59
yield per plant would be highly increased (Table 6).
4.3.13 Seed length (cm)
Positive correlation was found with seed breadth ( 0.108 and 0.133), yield per plant ( 0.025
and 0.025) at both genotypic and phenotypic level indicating if seed length increased seed
breadth, yield per plant also increased (Table 6).
4.3.14 Seed breadth (cm)
Positive and insignificant correlation was found with yield per plant at both genotypic ( 0.044)
and phenotypic ( 0.054) level indicating if seed breadth increased may yield per plant may
also decreased. It showed positive and significant correlation with number of seed per plant at
genotypic and phenotypic level (Table 6).
4.4 Path Analysis
Association of character determined by correlation co-efficient may not provide an exact
picture of the relative importance of direct and indirect influence of each of yield components
on seed yield per hector. In order to find out a clear picture of the inter-relationship between
yield per plant and other yield attributes, direct and indirect effects were worked out using
path analysis at phenotypic level which also measured the relative importance of each
component. Estimation of direct and indirect phenotypic and genotypic effect of path co-
efficient analysis of sponge gourd is presented in Table7 and Table 8 respectively.
4.4.1 Days to first male flowering
Days to first male flowering showed a positive direct genotypic effect (0.435) on yield (Table
7). This character showed highest negative indirect effect through days of first female
flowering (-1.03). It also showed negative indirect character via fruit weight (-0.143), days to
germination (-0.138), node number of first male flower (-0.066), fruit perimeter (-0.0026), sex
ratio (-0.006).Node number of first female flower (0.044), number of fruit per plant (0.261),
100 seed weight (0.013), fruit length (0.079), seed length (0.018), seed breadth (0.140),
number of seed per fruit (0.038) showed positive effect for genotypic effect which were
contributed to result insignificant positive phenotypic correlation with yield per plant (0.206)
showing in Table 8. Lie et al. (1997) also found similar result in cucumber for their trait.

60
Table 7. Partitioning of genotypic into direct and indirect effects of morphological characters of 16 sponge gourd genotypes
by path coefficient analysis
Characters Days of
1st
male
floweri
-ng
Days of
1st
female
flowerin
g
Node
no. of
1st
male
flower
Node
no. of
1st
female
flower
Number
of fruit
per
plant
Fruit
length
(cm)
Fruit
weigh
t (kg)
100
seed
weight
(g)
Perimeter
of the
fruit (cm)
Sex
ratio
Days
to seed
germi
nation
Numbe
r of
seed
per
fruit
Seed
length
(cm)
Seed
breadth
(cm)
Yield
per
plant
(kg)
Days of 1st
male
flowering
0.435 -1.03 -0.066 0.044 0.261 0.079 -0.143 0.013 -0.0026 -
0.006 -0.138 0.038 0.018 0.140 -0.356
Days of 1st
female
flowering
0.420 -1.06 0.006 0.042 0.232 0.0759 -0.142 -0.008 0.0008
-
0.002
3
-0.123 0.092 0.016 0.168 -0.284
Node no. of
1st male
flower
0.043 0.010 -0.668 -0.071 0.023 0.073 -0.075 0.053 -0.008 -
0.013 0.178 -0.222 0.009 -0.039 -0.707**
Node no. of
1st female
flower -0.091 0.213 -0.225 -0.209 0.016 -0.007 0.061 0.029 0.0005 0.010 0.300 -0.095 0.0032 -0.058 -0.053
Number of
fruit per
plant
-0.191 0.414 0.026 0.006 -0.595 -0.071 0.149 0.0021 -0.0019
-
0.000
2
0.475 0.065 -0.021 0.052 0.309
Fruit length
(cm) -0.151 0.356 0.218
-
0.0069 -0.187 -0.227 0.147 -0.039 0.010 0.014 0.191 0.235 -0.022 0.108 0.645**
Fruit weight
(kg) -0.192 0.466 0.156
0-
0.039 -0.276 -0.103 0.322 0.015 -0.010 0.008 0.135 0.0091 -0.042 -0.060 0.388
100 seed
weight(g) -0.034 -0.056 0.221 0.039 0.0078 -0.056 -0.029 -0.159 0.0046 0.013 -0.045 0.158 -0.023 0.115 0.155
Perimeter of
the fruit(cm) 0.038 0.028 -0.166 0.004 -0.038 0.075 0.105 0.024 -0.031
-
0.013 -0.122 -0.328 -0.037 -0.021 -0.483
Sex ratio 0.075 -0.072 -0.252 0.064 -0.004 0.094 -0.074 0.061 -0.012
-
0.034 -0.181 -0.089 0.0006 0.007 -0.418
Days to seed
germination 0.082 -0.177 0.162 0.086 0.385 0.059 -0.059 -0.009 -0.005
-
0.008 -0.734 -0.065 -0.004 0.019 -0.269
Number of
seed per fruit 0.037 -0.214 0.325 0.044 -0.086 -0.117 0.006 -0.055 0.022 0.007 0.104 0.455 0.008 0.133 0.670**
Seed
length(cm) 0.109 -0.236 -0.081 -0.009 0.175 0.070 -0.195 0.052 0.016
-
0.000
3
0.043 0.049 0.070 -0.036 0.025
Seed breadth
(cm) -0.182 0.532 -0.079 -0.037 0.092 0.073 0.058 0.054 -0.002
0.000
6 0.042 -0.180 0.008 -0.336 0.044
Residual effect = 0.0810

61
Table 8. Partitioning of phenotypic into direct and indirect effects of morphological characters of 16 sponge gourd
genotypes by path coefficient analysis Characters Days of
1st male
flowering
Days of
1st
female
flowering
Node
no. of
1st
male
flower
Node no.
of 1st
female
flower
Numbe
r of
fruit
per
plant
Fruit
length
(cm)
Fruit
weigh
t (kg)
100
seed
weight
(g)
Perimet
er of
the
fruit(c
m)
Sex
ratio
Days
to
seed
germi
nation
Numb
er of
seed
per
fruit
Seed
lengt
h
(cm)
Seed
bread
th
(cm)
Yield
per
plant
(kg)
Days of 1st
male flowering 0.206 -0.561 -0.040 -0.046 -0.023 -0.057 0.069 0.011 0.053
-
0.062 -0.018 0.077 0.077 -0.082 -0.354
Days of 1st
female
flowering
0.201 -0.575 0.0023 -0.0043 -0.020 -0.053 0.069 -
0.0067 -0.011
-
0.027 -0.016 0.187 0.074 -0.098 -0.279
Node no. of 1st
male flower 0.021 0.0034 -0.398 0.0079 -0.0019 -0.055 0.035 0.049 0.143 -
0.126 0.021 -0.452 0.035 0.022
-
0.696*
*
Node no. of 1st
female flower -0.041 0.106 -0.136 0.023 -0.0013 0.0059 -
0.031 0.029 -0.009 0.098 0.035 -0.192 0.025 0.033 -0.053
Number of
fruit per plant -0.089 0.223 0.015 -0.0006 0.052 0.052 -
0.073 0.0005 0.038
-
0.000
7
0.057 0.137 -
0.071 -0.032 0.308
Fruit length
(cm) -0.069 0.182 0.129 0.0008 0.016 0.169
-
0.071 -0.037 -0.191 0.131 0.022 0.475
-
0.064 -0.060
0.633*
*
Fruit weight
(kg) -0.090 0.249 0.088 0.0045 0.024 0.076
-
0.159 0.014 0.181 0.077 0.016 0.017
-
0.144 0.035 0.389
100 seed
weight(g) -0.014 -0.024 0.123 -0.004 -0.0002 0.039 0.014 -0.159 -0.087 0.135 -0.008 0.326
-
0.075 -0.071 0.195
Perimeter of
the fruit(cm) 0.019 0.012 -0.098 -0.0004 0.003 -0.056
-
0.050 0.024 0.576
-
0.129 -0.015 -0.668
-
0.118 0.017 -0.485
Sex ratio 0.038 -0.046 -0.149 -0.0068 0.0001 -0.066 0.037 0.064 0.222
-
0.335 -0.021 -0.186 0.014 -0.002 -0.439
Days to seed
germination 0.041 -0.104 0.093 -0.009 -0.034 -0.042 0.028 -0.015 0.099 -
0.081 -0.088 -0.130 0.003 -0.011 -0.249
Number of
seed per fruit 0.017 -0.116 0.193 -0.005 0.008 0.086
-
0.002
9
-0.055 -0.414 0.067 0.012 0.931 0.027 -0.083 0.667*
*
Seed
length(cm) 0.062 -0.165 -0.054 0.0023 -0.014 -0.042 0.089 0.046 -0.264
-
0.019
-
0.0011 0.099 0.257 0.028 0.025
Seed breadth
(cm) -0.079 0.265 -0.041 0.004 -0.008 -0.048 -
0.026 0.053 0.047 0.003 0.0047 -0.365 0.034 0.211 0.054
Residual effect = 0.0769

62
4.4.2 Days to first female flowering
The character showed a negative direct phenotypic effect (-0.575) on yield (Table 8). Days to
first female flowering showed negative indirect effect on number of fruit per plant (-0.020),
number of seed per fruit (-0.054), node number of first female flower (0.0043), fruit perimeter
(-0.011), fruit length (-0.053), sex ratio (-0.027), seed breadth (-0.098), 100 seed weight (-
0.0067), yield per plant (-0.279). It showed positive indirect effect to first male flowering
(0.201), node number of first male flower (0.0023), seed length (0.074), which finally
produced a negative insignificant genotypic direct correlation with yield (-1.06) showing in
Table 7.
4.4.3 Node number of first male flowering
Node number of first male flowering showed negative and insignificant direct phenotypic
effect (-0.398) on yield (Table 8). The character showed highest positive indirect effect via
days to first male flowering (0.043) followed by fruit weight (0.102), days to germination
(0.178), 100 seed weight (0.053), fruit length (0.073), seed length (0.009), and number of fruit
per plant (0.023), days to first female flowering (0.010), and yield per plant (0.092). The
negative indirect effect via sex ratio (-0.013), fruit perimeter (-0.008), number of seed per fruit
(-0.222), fruit weight (-0.075) which finally produced a negative and insignificant
genotypic correlation with yield (-0.668) showing in Table 7.
4.4.4 Node number of first female flowering
Node number of first female flowering showed positive and insignificant direct phenotypic
effect (0.023) on yield (Table 8). The character showed highest positive indirect effect via sex
ratio (0.098) followed by fruit length (0.0059), days to germination (0.035), 100 seed weight
(0.029), days to first female flowering (0.106), days to first female flowering (0.106), seed
length (0.025), seed breadth (0.033).It showed negative significant indirect effect via yield per
plant (-0.053), number of fruit per plant (-0.0013), fruit perimeter (-0.009). It also showed
negative correlation via first male flowering (-0.041), number of seed per fruit (-0.192), fruit
weight (-0.031) through which finally produced a negative insignificant genotypic
correlation with yield (-0.209) showing in Table 7.

63
4.4.5 Number of fruit per plant
Number of fruit per plant showed positive direct phenotypic effect (0.052) on yield. The
showed highest positive indirect effect via yield per plant (0.308) followed by fruit length
(0.052), days to first female flowering (0.223), 100 seed weight (0.0005), fruit perimeter
(0.038), and days to germination (0.057). It also showed the negative indirect effect via days
to first male flowering (-0.089), seed length (-0.071), sex ratio (-0.0007), seed breadth (-
0.032), fruit weight (-0.073) through which finally produced a direct negative insignificant
genotypic correlation with yield (-0.595) showing in Table 7.
4.4.6 Fruit length (cm)
Fruit length showed positive direct phenotypic effect (0.169) on yield (Table 8). The character
showed highest positive and significant indirect effect via yield per plant (0.633) followed by
days to germination (0.022), days to first female flowering (0.182), number of seed per fruit
(0.475), number of fruit per plant (0.016), sex ratio (0.131). The character also produced
negative indirect effect on yield through days to first male flowering (-0.069), 100 seed weight
(-0.037), fruit perimeter (-0.191), seed length (-0.064), fruit weight (-0.071). The cumulative
effect produced a highly insignificant negative genotypic correlation with yield (-0.227)
showing in Table 7.
4.4.7 Fruit weight (kg)
Fruit weight showed negative direct phenotypic effect (-0.159) on yield (Table 8). The
character showed highest positive indirect effect via yield per plant (0.389) followed by days
to first female flowering (0.249), fruit length (0.076), seed breadth (0.035), node number of
first male flower (0.088), number of seed per fruit (0.017) and sex ratio (0.077). It showed the
negative indirect effect via seed length (-0.144), days to first male flowering (-0.090) through
which finally produced a negative insignificant genotypic correlation with yield (0.322)
showing in Table 7. Husna (2009) also found negative direct phenotypic effect of fruit weight
on yield. Kumaresan et al. (2006) conducted an experiment in snake gourd and path
coefficient analysis revealed that it would be highly rewarding to lay emphasis on the number
of fruit per vine and fruit weight to increase the yield per vine directly.
4.4.8 Hundred seed weight (g)
100 seed weight showed a positive direct effect (-0.159) on yield (Table 8). It showed high

64
positive indirect effect on number of fruit per plant (0.326), node number of first male flower
(0.123), node number of first female flower (-0.004), days to first female flowering (-0.024),
fruit length (0.039), seed breadth (-0.071), yield per plant (0.195), fruit perimeter (-0.087),
fruit weight (0.014), seed length (-0.075). The negative indirect character via days of first
male flowering (-0.014), node number of first female flower (-0.004), days to germination (-
0.008), seed breadth (-0.071) which finally produced a positive but insignificant genotypic
correlation with yield (-0.159) showing in Table 7.
4.4.9 Perimeter of fruit (cm)
Fruit perimeter showed negative direct genotypic effect (-0.031) on yield (Table 7). The
character showed highest negative indirect genotypic effect on yield per plant (-0.483)
followed by number of fruit per plant (-0.038), days to seed germination (-0.122), number of
seed per fruit (-0.328), sex ratio (-0.013), seed length (-0.037), seed breadth (-0.021). The
character also produced positive indirect genotypic effect on yield through days to first male
flowering (0.038), days to first female flowering (0.028), node number of first female flower
(0.004), fruit length (0.075) and fruit weight (0.105) which finally produced a positive
phenotypic insignificant yield (0.576) showing in Table 8.
4.4.10 Sex ratio
The character showed a negative direct phenotypic effect (-0.335) on yield (Table 8). Sex ratio
or ratio of male and female flower showed highest positive indirect effect on fruit perimeter
(0.222) followed by number of fruit per plant (0.0001), seed length (0.014), 100 seed weight
(0.064) and days of first male flower (0.038). The negative indirect character via fruit length (-
0.066), seed breadth (-0.002), number of seed per fruit (-0.186), days to first female flowering
(-0.046), node number of first male flower (-0.149), node number of first female flower (-
0.0068) and yield per plant (-0.439) which finally produced a positive significant genotypic
correlation with yield (-0.034) showing in Table 7.
4.4.11 Days to seed germination
Days to seed germination showed negative direct phenotypic effect (-0.088) on yield (Table
8). The character showed highest positive indirect effect via fruit diameter (0.099) followed by
days to first male flowering (0.041), seed length (0.003), node number of first male flower
(0.093). It also showed highly insignificant negative indirect effect on yield per plant (-0.249).

65
The negative indirect character via days of first female flowering (-0.104), number of seed per
fruit (-0.130), 100 seed weight (-0.015) seed breadth (-0.011), sex ratio (-0.081), node number
of first female flower (-0.009) also found through which finally produced a negative
insignificant genotypic correlation with yield (-0.734) showing in Table 7.
4.4.12 No. seed per fruit
No. seed per fruit the character showed a positive direct phenotypic effect (0.931) on yield
(Table 8). It showed highest positive indirect effect on node number of first male flower
(0.193), fruit length (0.086), and seed length (0.027). Yield per plant (0.667) showed a highly
positive significant effect on number of seed per fruit. The negative indirect character via fruit
perimeter (-0.414), node number of first female flower (-0.005), seed breadth (-0.083), 100
seed weight (-0.055), fruit weight (-0.0029) and days to first female flowering (-0.116) also
which finally produced a positive but insignificant genotypic correlation with yield (0.455)
showing in Table 7.
4.4.13 Seed length (cm)
Fruit weight showed positive direct phenotypic effect (0.257) on yield (Table 8). The
character showed highest positive indirect effect via Number of seed per fruit (0.099)
followed by seed breadth (0.028), days of first male flower (0.062), yield per plant (0.025).
The negative indirect effect found in fruit length (-0.042), number of fruit per plant (-0.014),
node number of first male flower (-0.054), days to first female flowering (-0.165), node no. of
first female flower (-0.165) and sex ratio (-0.019) through which finally produced a positive
insignificant genotypic correlation with yield (0.070) showing in Table 7.
4.4.14 Seed breadth (cm)
The character showed positive direct phenotypic effect (0.211) on yield (Table 8) and highest
positive indirect effect on days of first female flowering (0.265) followed by fruit diameter
(0.047), seed length (0.034), days to germination (0.0047), node number of first female flower
(0.004), yield per plant (0.054) and 100 seed weight (0.053) . The negative indirect character
via fruit length (-0.048), days of first male flowering (-0.079), number of fruit per plant (-
0.008), node number of first male flower (-0.041), no. of seed per fruit (-0.365), number of
seed per fruit (-0.365) and days of first male flower (-0.079), which finally produced a
negative insignificant genotypic correlation with yield (-0.336) showing in Table 7.

66
4.5 Diversity of the Sponge gourd Genotypes
By using GENSTAT software programme genetic divergence in Sponge gourd was analyzed.
Genetic diversity analysis involved several steps i.e., estimation of distance between the
genotypes, Clusters and analysis of inter-Cluster distance. Therefore, more than one
multivariate technique was required to represent the results more clearly and it was obvious
from the results of many researchers (Bashar, 2002; Uddin, 2001; Juned et al., 1988 and Ario,
1987).
4.5.1 Construction of scatter diagram
In multivariate analysis, Cluster analysis refers to methods used to divide up objects into
similar groups, or more precisely, groups whose members are all close to one another on
various dimensions being measured. Depending on the values of principal component scores 2
and 1 obtained from the principal component analysis, a two dimensional scatter diagram (Z1
- Z2) using component score 1 as X-axis and component score 2 as Y-axis was constructed,
which has been presented in Figure 4. The position of the genotypes in the scatter diagram
was apparently distributed into five groups, which indicated that there existed considerable
diversity among the genotypes.
4.5.2 Principal component analysis
From the correlation matrix from genotype scores obtained from first components and
succeeding components with latent roots greater than the unity principal components were
computed. Contribution of different morphological characters towards divergence were
discussed from the latent the vectors of the first two principal components. The principal
component analysis yielded eigen values of each principal component axes with the first axes
totally accounting for the variation among the genotypes is 27.635, while two of these with
Eigen values above unity accounted for 47.248% (Table 9). The first three principal axes
accounted for 59.994% of the total variation among the 10 characters describing 16 sponge
gourd genotypes.
Based on principal component axes I and II, a two dimensional chart (Z1 - Z2) of the cultivars
are presented in Figure 4. The scatter diagram revealed that apparently there were mainly five
clusters. The genotypes were distantly located from each other.

67
Table 9. Eigen value, % variance and cumulative (%) total variance of the principal
components
Principle Component
Axes Eigen value % Variance
Cumulative (%)
total variance
I 4.145 27.635 27.635
II 2.942 19.614 47.248
III 1.912 12.746 59.994
IV 1.667 11.114 71.109
V 1.208 8.054 79.162
VI 0.906 6.043 85.205
VII 0.742 4.947 90.152
VII 0.465 3.102 93.254
IX 0.414 2.757 96.011
X 0.278 1.851 97.862
XI 0.253 1.684 99.546
XII 0.040 0.266 99.812
XIII 0.024 0.163 99.975
XIV 0.004 0.025 100.000
XV 0.000 0.000 100.000

68
Figure 4. Scatter diagram of 16 sponge gourd genotypes of based on their principal
component scores
PCA SCORE-1
G3
G1G12
G16
G4G11
G2
G15
G8 G10
G9
G6
G5
G14
G13
G7
-4
-3
-2
-1
0
1
2
3
4
-6-4-20246
PC
A S
CO
RE
-2
Cluster I
Cluster II
Cluster III
Cluster IV
Cluster V

69
In 1984 Balasch et al. use the comparison of different multivariate techniques in classifying
some important number of tomato lines. It was marked that three methods gave similar results.
But factorial discriminate and Mahalanobis's D2 distance methods required collecting data
plant by plant, while the PCA method required taking data by plots.
Out of five clusters, cluster I was associated with three genotypes namely G1, G2 and G12
(Table 10). From the clustering mean values (Table 11), it was observed that cluster I
produced the highest mean for fruit weight (265.67) followed by number of seed per fruit
(161.67), and days of 1st female flowering similar findings were mentioned by Gaffar (2008).
The lowest mean value was for the seed breadth cluster I (0.64).
Cluster II was associated with six genotypes namely G3, G6, G7, G8, G15 and G16 (Table 10).
These genotypes produced the highest mean for number of seed per fruit (325.83), fruit weight
(294.52) and days of 1st female flowering (75.50). Similar findings were mentioned by Gaffar
(2008). The lowest mean value for cluster II (0.66) was the Seed breadth (Table 11). Among
the five clusters, cluster III composed of five genotypes. The genotypes were G4, G9, G11, G13
and G14 (Table 10). In cluster III the highest mean is for number of seed per fruit (364.40),
fruit weight (232.34) and days of 1st female flowering (89.40). Similar findings were
mentioned by Gaffar (2008). The lowest mean value for cluster III (0.60) was the seed breadth
(Table 11). Cluster IV consists of one genotypes G5 (Table 10). From the clustering mean
values (Table 11) it was observed that cluster IV produced the highest mean values fruit
weight (413.00), number of seed per fruit (127.00) and for days to 1st female flowering. The
lowest mean value for cluster IV (0.80) was the seed breadth.
Cluster V constituted with one genotype G10 (Table 10). In cluster-V the highest mean for
fruit weight (491.00) followed by number of seed per fruit (450.00), and days of 1st female
flowering. However, the lowest mean value for cluster V (0.55) was the seed breadth
(Table11).
Joshi et al. (2003) assessed the nature and magnitude of genetic divergence using non-
hierarchical Euclidean cluster analysis in 73 tomato genotypes of diverse origin for different
quantitative and qualitative traits. Maximum value of coefficient of variability (53.208) was
recorded for shelf life of fruits where minimum is 69.208 for days to first picking. The
grouping of the genotypes into 16 clusters indicated the presence genetic diversity.

70
Table 10. Number, percent and name of genotypes in different cluster
Cluster
number
Number of
genotypes Percent (%) Name of genotypes
I 3 18.75 G1, G2 and G12
II 6 37.50 G3, G6, G7, G8, G15 and G16
III 5 31.25 G4, G9, G11, G13 and G14
IV 1 6.25 G5
V 1 6.25 G10
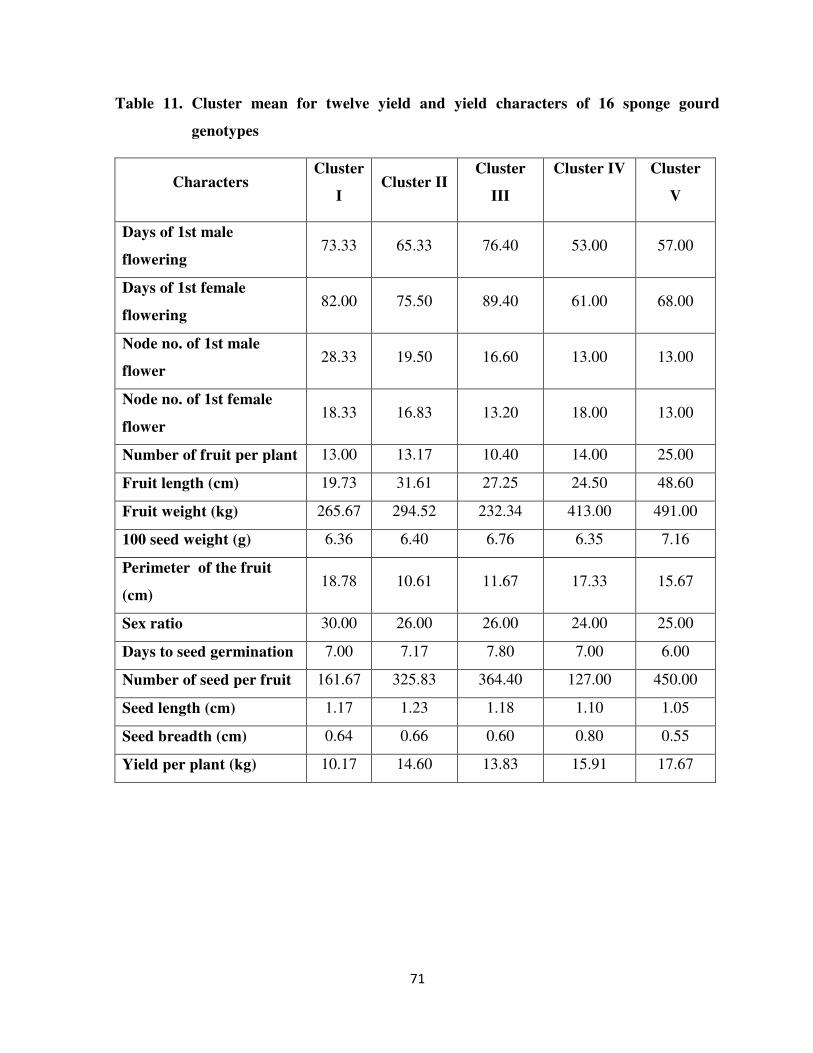
71
Table 11. Cluster mean for twelve yield and yield characters of 16 sponge gourd
genotypes
Characters Cluster
I Cluster II
Cluster
III
Cluster IV Cluster
V
Days of 1st male
flowering 73.33 65.33 76.40 53.00 57.00
Days of 1st female
flowering 82.00 75.50 89.40 61.00 68.00
Node no. of 1st male
flower 28.33 19.50 16.60 13.00 13.00
Node no. of 1st female
flower 18.33 16.83 13.20 18.00 13.00
Number of fruit per plant 13.00 13.17 10.40 14.00 25.00
Fruit length (cm) 19.73 31.61 27.25 24.50 48.60
Fruit weight (kg) 265.67 294.52 232.34 413.00 491.00
100 seed weight (g) 6.36 6.40 6.76 6.35 7.16
Perimeter of the fruit
(cm) 18.78 10.61 11.67 17.33 15.67
Sex ratio 30.00 26.00 26.00 24.00 25.00
Days to seed germination 7.00 7.17 7.80 7.00 6.00
Number of seed per fruit 161.67 325.83 364.40 127.00 450.00
Seed length (cm) 1.17 1.23 1.18 1.10 1.05
Seed breadth (cm) 0.64 0.66 0.60 0.80 0.55
Yield per plant (kg) 10.17 14.60 13.83 15.91 17.67
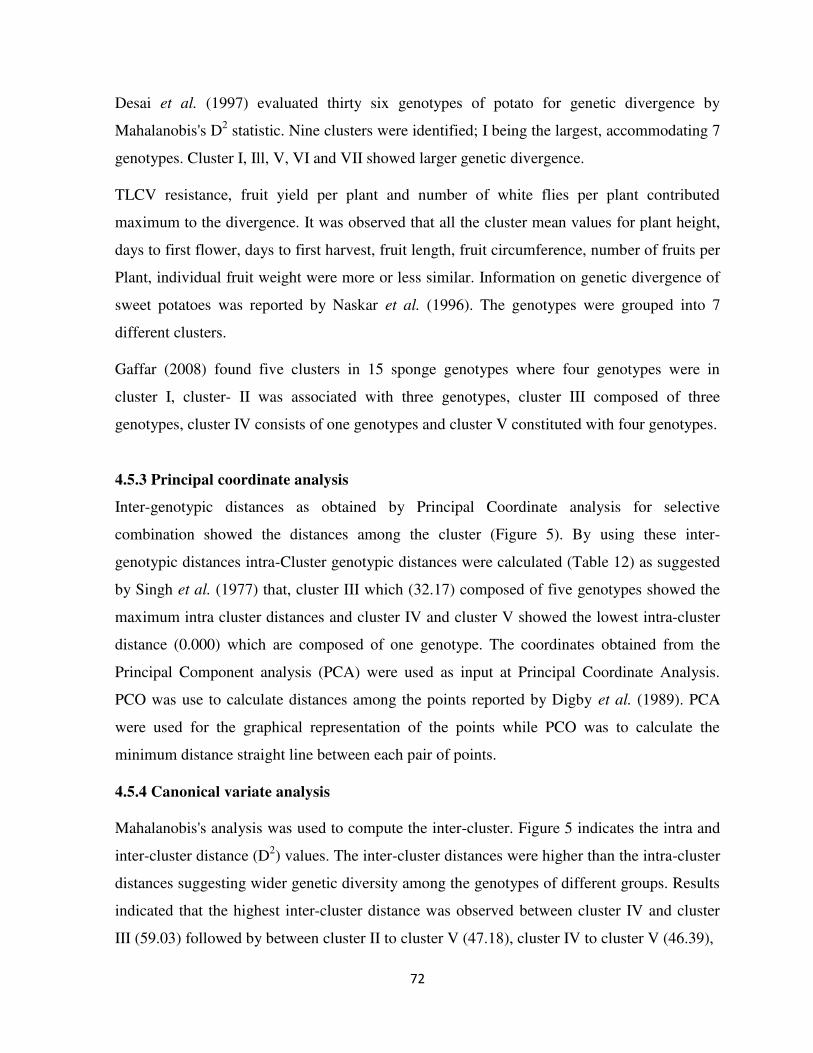
72
Desai et al. (1997) evaluated thirty six genotypes of potato for genetic divergence by
Mahalanobis's D2 statistic. Nine clusters were identified; I being the largest, accommodating 7
genotypes. Cluster I, Ill, V, VI and VII showed larger genetic divergence.
TLCV resistance, fruit yield per plant and number of white flies per plant contributed
maximum to the divergence. It was observed that all the cluster mean values for plant height,
days to first flower, days to first harvest, fruit length, fruit circumference, number of fruits per
Plant, individual fruit weight were more or less similar. Information on genetic divergence of
sweet potatoes was reported by Naskar et al. (1996). The genotypes were grouped into 7
different clusters.
Gaffar (2008) found five clusters in 15 sponge genotypes where four genotypes were in
cluster I, cluster- II was associated with three genotypes, cluster III composed of three
genotypes, cluster IV consists of one genotypes and cluster V constituted with four genotypes.
4.5.3 Principal coordinate analysis
Inter-genotypic distances as obtained by Principal Coordinate analysis for selective
combination showed the distances among the cluster (Figure 5). By using these inter-
genotypic distances intra-Cluster genotypic distances were calculated (Table 12) as suggested
by Singh et al. (1977) that, cluster III which (32.17) composed of five genotypes showed the
maximum intra cluster distances and cluster IV and cluster V showed the lowest intra-cluster
distance (0.000) which are composed of one genotype. The coordinates obtained from the
Principal Component analysis (PCA) were used as input at Principal Coordinate Analysis.
PCO was use to calculate distances among the points reported by Digby et al. (1989). PCA
were used for the graphical representation of the points while PCO was to calculate the
minimum distance straight line between each pair of points.
4.5.4 Canonical variate analysis
Mahalanobis's analysis was used to compute the inter-cluster. Figure 5 indicates the intra and
inter-cluster distance (D2) values. The inter-cluster distances were higher than the intra-cluster
distances suggesting wider genetic diversity among the genotypes of different groups. Results
indicated that the highest inter-cluster distance was observed between cluster IV and cluster
III (59.03) followed by between cluster II to cluster V (47.18), cluster IV to cluster V (46.39),

73
Table 12. Number, percent and name of genotypes in different cluster
Characters I II III IV V
I 778.46
(27.90)
1194.98
(34.57)
1298.10
(36.03)
2226.36
(47.18)
2153.48
(46.41)
II 578.20
(24.05)
1638.44
(40.48)
1092.37
(33.05)
1492.00
(38.63)
III 1035.15
(32.17)
3484.98
(59.03)
1880.54
(43.37)
IV 0.00 2152.33
(46.39)
V 0.00

74
Figure 5. Cluster diagram showing the average intra and inter cluster distances
(D = 2D values) of 16 sponge gourd genotypes
I
27.90
V
(0.00)
III
(32.17)
II
(24.05)
IV
(0.00)
40.48
34
.57
33.05
46
.39
46.41
47.18
38.63
36
.03
43
.37
59.03

75
cluster I to cluster V (46.41), and cluster V to cluster III (43.37) (Figure 5). The lowest inter-
cluster distances was observed between the cluster II to cluster IV (33.05), followed by cluster
I to cluster II (34.57) and cluster I to cluster III (36.03) (Figure 5). Inter-cluster distances were
larger than the intra-cluster distances suggesting wider genetic diversity among the genotypes
of different groups (Figure 5).
Islam et al. (1995) was carried out an experiment on groundnut (Arachis hypogaea L.) and
obtained larger inter-cluster distances than the intra-cluster distances in a multivariate
analysis.
However the maximum inter-Cluster distance was observed between cluster IV and cluster III
(59.03) maintaining more distances than other clusters, and the lowest inter -cluster distance
found between the cluster II to cluster IV (33.05), maintaining less distance than other cluster.
Genotypes from the cluster IV and cluster III (59.03), if involved in hybridization might
produce a wide spectrum of this segregating population, as genetic variation was very distinct
among groups.
Results obtained from different multivariate techniques were superimposed in Figure 4 from
which it might be concluded that all the techniques gave more or less similar results and one
technique supplemented and confirmed the results of another one. The clustering revealed that
genotype originating from the same places did not form a single Cluster because of direct
selection pressure. It has been observed that geographic diversity is not always related to
genetic diversity. The free cluster of the genotypes suggested dependence on directional
selection pressure applied for realizing maximum yield in different region. The nicely evolved
homeostatic devices would favor constant associated characters. This would suggest that it
was not necessary to choose diverse parents for diverse geographic regions.
4.5.5 Non-hierarchical Clustering
By using covariance matrix with the application of Non-hierarchical clustering, the 16 sponge
gourd genotypes were grouped into 5 (five) clusters. These results confined the clustering
pattern of the genotype according to the principle component analysis. Khan et al. (2006)
reported five clustering Islam (2005) reported four clusters, and Kumar et al. (1998) reported
six distinct clusters in different gourd. Compositions of different clusters with their

76
corresponding genotypes in each cluster were presented in Table 8. These results confirmed
the clustering pattern of the genotypes according to the principal component analysis. So, the
results obtained through PCA were confirmed by non-hierarchical clustering.
4.5.5.1 Cluster I
Cluster I was associated with three genotypes namely G1, G2 and G12 (Table 10). From the
clustering mean values (Table 11), it was observed that cluster I produced the highest mean
for fruit weight (265.67) followed by number of seed per fruit (161.67), and days of 1st female
flowering similar findings were mentioned by Gaffar (2008). The lowest mean value was for
the seed breadth cluster I (0.64).
4.5.5.2 Cluster II
Cluster II was associated with six genotypes namely G3, G6, G7, G8, G15 and G16 (Table 10).
These genotypes produced the highest mean for number of seed per fruit (325.83) fruit weight
(294.52) and days of 1st female flowering (75.50). Similar findings were mentioned by Gaffar
(2008). The lowest mean value for cluster II (0.66) was the seed breadth (Table 11).
4.5.5.3 Cluster III
Cluster III composed of five genotypes. The genotypes were G4, G9, G11, G13 and G14 (Table
10). In cluster III the highest mean is for number of seed per fruit (364.40), fruit weight
(232.34) and days of 1st female flowering (89.40). Similar findings were mentioned by Gaffar
(2008). The lowest mean value for cluster III (0.60) was the seed breadth (Table 11).
4.5.5.4 Cluster IV
Cluster IV consists of one genotypes G5 (Table 10). From the clustering mean values (Table
11) it was observed that cluster IV produced the highest mean values fruit weight (413.00),
number of seed per fruit (127.00) and for days to 1st female flowering. The lowest mean value
for cluster IV (0.80) was the seed breadth.
4.5.5.5 Cluster V
Cluster V constituted with one genotype G10 (Table 10). In cluster-V the highest mean for
fruit weight (491.00) followed by number of seed per fruit (450.00), and days of 1st female
flowering. However, the lowest mean value for cluster V (0.55) was the seed breadth (Table
11).

77
4.6 Comparison of Different Multivariate Techniques
The cluster pattern of D2 analysis though non-heretical clustering has taken care of
simultaneous variation in all the character under study. However, the distribution of genotypes
in different cluster of the D2 analysis has followed More or less similar trend of the Z1 and Z2
vector of the principal component analysis were found to be alternative methods in giving the
information pattern of genotypes. However, the principal component analysis provides the
information regarding the contribution of characters towards divergence of 16 sponge gourd.
4.7 Selection of parents for future hybridization
The most important thing in a breeding programme is the selection of genetically diverse
parents. Thus, considering the magnitude of morphological character, genetic distance,
contribution of character towards divergence, magnitude of cluster mean and agronomic
performance the genotype G5 (BD-2376) for minimum days to first female flowering from
cluster IV, G10 (BD-8421) for maximum number of fruit in a plant and yield per plant from
cluster V, G12 (BD-2375) for maximum fruit breadth from cluster III, G10 (BD-8421) for
maximum fruit weight from cluster V. Therefore considering group distance and other
agronomic performances for inter genotypic crosses between G10 (BD-8421) and G5 (BD-
2376); G12 (BD-2375) and G10 (BD-8421) are suggested for future breeding programme.

78
CHAPTER V
SUMMARY AND CONCLUSION
The present study was carried out at the Sher-e-Bangla Agricultural University farm,
Bangladesh during April 2014 to September 2014 to study on Character association, Genetic
diversity, and Correlation and Path analysis of Sponge gourd (Luffa cylindrica). The field
experiment was laid out in the main field in Randomized Complete Block Design (RCBD)
with three replications. It was observed that significant variation exist among all the genotypes
used for most of the characters studied. The maximum value in respect to days to first male
flowering was observed as 82.00 in G14 (BD-2371) and the minimum duration was 53.00 in
G5 (BD-2376). Genotype G14 (BD-2371) recorded maximum duration of female flowering
(83.00) and the minimum duration was 61.00 recorded in G5 (BD-2376). Genotype G14 (BD-
2371) recorded the highest leaf length 16.93 cm and minimum was 8.00 cm recorded in G12
(BD-2375). In case of leaf breadth, G3 (BD-2360) recorded maximum (18.20 cm) leaf breath
and minimum (9.50 cm) was recorded in G12 (BD-2375). Genotype G4 (BD-1719) recorded
maximum internodes distance (17.57cm) and G12 (BD-2375) recorded minimum (7.53 cm).
Genotype G7 (BD-2361) recorded maximum peduncle length (16.00 cm) of male flower and
minimum was 6.00 cm recorded in G3 (BD-2360). Genotype G10 (BD-8421) recorded
maximum fruit length (48.60 cm) and the minimum number was 15.10 cm in G12 (BD-2375).
Genotype 12 (BD-2375) recorded the maximum fruit perimeter (22.67 cm) and the minimum
number was 8.00 cm in G16 (BD-1715). In case of fruit weight G10 (BD 8421) was recorded
maximum weight (491.00 g) and the minimum fruit weight (117.67 g) recorded in G9 (BD-
2363). Genotype number G10 (BD-8421) recorded maximum average fruit yield (17.67 kg)
per plant and the minimum fruit yield per plant was (8.670 kg) found in G12 (BD-2375). The
phenotypic variance was higher than the corresponding genotypic variance in all the
characters, indicating greater influence of environment on the expression of these characters.
The maximum difference between phenotypic and genotypic co-efficient of variation were
38.39% and 37.53%, which indicated that number of female flower mostly dependent on
environmental effect. The highest heritability estimates among twenty one yield contributing
characters were 91.63 %, 95.04 %, 92.65 %, 92.42 %, 96.28 %, 93.24 %, 97.12 %, 90.62 %,

79
90.62 %, 95.58 %, 98.17 % in internodes length, days of 1st male flowering, days of 1st
female flowering, node no. of 1st male flower, node no. of 1st female flower, number of fruit
per plant, fruit length (cm), petiole length, peduncle length, number of seed per fruit.
The lowest heritability was in 42.86% in seed length. The maximum genetic advance in
percent of mean was observed in number of seed per fruit (76.60%), followed by number of
fruit per plant (72.42%) among twenty one character of sponge gourd genotypes. The
maximum genetic advance was observed for number of seed per fruit (231.67) and the lowest
was in Seed thickness (0.057). Correlation coefficients among the characters were studied to
determine the association between yield and yield components. In general, most of the
characters showed higher genotypic correlation co-efficient was higher than the corresponding
phenotypic correlation co-efficient suggesting a strong inherent association between the
characters under study and suppressive effect of the environment modified the phenotypic
expression of these characters by reducing phenotypic correlation values.
In few cases, corresponding genotypic correlation co-efficient were lower than phenotypic
correlation co-efficient suggesting that both environmental and genotypic correlation in these
cases acted in the same direction and finally maximize their expression at phenotypic level.
The significant positive correlation with fruit yield per plant were found in fruit length (G =
0.633, P =0.645), and number of seed per fruit (G = 0.667, P = 0.670). Path co-efficient
analysis revealed those number of seed per fruit had highest phenotypic positive direct effect
(0.931) on yield per plant followed by perimeter of the fruit (0.576), seed length (0.257), seed
breadth (0.211) and Days of 1st male flowering (0.206). Such results indicated that direct
selection based on these characters would be effective for yield improvement in sponge gourd.
On the other hand, days of 1st female flowering (-0.575), node no. of 1st male flower (-0.398),
fruit weight (-0.159), 100 seed weight (-0.159), sex ratio (-0.335), days to seed germination (-
0.088) showed negative phenotypic direct effect. So direct selection based on these characters
would not be effective. Yield per plant via number of seed per fruit had highest positive
indirect effect (0.667). The highest negative indirect effect (-0.696) was node no. of 1st male
flower via yield per plant. Genetic diversity among sponge gourd (Luffa cylindrica) genotypes
was performed through Principal Component Analysis (PCA), Cluster Analysis, Canonical
Variate Analysis (CVA) by using GENSTAT computer program.
80
According to D
2 and cluster analysis the genotypes are grouped into five cluster. These cluster
was found from a scatter diagram formed by Z1 and Z2 values. cluster I was associated with
three genotypes, cluster II was associated with six genotypes, cluster III composed of five
genotypes , cluster IV consists of one genotypes, cluster V constituted with one genotype.
genotype G5 (BD-2376) for minimum days to first female flowering from cluster IV, G10
(BD-8421) for maximum number of fruit in a plant and yield per plant from cluster V, G12
(BD-2375) for maximum fruit breadth from cluster III, G10 (BD-8421) for maximum fruit
weight from cluster V. Therefore considering group distance and other agronomic
performances for inter genotypic crosses between G10 (BD-8421) and G5 (BD-2376); G12
(BD-2375) and G10 (BD-8421) are suggested for future breeding programme.

81
REFERENCES
Abusaleha and Dutta, O. P. (1990). Genetic variability and heritability in Sponge gourd. J.
Maharastra Agric.Uni. 15(3): 335-336.
Akand, H. I. (1993). Combining ability and heterosis of ribbed gourd (Luffa acutangula). M.
Sc. Thesis. Dept. of Genetics and Plant Breeding. Bangladesh Agricultural
University, Mymensingh, Bangladesh.
Allard, R. W. (1960). Principles of plant Breeding. Jhon Willey and Sons.Inc.New York. pp.
36.
Altinisik, A., Gur, E. and Oldas, S. (2010). A natural sorbent Luffa cylindrica for the removal
of a modal basic dye. J. Hazard. Mater. 179(1-3): 658-664.
Ario, O.J. (1987). Multivariate analysis and choice of parents for hybridization in okra.
Theor. Appl. Genet. 74: 361-363.
Arora, S. K., Pandita, M. L., Partap, P. S. and Sidhu, A. S. (1983). Variability and correlation
studies in Sponge gourd (Luffa Cylindrica ). Haryana Agric. Univ. J. Res. XIII (1):
146-149.
Badade, D. S., Warade, S. D. and Gaikwad, S. K. (2001). Genetic divergence in bottle gourd.
J. Maharashtra Agric. Univ. 26(2): 137-139.
Bal, K.E., Bal, Y. and Lallam, A. (2004). Gross morphology and absorption capacity of cell-
fibers from the fibrous vascular system of (Luffa cylindrica). Textile Res. J. 74 : 241-
247.
Balasch, S., Nuez, F. Palomares, G. and Cuartero, J. (1984). Departmento de Genetica,
Universidad Politecnica, Camino de Vera, 14, 22 Valencia, Spain.
Banik, B. R. (2003). Inheritance pattern in snake gourd (Trichosanthes anguina L.). Ph. D.
Thesis, Dept. of Genetics and Plant Breeding. Bangbandhu Sheikh Mujibur Rahman
Agricultural University, Salna, Gazipur. pp. 1- 60.

82
Bashar, M.K. (2002). Genetic and Morpho-physiological basis of heterosis in rice Ph.D.
thesis, BSMRU, Gazipur.
Beyer, M., Hahn, R., Pesche, S., Harz, M. and Knonche, M. (2002). Analyzing fruit shape.
Sci. Hortic. 96(1-4):139-150.
Bose, T. K. and Som, M. G. (1986). Vegetable Grops in India. 1st ed. Naya prokash,
Calcutta-Six, India. 91-164.
Burton, G.W. (1952). Quantitative inheritance in grasses. Proc.6th Int. Grassid. Cong. 1:
277-283.
Choudhury, V.K., Kumar, R. and Sah, J.N. (2003). Variability studies in Indian mustard. J.
Appl. Biol. 13 (1-2): 9-12.
Chaudhury, B.D., Singh, P., Singh, D.P. and Pannu, R.K. (1993). Functional relationship
among morphological characters in Brassica. Haryana J. Agron. 9(2): 161-166.
Chowdhury, D. and Sharma, K. C. (2002). Studies on variability, heritability, genetic
advance and correlation in ridge gourd (Luffa acutangula Roxb.). Hort. J. 15(3): 53-
58.
Comstock, R. E. and Ribinson, H. F. (1952). Genetic parameters, their estimation, and
significance. Proc. 6th
intercropping. Glass land cong. 1: 284-291.
Cruz, C.D. (1990). Aplicacoes de algumas tecnicas multivariadas no melhoramento de
plantas. Doctoral thesis, ESALQ, USP, Piracicaba, SP.
Dabholker, A.R. (1992). Elements of Biometrical Genetics. Concept Publising,
Dharmatti, P.R., Madalgeri, B.B., Mannikeri, I.M., Patti, R.V. and Patil, G. (2001). Genetic
divergence studies in summer tomatoes. Karnatake J. Hoyt. Sci. 14 (2): 407-411.
Desai, N.C. and Jaimini, S.N. (1997). Studies on genetic divergence in potato. J. Indian
Potato Assoc. 24 (3-4): 154-160.
Dewey, D. R. and Lu, K.H. (1959). A correlation and path coefficient analysis of components
of crested wheat grass seed production. Agron. J. 51: 515-518.

83
Digby, P., Galway, M. and Lane, P. (1989). GENSTAT 5 A secind course. Oxford Science
Publications, Oxford. pp. 103-108.
Emina, M., Janos, B., Vladislav, O., Mirjana, L., Jelena, C. and Tihomir S. (2014). Genetic
diversity in a collection of ornamental squash (Cucurbita pepo L.). Original scientific
paper : UDC 575-630.
Falconer, D.S. (1981). Introduction to Quantative Genetics. 2nd edn. Longan, London, pp.
340.
Ferreira, D.F. (1993). Metodos de avaliiacao de divergencia em milho e suas relacoes corn os
cruzamentos dialelicos. MS thesis, UFLA, Lavras, MG.
Gaffar, A. (2008). Characterization and genetic diversity of sponge gourd (Luffa cylindrica).
MS Thesis., Sher-e-Bangla Agricultural University, Dhaka.
Gaur, P. C., Gupta and Kishore, H. (1978). Studies on genetic divergence in potato.
Euphytica. 27: 361-368.
Gopalan, C., Sastri, V. R., Balasubramanium, S. C., Rao, B. S. N., Dosthale, Y. G. and Pant,
K. C. (1999). Nutritive value of Indian foods. Indian Council of Medical Research
Technological Bulletin. National Institute of Nutrition, Hyderabad.
Grubben, G.J. H. (2004). Vegetables, backhuys, publishers, Leiden. pp: 354-357.
Hallauer, R., Miranda and Filho, J.B. (1981). Quantitatives Genetics in Maize breeding.
Iowa State University Press, Ames, pp. 468.
Hague, E. M. (1971). A comparative study on the external morphology and growth of
cucurbitaceous vegetable. MS Thesis, BAU, Mymensingh. pp. 29-35.
Harshawardhan, C. and Ram, H. H. (2003). Genetic diversity studies in musk melon. Ann.
Agril. Res. 24(2): 345-349.
Hazra, P., Ghosh, R. and Nath, S. (2003). Identification of important yield components in
pointed gourd (Trichosanthes dioica Roxb. ). Crop. Res. Hisar. 25(2): 244-252.

84
Hooker, J. D. (1979). The flora of British India. Vol. 2. L. Reeve Co. Kent, England. pp. 123-
125.
Husna. A. (2009).Genetic Diversity, Correlation and path co-efficient analysis in bottle gourd
(Lagenaria sineraria L. ). MS.Thesis, Sher-e-Bangla Agricultural University, Dhaka.
Islam, M.S. (1995). Genetic divergence in groundnut (Arachis hypogaea L.). MS Thesis,
BSMRAU. Gazipur.
Jagadev, P.N., Samal, K.M. and Lenka, L. (1991). Genetic divergence in rape mustard.
Indian J, Genet. 51: 465-466.
Jeger, M.I., Genethojones, D. and Griffith, E. (1983). Components of Partial resistance of
wheat seedlings of septoria nod rum. Euphytica .32: 575-584.
Johnson, H.W., Robinson, H.F. and Comstock, R.E. (1955). Estimates of genetic and
environmental variability in soyabean. Agron. J. 47: 314-318.
Jeffrey, C. (1962). Notes on Curcubitaceae, including a proposed new classification of the
family. Kew Bulletin. 15: 337‐371.
Joseph (1978). Genetic divergence in eggplant. Indian J. Genet. 20(3): 252-256.
Joshi, A. and Kohli, U. K. (2003). Genetic divergence for quantative and qualitative traits in
tomato (Lycopersicon esculentum). Indian J. Agric. Sci. 73 (2): 110-113.
Juned, S. A., Jackson, M. T. and Catty, J. P. (1988). Diversity in the wild potato species
Chacoense Bitt. Euphytica. 37 (2): 149-156.
Kabir (2007). Genetic variability correlation and path analysis of pointed gourd
(Trichosanthes dioica Roxb. ). MS Thesis, Sher-e-Bangla Agricultural University,
Dhaka.
Kadam, P. Y. and Kale, R. I. (1987). Genetic variability in ridge gourd. J. Maharashtra
Agril. Univ. 12(2): 242-243.

85
Karuppaiah, P., Kavitha, R. and Senthilkumar, P. (2005). Divergent analysis in bitter gourd
(Momordica charantia). Palani Paramount Publications. Indian J. Hort. 46(2): 314-
319.
Khan, A. S. M. R., Rabbani, M. G., Siddique, M. A. and Hossain, M. I. (2008). Study on
genetic diversity on pointed gourd using morphological characters. Bangladesh J.
Agril. Res. 33 (3): 607-616.
Khan, M. B. (2006). Diversity analysis analysis in Brinjal. M. S. Thesis, Sher-e-Bangla
Agricultural University, Dhaka.
Khule, A. A., Tikka, S. B. S., Jadhav, D. J. and Kajale, D. B. (2011). Genetic variability and
heritability studies in local collections of sponge gourd (Luffa cylindrica.). Asian J.
Bio. Sci. 6 (1) : 119-120.
Krishna, P., Rahman, V. S. and Singh, D. P. ( 1989). Studies on heritability, genetic advance
and correlations in ridge gourd (Luffa acutangula, Roxb.). Indian J. Hort. 46 (3): 390-
394.
Kumar, R., Ameta, K. D., Dubey, R. B. and Sunil Pareek. (2013). Genetic variability,
correlation and path analysis in sponge gourd (Luffa cylindrica Roxb.) African
Journal of Biotechnology. 12(6): 539-543.
Kumar, S., Singh, R. and Pal, A. K. (2007). Genetic variability, heritability, genetic advance,
correlation coefficient and path analysis in bottle gourd (Legenaria siceraria L.).
Indian J. Hort. 64(2):163-168.
Kumar, R. and Kang, G.S. (1998). Genetic diversity among Andigena potatoes. J. of the
Indian Potato Ass. 25 (1-2): 21-24.
Kumaran, S. S., Natarajan, S. and Thamburoj, S. (1998). Correlation and Path analysis
studies in pumpkin (Cucurbita moschata). South Indian Hort J. 46(3-6): 138-142.
Kumaresan, G. R., Makesh. S. and Ramaswamy, N. (2006). Character association and path
coefficient studies in snake gourd (Trichosanthes anguina L.).Research-on-Crops.;
7(2): 510-513.

86
Lee, S. and Yoo, J.G. (2006). Method for preparing transformed Luffa cylindrica (World
Intellectual property organization).
Li, J. W., Sun, S. R. and Rer, Y. H. (1997). Study on genetic correlation, path analysis of the
main agronomic characters of cucumber. Acta Agril Univ., Henamensis. 31(3): 244-
247.
Mahalanobis, P. C. (1936). On the generalized distance in statistics. Proc. Nat. inst. Sci.
India. 2: 49-55.
Mangal, J. L. Dixit, J. Pandita. and A. S. Sidhu. (1981). Genetic variability and correlation
studies in bitter gourd (Momordica charantia L). Indian J. Hort. 38: 94-98.
Masud, M. A. T., Rashid, M. H., Chowdhury, M. A. Z. and Uddin, M. S. (2006). Combinig
ability and heterosis in bottle gourd. Bangladesh J. Plant Breed. Genet. 19 (1): 41-44.
Masud, M. A. T., Chowdhury, M. A. Z., Hossain, M. A. and Hossain, S. M. M. (2001).
Multivariate analysis in pumpkin (Cucurbita moschata). Bangladesh J. Plant Breed.
Genet. 8(1&2): 45-50.
Masud, M. A. T. (1995). Variability association and genetic diversity in pumpkin (Cucurbita
moschata). M. S. Thesis Department of Horticulture, BAU, Mymensingh. pp. 38-50.
Mathew, S. M., Gopalakrishan, P. K. and Peter, K. V. (1986). Genetic distance among five
botanical varieties of Cucumis melo. Agric. Res. J., Kerala. 24(2): 195-196.
Miah, M. A., Rahman, M. M., Uddin, M. S., Rahman, A. K. M. M. and Ullah, M. H. (2000).
Genetic association in bitter gourd. Bangladesh J. Scie. Tech. 2(1): 21-25.
Mannan, M. A. (1992). Study on variability genetic parameters and correlation in bitter
gourd. M. Sc. Thesis, Dept. Genetics And Plant Breeding, Bangladesh Agricultural
University, Mymensingh.
Mondal, S. N., Rashid, A., Inove, K., Hossain, A. K. M. A. and Hossain, M. A. (1989).
Genetic variability, co-relation and path co-efficient analysis in watermelon.
Bangladesh J. Plant. Breed. Genet. 2(1): 31-35.

87
Nandpuri. B. S., Singh, S. and Lal, T. (1973). Studies on the genetic variability and
correlation of some economic characters in tomato. J. Res. 10: 316-21.
Narayanankutty, C., Sunanda, C.K., Jaikumaran, U. (2006). Genetic variability and character
association analysis in snake gourd. Indian-Journal of Horticulture. 63(4): 402-406.
Naskar, S.K. and Srinvasan, G. (1996). Genetic divergence in sweet potato. J. Root crops 11
(1-2): 57-59.
Newton, A. (2006). More On How To Grow A Luffa, Green Living, How To,
www.groovygreen.com/groove/p=710 ( November 28).
Oboh, I.O. and Aluyor, E.O. (2009). Luffa cylindrical an emerging cash crop. Afican. J.
Agric. Res. 4(8): 684-688.
Okusanya, O. T., Ola-Adams, B.A. and Bamidele, J. F. (1981). Variations in size, leaf
morphology, and fruit characters among 25 populations of Luffa aegyptiaca.
Canadinan Journal of Botany, 59: 2618-2627.
Paranjape, S. P. and Rajput, J. C. (1995). Association of various characters in bitter gourd
and their direct and indirect effects on yield. J. Maharashtra Agric. Univ. 20(2): 193-
195.
Prasanna, S. C., Krishnappa, K. S. and Reddy, N. S. (2002). Correlation and path coefficient
analysis studies in ridge gourd. Current-Research-University-of Agricultural-
Sciences-Bangalore; 31(9/10): 150-152.
Pense, V.G. and Shukhatme, P.V. 1978. Statistical method for agricultural workers. 3rd
edition. Indian Council of Agricltural Research, New Delhi. pp. 258-268.
Peyne, R.W., lane, P.W., Ainsley, A.E., Bicknell, K.E., Digby, P.G.N., Harding, S.S.,
Leach, P.K., Simpson, H.R., Todd, A.D., Varrier, P.J. and White, R.P. (1989).
GENSTAT 5 Referance manual, Oxford Science Publication. pp. 452-490.
Prasad, V. S. R. K. and D. P. Singh. (1992). Estimates of heritability, genetic advance and
association between yield and its components in cucumber (Cucumis sativus L.).
Indian J. Hort. 49(1): 62-69.
88
Quamruzzaman, A. K. M., Rashid, M. A., Masud, M. A. T. and Uddin, M. N. (2009).
Heterosis in bottle gourd . Bangladesh J Agril. Res. 34(3): 465-472.
Quamruzzaman, A. K. M., Rahman, M. H., Islam, M. N., Rahman, S. M. L. and Sarker, B. C.
(2008). Genetic diversity in land races of ridge gourd. Bangladesh Res. Pub. J. 1 (1):
5-12.
Rahman, M. M., Dey, S. K. and Wazuddin, M. (1990). Yield, yield components and plant
characters of several bitter gourd, ribbed gourd, bottle gourd and sweet gourd
genotypes. BAU Res. 4: 117-127.
Rahman, M. M., Dey, S. K. and Wazuddin, M. (1991). Study of yield, yield components and
vine characters of some cucurbit genotypes. BAU Res. Prog. 5A: 75-86.
Rahman, M. M. (2005). Study on yield and yield components and vine characters of some
cucustit, genotypes. BAU Res. Progress. 5: 75-85.
Ram, D., Kallo, G. and Singh, M. (2001). Cluster analysis in pointed gourd (Trichosanthes
dioica Roxb.). Veg. Sci. 28(1): 67-68.
Ramachandran, C. (1978). Genetic variability, correlation studies and path ysis in bitter
gourd (Momordica charantia L.). M.Sc. Thesis Keralla. Uni. Thrissure Kerala.
Ramachandran, C. and Gopalkrishan. (1979). Correlation and regression re studies in bitter
gourd. Indian J. Agric. Sci. 49: 850-854.
Ramos, S. S. R., Queiroz, M.A., Casali, V. W. D. and Cruz, C. D. (2000). Genetic diversity
of squash germplasm from northest of Brazil. Horticulture Brasileira, 18(3): 195-199.
Rao, T. S. (1977). Genetics of yield components in brown sarson. Genetic aIberica. 29(3/4):
219-227.
Raseed, M. M., Nabi, S. A., Rasul, M. G. and Mian, M. A. (2002). Genetic divergence in
pumpkin (Cucurbita moschata). Bangladesh J. Plant. Breed. Genet. 15(1): 39-41.

89
Rashid, M. M. (2000). Genetic divergence in pumpkin. MS Thesis. Dept. Genetics and Plant
Breeding Bangabandhu Sheikh Mujibur Rahman Agricultural Universitty, Salna,
Gazipur. pp. 85.
Rashid, M. M. (1993). Sabjibiggan (in Bengali). 1st ed. Bangla Academy, Dhaka,
Bangladesh. pp 515.
Sahni, G. P., Singh, R. K. and Saha, B. C. (1987). Genotypic and phenotypic variability in
ribbed gourd. Indian J. Agric. Sci. 57(9): 666-668.
Sanwal, S. K., Yadav, R. K., Singh, P.K. and Rai, n. (2008). Variability and genetic diversity
studies in indigenous chow-chow genotypes of northeast India. Indian J. Hort.
65(2).
Sanwal,S.K.,Marity, T. K. and Som, N. G. (1999). Correlation and path coefficient studies in
pointed gourd (Trichosanthes dioica Roxb.). Indian J. Hort. 56(3): 252-255.
Satyanarayana, K.G., Guilmaraes, J. L. and Wypych, F. (2007). Studies on lignocellulosic
fibres of Brazil. Part I: Production, morphology, properties and applications.
Composites 38(7): 1694-1709.
Shah, S. R. and Kale, P. N. (2002). Yield component association analysis in ridge gourd. J.
Maharashtra Agril. Univ. 27(2): 197-198.
Shah, J. J., Thanki, Y. J. and Kothari, I. L. (1980). Skeletal fibrous net in fruits of Luffa
cylindrica and Luffa acutangula. pp. 61- 72.
Sharma, R. R. and P. Dhankhar. (1990). A. comparative study on sex expression and sex
ratio in common melons. Madras Agril. J. 58(7): 578-586.
Singh, R. K. and Chaudhary, B. D. (1985). Biometrical methods in quantitative genetic
analysis. Kalyani Publishers, New Delhi, India.
Singh, R. V., Verman, T. S. and Thakur, P. C. (2002). Characters association in cucumber.
Hariyana J. Hort. Sci. 31(1&2): 91-93.

90
Swamy, K. R. M., Dutta, 0. P., Ramchander P. R. and Wahi, S. D. (1984). Interrelationship
among yield and other quantitative characters in muskmelon (Cucumis melo L.).
South Indian Hort. 32(6): 334-339.
Takahashi, H. (1980). Sex expression as affected by N6-benzylaminopurine in staminate
inflorescence of Luffa cylindrica. Plant Cell Physiol. 21: 525-536.
Tanobe, V. O. A., Sydenstricker, T. H. D., Munaro, M. and Amico, S. C. (2005). A
comprehensive characterization of chemically treated Brazilian sponge gourds (Luffa
cylindrica). Polymer Test 24(4): 474-482.
Tyron (1939). Principal Component Analysis. An Introduction to Biometrical Technique.
John Wiley and Sons. Inc. New York. pp. 545.
Uddin, M.J. (2001). Morphogenetic diversity and gene antion in sesame (Sesame indicum
L.). Ph.D. thesis, Department of genetics and Plant Breeding, BSMRAU, Gazipur.
Varalaksmi, B., Reddy, Y. N. and Reddy, B. M. (1994). Genetic divergence in ridge gourd
(Luffa acutangula, Roxb.). J. Genet. Breed. 48(2): 131-134.
Varghese, P. (1991). Heterosis in snake gourd (Trichosanthes anguina L.). M. S. Thesis.
Kerala Agricultural University. Kerala, India. pp. 37-60.
Whitaker, T. W. and Davis, G. N. (1962). Agromorphological, Chemical and Biochemical
Characterization of Pumpkin (Cucurbita maxima and Cucurbita moschata,
Cucurbitaceae) Morphotypes Cultivated in Cameroon. Research in Plant Sciences. 3
(1). pp. 12-17.
Yadav, Y. C., Kumar, S., Bisen, B. and Dixit, S. K. (2009). Genetic variability, heritability
and genetic advance for some traits in cucumber. Indian J. Hort. 66(4): 54-56.
Zalapa, J. E., Staub, J. E. and McCreight, J. D. (2006). Generation mean analysis in melon.
Plant Breed. 125(5): 482-487.

91
APPENDICES
Appendix l: Map showing the experimental site under study
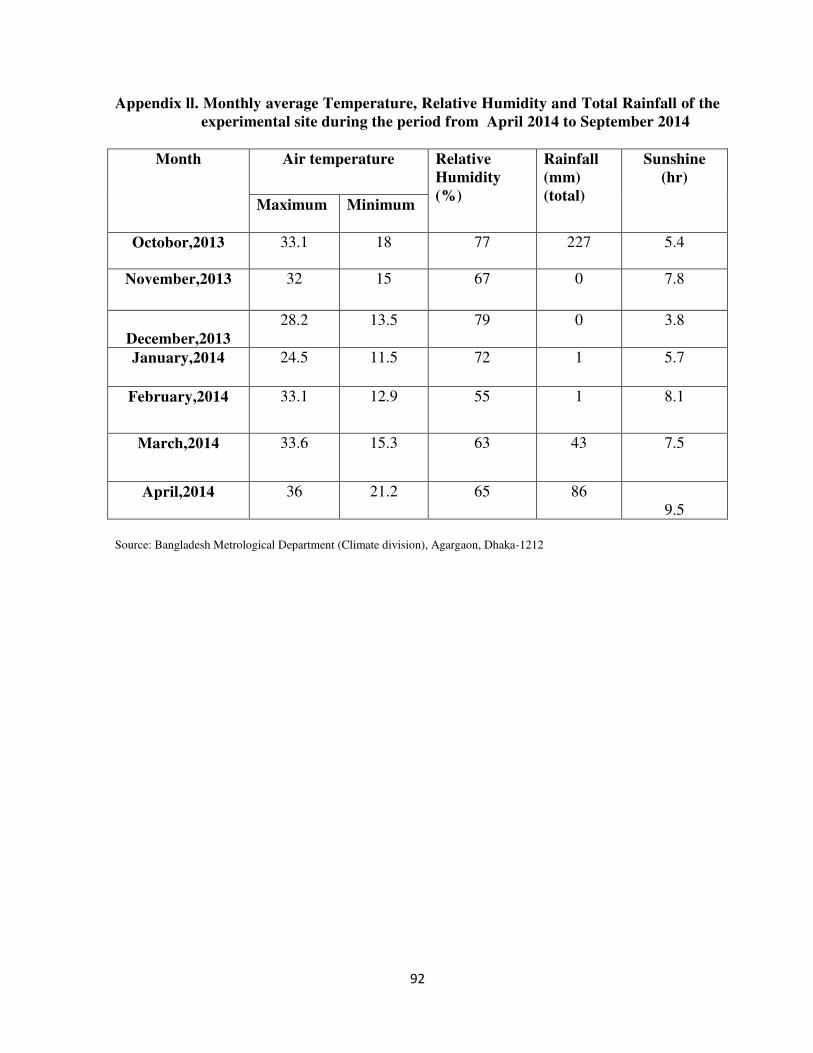
92
Appendix ll. Monthly average Temperature, Relative Humidity and Total Rainfall of the
experimental site during the period from April 2014 to September 2014
Month Air temperature
Relative
Humidity
(%)
Rainfall
(mm)
(total)
Sunshine
(hr)
Maximum Minimum
Octobor,2013 33.1 18 77 227 5.4
November,2013 32 15 67 0 7.8
December,2013
28.2 13.5 79 0 3.8
January,2014 24.5 11.5 72 1 5.7
February,2014 33.1 12.9 55 1 8.1
March,2014 33.6 15.3 63 43 7.5
April,2014 36 21.2 65 86
9.5
Source: Bangladesh Metrological Department (Climate division), Agargaon, Dhaka-1212

93
Appendix III: Morphological, physical and chemical characteristics of initial soil (0-
15cm depth) of the experimental site
A. Physical composition of the soil
Soil separates % Methods employed
Sand
36.90
Hydrometer method (Day,1915)
Silt
26.40
DO
Clay
36.66
DO
Texture class
Clay loam
DO
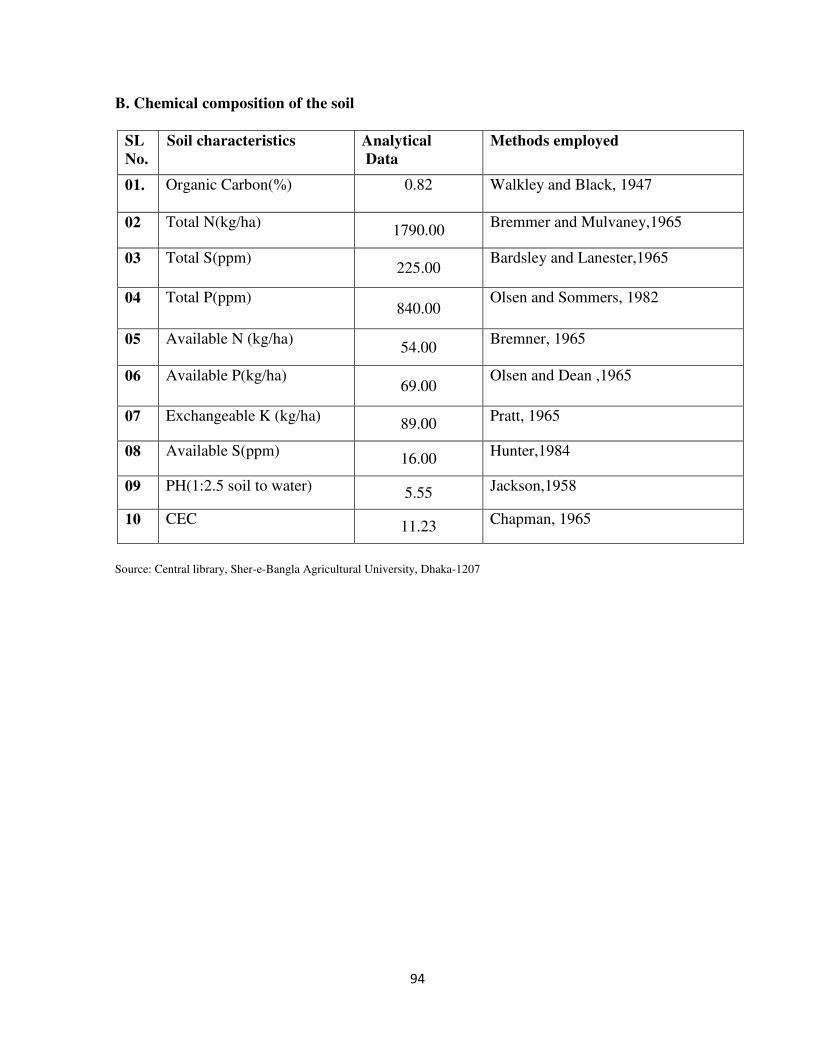
94
B. Chemical composition of the soil
SL
No.
Soil characteristics
Analytical
Data
Methods employed
01. Organic Carbon(%) 0.82
Walkley and Black, 1947
02 Total N(kg/ha) 1790.00
Bremmer and Mulvaney,1965
03 Total S(ppm) 225.00
Bardsley and Lanester,1965
04 Total P(ppm) 840.00
Olsen and Sommers, 1982
05 Available N (kg/ha) 54.00
Bremner, 1965
06 Available P(kg/ha) 69.00
Olsen and Dean ,1965
07 Exchangeable K (kg/ha) 89.00
Pratt, 1965
08 Available S(ppm) 16.00
Hunter,1984
09 PH(1:2.5 soil to water) 5.55 Jackson,1958
10 CEC 11.23
Chapman, 1965
Source: Central library, Sher-e-Bangla Agricultural University, Dhaka-1207

95
Appendix IV: Analysis of variance for different morphological plant characters of 16 Sponge gourd varieties
Source of
variation
d
.f
Leaf
length
(cm)
Leaf
breath
(cm)
Internode
length
(cm)
Days of
1st male
flowering
Days of
1st female
flowering
Node
no. of
1st
male
flower
Node no.
of 1st
female
flower
Number
of fruit
per plant
Fruit
length
(cm)
Fruit
weight
(kg)
100
seed
weight
(g)
Replication 2 0.471 0.782 2.651 5.26 8.313 1.938 5.063 0.109 4.58 2037.5
8 0.108
Genotypes 1
5
15.285
**
24.381
** 32.626** 240.40**
304.688*
*
105.18
8**
73.287*
*
65.787*
*
269.2
7**
28825.
35**
0.319*
*
Error 3
0 0.864 0.720 0.558 6.19 8.113 1.338 1.729 0.643 8.98
1061.3
8 0.056
Table 4.1 (Cont’d)
Source of
variation d.f
Perimeter
of the fruit
(cm)
Petiole
length
(cm)
Peduncle
length
(cm)
Sex
ratio
Days to seed
germination
Number of
seed per
fruit
Seed
length
(cm)
Seed
breadth
(cm)
Seed
thickess
(cm)
Yield
per
plant
(kg)
Replication 2 6.77 0.896 0.827 3.39 0.310 8.06 0.001 0.001 0.001 0.162
Genotypes 15 52.66** 17.682
**
30.388*
*
31.58*
* 3.000**
38892.38*
*
0.013*
*
0.013*
*
0.005*
*
16.34
7**
Error 30 2.03 0.590 0.461 1.49 0.195 240.46 0.004 0.002 0.001 0.959
** indicates significant at 0.01 probability level.


![Studies on Genetic Parameters, Character Association and ... › ijtas › pdf › 5 SAMUEL PATRO 1015.pdfcause and effect of related characters (Wright, 1921) [10]. The path analysis](https://static.fdocuments.in/doc/165x107/5f0e618f7e708231d43ef863/studies-on-genetic-parameters-character-association-and-a-ijtas-a-pdf-a.jpg)