CHAPTER4 MARKET CONSIDERATIONS FOR THE ORNAMENTAL … · To date, marketing of aquaculture products...
155
CHAPTER4 MARKET CONSIDERATIONS FOR THE ORNAMENTAL FISH MARKET AND IN PARTICULAR P. SCALARE At present the Australian ornamental fish culture industry is undergoing a period of rapid expansion (Treadwell et al., 1992), with production primarily aimed at import replacement (Lee, 1991). This rapid expansion is largely the result of the increasing costs of importing fish and international shortages of some species. The fostering of an ornamental fish culture industry in Australia is a natural extension of the growing aquaculture industry and the production of ornamental fish species has many potential benefits for both the pet industry and the wider Australian community. These include the tangible benefits of increased employment opportunities, value added production and import replacement. Intangible benefits include minimising the risk of introducing exotic diseases to Australian fish populations from imported fish. To date, marketing of aquaculture products has received little attention, and often work performed is carried out by private companies for their own use. The ornamental fish industry is no exception, and to date little is known about the industry in Australia. This chapter gives a brief international perspective on the ornamental fish industry and then examines the Australian ornamental fish industry and the market for P. sea/are, through the available literature, anecdotal evidence and an industry survey conducted as part of this study. 102
Transcript of CHAPTER4 MARKET CONSIDERATIONS FOR THE ORNAMENTAL … · To date, marketing of aquaculture products...
CHAPTER4
MARKET CONSIDERATIONS FOR
THE ORNAMENTAL FISH MARKET
AND IN PARTICULAR P. SCALARE
At present the Australian ornamental fish culture industry is undergoing a period of rapid
expansion (Treadwell et al., 1992), with production primarily aimed at import replacement (Lee,
1991). This rapid expansion is largely the result of the increasing costs of importing fish and
international shortages of some species. The fostering of an ornamental fish culture industry in
Australia is a natural extension of the growing aquaculture industry and the production of
ornamental fish species has many potential benefits for both the pet industry and the wider
Australian community. These include the tangible benefits of increased employment
opportunities, value added production and import replacement. Intangible benefits include
minimising the risk of introducing exotic diseases to Australian fish populations from imported
fish.
To date, marketing of aquaculture products has received little attention, and often work
performed is carried out by private companies for their own use. The ornamental fish industry is
no exception, and to date little is known about the industry in Australia. This chapter gives a
brief international perspective on the ornamental fish industry and then examines the Australian
ornamental fish industry and the market for P. sea/are, through the available literature,
anecdotal evidence and an industry survey conducted as part of this study.
102

4.1 An international perspective of the ornamental fish market
The market for ornamental fish is well established throughout the world (Bedford Clark, 1993;
Bassleer, 1994). Keeping ornamental fish is the second most popular hobby after photography
in the USA (Winfree, 1989) and enjoys similar popularity throughout other western countries
with over 100 million hobbyists throughout the world (Bleher, 1989). The major markets for
ornamental fish are characterised by high population densities, industrialised western economies,
and cool climates (Bassleer, 1994). Examples include Germany, Britain, France, the
Netherlands, Japan, the USA and Australia (Fernando and Lim, 1989; and Bassleer, 1994).
World-wide annual wholesale sales of ornamental fish (Table 22) are worth more than US$900
million (Bassleer, 1994).
Table 22. Wholesale market value (US$) of tropical ornamental fish
Country Wholesale market value (US$)
USA $425,000,000
West Europe $180,000,000
Japan $110,000,000
Others $150,000,000
Total $900,000,000
(Source: Bassleer, 1994)
Retail sales for ornamental fish and associated accessories worth more than US$7.2 billion per
annum (Andrews, 1992), with sales offish alone worth US$3 billion per annum (Bassleer,
1994).
Due to increases in breeding and transport technology of ornamental fish over the past 20 years
the range of species and varieties of species available for the hobbyist has significantly
increased. Between 500 and 1,000 species offish and invertebrates are now commonly stocked
in aquariums throughout the world, with 80 per cent of these species produced on farms
103

(Winfree, 1989). The ornamental fish market can be divided into the following four basic
sectors:
1. coldwater species freshwater;
2. coldwater marine species;
3. tropical freshwater species; and
4. tropical marine species.
The most popular sector is the tropical freshwater species, which accounts for at least 85 per cent
of the market (Ingram, 1987) and offers the greatest opportunities for producers. The rest of this
discussion is based on the tropical freshwater species segment.
Sales of freshwater tropical species are mainly to hobbyists (99 per cent) with the remaining fish
sold to public aquaria and research institutes (Bassleer, 1994). Segmentation of the
ornamental fish industry is often based on species type, but also on size, fin type and colour
variety. These characteristics, as well as the origin of the fish are the main factors in setting
values of different fish (Bassleer, 1994), with boldly coloured fish with large fins generally
fetching the higher ptices. The market for ornamental fish is price sensitive, with sales
decreasing substantially with price increases. This sensitivity is reflected in the sales of different
species where approximately 20 species of ornamental fish account for 80 per cent of all fish
sales (Humphrey, 1989). These species, often referred to as the 'bread and butter' species,
include the easily farmed, cheap species such as livebearers (guppies, mollies, platys), gouramis,
neon tetras, and other mass produced species (Brown and Gratzek, 1982).
Ornamental fish generally have a much higher value than food fish, mainly as a result of the
extra degree of quality control in production of ornamentals and the fact that they are sold live
(Bassleer, 1994). Much higher levels of quality control, particularly in nuttition, water quality
management and disease control are needed when producing ornamental fish than food fish, in
order to ensure the product is healthy and aesthetically pleasing when sold (Willis, 1992; and
Bassleer, 1994). Bassleer, (1994) indicates that the price of food fish is approximately
US$3.00per kg compared with ornamental fish at approximately US$300 per kg.
104

The relatively higher values of ornamental fish compared to food fish also reflect the
composition of the market and the marketing channels utilised for ornamental fish. A
generalised marketing channel for ornamental fish is shown in Figure 23.
Fisherman I Breeder
Figure 23. Generalised international market channel for ornamental fish (after Bassleer, 1994)
This channel may be further extended through addition of country or city buyers (agents) who
aggregate supplies of fish from farmers and collectors and then sell them to exporters (Fernando
and Lim, 1989). The majority of ornamental fish producers therefore operate in the business or
industrial market, supplying goods to intermediaries for resale to consumers. Business markets
are generally characterised by derived demand, with demand generally inelastic and largely
fluctuating, and being well informed (Patti et al., 1991; Stanton et al., 1994; and Hut and Speh,
1995). However, it appears that the ornamental fish market differs from this classic business
market as demand is elastic, with little fluctuation in demand throughout the year. Producers of
ornamental fish must therefore gear production towards satisfying demand by producing fish all
year round. Producers must also be aware of pricing which is generally set by the market.
105

Andrews (1992) suggests that approximately 90 per cent of the fish available in the ornamental
fish trade are farm raised, with the remaining fish originating from wild caught stocks. The
major sources of ornamental fish are Asian countries which supply 80 per cent of farm raised
fish (Bassleer, 1994). Production of ornamental fish in Asia is generally characterised by
outdoor ponds or tanks often with little or no water exchange. The ponds are fetiilised to
encourage zooplankton growth for food and supplementary feeding is used as well. This type of
production is extensive in nature, with little effective environmental or disease control, low
stocking densities and low cost. Similar methods are used in Florida, USA, where a large
industry supplying the USA and Europe has developed. More intensive production methods
(characterised by smaller tanks, greater reliance on artificial feeds, higher stocking densities,
greater environmental control and higher capital cost) are utilised in cooler climates such as
Europe, the United Kingdom and northern USA.
The oppmiunities for domestic producers of ornamental fish in western countries to replace
imports from Asian countries are increasing due to the rising cost of producing and transporting
ornamental fish, as well as the continuing interest in high quality fish (Bassleer, 1994). These
opportunities are compounded by growing pressures in traditional ornamental fish producing
areas in Asia. These pressures include conflicts with other land users, declining harvests from
wild populations and pollution (Winfree, 1989; Lee, 1991; and Andrews, 1992). Ornamental
fish production offers a good alternative for established fish farms to diversify (Andrews,
1992), with the opportunity to farm species of fish that offer good cash flows, rapid turnover of
stock (8~ 12 weeks depending on species and market size), and are higher valued
(Bedford-Clark, 1993).
The opportunities for production of ornamental fish in Australia for import replacement have
been highlighted before (O'Sullivan, 1991; and Lee, 1991; and Treadwell et al., 1992). A small,
pioneering industry has developed in response to these opportunities and is currently expanding
(Treadwell et al., 1992). Little data are available on the Australian ornamental fish industry at
present, therefore an industry survey was conducted to determine trends in marketing,
production levels and techniques within the Australian industry. This industry survey is
discussed in the following section.
106

4.2 Industry survey of Australian ornamental fish industry
4.2.1 Introduction
The majority of studies undertaken on the ornamental fish industry in Australia have been
based on the potential for disease introductions with imported fish (Ashburner, 1976; and
Humphrey, 1989) or the potential for ornamental species to establish feral populations in
Australia (McKay, 1977; Wharton, 1979; and Courtney, 1989). The ornamental fish
industry status and potential in Australia (see section 4.3) is discussed by several authors
(Lee, 1991; O'Sullivan, 1991; Treadwell et al., 1992; and Willis, 1992).
Although these studies provide industry data, there are little data at the farm level such as
disease issues, farm characteristics, production methods and production trends. This type of
farm data is useful when designing new farms, making assessments of potential competitors
and indicating trends in culture systems used in the industry. It may also highlight areas of
potential opportunity.
In order to establish farm level data for the Australian ornamental fish industry, a two stage
exploratory industry survey was conducted. The survey was aimed specifically at
determining industry problems; current and future production of ornamental fish species in
each state; and farm characteristics in terms of location, size, production systems, production
techniques, disease issues, and problems faced by individual farms.
These factors were addressed in particular in order to:
1. establish current and future production of ornamental fish species produced in
Australia, and in particular to establish the number of P. seafare currently
produced in Australia;
2. identify potential problems that a farm may face so that steps can be made
to overcome them;
3. determine the nature of potential competitors; and
4. characterise the nature of Australian farms to help establish industry norms.
107

The following sections detail the materials and methods used as well as the results and
discussion of the industry survey.
4.2.2 Method
The exploratory industry survey was conducted in two stages, using a mail survey technique
for administration of the questionnaire, discussed in more detail latter in this section. The
first stage of the survey was conducted during January and February of 1992. A
questionnaire and cover-letter were administered by mail to respondents, along with a reply
paid return envelope for respondents to return the questionnaire. A follow-up letter was then
mailed out to non-respondents after two weeks to prompt them into returning their
questionnaires. The second stage of the survey was conducted during May and June of
1994. The questionnaire used in stage two had the same format as stage one, however the
time frame was altered. The questionnaire with a cover letter and reply paid envelope was
mailed to respondents with a follow up letter mailed out to non-respondents after two weeks
to prompt them into returning their questionnaires. The following sections detail the sample
population, data collection instrument, and data analyses and presentation.
Sample population. The sample population for the survey was defined as all the licensed
ornamental fish farms in Australia. Although there are a number of unlicensed producers in
Australia, these were not included in the survey due to difficulties in finding them and
because they are producing minimal numbers of fish (pers comm R. McKay, 1991).
Mailing lists were generated using the current farm lists available from fisheries departments
for New South Wales (NSW), Queensland (Qld), Victoria (Vic), Tasmania (Tas) and
Western Australia (WA). No data were available for South Australia and the Northern
Territory because neither required registration or licensing of ornamental fish production at
the time of the survey. Thus, farm names and/or addresses were not available. However,
discussions with Department of Primary Industry staff in South Australia and the Northern
Territory indicate that production of ornamental fish i~hese states is minimal. ,,,, ' ''','
A mailing list of 34 fish farms for stage one of the survey was developed. The survey
population changed for stage two of the survey with the addition of three new farms in
108

Queensland, two farms in New South Wales and one farm in Western Australia ceasing to
operate, resulting in a list of 34 farms for the second stage of the survey. The change in
population indicates that the industry is dynamic and still evolving which is characteristic for
new industries. Although the population had changed, the number of farms remained the
same and the population in stage two of the survey was comparable with that in stage one.
Data collection. A survey questionnaire (see Appendix A) was used for primary data
collection. The format of the questionnaire remained the same for both stages of the survey,
in order for the data from both stages to remain directly comparable. However, the years
were changed with the years 1989- 90 to 1991 - 92 surveyed in stage one and the years 1992
- 93 to 1994 - 95 surveyed in stage two.
Due to the exploratory and descriptive nature of this survey, the format used for the
questionnaire was a combination of non-disguised structured and open-ended questions.
Structured questions were used to determine descriptive aspects of the industry such as farm
characteristics and production of fish. Open-ended questions were used for more exploratory
questions involving disease aspects, and farm and industry problems where flexibility of
respondents' answers was deemed important.
A cover letter (see Appendix B) was included with the questionnaire. It provided an
introduction and indicated to respondents that in return for their prompt response,
respondents would receive a summary of the survey findings. Respondents were also assured
their responses would remain confidential and data would be presented only as aggregate
state data. A follow up letter (Appendix C) was also sent to non-respondents two weeks after
the questionnaire was first administered. A copy of the questionnaire was included with this
letter in case the original had been lost.
Generally there are three options for the administration of questionnaires: personal
interviews, telephone surveys and mail surveys (Stanton et.al, 1994). The suitability of these
methods will vary with the nature and purpose of the survey and the relative advantages of
each method are discussed in Parasuraman (1992). In this study, administration of the
questionnaire was by mail survey because:
109

I. a mail survey is the cheapest of the three methods to administer (Parasuraman,
1991);
2. mail surveys are more suitable for wide geographic areas (Stanton et al.,
1994); and
3. mail surveys are easier to administer and more convenient for respondents
(Parasuraman, 1991; and Stanton et al., 1994).
However, when using a mail survey researchers must be aware of their associated problems.
One major limitation is time, with mail surveys taking considerably longer to implement
than the other two methods. (Kotler et al., 1983; and Parasuraman, 1991). In this case, time
was unlikely to have an impact on data quality because of respondents' prompt responses.
Another major problem with mail surveys is the compilation of accurate mailing lists and
thus accurate sample populations (Stanton et al., 1994). This problem was highlighted in the
current study, with difficulty in attaining farm addresses from South Australia and the
Northern Territory where no licensing is required for ornamental fish farming. Low
response rates are also characteristic of mail surveys (Kotler et al., 1983; Chisnall, 1991; and
Stanton et al., 1994), with response rates of 30 per cent or less being common, therefore
follow-up letter (previously detailed) was mailed out after two weeks to non-respondents.
Inducements in the form of assured confidentiality, rewards or prizes and money are often
given to respondents to help increase response rates (Parasuraman, 1991; and Stanton et al.,
1994). Therefore inducements were provided to respondents in the form of assured
confidentiality and a copy of a summary of the research findings in exchange for prompt
responses from respondents.
Although mail surveys generally result in relatively poor response rates when compared to
telephone and personal interviewing, the current study had relatively high response rates for
both stages of the survey. The number of registered farms and the reply rate for the five
states for stage one and two are shown in Table 23.
110

Table 23. Number of farms surveyed and their response rate
Stage 1 Stage 2
State No. Registered Response rate No. Registered Response rate Farms (%) Farms (%)
NSW 11 45.45 9 77.7
Qld 11 63.63 14 50
Vic 5 80 5 80
Tas 1 100 1 100
WA 6 33.33 5 80
Total 34 52.9 34 64.7
A response rate of 52.9 per cent was attained for the 34 farms surveyed in stage one, with a
response rate of 64.7 per cent achieved for the 34 farms surveyed in stage two. Parasuraman
(1991) states that response rates of 50 per cent or higher are exceptionally good, and should
portray a reasonable approximation of the population. Therefore the results from this study
should portray a reasonable indication of the ornamental fish producing industry in Australia.
Data analyses and presentation. Both quantitative and qualitative data were collected in the
survey. The analyses and presentation of the quantitative and qualitative data are discussed
separately below.
Quantitative data were grouped as aggregate data for the following state groups: New South
Wales (NSW), Queensland (Qld), Victoria (Vic) and Tasmania (Tas), and Western Australia
(WA). The following analyses and presentation were performed for the respective questions.
Question 1. The number of farms located in urban, rural and other response categories was
totalled and presented as percentages for each state group.
Question 2. The number of farms using each tank type was calculated for each state and
expressed as a percentage. The total volume of culture tanks for each state was also
calculated. The percentage of farms utilising intensive, semi-intensive and extensive farming
techniques was also determined for each state.
Ill
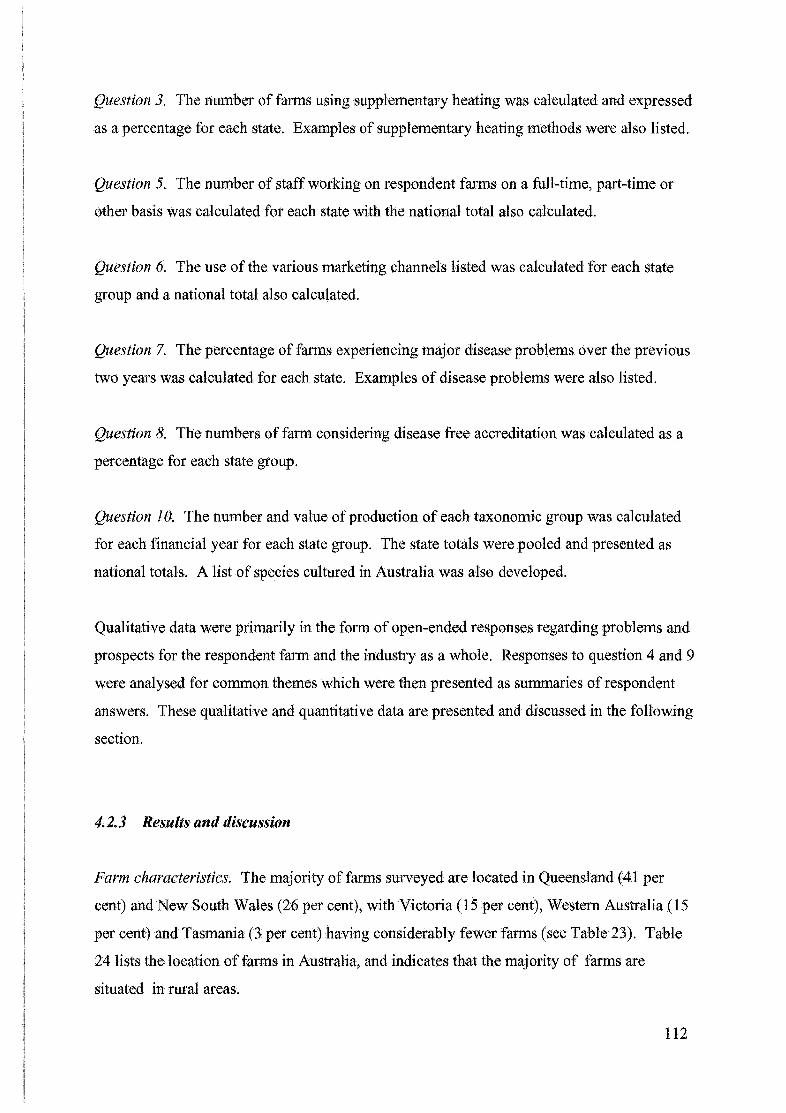
Question 3. The number of farms using supplementary heating was calculated and expressed
as a percentage for each state. Examples of supplementary heating methods were also listed.
Question 5. The number of staff working on respondent farms on a full-time, part-time or
other basis was calculated for each state with the national total also calculated.
Question 6. The use of the various marketing channels listed was calculated for each state
group and a national total also calculated.
Question 7. The percentage of farms experiencing major disease problems over the previous
two years was calculated for each state. Examples of disease problems were also listed.
Question 8. The numbers of farm considering disease free accreditation was calculated as a
percentage for each state group.
Question 10. The number and value of production of each taxonomic group was calculated
for each financial year for each state group. The state totals were pooled and presented as
national totals. A list of species cultured in Australia was also developed.
Qualitative data were primarily in the form of open-ended responses regarding problems and
prospects for the respondent farm and the industry as a whole. Responses to question 4 and 9
were analysed for common themes which were then presented as summaries of respondent
answers. These qualitative and quantitative data are presented and discussed in the following
section.
4.2.3 Results and discussion
Farm characteristics. The majority of farms surveyed are located in Queensland ( 41 per
cent) and New South Wales (26 per cent), with Victoria (15 per cent), Western Australia (15
per cent) and Tasmania (3 per cent) having considerably fewer farms (see Table 23). Table
24 lists the location of farms in Australia, and indicates that the majority of farms are
situated in rural areas.
112

Table 24. Location of ornamental fish farms in Australia
%farms in %of farms in State urban areas rural areas
NSW 0 100 Qld 0 100 Vic 50 50 Tas 100 0 WA 50 50
These data reveal that all the respondents from farms in New South Wales and Queensland
that replied are located in rural areas with the frequency of urban farms increasing for
southern states. The location of farms has an impact on several factors including:
1. the level of culture intensity of farms;
2. the size and production capacity of farms; and
3. the type of marketing channels used by farms.
Although no data were collected on the financial impact of the location of farms, it is
suspected that location would play some role, particularly in freight and heating costs. The
majority of Australian ornamental fish wholesalers are located in Melbourne and Sydney,
with Australian Bureau of Statistics figures indicating that the majority of ornamental fish
imports arrive through Melbourne (51.3 per cent of imports) and Sydney (24.5 per cent of
imports) (see section 4.3.3). However the majority of farms are located in Queensland (41
per cent) and therefore will have much higher freight costs in accessing Melbourne and
Sydney wholesalers than farms located in Victoria, Tasmania, and New South Wales.
Location of farms also had an impact on the type of production systems used by farms. Most
respondent farms use a combination of production systems such as glass aquaria and large
tanks or tanks and ponds, with the combination of systems largely depending on the species
produced on the farms and the life stages of the fish produced by the farm. The relative use
of different production systems for respondent farms is listed in Table 25.
113
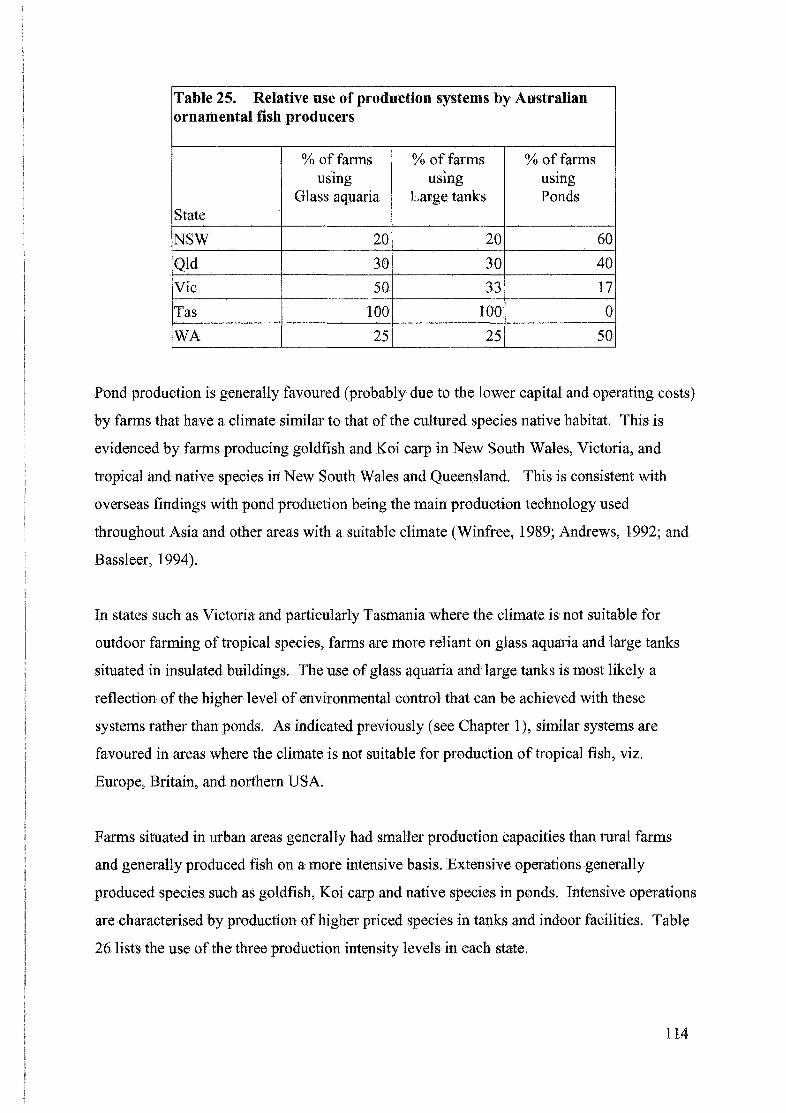
Table 25. Relative use of production systems by Australian ornamental fish producers
% offarms %of farms %of farms usmg using usmg
Glass aquaria Large tanks Ponds State
NSW 20 20 60
Qld 30 30 40
Vic 50 33 17
Tas 100 100 0
WA 25 25 50
Pond production is generally favoured (probably due to the lower capital and operating costs)
by farms that have a climate similar to that of the cultured species native habitat. This is
evidenced by farms producing goldfish and Koi carp in New South Wales, Victoria, and
tropical and native species in New South Wales and Queensland. This is consistent with
overseas findings with pond production being the main production technology used
throughout Asia and other areas with a suitable climate (Winfree, 1989; Andrews, 1992; and
Bassleer, 1994).
In states such as Victoria and particularly Tasmania where the climate is not suitable for
outdoor farming of tropical species, farms are more reliant on glass aquaria and large tanks
situated in insulated buildings. The use of glass aquaria and large tanks is most likely a
reflection of the higher level of environmental control that can be achieved with these
systems rather than ponds. As indicated previously (see Chapter 1), similar systems are
favoured in areas where the climate is not suitable for production of tropical fish, viz.
Europe, Britain, and northern USA.
Farms situated in urban areas generally had smaller production capacities than rural farms
and generally produced fish on a more intensive basis. Extensive operations generally
produced species such as goldfish, Koi carp and native species in ponds. Intensive operations
are characterised by production of higher priced species in tanks and indoor facilities. Table
26 lists the use of the three production intensity levels in each state.
114

Table 26. Use of different production intensity of ornamental fish farms in each state
State Intensive Semi-intensive Extensive
NSW 0 20 80 Qld 0 15 85 Vic 30 40 30
Tas 100 0 0 WA 50 50 0
These findings confirm earlier indications regarding production systems, with more intensive
systems utilised in colder climates. The increasing level of intensity allows farmers to
produce more fish per unit of water, or achieve higher yields than less extensive operations.
Increasing yields in cooler climates allows available land and water resources to be used
more efficiently.
The importance of supplementary heating significantly increases in colder states ( eg
Tasmania). Farms based in southern parts of Australia such as New South Wales, Victoria,
and Tasmania rely on some form of supplementary heating to maintain optimal temperatures
throughout the year and particularly winter. The various forms of supplementary heating
used by these farms include wood furnaces, gas heaters, heat pumps and oil furnaces. The
use of supplementary heating is likely to increase the operating costs of farms, particularly
during the colder winter months, and thus may reduce profitability of farms utilising
supplementary heating.
Respondent farms in Queensland did not use any supplementary forms of heating. These
farms are situated where the climate is more suited for tropical species and rely on large
outdoor tanks and ponds for the extensive production of ornamentals. Farms producing
native species also rely on extensive production in ponds and are generally located within the
natural distribution for the species. The use of supplementary heating and more intensive
production methods in southern states allows these farms to produce fish all year round in a
controlled environment. However, these type of systems are considerably higher in capital
and operating costs.
115

Marketing of ornamental fish. The marketing channels used by ornamental fish farms fall
into four basic categories;
1. wholesalers;
2. retailers;
3. export markets; and
4. consumers.
Only 28 per cent of respondent farms utilised just one market channel, with the majority of
producers utilising more than one marketing channel for the sale and distribution of their
fish. Several of the respondent farms utilised up to three market channels. The location of
farms appeared to have some impact on the market channels used by farms due to the ability
to access the different market channels. Urban farms, located close to large numbers of
consumers, generally sold fish to retailers or directly to consumers (ie. several urban farms
had a small shop incorporated in the farm). However, rural producers were more likely to be
isolated from consumers and generally sold to wholesalers. Table 27 lists the utilisation of
the various market channels by ornamental fish farms.
Table 27. Percentage of ornamental fish farms using various market channels
Percentage of farms selling to:
State Wholesalers Retailers Export markets Consumers
NSW 87 28 28 43
Qld 67 28.3 43 14
Vic 100 50 0 50
Tas 100 100 0 0
WA 100 75 0 0
The choice of marketing channel is significant for the farmer as it largely determines the
price range of fish. The highest returns are made when farmers sell directly to consumers,
then retailers and wholesalers respectively. However, many farms are not able to take
advantage of the higher prices available through selling direct to consumers as the location of
many farms does not lend itself to retailing ( eg isolated from market). Farmers also face
considerable problems when selling to retail petshops as farmers generally produce a small
116

range of fish (generally between 5 - 10 species) and consequently can only satisfy small
orders from petshops. However, wholesale distributors of ornamental fish and accessories
have a much larger product assortment and have very extensive ranges of species (up to 200
species, pers comm R. Datodi, 1993), therefore the petshops more frequently deal with
wholesalers than with farms. Thus the majority of farms are primarily oriented towards
producing fish for sale through wholesalers rather than for sale to retail operations, as
evidenced by the large percentage of farms utilising wholesalers in their distribution (see
Table 27). However, some producers do market fish directly to retailers and consumers. As
previously indicated, this would largely be determined by the location of the farm with sales
largely determined by access to these markets. Therefore, these two market channels are
most likely only viable to farms near large population centres. At the time of the survey 14
per cent of the farms surveyed were exporting fish, with three of these producers marketing
their fish overseas. The survey data indicate that only Australian native species were
exported, particularly Sceleropages sp. which has very good marketing potential throughout
Asia (pers comm R. Datodi, 1993). Several respondents had been exporting for some time
and receive good prices for their fish, with demand apparently exceeding supply. This is
consistent with Lee's (1991) suggestion of the considerable export potential of Australian
native fish species.
Staff levels. Staffing levels for respondent farms varied from sole part-time operators to 4
full-time and 3 part-time staff. Table 28 lists the number of full and part-time staff employed
on the respondent farms.
Table 28. Staffing of ornamental fish farms in Australia
average no. full-timea State Full-time Part-time workers per farm
NSW 13 5 2.2
Qld 12 4 2
Vic 8 4 2.4
Tas 2 2 3
WA 4 2 1.25
Total 40 17 2
a assumes that 2 part-time workers are equivalent to 1 full-time worker.
117

The majority of farms are owned and operated by family members and these cases make it
hard to identify the exact number of employees working within the industry. However,
based on the data in Table 28 there appears to be at least 57 people currently employed by
the industry on either a full or part time basis. Although no data were collected on wages, it
is suspected that wages in the industry are low, particularly for farms utilising family labour.
The industry is characterised by small family owned and operated farms, with none of the
respondent farms being corporate owned and operated.
Disease issues. Previous studies (Humphrey, 1989; and Treadwell et al, 1992) have
indicated that Australian stocks of ornamental fish are relatively disease free, when compared
to overseas stocks of fish. This study confirms the health and relatively disease-free state of
Australian stocks with very few major disease problems having occurred over the past three
years and the majority of disease incidents being opportunistic in nature. The incidence of
disease for the surveyed farms is as follows: protozoan parasites (30 per cent), flukes (10 per
cent), and bacteria such as Flexibacter sp (15 per cent) and Aeromonas sp (5 per cent).
There has been some concern over goldfish ulcer disease (Aeromonas salmonicida) in
Victoria and Tasmania, with the Tasmanian government limiting importation of goldfish into
Tasmania.
Twenty five per cent of responding farms have recognised the benefits of undergoing Disease
Free Accreditation. Although impossible to establish a completely disease free culture
environment, farmers should be able to maintain clean farms free of any significant exotic
bacterial or viral disease problem such as Aeromonas salmonicida. If certification from a
government body can be attained to testify to the absence of these diseases, it would be an
enormous advantage for farms wanting to export fish to other countries. The accreditation
should also testify to the good health of fish and may offer a competitive advantage when
marketing against uncertified fish.
This relatively disease free status of the Australian ornamental fish industry highlights the
benefits of government departments further encouraging production of ornamental fish in
Australia to replace imported fish. This would reduce the threat of introduction of exotic
diseases to Australian wild and cultured fish populations. Such diseases have the capacity to
118

decimate Australian fish populations if they are introduced here (McKay, 1977; and
Humphrey, 1989).
Ornamental Fish Production. The survey revealed that there is a wide range of ornamental
species currently produced in Australia. Table 29 lists the species of fish produced by
respondent farms.
Table 29. Ornamental fish species currently produced in Australia
Common name Scientific name
Angelfish Pterophyllum seafare
Bristlenose catfish Ancistrus dolichopterus
Corydoras catfish ( 4 species) Corydoras sp
Goldfish Carassius auratus
Koi carp Cyprinus carpio
Guppies Poecilia reticulata
Platys Xiphophorus maculatus
Mollies Poecilia latipinna
Siamese fighting fish Betta splendens
Swordtails Xiphophorus helleri
Walking fish Axolotyl sp
Paradise fish Macropodus opercularis
Danios (2 species) Brachydanio sp
Gouramis (5 species) Trichogaster sp Colisa sp
Saratoga (2 species) Scleropages sp
Rainbows ( 10 species) Melanotaenia sp
Tiger barbs Capoeta tetrazona
Tetras (2 species)
The species listed are generally the more popular 'bread and butter' species that account for
the majority of sales both in Australia and overseas. Although a range of up to 40 species of
ornamental fish is produced in Australia at present, it accounts for only a small proportion of
the ornamental species currently imported into Australia when compared with McKay and
Wharton's (1992) comprehensive list of ornamental species imported into Brisbane (which is
119

indicative of the species currently imported into Australia). This comparison highlights the
vast range of species that are currently not produced in Australia and the opportunities for
further expansion available in the industry for import replacement.
The production of ornamental fish in Australia has increased dramatically over the survey
period, as indicated by the national production figures shown in Table 30. These data
indicate that during the survey period production of respondent farms has doubled to be
worth in excess of$7.7 million for the 1994-95 financial year. This confirms previous
studies' predictions of rapid and significant growth of the industry (Humphrey, 1989;
O'Sullivan, 1991; and Lee, 1991).
Most production has been of temperate species such as goldfish and Koi carp, accounting for
nearly 90 per cent of respondent farms production during 1994 - 95. However, production of
Australian native species and exotic tropical species has experienced large increases in
production, from five per cent of respondent farms production in 1989 - 90 to over 10 per
cent in 1993-94. This highlights the growing importance of tropical species in the industry
during the survey period and it is expected that the production of tropical species will
continue to increase in relative importance.
However, this survey indicates that the level of production of respondents is in fact much
higher than was previously thought for Australia. O'Sullivan (1991) indicates that production
in the 1989- 90 financial year was $849,000 (although estimates are as high as $2 million).
This survey indicates that for the same period production was in excess of $2.2 million. It is
not clear why there is such a marked difference between official production and production
indicated by this survey in Australia. The difference could be due to poor, inconsistent or
lack of record keeping by government departments. It may also be due to incorrect or poor
reporting of production by farms in this survey.
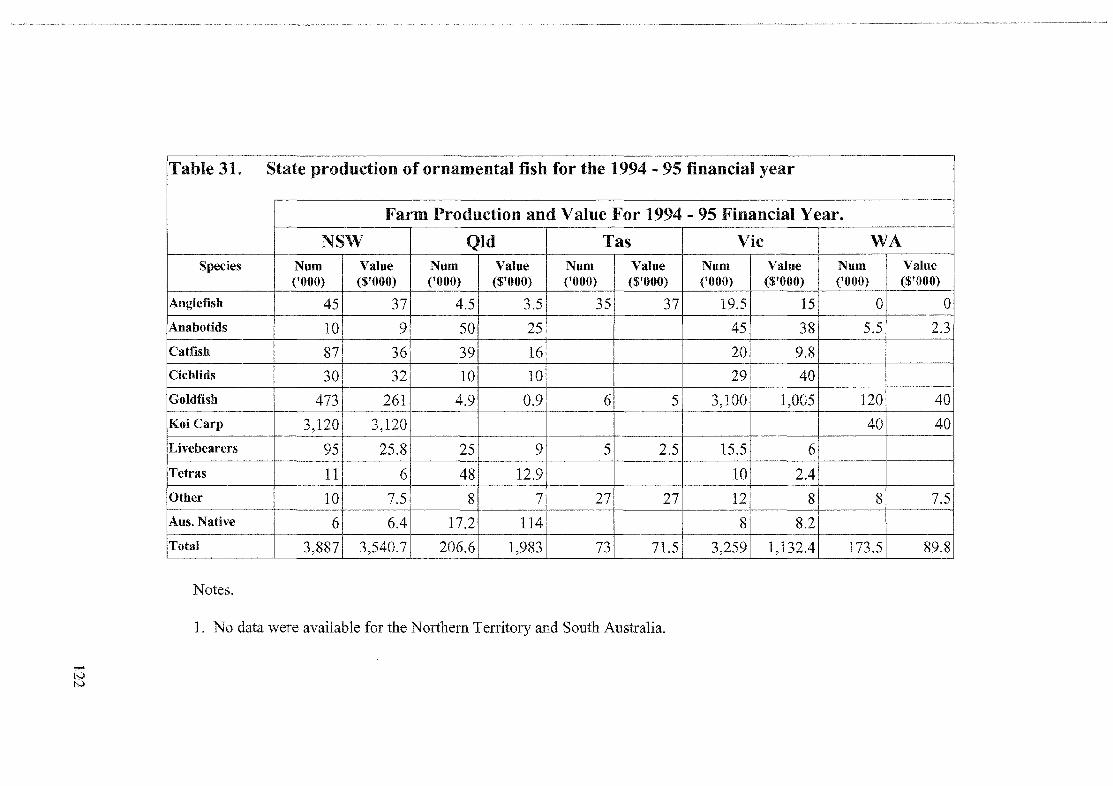
Table 31 lists farm production and value for the 1993 - 94 financial year on a state basis.
These data show that New South Wales is by far the largest producer of ornamental fish
followed by Victoria, Queensland, Western Australia and Tasmania respectively.
120

....... N .......
able 30. Actual and estimated production of surveyed ornamental fish farms in Australia from 1989 - 90 I 1994-95
'ECIES
:tgelfish
:tabotids
Catfish
Cichlids
Goldfish
Gouramis
Koi Carp
Live bearers
Tetras
Other
Aus. Native
Total
1989-90 1990-91 1991- 92 1992-93 1993-94 1994-95
Number Value Number Value Number Value Number Value Number Value Number Value ('000) ($'000) ('000) ($'000) ('000) ($'000) ('000) ($'000) ('000) ($'000) ('000) ($'000)
37 32 90 85 97 95 102.5 98.3 102.5 98.5 104 92.5
nda nda 10 6 27 13 71 39 100.5 65.3 110.5 74.3
10 6 30 18 86 34 102 40.3 159 65.8 146 61.8
30 30 32 31.4 32.8 28.7 36.8 27.1 69 82 79 82
2,525 1,021 2,719 1,072 2,919 1,141 3,268 1,265 3,603.9 1,306.9 3,703.9 1,391.9
nda nda 10 6 27 13 51 25 55.5 27.3 87 56
1,010 I,oto· 2,012 2,012• 2,023 2,023. 2,024 2024. 3,060 3060. 3,260 3260•
258 72 110 35 110 35 100 27 105.5 29.9 140.5 43.3
nda nda nda nda 20 5.4 48 12.9 58 15.3 69 21.3
32 23 13.4 11.1 17.4 14.4 11 8 62 54.5 65 57
17 43 15.9 62.8 19.5 92.2 22.2 105 25.2 116.2 31 128.6
3,919 2,237 5,032.3 3,333.3 5,351.7 3,481.7 5,785.5 3,671.8 7,345.6 4,921.7 7,795.9 5,268.7 ----------------
NOTES
I. a- based on an average value of $1.00 per fish, however prices may be higher than $400 each. 2. nda =no data available (ie. no surveyed farms were producing in that year) 3. 1990 & 1991 actual data.1992 estimated data.1993 predicted data. 4. Where no value of production was given, industry averages were used. 5. Data based on the production of 60 per cent of the farms surveyed. Total production may well be an additional25- 30 per cent per annum to
account for farms not aplying to the survey and small scale backyard production .
,....... N N
Table 31. State production of ornamental fish for the 1994 - 95 financial year
Farm Production and Value For 1994- 95 Financial Year. •
NSW Qld Tas Vic WA Species Num Value Num Value Num Value Num Value Num Value
('000) ($'000) {'000) ($'000) ('000) ($'000) ('000) ($'000) ('000) ($'000)
Angle fish 45 37 4.5 3.5 35 37 19.5 15 0 0
Anabotids 10 9 50 25 45 38 5.5 2.3
Catfish 87 36 39 16 20 9.8
Cichlids 30 32 10 10 29 40
Goldfish 473 261 4.9 0.9 6 5 3,100 1,005 120 40
Koi Carp 3,120 3,120 40 40
Livebearers 95 25.8 25 9 5 2.5 15.5 6 Tetras 11 6 48 12.9 10 2.4
Other 10 7.5 8 7 27 27 12 8 8 7.5
Aus. Native 6 6.4 17.2 114 8 8.2 f---Total '---
3,887 3,540.7 206.6 1,983 73 71.5 3,259 1,132.4 173.5 89.8
Notes.
1. No data were available for the Northern Territory and South Australia.

Production of P. scalare. Production of P. seafare has increased significantly during the
survey period. In 1989- 90 the production of P. seafare was 37,000 tails per annum, valued
at $32,000 however, production had more than doubled by 1994- 95 financial year to
86,000 tails per annum worth over $92,500 (see Table 30). This increase in production is
similar to that experienced by the industry over the same time period.
The number of producers of P. seafare increased from three in 1989-90 to six in 1994- 95,
with new producers being established in Tasmania (one farm) and Queensland (two farms).
During this time one operator in New South Wales ceased production and is currently
moving his fann to Queensland. It is not known whether this operator will continue
producing P. seafare. Farms in Queensland and New South Wales utilise extensive
production techniques with production systems incorporating ponds and large outdoor tanks.
Production of P. seafare by Victorian (indoor glass aquaria) and Tasmanian producers
(indoor recirculating systems) is intensive in nature. Intensive production is used due to the
higher yields possible using intensive culture and enables producers to efficiently utilise
supplementary heating economically. None of the farms producing P. seafare had
experienced any significant disease problems over the survey period and the Tasmanian
producer was undergoing disease free certification.
Farm and industry problems. The problems encountered by ornamental fish farmers in
Australia can be divided into the following points:
1. It was generally felt that many government bodies showed an inexcusable lack of
cooperation, interest or support for the industry. However it should be noted that several
farms had established excellent working relationships with government bodies, particularly
with field officers and disease experts. Other complaints about government departments
included poor management of wild fisheries of Australian native fish, and obstructing the
export of fish.
2. The lack of expertise in ornamental fish culture and fish pathology (particularly by local
veterinarians) in Australia is also cited as a major problem for the industry. Unfortunately
due to the relative infancy of the ornamental fish industry it will be several years before a
123

good base of knowledge and experience in ornamental fish production in Australia is
established.
3. Several farms indicated that ornamental fish culture suffered from poor profitability due
to high labour costs, long payment times (up to 120 days) and the inability to compete
against cheaper imported fish (in particular species such as gouramis, livebearers and several
species of Corydoras catfish). It is suspected that many of the farms reporting poor
profitability are using similar production methods as Asian farmers do (ie extensive pond
culture). In this case, Australian farmers will find it very difficult to compete with Asian
imports due to the relatively higher labour costs associated with producing the fish in
Australia. By adapting more intensive methods of production from mainstream aquaculture,
the relative labour costs can be significantly reduced.
4. Unlike other ornamental fish producing areas overseas (eg Singapore and Florida),
Australia has no industry groups and virtually no co-operation or co-ordination within the
industry. Little or no information is exchanged between farms. Greater co-operation
between commercial breeders is essential for the future success of the industry.
4.2.4 Summary of survey results
The Australian ornamental fish farming industry is currently undergoing a period of
expansion following a long period of pioneering by a relatively small number of producers.
The number of licensed farms has remained static in the period from 1989 - 90 to 1994 - 95
(see Table 23), however production of ornamental fish over the same period has nearly
doubled from $3,919,000 worth in 1989-90 to $7,795,000 in 1994-95 (see Table 30).
The production of ornamental fish in Australia is generally characterised by low technology
extensive farming operations utilising pond culture. The use of high technology intensive
fish culture techniques is isolated to farms in southern states where temperatures do not
favour tropical fish production, particularly in winter. These farms rely on supplementary
heating and intensive production to produce commercial quantities of fish.
124

The frequency of disease outbreaks is low and does not seem to pose a major threat to the
industry at this time. This testifies to the relative disease free status of Australian produced
fish compared to those impmted, and may play a significant role in the marketing of
Australian produced fish. The number of P. seafare produced in Australia has increased over
the survey period, but still does not meet the demand for this species.
The next section provides an analysis of the Australian ornamental fish industry based on the
results of this industry survey and a review of the literature.
4.3 The Australian ornamental fish industry
4. 3.1 Introduction
The ornamental fish industry in Australia is wotth in excess of $300 million per annum
(O'Sullivan, 1991), with over $80 million retail value worth of aquarium fish being sold in
Australia (pers comm R. McKay, 1991). The hobby enjoys similar popularity to other
western countries, with a survey revealing that at least one million hobbyists in Australia
maintain ornamental fish in 10 per cent of households (Mangosi, 1992). Supplying these
hobbyists are over 3,000 retail outlets throughout Australia (Humphrey, 1989), which are
largely supplied by wholesalers who import the majority of fish sold from south-east Asian
farms and wild fisheries (O'Sullivan, 1991). The hobby experienced explosive growth
during the 1970's, however, it has slowed or stabilised its growth since then (McKay and
Wharton, 1992), with demand for ornamental fish expected to grow with increases in
disposable income that people can afford to spend on hobbies and related activities (Treadwell
et al., 1992). Data from the industry survey (see Section 4.2) and Australian Bureau of
Statistics indicate that approximately 15,218,000 ornamental fish were sold in Australia
during 1993- 94, with a cost to wholesalers of approximately $7,642,000.
The Australian ornamental fish industry is oligopolistic in nature, being supplied by relatively
few Australian farms and overseas expmters supplying ornamental fish to Australia and has a
similar structure to that of other western countires (see Section 4.1 ). The industry survey in
this study suggests that a majority of producers sell their fish to wholesalers, however, the
125
survey also indicates that producers may utilise several market channels concurrently for their
fish. The demand for ornamental fish is generally not seasonal and remains fairly constant
throughout the year (pers comm R. Datodi, 1992). Retail petshops therefore require regular
shipments of fish, usually weekly or fortnightly, which in turn means that wholesalers require
regular shipments of fish to maintain their stocks of fish for retail petshops. This is an
important factor that must be considered by producers, who must ensure production and
distribution of fish meets this demand.
Australia offers good opportunities for ornamental fish production. A well-established
infrastructure already exists for the aquaculture industry, with a growing level of expertise in
ornamental fish husbandry techniques (pers comm R. Datodi, 1993). Wholesalers have
developed extensive distribution networks throughout Australia that can be easily accessed by
producers through sale of fish to wholesalers. There is also the continuing need for protecting
Australian fish stocks from imported exotic diseases (Humphrey, 1989). The industry survey
(see Section 4.2) highlighted the relatively disease free nature of Australian stocks of
ornamental fish compared to overseas stocks. Production of ornamental fish is expected to
continue to expand rapidly during the rest of the 1990's and is rated as having good prospects
for the future, with the author predicting that production will exceed $10 million annually by
the end of the decade. This increased production is expected to primarily target import
replacement (O'Sullivan, 1991; and Willis, 1992), although there are some indications that
export of ornamental fish, particularly native Australian species, may also increase (Lee,
1991). Increases in domestic production of ornamental fish should result in a decrease in the
numbers of imports and the chance of importing disease through them.
4.3.2 Imports of ornamental fish
Humphrey (1989) states there are approximately 52 registered importers in Australia, who
operate under Schedule 6 of the Wildlife Protection (Regulation of Exports and Imports) Act
1982. Live fish may be imported from any country, with prior permission from the Australian
Quarantine and Inspection Service, provided that the exporter is approved and registered, and
the species permitted (Schimdt and Love, 1985). The importer must have quarantine premises
that conform to the specifications approved under the Act and the fish must remain in
126

quarantine for not less than 14 days (Schimdt and Love, 1985). The number and value of
imports of ornamental fish into Australia since 1980 - 81 financial year is shown in Table 32.
Table 32. Number of imports of ornamental fish into Australia and FOB value (adapted from Lee, 1991)
Year Number FOB Value Real Valuea ($A) ($A)
1980- 81 9,718,313 1,426,000 3,279,800
1981- 82 9,387,139 1,596,000 3,670,800
1982- 83 8,908,682 1,777,000 4,087,100
1983- 84 9,644,828 1,929,000 4,436,700
1984- 85 8,735,395 1,988,000 4,572,400
1985- 86 8,146,265 2,100,033 4,830,075
1986- 87 7,418,774 2,066,576 4,753,124
1987- 88 6,833,473 1,840,430 4,232,989
1988- 89 6,361,651 1,689,831 3,886,611
1989- 90 7,552,148 2,107,000 4,846,100
1990- 91 7,622,481 2,294,000 5,276,200
1991 - 92 7,593,812 2,385,000 5,485,500
1992- 93 7,268,842 2,438,000 5,607,400
1993- 94 7,872,909 2,720,000 6,256,000
• based on 130% additional costs due to freight, import duties, quarantine
Imports peaked in 1977 - 78 at 11.5 million fish and there has been a gradual decline in the
number of imports since then (Lee, 1991), with data in Table 32 also indicating this gradual
decrease. This gradual decrease can be attributed to the following factors:
1. the tightening of import regulations during 1984 under Schedule 6 of the
Wildlife Protection Act 1982 (Schimdt and Love, 1985). McKay and Wharton
( 1992) state that these requirements led to a significant increase in importation
costs and caused many importers, especially the smaller ones, to cease
operating as the additional costs incurred could not be justified;
2. the decline in the number of species available for importation into Australia.
Several ornamental species were deemed unsuitable for importation under the
127
Act and worldwide shortages of other species has led to fewer species being
available for import (McKay and Wharton, 1992);
3. the increase in production of several species, particularly goldfish and Koi
carp in Australia over this time (O'Sullivan, 1991); and
4. changes in the economic climate. Changes in disposable income levels and
available leisure time decreased over this time due to changes in the economy
(Lee, 1991).
The FOB value of imported fish, listed in Table 32, does not convey the true cost of these fish
to the wholesaler, as several additional cost factors need to be considered to arrive at a
competitive price for fish landed in Australia in a ready-for~sale state. Freight, customs
clearance fees, import tariffs, insurances and documentation costs contribute significantly to
the costs of importing ornamental fish into Australia (O'Sullivan, 1991; and Lee, 1991 ).
Compulsory quarantine requirements, including a minimum quarantine period in Australia of
14 days for importing live fish, add significant cost penalties to the importation of live
tropical fish (Schimdt and Love, 1985). Lee (1991) provides the following additional cost
factors:
1. at least 100 per cent for freight, customs and documentation;
2. at least 12 per cent for labour costs during the compulsory quarantine
period; and
3. at least 18 per cent for mortalities during the compulsory quarantine period.
Therefore to arrive at a realistic value for imported fish, the FOB price must be multiplied by
130 per cent (Lee, 1991). The adjusted 'real value' of imported ornamental fish is shown in
Table 32. These prices are indicative of the potential market worth of farm sales in Australia
if all these imports were produced in Australia. A further issue regarding the value of imports
is that of unit or average price. Australian Bureau of Statistics data indicate that the unit price
of imported fish (based on calculated real value in Table 32) has increased from $0.34 in 1980
- 81 to $0.79. These data confirm indications by Bassleer (1994) and Andrews (1992) who
suggest that the price of ornamental fish on the export market is increasing due to rising
production costs in producer countries. In 1994 the federal government also imposed a 21 per
128

cent wholesale tax on imported fish which must also be incorporated into the price (pers
comm R. Datodi, 1994).
Australian wholesalers currently import fish from a range of countries, with Australian Bureau
of Statistics data indicating that Australian importers have been supplied by at least eight
countries over the past three years (see Appendix D). These data indicate that the majority of
fish imported into Australia originate from South-East Asia, with Singapore and Hong Kong
being the major suppliers. The largest single source is Singapore, the origin of over 58 per
cent offish imported in 1992- 93, followed by Hong Kong, Malaysia, Indonesia, Thailand
and the Philippines. Germany is also a significant source of fish with 1.34 per cent of imports
in 1992-93. The species imported from Germany are generally high value species such as
Discus (Symphosodon discus) that the Germans have specialised in breeding since World War
II (Brown and Gratzek, 1982; and Bassleer, 1994). In fact several temperate European
countries, in particular Germany, the Netherlands and the former Czechoslovakia, are
significant producers for sale throughout the world (Bassleer, 1994).
A major additional source of concern to tropical fish wholesalers and importers is the variable
quality of fish on arrival in Australia. As well as receiving fish of poor colouring or often
poor condition generally, mortalities may be as high as 100 per cent for any batch of fish (pers
comm R. Datodi, 1992). This poor quality of imported fish, in conjunction with the
increasing quality of Australian produced fish, has meant that many Australian importers
have a preference for buying Australian produced fish when quality and value are at least
similar or superior to that of imported fish (pers comm, R. Datodi, 1992). Bassleer (1994)
also cites the local demand for high quality ornamental fish as an opportunity for domestic
producers in western countries. This continuing demand for competitively priced, high
quality ornamental fish by Australian wholesalers is a driving force in the expansion of the
production capacity of Australian farmers. Currently the demand for Australian produced fish
far exceeds demand.
The frequent poor quality of imported fish is generally the result of transportation stress
and/or disease. Diseases are common in such fish and are a major cause of mortality in the
industry (Humphrey, 1989; and Treadwell et al., 1992). This disease aspect is also of great
importance to the rest of the aquaculture industry, as well as commercial and recreational
129
fisheries in Australia. With the numbers of ornamental fish currently imported into Australia,
there is the possibility of introducing diseases from overseas to Australian stocks (Humphrey,
1989). This threat resulted in the imposition of the current quarantine system (Schmidt and
Love, 1985). Treadwell et al. (1992) indicate that Australian stocks of ornamental species are
relatively free of such diseases, and may offer significant competitive advantage over
imported stocks. This is confirmed by the industry survey results and highlights the
opportunity that Australian producers have for replacing imported fish.
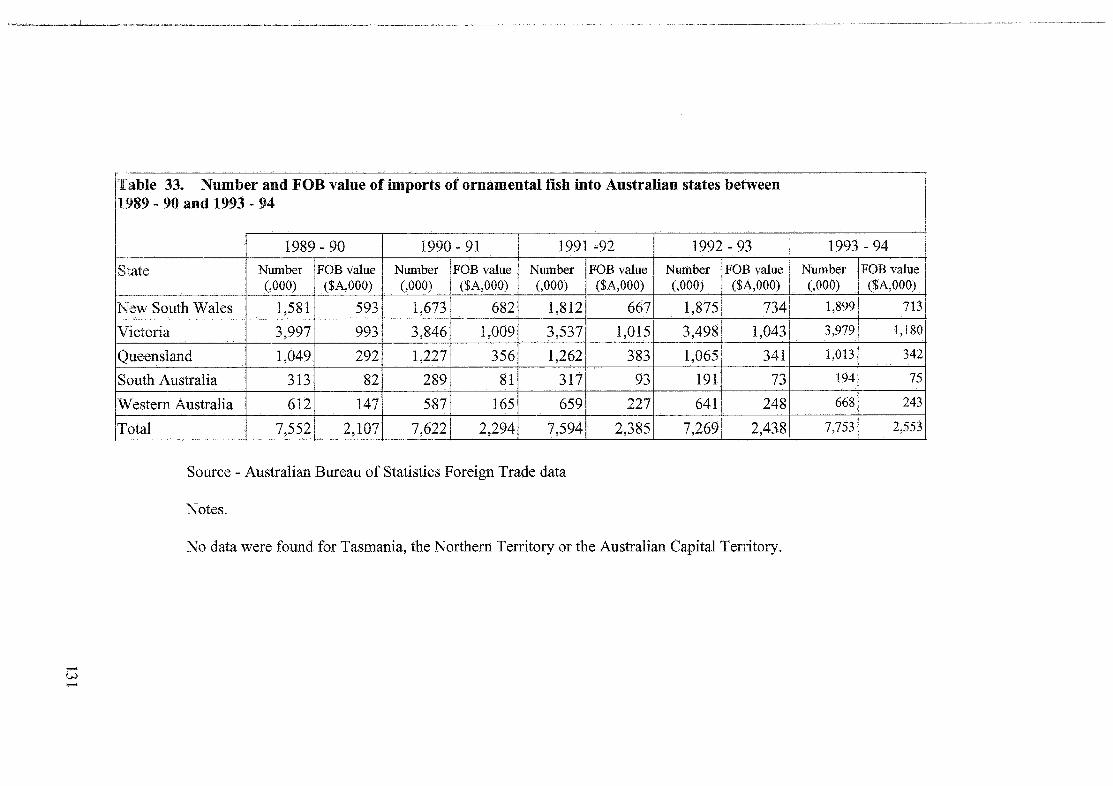
The port of entry for imported ornamental fish into Australia should also be noted. Table 33
lists the numbers of imports of ornamental fish into each state in 1989 - 90 and 1993 - 94.
These state totals are indicative of the numbers through the capital cities of each state and
suggest that Melbourne is the largest port of entry with 51.3 per cent of imports in 1993 - 94.
This confirms industry indications that the majority of ornamental fish imported into Australia
are either sold within Melbourne and Victoria or are distributed throughout Australia by
Melbourne-based wholesalers.
During the period indicated by Table 33, the most marked changes are the number of imports
into South Australia and New South Wales. Imports into South Australia have nearly halved
since 1989-90 to 2.5 per cent, while New South Wales has experienced an increase of3.6
per cent of imports during the same time. Victorian and Queensland have decreased slightly
during the same period to 1. 6 per cent and 0. 7 per cent respectively, while Western Australia
has experienced a slight increase of 0.5 per cent of total imports. These data indicate that the
relative importance of imports for each state has remained fairly stable between 1989 - 90 and
1993 - 94, although small fluctuations are evident each year. Consequently Melbourne
(Victoria) appears to represent the largest market for ornamental fish in Australia, followed by
Sydney (New South Wales), Brisbane (Queensland), Perth (Western Australia), and Adelaide
(South Australia) respectively.
4.3.3 Domestic production
Production of ornamental fish, in most Australian states, must comply with state licensing
requirements, similar to those required for other aquaculture ventures. However, at present
South Australia and the Northern Territory do not require licensing for ornamental fish farms
130
........ VJ ........
'fable 33. Number and FOB value of imports of ornamental fish into Australian states between 1989 - 90 and 1993 - 94
1989- 90 1990- 91 1991 -92 1992-93
State Number FOB value Number FOB value Number FOB value Number FOB value (,000) ($A,OOO) (,000) ($A,OOO) (,000) ($A,OOO) (,000) ($A,OOO)
New South Wales 1,581 593 1,673 682 1,812 667 1,875 734
Victoria 3,997 993 3,846 1,009 3,537 1,015 3,498 1,043
Queensland 1,049 292 1,227 356 1,262 383 1,065 341
South Australia 313 82 289 81 317 93 191 73
Western Australia 612 147 587 165 659 227 641 248
Total 7,552 2,107 7,622 2,294 7,594 2,385 7,269 2,438
Source - Australian Bureau of Statistics Foreign Trade data
Notes.
No data were found for Tasmania, the Northern Territory or the Australian Capital Territory .
1993-94
Number FOB value (,000) ($A,OOO)
1,899 7131
3,979 1,180
1,013 342
194 75
668 243
7,753 2,553
(pers comm Glenn Schipp, 1992). The production of ornamental fish in Australia is a rapidly
expanding area in aquaculture (Treadwell et al., 1992) which is illustrated by the dramatic
increase indicated by the industry survey in this study (see Table 30). This expansion is due
to an increase in the competitiveness of Australian produced ornamental fish against imported
stocks as experienced by other western countries (see Section 4.1 ). As previously indicated
this competitiveness results from lower freight costs and no quarantine costs for domestically
produced fish compared with imported fish, as well as the relative disease free status of
Australian stocks (see Section 4.2). As a result the demand for Australian produced fish
currently exceed supply (Humphrey, 1989).
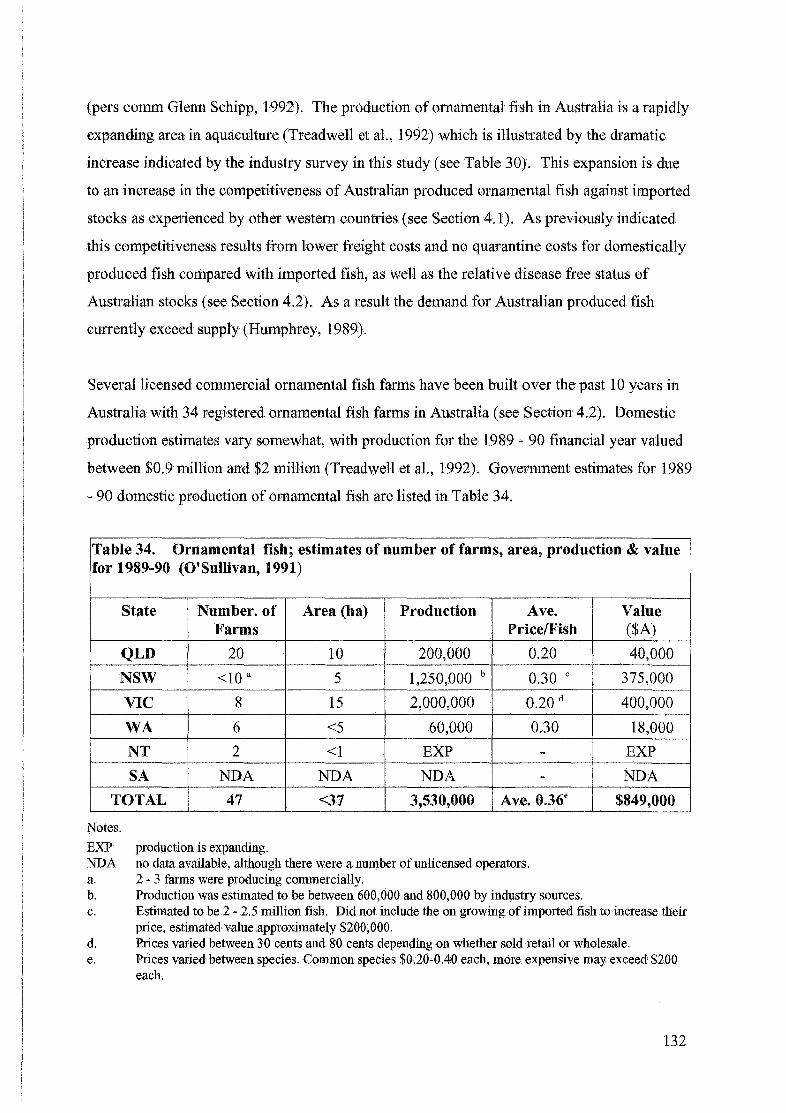
Several licensed commercial ornamental fish farms have been built over the past 10 years in
Australia with 34 registered ornamental fish farms in Australia (see Section 4.2). Domestic
production estimates vary somewhat, with production for the 1989 - 90 financial year valued
between $0.9 million and $2 million (Treadwell et al., 1992). Government estimates for 1989
- 90 domestic production of ornamental fish are listed in Table 34.
Table 34. Ornamental fish; estimates of number of farms, area, production & value for 1989-90 (O'Sullivan, 1991)
State Number. of Area (ha) Production Ave. Value Farms Price/Fish ($A)
QLD 20 10 200,000 0.20 40,000
NSW <10 a 5 1,250,000 b 0.30 c 375,000
VIC 8 15 2,000,000 0.20 d 400,000
WA 6 <5 60,000 0.30 18,000
NT 2 <1 EXP - EXP
SA NDA NDA NDA - NDA
TOTAL 47 <37 3,530,000 Ave. 0.36e $849,000
Notes.
EXP production is expanding. NDA no data available, although there were a number of mllicensed operators. a. 2- 3 farms were producing commercially. b. Production was estimated to be between600,000 and 800,000 by industry sources. c. Estimated to be 2 ~ 2.5 million fish. Did not include the on growing of imported fish to increase their
price, estimated value approximately $200,000. d. Prices varied between 30 cents and 80 cents depending on whether sold retail or wholesale. e. Prices varied between species. Common species $0.20-0.40 each, more expensive may exceed $200
each.
132
However, research from this study indicates that domestic production may in fact be much
higher than these official estimates indicate. Table 30 lists production of respondent farms in
Australia between 1989 • 90 and 1993 - 94 and indicates that the value of production for 1989
- 90 indicated is similar to industry estimates, as indicated by O'Sullivan (1991), at
approximately $2 million. The value of production indicated by government sources in Table
34 therefore represents less than half of actual production of the 1989 - 90 financial year,
indicating that the industry is much larger than government departments realise. There is also
an unknown number of hobbyists producing ornamental fish in Australia for sale, although the
numbers and value of this production are not known industry sources estimate the figure to be
approximately 500,000 tails per annum valued at $500,000 (0' Sullivan 1991).
The majority of the commercially produced ornamental fish in Australia are goldfish and Koi
carp, accounting for at least two thirds of domestic production, however the importance of
native species and tropical species has grown significantly over the last five years (see Section
4.2.3). The survey also indcates that over 40 species of ornamental fish are currently
produced commercially in Australia (see Table 29).
Estimates for Australian production for 1994-1995 were set at approximately $10 million
(O'Sullivan, 1991) however the survey results from this study indicate that production for
1994- 95 was valued at only $5,268,700. This poor performance compared to predictions
may be due to the continuing recession during the early 1990's resulting in a reluctance of
farmers to invest more capital into production facilities and fewer new producers setting up in
the uncertain economic climate. However, the survey suggests continuing growth in
production capacity of these farms over the next few years. As well there are currently
several new farms being set up in Queensland, South Australia and New South Wales (pers
comm R. Datodi, 1994).
Treadwell et al. (1992) and Lee (1991) cite the ability to supply competitively priced,
consistent, large shipments of ornamental fish as essential for establishing and maintaining
export markets. At present, few farms are able to do this and the current industry structure
may need to change in order to achieve this (Treadwell et al., 1992), with the industry survey
indicating that 14 per cent of farms in 1994 - 95 were exporting native species of fish. It is
expected that the number of farms exporting fish will continue to grow largely due to the
133

opportunities open for the production of Australian native fish for export markets (Lee,
1991), and at the time of the survey 14 per cent of farms were exporting these species.
The industry currently faces a variety of problems, many of which are characteristic of a
pioneering stage of industry development. These problems, highlighted by the industry
survey are:
1. lack of expertise;
2. difficulty in attaining finance;
3. lack of industry standards, benchmarks and co-operation; and
4. legislative inconsistencies between states, restrictions on species in some
states.
In summary, there appears to be significant potential for farmers to produce high quality
reliable supplies of ornamental fish in Australia for import replacement. These opportunities
are evidenced by the large increases in production of ornamental fish over the past 5 years.
The following section gives a brief analysis of a consumer profile of Australian hobbyists.
4.3.4 Consumer profile
As previously indicated, farmers primarily sell their fish to intermediaries in the market
channel rather than directly to consumers. As such some comment on Australian consumers
of ornamental fish is warranted here. To date there has been little work done on consumer
profiles of ornamental fish keepers in Australia. The following profile has therefore been
developed from anecdotal evidence as well as previous studies into the industry.
Mangosi (1992) indicates that fish are really a hobby as the whole fish tank is the focus
rather than individual fish and therefore are not strictly classed as pets. The emotional
attachment that owners may develop for fish should not be overlooked (Humphrey, 1989)
particularly for larger long lived fish such as cichlids and Koi carp. As previously mentioned
consumers generally prefer fish that are brightly coloured and in good health (see Section
4.1 ). Cost is also an important factor in consumer preferences, with a core of popular species
largely comprised of the cheap 'bread and butter' fish that generally retail for between $2.00
134

and $6.00 each. This core of approximately 20 species of ornamental fish account for around
80 per cent of sales (Humphrey, 1989). More expensive fish may retail for more than
$1,000 each but sales are limited.
The popularity of the hobby has remained relatively constant since the late 1970's. Estimates
for participation rates range from 11 per cent of households in Australia (Humphrey, 1989)
to 10 per cent of Australian households, representing about 0.6 million of households in 1992
(Mangosi, 1992). The participation of household members in the hobby, indicated by a
survey in Sydney conducted by retailers, varies from all members to just one member with an
average of just under two members of the household (Halliwell and Halliwell, 1991). These
figures tend to support industry estimates of approximately one million hobbyists in Australia
(O'Sullivan, 1991) and also suggest that the keeping of ornamental fish may be a family
activity in many cases. Halliwell and Halliwell (1991) also indicate that the majority of
hobbyists were involved in the hobby long term with 60 per cent in the hobby for more than
one year and 20 per cent for 10 to 20 years (Halliwell and Halliwell, 1991). The number of
tanks per household varies between one and 300, with an average of approximately four
(Halliwell and Halliwell, 1991). It is suspected that this average has been biased by the
household with 300 tanks, which is likely to be a farm, and the average is therefore likely to
be lower than two tanks per household.
It is hard to classify ornamental fish keepers into a specific socio-economic category due to
the substantial popularity that the hobby enjoys. Industry sources indicate that younger
people and families are more involved, with the participation level decreasing in older people
(55+ years), however, more data are needed to confirm these indications. Consumers can be
divided into three broad categories, casual, long term and serious hobbyists.
Casual hobbyists are generally new or inexperienced in the hobby and Halliwell and
Halliwell (1991) indicate that 38.2 per cent of hobbyists had been keeping ornamental fish
for less than one year and are likely to fit into this category. Casual hobbyists are likely to
have little understanding of the basic biological principles involved in maintaining fish in
aquaria and are therefore likely to experience problems in maintaining fish. The casual
hobbyist therefore needs guidance in the purchase of fish and equipment and largely relies on
the expertise and advice of pet shop owners in the purchase decision. They are most likely to
135

be disillusioned when fish die and may quit if they suffer too many losses. These hobbyists
therefore need simple, easy to follow care and maintenance instructions
The casual hobbyist is likely to purchase a beginners tank (ie. small, basic cheap tank) and it
would be highly unlikely that they would have more than one tank in the household. They
would most likely establish a community tank, with no particular theme, and would select
fish on aesthetic appeal and price. They are likely to spend less money on equipment and
fish than the other two categories, and would tend to purchase the 'bread and butter' species.
The long term hobbyist is characterised by being involved in the hobby for more than one
year and would most likely make up a larger proportion of participants in the hobby.
Halliwell and Halliwell (1991) found that 56 per cent of hobbyists had been keeping fish
between 1 and 20 years, which is likely to be a good indicator of the size of this segment.
The long term hobbyist is very loyal, highlighted by a retailers survey that found that 18 per
cent ofhobl!>yists have been keeping fish for 10- 20 years (Halliwell and Halliwell, 1991).
As a consequence they are considerably more experienced than casual hobbyists, as well as
having a better understanding of the basic principles of fish keeping. They are also likely to
be less disillusioned by losing fish and will try to identify and rectify problems. The long
term hobbyist is likely to spend more money than casual hobbyists and may have more than
one tank in the household.
Serious hobbyists are generally people with several years' experience in the hobby, are
well-informed and may even have technical training. They are likely to have a good
understanding of the biological principles of keeping fish and are less likely to experience
problems in maintaining fish. They are likely to be a member of a local fish breeding society
and may enter fish in shows etc. It is difficult to determine the importance of this category,
however, Halliwell and Halliwell (1991) found that 7.8 per cent of respondents were
members of societies and as it is likely that serious hobbyists are members of societies, this
category may be 7.8 per cent of the total.
Serious hobbyists are likely to attempt breeding different species of ornamental fish and may
produce a small number of fish which may be sold or swapped. It is suspected that they
136
achieve great pride and sense of achievement in breeding fish, particularly those species that
are hard to breed. As they breed fish, they probably have more than one tank in the
household, and some hobbyists may dedicate whole rooms to breeding and keeping
ornamental fish. They would tend to spend more money on fish and equipment and are more
likely to establish theme tanks or biotopes, set up to imitate natural ecosystems (ie Amazon
river, African Rift Lake), and to purchase species that are more unusual, rare and expensive.
As they are generally well informed, they are highly selective and shop around with quality
being a very important factor.
The following section is a more specific market analysis focusing on the P. sea/are segment.
43.5 The Australian P. scalare market
As previously discussed an example of an ornamental fish species with good culture potential
in Australia is P. sea/are (see Section 1.4). This potential arises from the international
shortage of this species and the high market demand in Australia (Lambourne, 1991; and
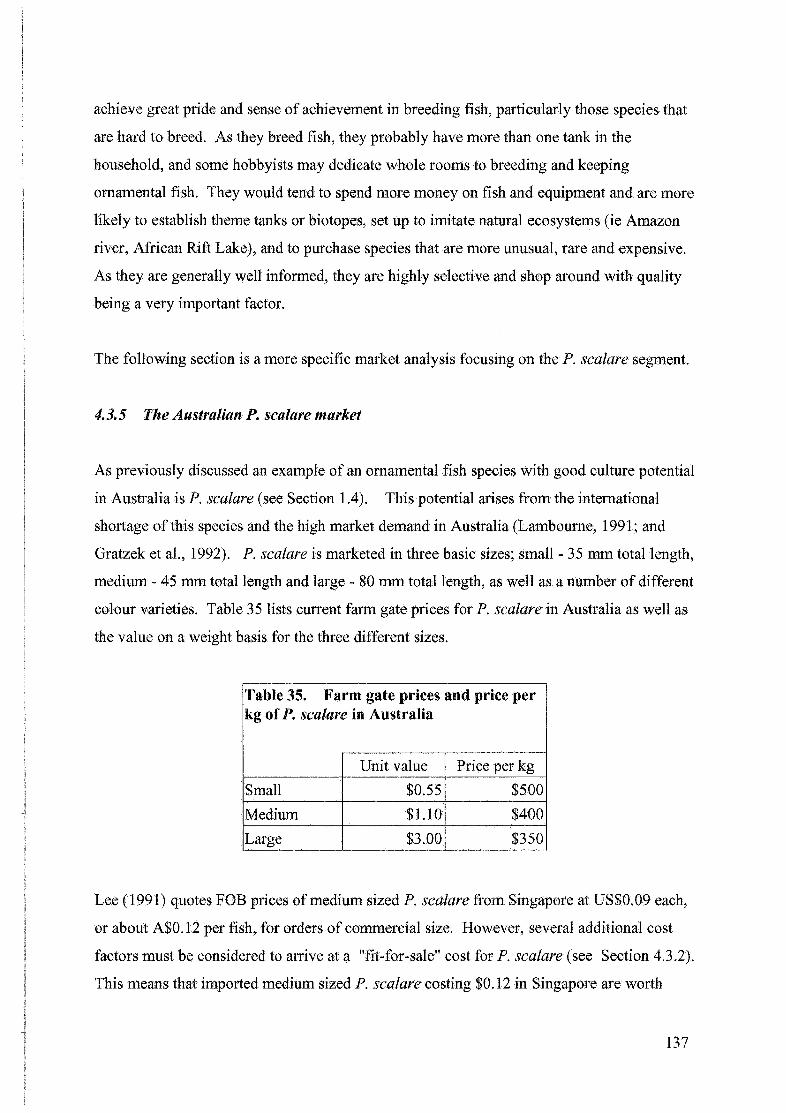
Gratzek et al., 1992). P. sea/are is marketed in three basic sizes; small- 35 mm total length,
medium - 45 mm total length and large - 80 mm total length, as well as a number of different
colour varieties. Table 35 lists current farm gate ptices for P. sea/are in Australia as well as
the value on a weight basis for the three different sizes.
Table 35. Farm gate prices and price per kg of P. scalare in Australia
Unit value Price per kg
Small $0.55 $500
Medium $1.10 $400
Large $3.00 $350
Lee (1991) quotes FOB prices of medium sized P. sealare from Singapore at US$0.09 each,
or about A$0.12 per fish, for orders of commercial size. However, several additional cost
factors must be considered to anive at a "fit-for-sale" cost for P. sea/are (see Section 4.3.2).
This means that imported medium sized P. sea/are costing $0.12 in Singapore are worth
137
approximately $1.10 after the additional cost factors are added (pers comm R. Datodi, 1992).
These prices largely determine the farm gate prices farmers receive from Australian
wholesalers, when the quality of Australian produced fish are similar to that of imported fish.
The potential of P. sea/are culture as a profitable aquaculture species is highlighted by the
value of this species on a weight basis. Bassleer (1994) indicates that ornamental fish are
generally wm1h considerably more than food fish and ornamental fish can be worth in excess
of 100 times more per kilogram than food fish. P. sea/are is no exception and the farm gate
prices of P. sea/are shown in Table 35 indicate that on a weight basis, it is a significantly
higher priced species when compared to other aquaculture species in Australia ( eg. Atlantic
salmon worth $15 per kg, pers comm. G. Allen, 1995). Therefore if a large enough level of
production and market can be attained for P. sea/are, it is a potentially very lucrative species.
Market size. There are very little data available on the number of P. seafare sold in
Australia. Import statistics for individual species are not available from the Australian
Bureau of Statistics, therefore market estimates must be based on industry sources. The
firm Pet and Aquarium Industries Pty Ltd is the largest single importer of fish in Australia,
importing approximately 30 per cent of the fish imported into Australia. The remaining 70
per cent of imports are imported through the remaining 51 licensed importers. Annual sales
of P. seafare for Pet and Aquatium Industries Pty Ltd are shown in Table 36.
Table 36. Annual sales of P. sea/are by Pet & Aquarium Industries Pty Ltd for 1993-94
Size Number Farm gate Value
Small 60,000 $33,000
Medium 40,000 $44,000
Large 6,600 $19,800
Total 106,600 $96,800
(Source: pers comm R. Datodi, 1994)
Assuming these sales account for approximately 30 per cent of the Australian market for P.
seafare, the total market size would be approximately 355,117 fish per year. Industry
138

sources indicate that these figures would be increased if a greater range of sizes and
particularly colour varieties were made available (pers comm R. Datodi, 1994). Table 37
lists the estimated size and value of the market for P. scalare in Australia, based on this
assumption.
Table 37. Estimated annual number and value of sales of P. seafare in Australia for 1993- 94
Number Price Value
Small 199,800 $0.55 $109,980
Medium 133,320 $1.10 $146,652
Large 21,995 $2.80 $61,591
Total 355,115 $318,223
At these estimated level of sales the P. sea/are segment accounts for approximately 2.3 per
cent of the 15,217,509 ornamental fish sold in Australia in 1993-94 (based on imported fish
and domestic production from the industry survey). Indications are that the P. scalare
market is fairly stable in size, with future growth increasing proportionally with population
growth in Australia (pers comm R. Datodi, 1993).
Within these segments a number of potential customers have been identified, based on the
directory of wholesalers and distributors listed in Anon ( 1994). The number of wholesalers
identified is Queensland- 6, New South Wales- 12, and Victoria- 7.
Domestic production of P. scalare. Production figures for individual species are not
available from the state fisheries departments, however an estimate of the level of domestic
production of P. scalare can be made from the production data gained through the industry
survey canied out in this study. Table 381ists the estimated production of P. seafare in
Australia for the 1994- 95 financial year.
139

Table 38. Production of P. seafare in Australia for the year 1994-95
State Product Number
Tasmania medium size only 35,000
New South Wales all sizes 45,000
Victoria small size only 19,500
Queensland all sizes 4,500
Total 104,000
There is also an unknown number of P. seafare produced by unlicensed producers and
hobbyists throughout Australia. Industry sources indicate that approximately 10,000 P.
seafare of various sizes would be produced per annum by these producers. The remainder of
the estimated 355,000 P. seafare sold in Australia per annum would be sourced from
imported stocks.
At present supplies of P. seafare by Australian producers are generally inconsistent in
numbers and quality, with only one producer, Tasmanian Ornamental Fish Farm, supplying
P. seafare to the market in a regular consistent manner (pers comm R. Datodi, 1993).
Segmentation of P. seafare market. As with consumer markets, business markets can be
segmented on a range of variables (Patti et al., 1991; Stanton et al., 1994; and Hutt and Speh,
1995). Patti et al. (1991) suggests the following variables as the major variables used in
segmentation:
1. type of economic activity;
2. geographic location;
3. size of buying l)rganisation; and
4. usage of product.
Producers tend to use geographic segmentation by default due to cost efficiencies in
production rather than for sound marketing reasons. Thus, marketing by producers of
P. seafare and ornamental fish in general has to date generally been unsophisticated and
haphazard in nature. By targeting geographically close market segments, producers are able
140
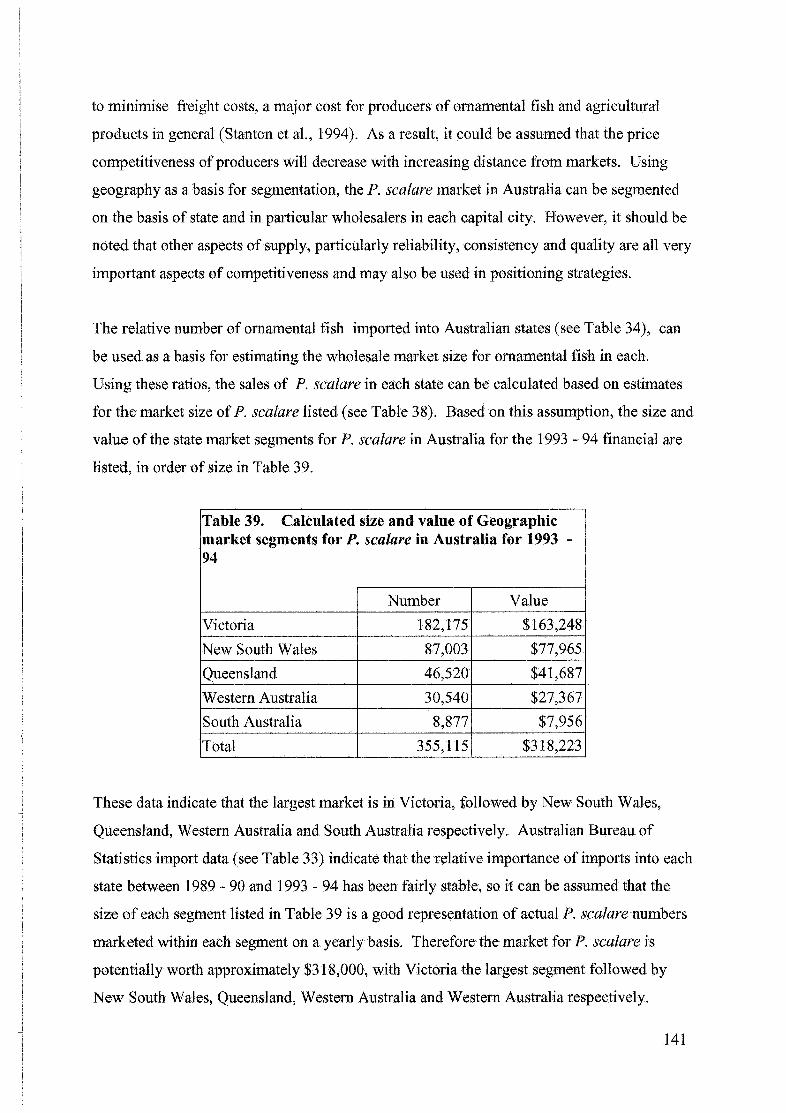
to minimise freight costs, a major cost for producers of ornamental fish and agricultural
products in general (Stanton et al., 1994). As a result, it could be assumed that the price
competitiveness of producers will decrease with increasing distance from markets. Using
geography as a basis for segmentation, the P. seafare market in Australia can be segmented
on the basis of state and in particular wholesalers in each capital city. However, it should be
noted that other aspects of supply, particularly reliability, consistency and quality are all very
important aspects of competitiveness and may also be used in positioning strategies.
The relative number of ornamental fish imported into Australian states (see Table 34), can
be used as a basis for estimating the wholesale market size for ornamental fish in each.
Using these ratios, the sales of P. seafare in each state can be calculated based on estimates
for the market size of P. seafare listed (see Table 38). Based on this assumption, the size and
value of the state market segments for P. seafare in Australia for the 1993 - 94 financial are
listed, in order of size in Table 39.
Table 39. Calculated size and value of Geographic market segments for P. scalare in Australia for 1993 -94
Number Value
Victoria 182,175 $163,248
New South Wales 87,003 $77,965
Queensland 46,520 $41,687
Western Australia 30,540 $27,367
South Australia 8,877 $7,956
Total 355,115 $318,223
These data indicate that the largest market is in Victoria, followed by New South Wales,
Queensland, Western Australia and South Australia respectively. Australian Bureau of
Statistics import data (see Table 33) indicate that the relative importance of imports into each
state between 1989 - 90 and 1993 - 94 has been fairly stable, so it can be assumed that the
size of each segment listed in Table 39 is a good representation of actual P. seafare numbers
marketed within each segment on a yearly basis. Therefore the market for P. seafare is
potentially worth approximately $318,000, with Victoria the largest segment followed by
New South Wales, Queensland, Western Australia and Western Australia respectively.
141

The following section details specific information on target markets, competitors and an
analysis of the strengths, weaknesses, opportunities and threats ,(SWOT analysis) for a
fictitious farm producing P. seafare in an intensive indoor culture facility.
4.4 Target markets, competitive analysis and SWOT for Tas Angels
The following section introduces a fictitious enterprise, Tas Angels, that will be used to
illustrate the design, operation, marketing and potential for the planned development of an
indoor, intensive P. seafare farm based in Launceston, Tasmania. A SWOT analysis for Tas
Angels is also provided.
4.4.1 Description ofTas Angels
Tas Angels will be based in Launceston, Tasmania, on approximately 0.25 hectares of land
supplied with all utilities (ie. water, electricity and telephone). Launceston is serviced by an
airport with regular daily flights to the major market centres previously identified in Section
4.3.5. Support services for aquaculture include suppliers for plant and equipment needs,
research support through the local university and fish pathology services through government
agenc1es.
It is proposed that the culture facilities of Tas Angels will be housed in a building
constructed of composite panelling, as used for freezer rooms, with insulated floors to
provide for maximum heat retention and thus good environmental control with minimal heat
loss. A suitably insulated building, such as this, offers many benefits over outdoor culture
facilities for culture of tropical species in temperate climates, and significantly decreases
heating costs (Brown and Gratzek, 1982; Stickney, 1994). The main benefit is the ability to
control the culture environment and maintain optimal conditions throughout the year
(Stickney, 1994; and Thacker and Griffin, 1994).
If the environment can be maintained close to optimal for growth of the cultured species, the
farmer is able to produce fish all year round without seasonal fluctuations (Stickney, 1994).
In contrast, the use of outdoor ponds (as is the case for most farms in Queensland, and New
South Wales) allows little opportunity for disease monitoring, allows little or no
142

environmental control and therefore less than optimum growth for parts of the year.
Therefore Tas Angels will be able to produce P. seafare year-round in a precisely controlled
environment.
Culture systems utilised at Tas Angels rely heavily on intensive recirculating system
technology to provide maximum environmental control and productivity. These systems and
their operation are based on methods and the results of experiments conducted as part of this
study, as well as those detailed in the literature and from experiences of commercial
producers. The design and operation of the proposed culture systems is discussed in more
detail in Chapter 5.
4.4.2 Target markets
There is a good opportunity for Australian producers to produce ornamental fish for import
replacement ( 4.3.5). By targeting import replacement, producers minimise competition with
other Australian producers enabling them to concentrate on production for import
replacement. Approximately two thirds of P. seafare sold in Australia are imported (see
Section 4.3.5), therefore in targeting import replacement the potential market size is
approximately 251,000 tails per annum. Cosnequently, Tas Angels will be designed and
constructed with a production capacity of251,000 tails per annum.
As discussed in Section 4.3.5, the P. seafare market can be divided into segments based on
geographic location of wholesalers, although this basis is used by most producers by default
dl,le to cost efficiencies in accessing geographically close markets. Five possible segments
have been identified in the Australian P. seafare market (see Table 39) however, when
considering size of and proximity to markets, it appears that a Tasmanian based farm would
have only three segments available to it for the following reasons:
1. the South Australian market is estimated to be around 9,000 tails per annum,
and it is considered that this market is not viable due to the small size and
relatively high access costs; and
2. while the Western Australian market is considerably larger at approximately
30,500 tails per annum, transport difficulties and costs are prohibitive.
143

Thus, Tas Angels is left with three market segments, viz. Melbourne, Sydney and Brisbane.
The size and value of these segments are listed in Table 40.
Table 40. Size of target segments for import replacement of P. scalare in Australia for 1993 - 94
Victoria New South Wales Queensland
Size Number Value Number Value Number Value
Small 77,500 $42,625 $23,521 $12,936 21,551 $11,853
Medium 33,393 $36,732 $15,751 $17,326 17,445 $19,189
Large 11,284 $36,108 $2,469 $7,900 2,884 $9,228
Total 122,177 $115,4661 41,741 $38,163 41,880 $40,270
Initially, the most suitable target segment for Tas Angels would be the Victorian segment for
the following reasons:
1. the Victorian market is closest to Launceston with relatively cheap and
reliable access to this market via daily air links;
2. the Victorian market is the largest market segment in Australia (see Table 36)
and therefore offers the greatest opportunity for sales and growth;
3. the Victorian market has the lowest number of competitors of the segments
(see Section 4.3.5); and
4. there is a large number of major importers based in Melbourne
compared with other states in Australia and therefore more potential clients if
import replacement is targeted.
The New South Wales and Queensland segments may also offer good opportunities for Tas
Angels, each with potential sales of approximately $40,000 per annum. However, New
South Wales and Queensland will have a much higher freight cost than Victoria and thus
may be less profitable. Therefore as a greater market share is achieved and consolidated by
Tas Angels in the Victorian market, the New South Wales and then Queensland markets
could be progressively targeted. Based on the potential size of the target segments detailed in
Table 39 the production level Tas Angels is listed in Table 41.
144
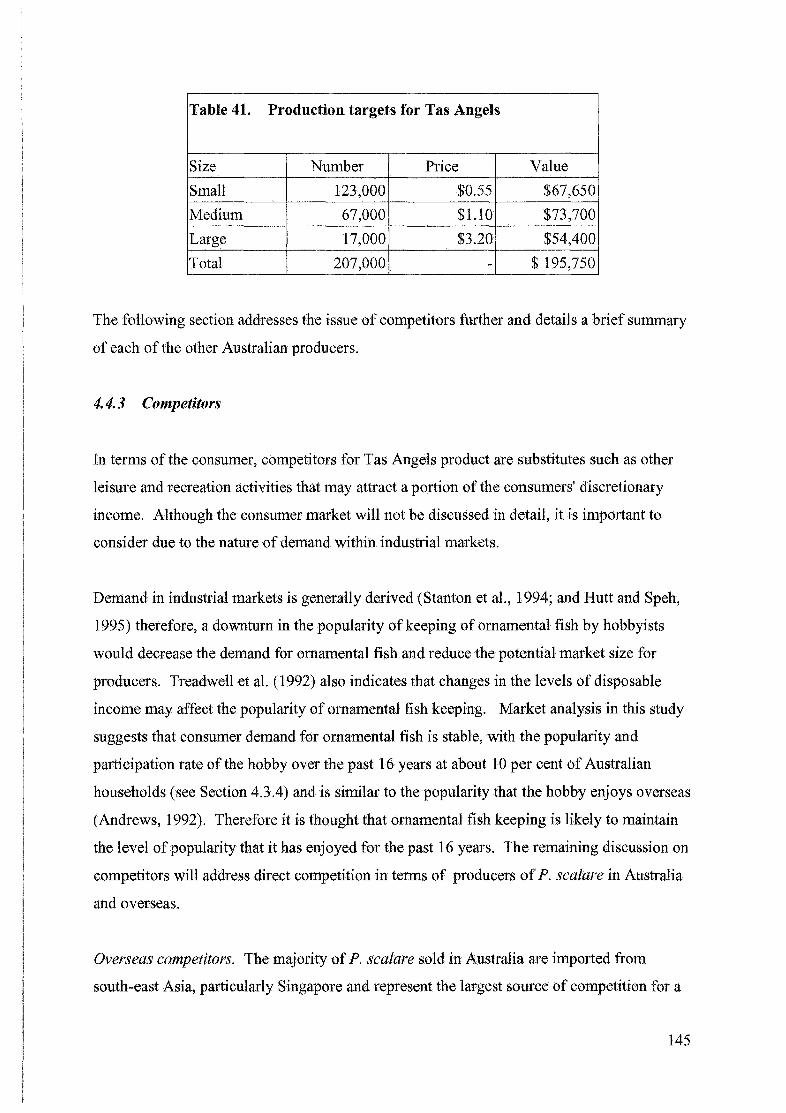
Table 41. Production targets for Tas Angels
Size Number Price Value
Small 123,000 $0.55 $67,650
Medium 67,000 $1.10 $73,700
Large 17,000 $3.20 $54,400
Total 207,000 - $ 195,750
The following section addresses the issue of competitors further and details a brief summary
of each of the other Australian producers.
4. 4. 3 Competitors
In terms of the consumer, competitors for Tas Angels product are substitutes such as other
leisure and recreation activities that may attract a portion of the consumers' discretionary
income. Although the consumer market will not be discussed in detail, it is important to
consider due to the nature of demand within industrial markets.
Demand in industrial markets is generally derived (Stanton et al., 1994; and Hutt and Speh,
1995) therefore, a downturn in the popularity of keeping of ornamental fish by hobbyists
would decrease the demand for ornamental fish and reduce the potential market size for
producers. Treadwell et al. (1992) also indicates that changes in the levels of disposable
income may affect the popularity of ornamental fish keeping. Market analysis in this study
suggests that consumer demand for ornamental fish is stable, with the popularity and
participation rate of the hobby over the past 16 years at about 10 per cent of Australian
households (see Section 4.3.4) and is similar to the popularity that the hobby enjoys overseas
(Andrews, 1992). Therefore it is thought that ornamental fish keeping is likely to maintain
the level of popularity that it has enjoyed for the past 16 years. The remaining discussion on
competitors will address direct competition in terms of producers of P. seafare in Australia
and overseas.
Overseas competitors. The majority of P. seafare sold in Australia are imported from
south-east Asia, particularly Singapore and represent the largest source of competition for a
145

new farm entering the Australian P. seafare market. However, Australian wholesalers have
experienced problems in the quality and reliability of imported P. seal are recently (see
section 4.3.5).
Therefore, due to the real cost of "fit-for-sale" fish (see section 4.3.5) and problems
associated with importing P. seafare, Australian wholesalers generally give preference to
Australian produced fish. The competitiveness of Australian produced P. scalare could be
maintained by establishing and maintaining the following competitive advantages over Asian
suppliers:
1. Quality. Fish must be of high quality and excellent health. Fish must also
suffer significantly lower mortality and morbidity rates than imported stocks.
2. Variety. Producers must be able to supply a wide selection of different colour
and fin varieties. It is anticipated that Tas Angels will be able to supply a
greater range of varieties in a much healthier state than is currently available
in Australia. It is also anticipated that this range of varieties will be expanded
as a result of continuing selective breeding.
3. Disease Free Status. There are moves by Federal and State governments to
further restrict imports of aquarium fish into Australia for fear of importing
exotic diseases that could devastate populations of Australia's native and
cultured fish.
4. Responsiveness to market. It is anticipated that Australian producers would
be much more responsive to the Australian market than others overseas due to
the closer proximity with the market place.
Australian producers. Data from the industry survey discussed in section 4.2 indicate that
currently there are four significant producers of P. scalare in Australia. The following
paragraphs provide a brief summary of information on Australian competitor producers
gained through industry sources and the industry survey data from Section 4.2.
Tasmanian Ornamental Fish Farm is currently producing a variety of species including P.
seafare. To date production has been approximately 600 medium sized marketed per week.
However, recent expansion of production capacity will result in increases in production of a
146

variety of species. This producer is currently producing P. seafare of reliable and consistent
quality for the Melbourne market.
A Melbourne based farm is currently producing P. seafare at the rate of approximately 500
small P. seafare per week. This farm also produces several other species of fish and mainly
supplies Melbourne pet shops. At present there is no indication that this farm is intending to
increase production significantly.
Queensland Tropical Fish, based in Brisbane, supplies between 2,000- 5,000 P. seafare per
year to wholesale and retail operations in Brisbane. The production of this farm is oriented
to other species of fish, such as Australian Native Species. It is not known whether this farm
will expand production in the near future.
The remaining farm, Bringelly Fish Hatchery, produces fish of variable quality in
inconsistent numbers (pers comm Rick Datodi, 1993). This farm is currently based near
Sydney, but is being moved to Queensland. It is not known if the production of P. sealare
will be expanded, however little competition is expected over the next 18 months to two
years while moving and re-establishing production facilities. It should also be noted that by
moving to Queensland this farm will experience increased freights costs to the major
wholesalers in Victoria, thus increasing their costs in accessing the Victorian market. This
will also reduce the cost of Bringelly Fish Hatchery in accessing the Queensland market.
New Australian competitors entering the market need to go through a period of development
before any significant production of P. seafare can begin. During this period production
facilities need to be constructed and commissioned, and sufficient broodstock to produce
commercial quantities of P. seafare need to be attained and conditioned for breeding. It is
highly unlikely that large numbers of high quality P. seafare broodstock would be available
in Australia, therefore juvenile fish would need to be purchased and grown to sexual maturity
(ie. 9- 12 months old). Once breeding commenced there would still be a significant lag
period of up to 5 months before saleable product was available. Time would also be needed
for the farm operators to gain experience and proficiency in breeding and production of
these fish if this experience is not already available; therefore a development period of 18
147
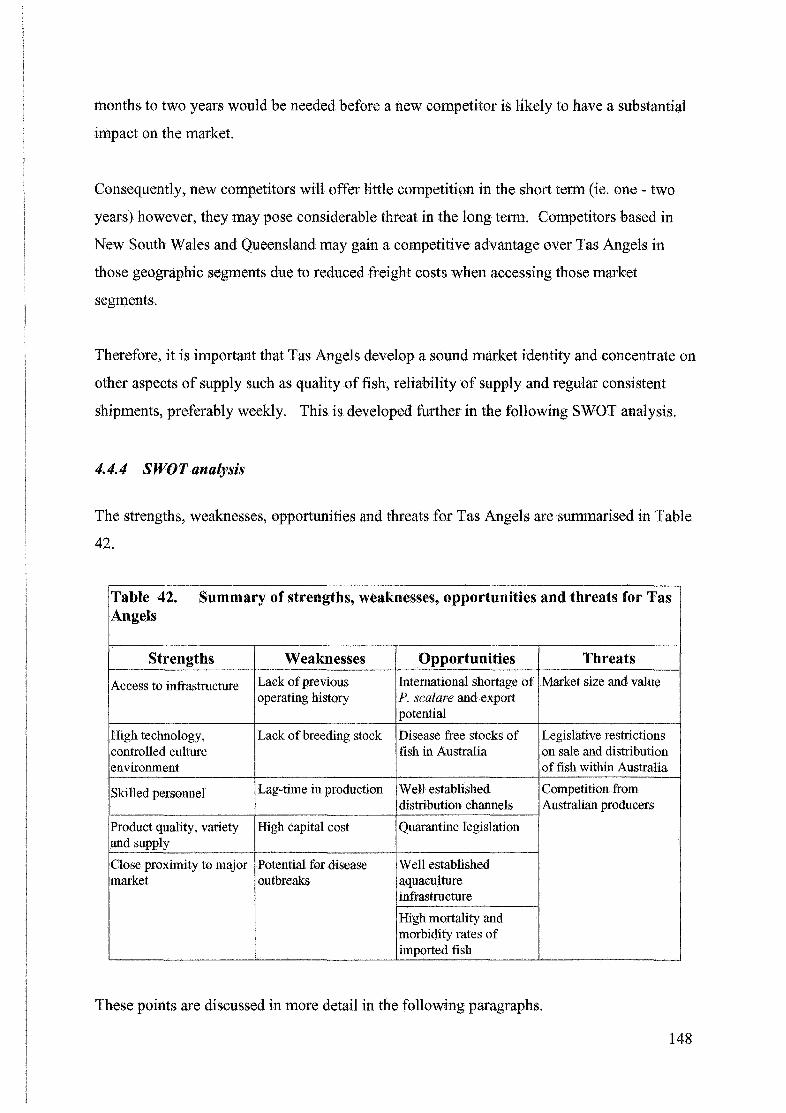
months to two years would be needed before a new competitor is likely to have a substantial
impact on the market.
Consequently, new competitors will offer little competition in the short term (ie. one- two
years) however, they may pose considerable threat in the long term. Competitors based in
New South Wales and Queensland may gain a competitive advantage over Tas Angels in
those geographic segments due to reduced freight costs when accessing those market
segments.
Therefore, it is important that Tas Angels develop a sound market identity and concentrate on
other aspects of supply such as quality of fish, reliability of supply and regular consistent
shipments, preferably weekly. This is developed further in the following SWOT analysis.
4.4.4 SWOT analysis
The strengths, weaknesses, opportunities and threats for Tas Angels are summarised in Table
42.
Table 42. Summary of strengths, weaknesses, opportunities and threats for Tas Angels
Strengths Weaknesses Opportunities Threats
Access to infrastructure Lack of previous International shortage of Market size and value operating history P. sea/are and export
potential
High technology, Lack of breeding stock Disease free stocks of Legislative restrictions controlled culture fish in Australia on sale and distribution environment of fish within Australia
Skilled personnel Lag-time in production Well established Competition from distribution channels Australian producers
Product quality, variety High capital cost Quarantine legislation and supply
Close proximity to major Potential for disease Well established market outbreaks aquaculture
infrastructure
High mortality and morbidity rates of imported fish
These points are discussed in more detail in the following paragraphs.
148

Strengths
Access to infi·astructure. With Tas Angels based in Launceston, there is easy access to a
range of infrastructure needs for an intensive aquaculture facility. Among these are:
1. fish pathology and veterinary expertise available through the Department of
Primary Industry's Fish Health Unit in Launceston;
2. cheap reliable electricity supplies;
3. reliable, high quality city water supply;
4. close to major airport, with regular daily flights to major markets in
Melbourne, Sydney and Brisbane;
5. availability of skilled and tertiary qualified labour from University of
Tasmania at Launceston; and
6. ready access to aquacultural suppliers in Tasmania, in particular feed and
chemical suppliers.
High technology, controlled culture environment. The proposed design and management of
Tas Angels will have several advantages over more traditional pond culture methods
currently used throughout the industry in Australia and overseas. These advantages
(proposed in section 4.4.1 and discussed in more detail in Chapter 5) include:
1. less labour intensive than pond systems;
2. more efficient use of available space;
3. easier disease control and treatment;
4. higher yields (ie. faster growth and higher stocking densities); and
5. optimal environmental conditions all year, ie. no seasonal production.
These advantages ensure that production of P. seafare is carded out in a controlled
environment, allowing for year round optimum growth of fish. By providing optimum
conditions for intensive production of fish all year round, a farm can maintain a significant
competitive advantage through higher production efficiencies and reliability of production
over other Australian farms. Farms that rely on more extensive production methods, are not
able to maintain optimal conditions throughout the year leading to seasonal production.
149
Skilled personnel. At present the industry is characterised by farms owned and operated by
unqualified staff. While practical experience is essential, the utilisation of qualified skilled
staff will ensure that the culture system is operated with a high degree of precision. Such
skilled personnel will have a better understanding of the principles and theory behind
aquacultural practices and will be able to solve and diagnose problems that occur.
It is anticipated that Tas Angels will employ staff with tertiary qualifications in aquaculture,
who will have a theoretical and practical understanding of fish husbandry techniques as well
as operating recirculation systems. These staff are likely to be readily available in
Launceston with the University of Tasmania offering undergraduate and postgraduate studies
in aquaculture.
Product quality, variety and supply. With the ability to provide an optimum culture
environment and a strict quality control program, the fish produced by Tas Angels will be
more consistent and reliable than those of its competitors. Strict adherence to the product
definition through a rigorous quality control program should achieve a higher quality product
on a more consistent basis than is cun·ently available in Australia. As previously discussed,
quality and particularly low mortality rates are very important in supplies of ornamental fish
to both wholesalers and consumers.
Tas Angels will also be able to supply fish on a regular weekly basis throughout the year
without any seasonal fluctuations in supply. The majority of other producers of ornamental
fish, and particularly P. seafare, in Australia are unable to do this due to the lack of control
over the culture environment, particularly temperature as they utilise ponds or outdoor tanks
(see Section 4.3.5).
Close proximity to major markets. Melbourne is the largest market for ornamental fish in
Australia, with Australian Bureau of Statistics data indicating that the port of entry for more
than half the ornamental fish imported into Australia is Melbourne (see Table 33). The close
proximity of Launceston to Melbourne means significantly lower freight and packaging
costs than for farms in northern Australia, allowing relatively cheaper and easier access to the
major market for ornamental fish in Australia.
150

Weaknesses
Lack ofprevious operating history. Tas Angels has no prior commercial history and the
culture system proposed here is a relatively unproved concept for culture of P. scalare. The
performance of the culture system is based on the experimental performance of P. scalare in
this study, and therefore may not truly indicate the performance of P. scalare in the proposed
culture system, with the possibility that production costs could be higher than estimated.
The lack of operating history may also make it difficult to secure financing, particularly for
such an innovative and unusual business venture. The results of the market survey conducted
as part of this study indicate that many other farms have found it difficult to secure loan
funding for their ventures due to the lack of industry data and benchmarks (see Section 4.2).
Lack of breeding stock. An integral part of Tas Angels is the ability to produce P. scalare in
sufficient numbers to satisfy production targets. As such Tas Angels must have enough
broodstock to produce eggs for production of fish, allowing for mortalities during
production. The genetic variety of the broodstock must also be considered, as this will
determine the number of different varieties that can be produced.
It is unlikely that the numbers of suitable high quality broodstock required to produce
commercial quantities would be available in Australia. This means that suitable high quality
juvenile stock would need to be acquired and grown up to sexual maturity (ie. 9- 12 months
old). However, if sufficient numbers ofbroodstock cannot be attained within Australia,
broodstock may be imported from overseas sources which could also lead to a greater
number of P. seafare varieties. This would considerably reduce the time needed for Tas
Angels to begin large scale production.
Lag-time in production. As with any livestock operation considerable time and effort is
needed to produce a saleable product. As well as the time needed to construct suitable
culture facilities broodstock must be acquired and breeding in large numbers commenced.
Considerable time also is needed before stock is grown to market size (approximately 4
months). Therefore a delay of several months may occur after Tas Angels commences
151

operating before any stock can be sold. This means that Tas Angels may operate with a
negative cashflow for several months which must be considered in budget estimates.
High capital cost. Generally the capital expenditure necessary to set up intensive culture
units (ie. tanks, filters, pumps, aerators) is much higher than for less intensive culture
systems (ie. ponds) (see Section 1.3.4). This means that the capital costs for Tas Angels
involved in building the proposed culture system would be much higher than the capital costs
of building a more traditional culture system utilising ponds. The high capital cost of
construction and lag-time in production mean that financial control and budgeting will be
vital in the operation of Tas Angels during the first few years of operation.
Potential for disease outbreaks. The possibility of disease outbreaks is a major threat to any
animal husbandry system and is potentially the biggest weakness of this enterprise.
Outbreaks of parasitic, bacterial and viral infections are able to cause up to I 00 per cent
mortalities in a very short time. Less virulent diseases, while not causing severe mortalities,
may result in poor growth performance of fish (decreasing productivity and cash flow of Tas
Angels) and may cause lesions, ulcers, fin damage and body discolourationrendering the
fish unsaleable as an ornamental fish. Therefore Tas Angels must adopt a rigorous hygiene
and fish health management program to ensure that no serious diseases are introduced to the
facility. Strict quarantine of newly introduced broodstock is also a must. The absence of
disease from a quarantined farm may be a significant competitive advantage, especially if
trying to establish export markets for fish.
Opportunities
International shortage ofP. seafare and export potential. A severe shortage of P. seafare
has recently occurred throughout the world, due to a particularly virulent disease known as
Angelfish Syndrome. The exact disease mechanism is not known except that it severely
compromises the fishes immune system, is highly contagious and always results in severe
mortalities (most often 100 per cent of the affected population). The disease is thought to be
caused by a piscine herpes-type virus. This international shortage has meant a decrease in
the availability of stocks in Australia, and wholesalers are seeking more reliable supplies of
this species within Australia (see Section 4.3.5). This international shortage may offer the
152
opportunity for export of quality disease free P. sea/are by Australian producers,
particularly to countries such as New Zealand and the USA.
Disease free stocks of fish in Australia. At present stocks of ornamental fish in Australia are
relatively free of disease, when compared to overseas stocks (see Section 4.2.3). Exotic
diseases have the potential to decimate fish populations and it is essential that stocks of
disease free fish be maintained for breeding. The absence of such diseases may play an
important part in marketing domestically produced fish in Australia and in attaining
international markets in the future.
Well established distribution channels. A well established network of ornamental fish
wholesalers currently exists in Australia, with reliable distribution networks to deliver fish to
retail pet shops throughout the country (see Section 4.3.1 ). These distribution networks are
supported by reliable and relatively cheap air freight services through national and local air
carriers and can be easily accessed by producers.
Quarantine legislation. At present all imported fish are required to be kept in quarantine for
a minimum of 14 days, adding considerable costs to wholesalers (see section 4.3.2).
However, fish produced within Australia are not required to be quarantined, and currently
there are no legislative restrictions on the distribution of P. sea/are in Australia. Australian
produced fish are therefore preferred over imported fish if price and quality are equal to or
better than imported fish (pers comm R. Datodi, 1993). The Australian quarantine system
for importation of live fish is currently under review (pers comm Dr J Handlinger, 1994) and
if this review recommends an increase in the quarantine period imposed on all imported fish,
it will result in significant increases in the cost of quarantining fish in Australia.
Well established aquaculture infrastructure. In Tasmania, the infrastructure for fish farming
is well established with aquacultural training facilities, fish health services, as well as
equipment and consumable supply companies. This infrastructure is readily accessible by
Tas Angels and it is suspected that few other ornamental fish farms can readily access the
range of aquacultural infrastructure as readily, due to the lack of such facilities in many areas
of Australia.
153

High mortality and morbidity rates of imported fish. Generally imported fish are exposed to
greater amounts of stress during transport than domestically produced fish due to the longer
transit times (see section 4.3.2). This stress often results in compromises in their health, and
may increase the incidence of disease and mortality of fish. Australian wholesalers indicate
that they often experience 100 per cent mortalities in imported fish (pers comm R Datodi,
1994).
Threats
Market size and value. The author's target market for P. sea/are in Australia is estimated at
approximately 207,000 tails per annum valued at an estimated $194,000 (see Section 4.4.2),
and potentially limits the continued growth of Tas Angels. However, there are indications
that this figure could be increased if more varieties of P. sea/are were made available
although it is not known how far this market could be expanded (pers comm R Datodi, 1993)
or export markets could be developed.
Legislative restrictions on sale and distribution offish within Australia. Political and/or
legislative issues may also pose a threat to an ornamental fish production venture. Before
commercial production can start in Tasmania, permits must be attained from the local council
as well as licences secured from the Inland Fisheries Commission under the 1973 Inland
Fisheries Act (Anon, 1973). A number of regulations must be met under the licensing
required for a fish farm in Tasmania, with similar requirements in other states. Failure to
comply with these requirements can result in licenses being revoked and stock being
destroyed.
Changes in legislation may affect the operation of the farm (ie. changes in effluent treatment,
disease treatment, distribution of stock), or may affect the sales of fish (ie. restrict
distribution, impose costs and/or inspection on shipping of fish, restrict production of
non-native fish species, and a levying of taxes etc. on fish). Such changes would result in
increases in the cost of fish production. These problems are highlighted by the recent
imposition of a wholesale tax of 20 per cent on imported ornamental fish by the federal
government and the restrictions of the distribution of goldfish in Tasmania with only
certified flsh allowed to be sold.
154
Competition. As previously discussed (see Section 4.4.3) Tas Angels faces both direct and
indirect competition. Indirect competition with other leisure or hobby activities is possible,
however the keeping of ornamental fish has maintained a strong popularity over the past 16
years with at least 10 per cent of households keeping ornamental fish. This popularity is
consistent with other countries and suggests that the hobby has an established following and
will most likely continue to maintain this level of popularity. Direct competitors for Tas
Angels are other Australian farmers and ornamental fish exporters in Asia. At present there
is an international shortage of P. seafare and demand exceeds supply, with production in
Australia generally haphazard and inconsistent in numbers. The quality of P. seafare,
particularly imported stocks, is variable and often of poor quality. While competitors
continue to operate in an unsophisticated manner and demand exceeds supply, Tas Angels
should maintain a competitive advantage over other producers due to the better production
systems used.
SWOT Summary
The international opportunities for production of ornamental fish for import replacement
have been highlighted by Bassleer (1994). These opportunities also exist in Australia and
have been discussed by Lee (1991) and Treadwell et al. (1992). This study also indicates
that a unique window of opportunity now exists for production of P. seafare in Australia for
import replacement. This window of opportunity is the result of a number of developing
factors within both the P. seafare and Australian ornamental fish market including:
1. the international shortage of P. sea/are,
2. the relative disease free status of ornamental fish stocks in Australia, in
particular the absence of Angelfish Syndrome, and increasing concerns over
the importation of exotic fish diseases with imported fish;
3. well established distribution channels via Australian wholesalers;
4. the quarantine requirements of imported fish increasing the cost of imports
creating an artificial pricing environment;
5. a well established aquaculture infrastructure; and
6. high mortality and morbidity rates of imported fish due to stress during
shipment.
155

It is felt that these opportunities provide a greater impetus for the establishment of Tas
Angels than the apparent threats to the organisation, with the greatest threats being changes
in government legislation regarding fish farms and/or the sale and distribution of ornamental
fish, and competition from other producers and imports of P. seafare. A further threat to
long term growth and expansion of Tas Angels is that oflimited market size. Even if a 100
per cent share of the P. seafare market is attained the annual sales are only worth
approximately $318,000 per annum. Therefore if further expansion of sales is desired by
Tas Angels market development (eg. establishing expmi markets for current products)
growth strategies will need to be adopted. However, Australian production and imports of P.
seafare have been characterised by poor quality and inconsistent supply and farms able to
produce consistent supplies of good quality P. sealare, as anticipated by Tas Angels, should
realise a significant competitive advantage.
Superimposed over the above opportunities are the strengths that Tas Angels will have
including quality control, consistent reliable year round production and considerable variety
in the range of P. seafare mm-phs available. However, Tas Angels will commence trading
with considerable weaknesses. The most notable of these is the lack of prior operating
history, lack of breeding stock and the lag-time between production commencing and a
return realised through sales. The provision of financial contingencies for these weaknesses,
will insure that the strengths of Tas Angels outweigh the weaknesses.
It would appear that there is considerable opportunity for Tas Angels producing P. sealare
for import replacement and the company should maintain considerable competitive
advantage. However, it should be noted that Tas Angels will have little opportunity for
expansion in the P. seafare market in the long term due to the limited size of the market, and
expansion may need to be through market development strategies (through export markets).
As well, financial and production control will be critical, particularly during the early years
due to the substantial lag-time between commencing production and gaining sales as well as
maintaining large inventories (ie growing stock). Particular vigilance of disease monitoring
and control will be needed in order to maintain a 'disease free' culture environment.
156

4.5 Summary
The ornamental fish industry in Australia is cunently undergoing a period of rapid expansion
after a period of pioneering by a few farms. The importance of the ornamental fish industry
will continue to grow over the next few years with the industry expected to be worth over
$10 million per annum by the late 1990's (O'Sullivan, 1991). Production of native species
will increase in importance as export markets for these fish are established. The greatest
opportunities for production of ornamental fish cunently exist for production of fish to
replace imports (Lee, 1991). This opportunity is being realised in many western countries,
largely as a result of increases in freight costs, decreases in the wild catch of species, and
increasing land use pressures and pollution in Asian countries cunently responsible for up to
80 per cent of world supply of ornamental fish (Andrews, 1992; and Bassleer, 1994).
The potential for production of P. seafare in Australia for import replacement is one such
opportunity. Production of this medium priced, popular species has decreased significantly
throughout the world (Lambourne, 1991) with demand currently exceeding supply.
However, it would appear that Australian stocks of P. seafare have not been affected as
badly as overseas stocks with few reported cases of significant exotic diseases in Australian
ornamental fish (pers comm Dr. J. Handlinger, 1993). Consequently, there is a market for
high quality, disease free stocks of P. seafare in Australia, although the market size is
relatively small within Australia (approximately 350,000 tails per annum).
Tas Angels, a fictitious enterprise, has been used as an example to illustrate the potential of
the P. seafare market. Tas Angels will use indoor, intensive culture techniques to produce
high quality, disease free P. seafare for the major market centres of Melbourne, Sydney, and
Brisbane for import replacement. At present such supplies are not available in Australia on a
consistent basis and will therefore be a good basis for product differentiation and competitive
advantage. However, the long term growth of Tas Angels is limited by the small market size
for P. seafare within Australia, therefore market development strategies will be needed for
future expansion. A major weakness of Tas Angels is the risk of disease introduction to the
production facility. Therefore a rigorous disease control and prevention program is essential
for the success of the business.
157
The following chapter further assesses the culture potential of P. seafare. The design and
operation of Tas Angels is further refined and a production model developed. The
production model is used to develop financial statements that are analysed and discussed to
assess the economic potential of Tas Angels.
158

CHAPTERS
PRELIMINARY ANALYSIS OF THE FEASIBILITY
OF INTENSIVE CULTURE OF P. SCALARE
5.1 Introduction
With the growing interest in commercially producing ornamental fish species in Australia,
such asP. seafare, it is important first to attempt to determine the feasibility of commercial
production. Like P. seafare the breeding and growth of many ornamental species is well
understood, however with the majority of this knowledge restricted to hobbyist literature,
there is a lack of scientific knowledge for these species.
This chapter attempts to extrapolate the data from the biological sub-model (see Chapter 3)
to a conceptually realistic commercial production facility. This chapter is not intended to be
a business plan for the production of P. seafare, but rather to be used as a basis for such a
plan, and for determining the feasibility of producing P. seafare intensively in an indoor
facility, highlighting possible constraints or problems of the system.
The chapter discusses the design and operation of Tas Angels in sections based on
development of the physical sub-model, marketing mix and economic sub-model. The
physical sub-model details technical information detailing farm-size, culture system design,
capital requirements and capital costs. The next section details marketing objectives and
strategies for Tas Angels, based on the proposed production capacity and market analysis
detailed in Chapter 4. The economic submodel provides detailed cash flow and profit and
loss statements for the first five years operation of Tas Angels, with an analysis of the
159

economics of Tas Angels presented. The final section discusses possible methods that may
be used in improving the profitability of Tas Angels, highlighting problems and constraints
that need to be addressed by future research.
The data used in the development of Tas Angels farm design have been derived from
expetimental data from this study as well as a review of the literature and experiences of
commercial producers.
5.2 Description of Tas Angels facilities and culture systems
In order for any species to be successfully exploited as an aquaculture species, culture
facilities must be developed for the species that satisfy the biological requirements and
economic objectives of the system. The designer must begin the design process by
examining the biological submodel and provide a culture environment that satisfies the
biological requirements for that species. In doing so the designer must develop the facilities
by first determining and designing the culture systems needed to meet the species' biological
requirements. Once this is achieved the designer may then determine the number of culture
systems needed to produce enough fish to meet financial and marketing goals of the
enterprise. From there the designer can then design a suitable facility to house the culture
systems and additional infrastructure requirements. The following section details the design
and operation of an indoor, intensive culture facility for production of P. seafare. The design
and operation have been based on the findings of this research and those in the literature, as
well as on commercial operators' experience.
5.2.1 Culture system design and operation
As previously discussed in Section 3.6.1, the production of P. seafare can be divided into
several stages (see Table 17) that coincide with differences in management practices and
stages in the life cycle. Based on these production stages the culture systems used at Tas
Angels can be divided into four functional types:
1. broodstock tanks;
2. egg incubation and larval rearing;
160

3. nursery tanks; and
4. grow-out systems.
The following sections detail information regarding the design and operation of the four
culture systems used.
Broodstock. In order to maximise egg production, eggs should be removed from pairs as
soon as possible after spawning and artificially incubated using the methodology described in
Section 3.2. The suggested design ofbroodstock tanks and management procedures used are
the same as those used in the experiments carried out in this thesis (see Chapter 2). The
tanks are IOOL glass aquaria with undergravel filtration (see Section 2.4.1). The tanks are
kept in rows of seven tanks in timber racks which are three tiers high. Broodstock
management regime was detailed in Section 3.2.
Egg incubation and lmval rearing. Artificial incubation of eggs and larvae was conducted
in 20 L glass aquaria (see Section 2.4). The management of artificial readng of P. sea/are
eggs and larvae is described in Section 3.2. Live food in the form of Artemia sp. was
cultured in 15 L conical fibreglass tanks using the culture methods descdbed in Section 3.3.
Nursery tanks. Nursery culture tanks were 100 L glass aquada (as per broodstock tanks) and
will hold double that of the smaller nursery tanks used in previous experiments in this study
(e.g .. 250 per 1 OOL tank). The glass aquada are kept in rows of seven tanks, in timber racks
three tiers high. The nursery section consists of 70 x 100 L glass aquaria (larger nursery
tanks would be needed than the ones used in this study).
Management of fish in nursery tanks is described in Section 3.3. The feeding schedule used
is detailed in Table 21, with the appropdate daily ration fed in five equal portions at 0800,
1030, 1200, 1530, and 1800 hours.
Recirculating systems. Fish grow-out was conducted in the third section of the building in
five large scale recirculating systems. The design of the recirculating system is based on
that currently used at Tasmanian Ornamental Fish Farm. The system consists of 12 x 380 L
culture tanks, holding 320 L of water each. Water flows into the culture tanks through an
161

adjustable tap and at a rate of approximately four water exchanges per hour and then passes
through the 50 mm outflow pipe into a common effluent pipe (100 mm). The effluent water
flows into a 500 L settling filter and is pumped through a 30 inch sandfilter to the top of the
trickle filter. Water flows down through the trickle filter and collects in the 1,000L reservoir
and is then pumped back through the system by the second pump via a 40 mm PVC pipe.
The culture tanks are siphoned daily to remove uneaten food and faeces and the waste water
replaced. The pH is monitored daily with weekly checks for nitrogenous compounds.
Culture tanks are completely drained and cleaned after the tank is harvested. Fish are
initially stocked at 3 fish per 2 litres for Stage III fish, however the stocking density is
reduced to 1 fish per litre for Stage IV fish and to 1 fish per 2 litres for Stage V fish. The
feeding schedule used is detailed in Table 21, with the appropriate daily ration fed in five
equal portions as per nursery tanks. A flow chart illustrates the proposed production
schedule in Figure 24.
Production of P. seafare by Tas Angels is expected to increase steadily over the first four
years of operation, with maximum production reached in Year 4 and the first full year of
maximum production in Year 5. During this time, the broodstock numbers will be increased
to a level sufficient to meet production targets and inventory levels (i.e. stock numbers being
grown-out) will be increased to meet production targets. The estimated increases in annual
production for Tas Angels are detailed in Table 43.
Table 43. Projected annual production of P. scalare by Tas Angels during the first five years of operation
Year 1 Year 2 Year3 Year4 Year4
Small 35,000 75,000 100,000 123,000 123,000
Medium 20,000 45,000 60,000 67,000 67,000
Large 3,000 6,000 9,000 12,000 17,000
Total 58,000 126,000 169,000 202,000 207,000
The number of culture systems needed to meet these production targets, and additional
infrastructure needs, are detailed in the following section.
162

....... 0\ w
+ Stage I
Egg and larval rearing
20 litre glass aquaria
! 10 days
Stage II Nursery culture
1 00 litre glass aquaria 5 fish per 2 litre
!
~
..,
36 days .....
16 days
~ Stage III
Grow-out I
Recirulating system 3 fish per 2 litre
! 1 r--
E? Stage VI
Broodstock
1 00 litre glass aquaria 1 pair per tank
!
21 days -,..
StageN Grow-out II
Recirculating system 1 fish per litre
! HaJ.Vest and sell
small fish \..... ~
~ 21 days
1 Harvest and sell J
medium fish
65 days
Stage V Grow-out III
Recirculating system 1 fish per 2 litre
l
Figure 24. Graphical illustration of proposed production schedule for Tas Angels
1 Harvest and sell
large fish

5.2.2 Production facilities design
Market analysis detailed in Chapter 4 of this study indicates the potential for Australian
farmers to produce and market fish in direct competition with imported fish. The potential
for production of P. seafare for import replacement also exists and a target market was
identified for Tas Angels previously (see Section 4.4.2). In targeting import replacement of
P. seafare the potential market size for Tas Angels is 207,000 tails per annum (see Table 42).
The number ofbroodstock needed to produce 207,000 tails per annum, allowing for the
calculated survival rates to each stage during the production cycle (see Section 5.2.2), was
calculated to be at least 64 pairs. The number of culture systems needed to maintain a
minimum broodstock of 64 pairs and meet production of 207,000 P. seafare per annum are
listed in Table 44.
Table 44. Number and cost of culture tank systems for Tas Angels
Tank type Quantity Unit cost Total
20 L glass 100 $10 $1,000 aquana
100 L glass 170 $50 $8,500 aquaria
Recirculating 5 $8,365 $41,825 system 12 x 380 L tank
In order to house and service these culture systems additional infrastructure is needed. As
Tas Angels will be operated in a temperate climate the building that the culture systems are
housed in will be important.
A suitably insulated building can prevent substantial heat loss and is essential to minimise
costs, in providing optimal environmental control. For this reason recirculating systems are
typically housed in insulated buildings that can provide good environmental control
(Stickney, 1994). By constructing a building of200 mm thick composite panelling (as used
in freezer and coolrooms) that offers excellent insulation properties to house Tas Angels
culture facilities, heat loss will be minimised and a high level of environmental control
164
achieved. This will allow relatively easy environmental control to provide optimal
conditions all year round at minimal cost.
To house the tank systems detailed in Table 44, the building will measure 21 x 18m with 2.6
m high ceilings, and will be constructed on an insulated concrete slab. The proposed floor
plan for this building is illustrated in Figure 25. Temperatures will be maintained at 26 ± 2
oc by a thermostatically controlled wood fired furnace that supplies heated air to production
facility via ducting. A photoperiod of 14 hr light, 10 hr dark will be maintained by
fluorescent light tubes positioned in a row down the centre of each culture room. All
power-points in the culture rooms will be fitted with earth leakage circuit breakers for safety
of staff.
Water attained from town water supply will be pre-filtered to 5 t-tm to reduce the level of
suspended solids by a series of cartridge filters, viz. 50 t-tm, 15 J.tm, 5 J.tm. The water then
passes through a 5 ~tm activated carbon filter to remove water contaminants. The water will
then be stored in one of 4 x 2,000 L storage tanks for at least three days, where it will be
vigorously aerated to eliminate residual chlorine used to treat city water (Spotte, 1979).
During this time the water will be passively heated to just below ambient room temperature
at 25 ± 1°C.
The storage tanks will be connected to a common manifold which delivers water to an Onga
water pressure system which is able to deliver water under pressure to all culture tanks via a
system of 25 mm PVC pipes throughout the culture facility. Aeration for all storage tanks
and culture systems will be provided by three Sakuragawa Hiblow 80 air pumps, via a system
of 25 mm poly pipe throughout the culture facility. All air outlets will be regulated with
air-valves to allow individual control of air-stones.
The capital costs for constructing the facility described in this section are detailed in Section
5.3.1. The following section details the marketing mix strategies for Tas Angels.
165
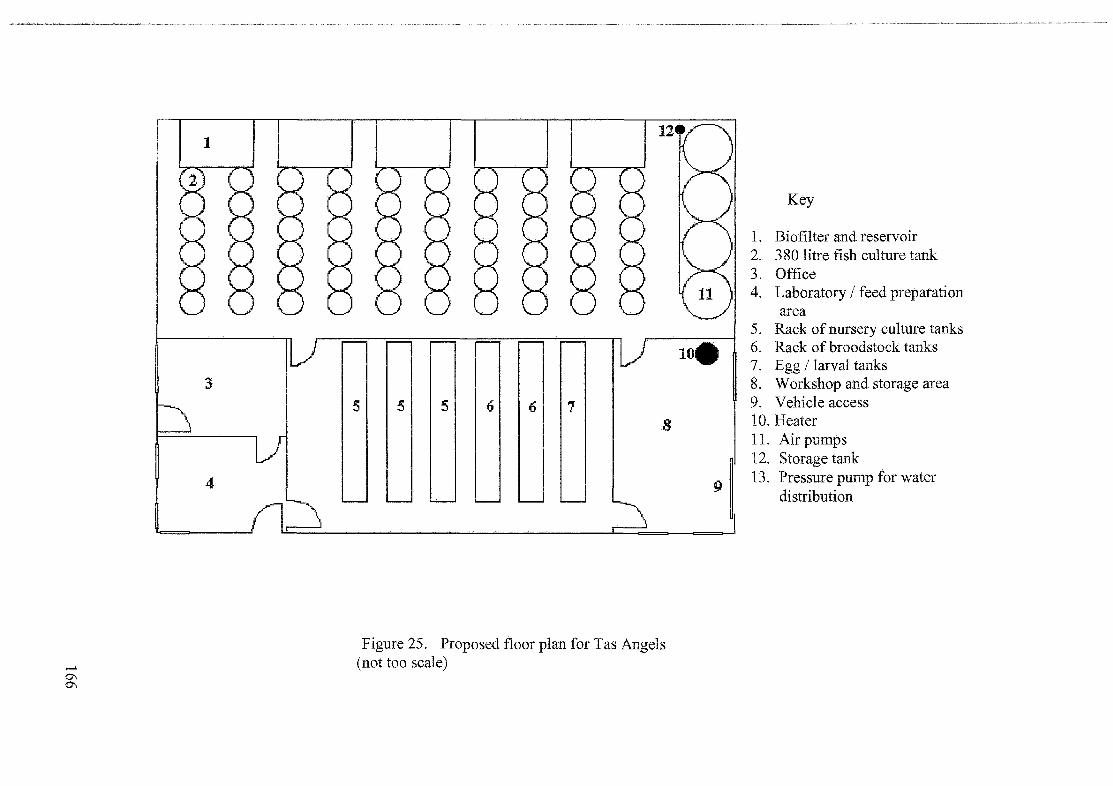
,_ 0\ 0\
1 12
8
Figure 25. Proposed floor plan for Tas Angels (not too scale)
1oe
9
Key
1. Biofilter and reservoir 2. 380 litre fish culture tank 3. Office 4. Laboratory I feed preparation
area 5. Rack of nursery culture tanks 6. Rack ofbroodstock tanks 7. Egg /larval tanks 8. Workshop and storage area 9. Vehicle access 10. Heater 11. Air pumps 12. Storage tank 13. Pressure pump for water
distribution

5.3 Recommended marketing mix strategies for Tas Angels
Market analysis in Chapter 4 indicates that the greatest potential for market penetration for
new producers of P. sealare in Australia is in targeting import replacement, particularly in
the Victorian, New South Wales and Queensland segments. The size of these target market
segments has been calculated at 207,000 tails per annum (see Table 43). At present this
target market is largely supplied by Asian imports that are generally inconsistent in both
quality and numbers. Production of P. seafare in Australia is also somewhat inconsistent in
quality and numbers, although some producers are cunently producing relatively large
numbers of quality P. seafare on a reliable basis.
As Tas Angels will be a new entity it is vitally important for survival to establish and rapidly
expand market share within these target segments. In order to achieve this an aggressive
market penetration strategy must be adopted. This strategy should be based on positioning
of Tas Angels as a producer of premium quality fish with strict quality control systems to
ensure high quality, in large numbers on a consistent basis.
Tas Angels will initially experience a phase of intensive growth and rapid expansion of
production of ornamental fish. As the products produced by Tas Angels are perishable goods
and cannot be warehoused, it is important that sales for the product are secured rapidly in line
with projected production increases.
The following section details the marketing objectives of Tas Angels and details the
appropriate marketing mix strategy, regarding product, p1ice, promotion and distribution
strategies for Tas Angels.
5.3.1 Marketing objectives
In order to determine a sound marketing strategy, marketing objectives need to be set. In
broad terms the marketing objectives for Tas Angels are to be the major supplier of P.
seafare in Australia by replacing a major share of the estimated 251,000 P. sea/are imported
annually from overseas suppliers. In securing this market share, it is estimated that Tas
Angels will achieve a market share of 58.3 per cent of the P. sea/are market in Australia by
167

the end of Year 4. In order to achieve this goal, Tas Angels must meet a range of subsidiary
marketing and production objectives.
The target segments for Tas Angels identified in section 4.4.2 in order of merit are
Melbourne wholesalers, Sydney wholesalers and Brisbane wholesalers. As the
competitiveness of Tas Angels is greatest in the Victorian segment (see Section 4.4.2) the
first objective of Tas Angels is to penetrate and establish a significant market share of this
segment in the first year of production. As production capacity increases during the second
year, the objective is to increase sales by penetrating and establishing a significant market
share in the Sydney market. In Years 3 to 5 the Brisbane market will be penetrated and
consolidation of the remaining markets undertaken to ensure sales of207,000 fish per annum
in these markets.
Tas Angels must successfully differentiate its product from that of other Australian and
overseas producers. As product differentiation is difficult, a positioning strategy must be
adopted for Tas Angels to differentiate it from competitors. The positioning strategy should
be based on the following points identified in section 4.4:
1. production of a premium quality product;
2. the reliability and quality of Tas Angels customer service;
3. the origin offish- Australian product produced in high technology,
controlled, disease free environment;
4. a large assortment of varieties and sizes; and
5. Tas Angels commitment to ongoing product development.
In more precise tetms the marketing objectives for Tas Angels are:
Year 1.
1. establish and maintain alliances with major wholesaler/sin the Victorian
segment through initial cmTespondence, personal visits and follow up
conespondence;
2. achieve sales of approximately 50,000 tails or a 14 per cent market share of
the Australian P. scalare market;
168
Year 2.
Year 3.
Year 4.
3. adopt a going-price strategy in order to rapidly secure market share; and
4. use a promotional push strategy by commencing advertising in industry
magazines to create awareness ofTas Angels amongst wholesalers.
1. establish and maintain alliances with major wholesaler/s in the New South
Wales segment through initial correspondence, personal visits and follow up
coiTespondence;
2. maintain alliances previously established with wholesalers through continuing
coiTespondence and an annual personal visit;
3. achieve sales of approximately 125,000 tails or a market share of
35.2 per cent of the Australian P. sea/are market; and
4. maintain a promotional push strategy by advertising in industry journals and
commence a promotional pull strategy by advertising in consumer magazines.
1. establish and maintain alliances with major wholesaler/s in the Queensland
segment through initial coiTespondence, personal visits and follow up
cmTespondence;
2. maintain alliances previously established with wholesalers through continuing
coiTespondence and an annual personal visit;
3. achieve sales of approximately 157,000 tails or a 44.2 per cent share of the
Australian P. sealare market;
4. change pricing strategy to above-competition pricing, in order to reflect higher
value of Tas Angels fish with a price increase to one per cent above the
going-rate price; and
5. continue the push-pull promotional strategy with advertising in industry
journals and consumer magazines.
1. achieve sales of approximately 200,000 tails or a 56 per cent share of
Australian P. seafare market;
2. increase price of fish to three per cent above the going-rate;
3. maintain alliances previously established with wholesalers through continuing
coiTespondence and an annual personal visit; and
4. continue the push-pull promotional strategy with advertising in industry
169

journals and consumer magazines.
Year 5.
1. achieve sales of approximately 207,000 tails and a market share of 58.3 per
cent;
2. increase price to five per cent above the competition;
3. maintain alliances previously established with wholesalers through continuing
con·espondence and an annual personal visit; and
4. continue the push-pull promotional strategy with advertising in industry
journals and advertising in consumer magazines.
The following section details the recommended marketing mix strategies needed to achieve
these marketing objectives.
5.3.2 Product
The basic product Tas Angels is producing is P. scalare and, as the product mix is limited to
one product line, Tas Angels can be classed as a product specialist. P. scalare can be classed
as an agricultural product, where these are generally characterised by seasonal production,
perishability, relatively high transport costs, little promotional activity and usually some
degree of standardisation and/or grading (Stanton et al., 1994). Production of P. scalare in
Australia and overseas can also generally be characterised by the above factors however, in
this case Tas Angels will be able to produce P. scalare all year round, resulting in no
seasonal fluctuations in production.
Product definition. Selective breeding over many years has produced a wide variety of
colour variations for P. scalare (Brown and Gratzek, 1982), and may be used to produce new
variations. These colour varieties are generally available in two different fin types, short or
normal fins and long or veil tails. Therefore, even though Tas Angels is producing just one
species of fish, an extensive product line can be offered, with product differentiation based
on colouration and fin type. The various fin and colour combinations available are also
produced in three sizes (based on the length of the fish); small, medium and large. When
combined the fin type (two types), colouration (at least seven types) and size (three types)
170
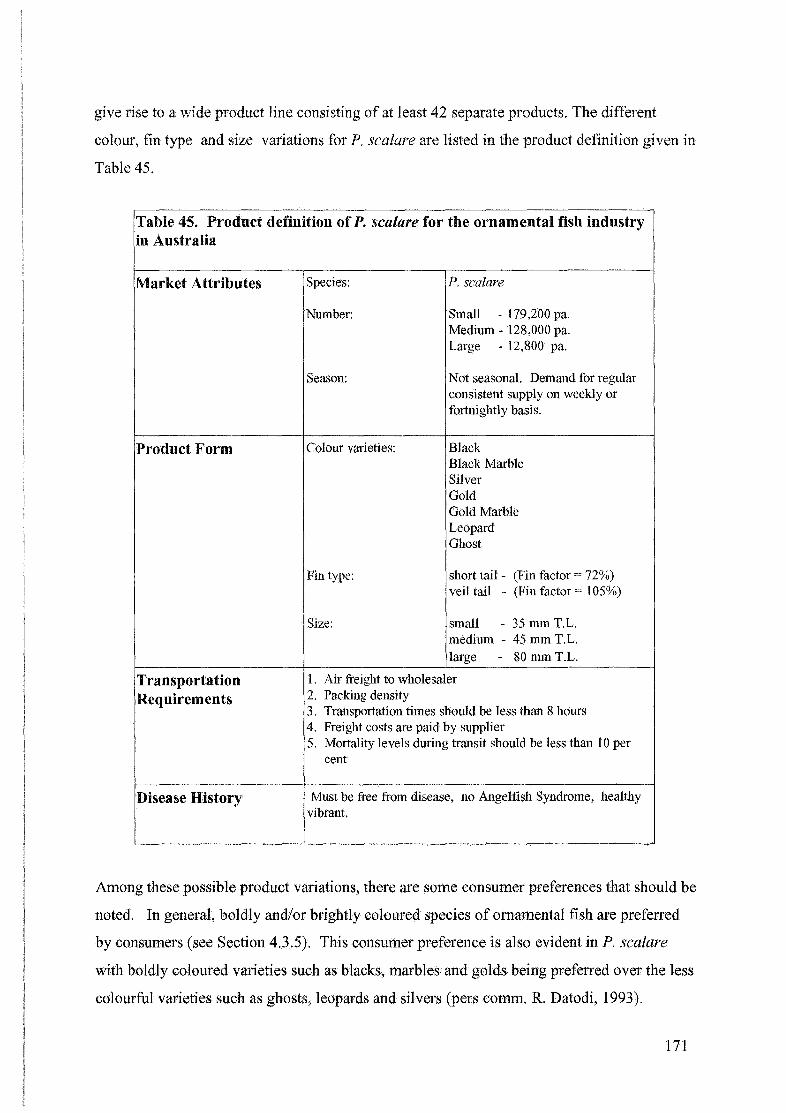
give rise to a wide product line consisting of at least 42 separate products. The different
colour, fin type and size variations for P. seafare are listed in the product definition given in
Table 45.
Table 45. Product definition of P. seafare for the ornamental fish industry in Australia
Market Attributes
Product Form
Transportation Requirements
Disease History
Species:
Number:
Season:
Colour varieties:
Fin type:
Size:
P. seafare
Small - 179,200 pa. MedilUn- 128,000 pa. Large - 12,800 pa.
Not seasonal. Demand for regular consistent supply on weekly or fortnightly basis.
Black Black Marble Silver Gold Gold Marble Leopard Ghost
short tail- (Fin factor= 72%) veil tail - (Fin factor= 105%)
small - 35 mm T.L. medilUn - 45 mm T.L. large - 80 mm T.L.
1. Air freight to wholesaler 2. Packing density 3. Transportation times should be less than 8 hours 4. Freight costs are paid by supplier 5. Mortality levels during transit should be less than 10 per
cent
Must be free from disease, no Angelfish Syndrome, healthy vibrant.
Among these possible product variations, there are some consumer preferences that should be
noted. In general, boldly and/or brightly coloured species of ornamental fish are prefeiTed
by consumers (see Section 4.3.5). This consumer preference is also evident in P. seafare
with boldly coloured varieties such as blacks, marbles and golds being prefeiTed over the less
colourful varieties such as ghosts, leopards and silvers (pers comm. R. Datodi, 1993).
171

Production emphasis at Tas Angels will be on these popular colour varieties, particularly
blacks, marbles and golds. However, the remaining colour varieties will also be produced,
but in relatively fewer numbers, in order to provide the maximum number of P. sea/are
varieties possible for wholesalers. All the colour variations will be produced in each size
and with either short or veil fins. As a reliable large range of colourations has not been
available in Australia for some time, the relative importance of different colourations will
need to be determined through further market research. The mix of varieties produced by
Tas Angels can be varied during production by increasing or decreasing the number of pairs
of any particular colour variety as the need arises.
Further extensions of the product line at Tas Angels are possible through the use of selective
breeding techniques to produce new colour or fin type varieties. As bold coloured varieties
are more popular, emphasis should be placed on developing and or improving this type of
colouration. New varieties produced overseas could also be introduced to the Tas Angels
product line by the purchase of suitable broodstock.
Product life cycle stage. Stanton et al. (1994) propose three general life cycle variations:
1. extended introduction stage;
2. fad; and
3. indefinite maturity stage.
Ornamental fish seem to have a product life cycle generally characterised by an indefinite
maturity stage. This classification is supported by the relatively consistent populatity of the
hobby over the past 25 years in Australia (see Section 4.3). New varieties and/or species of
ornamental fish are likely to follow the sales pattern characterised in the introduction stage of
the product life cycle initially. The new variety/species would then pass into the growth
phase of the product life cycle until the demand for the species/variety of ornamental fish
begins to stabilise the sales would begin to level off and the species/variety would enter the
indefinite maturity stage of the product life cycle. Thus ongoing growth for Tas Angels can
be maintained through continuous new product development.
172

P. seafare has been kept as an ornamental fish for a number of years and is a popular,
medium priced species (Brown and Gratzek, 1982) and it reflects the indefinite maturity
stage of the industry life cycle. Industry sources indicate that the sales of P. seafare are
similar from year to year (pers comm, R. Datodi, 1993), which confirms this proposal. As
such the market for P. seafare is unlikely to increase unless new colour varieties can be
developed through selective breeding. Therefore, product development through selective
breeding should be maintained as an ongoing part ofTas Angels marketing strategy.
Positioning strategy. To date there has been little differentiation of ornamental fish in
Australia based on the origin of the fish (ie. whether they are produced in Australia or
imported). The importance of the origin of fish as a point for differentiation is expected to
increase, due to the growing concerns over importation of exotic diseases with imported fish.
To date, no Australian producer has used such a differentiation strategy and infact most
producers have paid little attention to the marketing of ornamental fish. Consequently all
producers of P. seafare in Australia and imported stocks are viewed similarly, with no
differentiation based on origin of the product.
A positioning strategy based on the origin of fish will play a significant role in the marketing
of Tas Angels product to Australian wholesalers and will draw on the strengths and
competitive factors highlighted in Chapter 4:
1. Tas Angels fish are 'Australian made';
2. Tas Angels fish are produced in a disease free, high technology, culture
environment to achieve disease free ce1iification;
3. Tas Angels fish are a premium quality product with excellent health and low
mortality;
4. Tas Angels produces a wide selection of varieties of P. seafare to choose
from; and
5. Tas Angels delivers a high quality service (ie consistent, regular supply, and
fast response).
173

An integral part of this strategy is the quality of Tas Angels products, with the disease status
and general health of the fish being important product attributes. It is anticipated that by
maintaining a rigorous disease control program and strict quarantine of new stock that
certification attesting to the absence of exotic diseases will be attained. At present very few
farms in Australia have been accredited with this certification, with survey results from this
study indicating that only 25 per cent of farms are cunently undergoing certification. This
certification will reflect the high quality of the product and the longer life expectancy of Tas
Angels product relative to competitors' products.
Packaging. The packaging and transport of ornamental fish is very important and plays a
significant role in the quality of fish on arrival to wholesaler-customers. If fish are not
suitably packaged they will become stressed and most likely die during transport or shortly
afterwards. Therefore fish must be packaged in a way that reduces stress and provides an
environment that allows fish to anive at their destination in a healthy state.
The packaging of ornamental fish for live transport has been well researched over recent
years (Amend et al., 1982; Sampson and Macintosh, 1986; and Teo et al., 1989). In order to
prevent stress induced problems during transit, fish are generally starved for 2 - 3 days prior
to transit and are packed in plastic bags with water and oxygen. The packing density can be
reduced or chemicals and anaesthetics can be used to decrease oxygen demand and
metabolite production. The bags of fish are generally packed in cardboard or polystyrene
boxes and these boxes transported by air, road or rail freight to their destination.
Packing of fish at Tas Angels will follow this general method. Fish will be starved for 48
hours prior to transit and then packed in a four litre plastic bag with a half litre of fresh water
(temperature= 25 oc, pH= 6.6, and water hardness= 60 mg/1 CaC03) with approximately
three litres of oxygen and sealed with three, good quality rubber bands. The following
packing densities will be used:
1. 20 small P. seafare per bag;
2. 10 medium sized P. seafare per bag; and
3. 6 large sized P. seafare per bag.
174

These bags will then packed in polystyrene boxes and the boxes transported by air freight to
their destination.
For Tas Angels, the transit times involved with shipping fish from Launceston to Melbourne
and Sydney will present little or no problems with either product quality or mortality. It is
anticipated that if direct flights can be used between Launceston and Brisbane transit times
will be minimised, and normal packing densities can be maintained when transporting fish to
Brisbane wholesaler-customers. However, the packing density may need to be reduced if
there are any problems during transit to Brisbane. If flight delays are likely at any of these
airports the fish will be transported on alternative flights.
Instructions and/or recommendations for the handling and unpacking of fish upon arrival at
wholesaler-customers will be provided to new wholesaler-customers. This literature will be
provided before fish arrive and will be discussed with the relevant staff prior to shipping. It
is anticipated that any further problems with unpacking or maintenance of fish will be
discussed over the phone. The following section details the pricing strategy that will be used
by Tas Angels.
5.3.3 Price
Competitive level pricing strategies are common in business markets (Hutt and Speh, 1995)
where other aspects of the marketing mix such as product quality, customer service and
distribution become important in differentiating the product (Stanton et al., 1994; and Hutt
and Speh, 1995). In adopting a pricing strategy relative to the competition, a firm may
choose to price its product at the same price as the competition (ie going-rate), at a higher
price than the competition (ie above-competition) or at a lower price than the competition
(below-competition) (Kotler et al., 1983). Such competition-based pricing strategies are
particularly common in oligopolistic industries where competitive advantage is then based on
other aspects of the marketing mix (Mansfield, 1988).
The P. scalare market is oligopolistic in nature, being supplied by several Australian
producers and overseas suppliers (see Section 4.3.5). Mansfield (1988) suggests that prices
in oligopolistic industries are generally determined by a price leader. In the case of the P.
175
seafare market in Australia, the price leader is imported supplies of P. seafare, with
Australian producers generally accepting the going-rate price (ie the average market price)
established by the cost of importation and quarantine of P. seafare (see Section 4.3.5). This
competitive level pricing is also characteristic in the ornamental fish industry in general, with
prices usually set by the real cost ofimpmts (see Section 4.3.2).
The current going-rate price available for P. seafare producers is $0.55 each for small, $1.10
each for medium and $3.00 for large sized P. seafare (see Table 36). These prices reflect the
lowest prices producers of P. seafare in Australia can expect in the market and are based on
the real cost of imported P. seafare after freight, importation costs and quarantine costs are
added to the cost of imported P. seafare (see section 4.2.7). It is unlikely that the price of
imported P. seafare will be reduced (and thus the going-rate reduced) to any great degree
because the price of impotted fish is largely determined by the additional cost factors in
importing and quarantining imported fish. Therefore the initial purchase price of imported
fish accounts for only a small portion of the real cost of imported fish and a decrease in price
by overseas suppliers would have little impact on the real cost in Australia.
Tas Angels will use a competitive pricing strategy by adopting a going-rate pricing policy
(ie. accepting prices dictated by real cost of imports). This type of pricing policy is
appropriate for Tas Angels because:
1. competition with other producers of P. seafare will be based on other aspects
of the marketing mix (ie product quality and customer service);
2. going-rate pricing maximises profit by setting as high a price as possible,
which is important initially to maintain cash flow of Tas Angels; and
3. it promotes the value ofTas Angels products in the market (ie high quality
for reasonable price).
As production approaches maximum capacity and Tas Angels establishes a reputation for
quality fish and service, a revised pricing strategy can be considered. Instead of Tas Angels
setting prices to meet the competition, the price will be set above that of the competition to
reflect the higher quality and service that Tas Angels can supply to wholesalers. This
above;.competition pricing strategy is often adopted by producers of prestige products
176

(Stanton et al., 1994) where the product or service is distinctly different, based on high
quality from other competitors. The use of this pricing strategy will depend largely on the
success of the company's initial positioning strategy. Therefore in considering the use of an
above-competition pricing strategy, it is important that Tas Angels has achieved its
positioning strategy objectives of being perceived as a producer of high quality fish and
customer service. If this strategy has not been successful the perceived value of Tas Angels
fish is unlikely to justify the higher price relative to the market.
It is anticipated that other competitors will not be able to meet Tas Angels on the consistency
of product and quality all year round unless they adopt similar production technology and
methods. This is unlikely due to the radical differences in production technology between
Tas Angels and other Australian producers, and the much greater capital costs required to
construct facilities such as Tas Angels. In the longer term, competitors may adopt a market
follower strategy and use a similar positioning and pricing strategy to Tas Angels. Therefore
it is important that Tas Angels be successful in its positioning strategy to enable it to defend
market share from market followers.
In adopting an above-competition pricing strategy, the price elasticity of demand needs to be
considered. If unrealistically high prices are set (compared to the current market prices)
market share is likely to be lost to lower-priced competitors as demand is elastic for
ornamental fish (see Section 4.1). However, it should be remembered that prices set by
wholesalers and pet shops are constructed to account for a certain percentage of mortalities
(often as high as 30 per cent). Therefore, if wholesalers and pet shops can purchase fish with
a consistently lower mortality, they will have a higher profit margin and higher purchase
prices could therefore be justified. The price set for P. sea/are by pet shops also reflects this
expected mortality and therefore higher prices can be justified if the mortality rate is reduced.
However, it is difficult to estimate the impact of price rises on the demand for P. sea/are . It
is suspected that a rise of 5 per cent above the going rate will be justified by the higher
quality and lower mortality of Tas Angels fish once a quality product image has been
established by Tas Angels.
In order to assess the effect of price rises above the market, Tas Angels will increase the
price of its fish over three years to five per cent above the going rate. The ptice rises will
177

commence in Year 3, with an increase of one per cent above the going rate ( eg $0.56 for
small, $1.11 for medium, and $3.03 for large sized P. seafare). The price will be increased in
Year 4 to three per cent above the going rate ( eg $0.5 7 for small, $1.13 for medium, and
$3.09 for large sized P. seafare) and in Year 5 to five per cent above the going-rate (eg $0.58
for small, $1.15 for medium, and $3.15 for large sized P. seafare). In gradually increasing
the price over a three year period, an assessment of the effect of the price rises on demand
can be made. If the market reacts negatively to the price rise and demand for Tas Angels fish
decreases, the pricing strategy will need to be reassessed and the going-rate price strategy
re-established.
An essential part of this above-competition pricing strategy will be efficient distribution to
ensure the product arrives in the best possible condition. The following section discusses the
distribution strategy for Tas Angels.
5.3.4 Distribution
Transport and warehousing of agricultural products are very important aspects in the
effectiveness and efficiency of distribution (Stanton et al., 1994). This particularly applies to
ornamental fish as the distribution will affect the producers' ability to service clients in a
satisfactory way. Wholesalers in Australia have established well-developed distribution
networks for the distribution of ornamental fish (see section 4.3). As these networks are
already well established, the most cost effective method of distribution for ornamental fish
producers is to operate in this two-level channel because of:
1. the complex and costly distribution network that an ornamental fish producer
would need to operate in a one-level channel which directly supplies retail
pet shops; and
2. the product assortment that wholesalers are able to offer retailers being far
broader than what an ornamental fish producer can offer.
Warehousing. A major constraint to the distribution of both agricultural products and in
particular ornamental fish is warehousing. In the case of ornamental fish, the producer and
wholesaler cannot afford to maintain ornamental fish in a warehouse situation because:
178

1. the product is highly perishable;
2. warehouse facilities for live ornamental fish are very capital intensive (ie.
must have tank systems, climate control etc);
3. the operating cost needed to maintain the fish while in the warehouse
(ie. water quality control, feeding, general maintenance etc.) is high; and
4. the product will change with time in the warehouse (ie. fish continue to grow).
Therefore, wholesalers normally maintain minimal inventories and often adopt a form of 'just
in time' inventory, where low inventory levels are maintained and new stock are ordered just
before a product runs out. For similar reasons pet shops also adopt a just in time inventory
strategy, and need a reliable supply from wholesalers. Wholesalers therefore require regular
shipments of fish, usually weekly or fortnightly, to maintain their stocks of fish for retail pet
shops. Consequently wholesalers generally maintain an inventory of fish to last for one to
two weeks and production by producers, both domestic and overseas, must be geared to suit
this demand. Reliability of supply and delivery from producers is therefore very important to
potential wholesale-customers.
Transportation. Generally there are three modes of transportation methods available to
producers of ornamental fish to distribute their product viz. road, rail, and airfreight or a
combination of the three. As ornamental fish are highly perishable efficient transport (ie
timely and reliable) is essential for ensuring fish arrive at their destination in the shortest time
possible. Therefore airfreight is generally the preferred mode of transport (Brown and
Gratzek, 1982).
For a Tasmanian-based farm such as Tas Angels, distributing to interstate markets, road and
rail transport is not practical due to the absence of land links to these interstate markets. Sea
transport is also not suitable due to the long transport times. The only practical mode of
transport available to ornamental fish producers is via airfreight. This offers fast reliable
transport to all the target markets with several flights per day from the Launceston airport to
Melbourne, Sydney and Brisbane. The freight costs for accessing Tas Angels target markets,
based on shipments of 20 boxes, are as follows:
Brisbane $9.40 per box;
179

Sydney
Melbourne
$6.90 per box; and
$6.20 per box.
Generally impotied fish may suffer up to 100 per cent mortalities during shipment (pers com,
R. Datodi, 1992). However, when distributing fish from a farm within Australia, the
distances travelled are much shorter and the levels of stress far less than those suffered by
imported fish, meaning a reduced mortality rate during distribution. It is expected that Tas
Angels will experience very low mortalities in transporting fish to wholesale~customers, in
Melbourne, Sydney and Brisbane, compared to imported shipments. The stress on P. seafare
during transit from Tas Angels will be minimised where possible by using direct flights to
wholesale-customers which will reduce transit times, resulting in fewer mortalities and
higher quality fish on arrival.
An effective promotion strategy will be important in stimulating and maintaining sales to
wholesale-customers and is discussed in the following section.
5.3. 5 Promotion
The promotional effort of ornamental fish producers in Australia has been very poor to date
and is virtually nonexistent in the industry. This is typical for primary producers who
normally do not rely on individual promotion of their products; rather larger industry based
organisations are generally relied on for product promotion. An example of this is the
Australian Dairy Corporation, which is responsible for promotion of all dairy products in
Australia. However, in the case ofTas Angels the farm product is a consumer product
rather than a commodity product, and consequently promotion is likely to be useful in
increasing sales.
An important part of the promotion function for business markets is personal selling, which
is typically used in the Australian ornamental fish industry and Australian producers rely
solely on personal selling for the promotion of their fish. Personal selling will also play an
important role in the promotional mix of Tas Angels, in both the initial and subsequently
product launch and promotion strategies. It is important that the sales staff be able to convey
a high degree of technical information, such as water quality, disease aspects, fish physiology
180

and behaviour, effectively and efficiently to wholesaler-customers. This information will
play a role in the wholesaler-customers' ability to maintain Tas Angels fish in good health
(and thus quality) for distribution to pet shops. As the production capacity ofTas Angels
(see Section 5.3.2) is not large enough to justify sales staff, the sales function will be
performed by the owner/manager.
Although other forms of promotion, such as advertising, sales promotion and publicity, have
been largely ignored by ornamental fish producers in Australia, these promotional activities
will play an important role in the marketing of Tas Angels fish. As a primary producer Tas
Angels can aim this promotional effort at three different levels within the marketing channel.
viz,
1. wholesalers;
2. retailers; and
3. consumers.
By aiming promotional activity at each of these levels, Tas Angels will be utilising a
push-pull promotion strategy. This push-pull promotion strategy will need to:
1. create a quality product and customer service image;
2. stimulate and maintain sales to wholesale-customers; and
3. create awareness ofTas Angels and its product among pet shop
owner/managers and consumers.
Tas Angels promotional strategy will be based on the positioning strategy (see Section 5.4.2)
which focuses on the following points:
1. Tas Angels fish are 'Australian made';
2. Tas Angels fish are produced in a disease free, high technology, culture
environment to achieve disease free certification;
3. Tas Angels fish are a premium quality product with excellent health and low
mortality;
4. Tas Angels produces a wide selection of varieties of P. seafare to choose
181

from; and
5. Tas Angels delivers a high quality service (ie consistent, regular supply, and
fast response.
However, the success of any promotional activity will rest on the ability to differentiate Tas
Angels product from that of its competitors. The differentiation of Tas Angels product for
consumers will be difficult as essentially the product will be similar to that of other producers
with little ability to provide distinguishing marks on the product. Unlike most consumer
items that can use packaging to help distinguish products from others, it is very difficult to
provide distinguishing features in the case of ornamental fish. For this reason it is essential
that some form of brand identity be established for Tas Angels so that wholesalers, retailers
and consumers can readily identify Tas Angels fish. In order to give Tas Angels an identity,
a logo and brand name will be developed and used to differentiate Tas Angels from its
competitors. However, difficulty arises in trying to achieve this. Marking of fish with
dyes, fin-tags, and/or fin clipping is not practical due to both the increased production costs
and the likelihood of detracting from the aesthetic value of the fish. More practical methods
of differentiating Tas Angels fish include:
1. provision of specially marked/designed tanks by Tas Angels tank for pet
shops;
2. provision of signs and/or stickers for pet shop managers to display on tanks
containing Tas Angels fish as a means of differentiating them for consumers;
3. provision of leaflets and flyers with each Tas Angels fish sold, with
information on unpacking fish, care of fish and the benefits of purchasing
Australian produced fish, and in particular Tas Angels fish, over imports; and
4. provision of specially marked bags with similar unpacking and maintenance
instructions.
The value of these methods for differentiating Tas Angels products must take account of the
cost involved and the degree of control Tas Angels has over it. The first two methods
involve differentiating the product based on the display tank used. With approximately 3,000
retail pet shops in Australia (O'Sullivan, 1991), providing display tanks could be extremely
expensive (at approximately $100 each, it could cost $300,000 to supply display tanks to all
182

potential wholesaler-customers). Although providing signs is a cheaper alternative to
providing display tanks, Tas Angels has little control over their use by retailers who may
place other infetior fish in them, thus detracting from the positioning of Tas Angels product.
In providing some literature and/or branded plastic bags (for repacking fish) with fish to
identify Tas Angels fish, Tas Angels has a greater degree of control over the distribution.
This control over pet shops atises from Tas Angels being able to limit the amount of material
given out to pet shops to equal the number of fish purchased by pet shops and it is less likely
that other fish will be substituted for those of Tas Angels. This strategy is less expensive,
and is less likely to be abused by pet shops.
However, the strategy partly relies on wholesalers, who would have to remember to include
the appropriate number ofTas Angels bags and/or flyers when distributing Tas Angels fish to
pet shops. One possible solution to this would be to make the distribution of this
promotional matetial by wholesalers part of the conditions of sale, thus legally obligating
wholesalers to perform this function, and ensuting that wholesale-customers receive an
ample supply of the material so that they are always able to supply the promotional material
to pet shop.
Promotional literature. It is beyond the scope of this study to design promotional literature
for Tas Angels, however the content of promotional literature should reflect the positioning
strategy of Tas Angels. As such promotional literature should convey the following points:
1. Tas Angels fish are 'Australian made';
2. Tas Angels fish are produced in a disease free, high technology, culture
environment to achieve disease free certification;
3. Tas Angels fish are a premium quality product with excellent health and low
mortality;
4. Tas Angels produces a wide selection of varieties of P. sea/are to choose
from; and
5. Tas Angels delivers a high quality service (ie consistent, regular supply, and
fast response).
183

The literature should also contain pictures of the fish and culture systems used at the fann to
convey an image of premium quality fish and the high technology production. Information
regarding culture techniques and staff qualifications and experience could also be included.
Promotional literature will be produced in several versions including large display posters for
pet shops, printed plastic bags (for repacking Tas Angels fish) and flyers for distribution to
pet shops. These versions are discussed below in more detail, as well as the associated costs
of each version. These costs have been used as a basis for determining promotion costs for
financial statements discussed in Section 5.3.
The first version of the promotional literature will consist of specially printed plastic bags
that will be supplied to pet shops for packing Tas Angels fish for consumers to take home.
Printed plastic bags are used by several manufacturers of aquarium products to promote their
products, particularly water chemistry products, and consumers are largely familiar with this
concept. These bags would carry the Tas Angels logo and instructions on unpacking fish in
the home and ongoing care of fish.
To increase the impact of these bags the second version of promotional literature will consist
of posters that will be provided to pet shops and be displayed near tanks containing Tas
Angels fish. These full colour posters (A3 size) will indicate that the pet shop sells Tas
Angels fish, and that Tas Angels is a producer of premium quality fish in a high technology
environment. Thus, the poster will contain photographs and information on Tas Angels
production systems and fish.
The final version of the promotional literature will be A4 sized flyers containing additional
information on Tas Angels production techniques and facilities. These flyers will contain
information of a more technical and detailed nature regarding the unpacking and ongoing
care and maintenance of Tas Angels fish to keep the fish in the best possible condition to
maximise quality. These flyers will be distributed to pet shops through wholesaler
catalogues (usually distributed fortnightly to pet shops) or by direct mail.
These posters and flyers will form the basis of advertisements in industry ( eg Pet Industry
News) and hobby magazines ( eg Practical Aquariums and Water Gardens) and be used to
complement feature and/or promotional articles on Tas Angels and its products in the same
184

magazines and journals. Advertising will commence in these magazines in conjunction with
feature articles on Tas Angels to launch awareness of Tas Angels among
wholesale-customers, pet shop owners, and consumers. Continued advertising in these
magazines after the initial launch will maintain awareness of Tas Angels over time. These
advertisements will reflect the positioning strategy ofTas Angels as a producer of high
quality P. seafare in high technology production systems. As well, the advertisements will
provide information on how to attain more information on Tas Angels and how to place
orders to receive fish.
Market schedules. The timing of promotional activities is an important aspect of
promotional activity. As Tas Angels will be a newly established business, it is important that
a well timed and organised launch is carried out to introduce Tas Angels and its products to
the market. Promotional activity will initially focus on a push strategy and commence
through personal selling before production begins, with approaches made to potential
wholesale-customers in the Victorian, New South Wales and Queensland markets, by way of
introductory conespondence. Personal selling will play a significant role in establishing and
maintaining the business relationship with wholesale-customers. This step will be used to
achieve the following:
1. establish contact with potential wholesaler-customers and make them aware of
Tas Angels;
2. anticipate future personal calls by the owner/manager of Tas Angels;
3. discuss product definitions of P. seafare with wholesaler-customers;
3. establish relationships with wholesaler-customers and discuss possible
reciprocrocal agreements (Tas Angels will buy a range of supplies and
equipment available through wholesalers).
Due to the lag time in production, market-sized fish will not be available in commercial
quantities until the end of Year 1. It is important that the initial launch phase is timed to
coincide with fish being available in commercial quantities and therefore will commence
towards the end of Year 1. In commencing the product launch before sufficient numbers of
P. seafare are available there is the likelihood of generating a poor image for customer
service and thus detracting from the positioning of Tas Angels. Therefore fish produced
185

prior to the product launch at the end of Year 1 will be sold to a limited number of
wholesale-customers in the Victorian segment to allow test-marketing and final assessment
of the product definition so that any problems in the product can be solved prior to the
product launch. This initial test-marketing will rely heavily on personal selling by the
owner/manager who will be responsible for the majority of the marketing function at Tas
Angels.
The initial product launch will commence towards the end of Year 1 when production has
reached a minimum of 1,500 P. seafare per week. A range of promotional activities
including personal selling, sales promotion, advertising and publicity will be used during
this launch phase. The launch will commence with contact by the owner/manager to discuss
and arrange distribution of sample shipments to Victorian wholesaler-customers previously
contacted. This sales promotion to wholesaler-customers will coincide with advertising
commencing in Pet Industry News. The advertising will capitalise on the publicity created
through promotional articles on Tas Angels that will be featured in Pet Industry News during
the initial launch period. The submission of sample shipments to wholesaler-customers will
be followed up with further personal selling through correspondence and personal visits by
the owner/manager to complete purchase discussions and make arrangements for commercial
shipments to wholesale-customers. As sales commence to wholesaler-customers after the
product launch promotional material described earlier will be sent to the
wholesaler-customers for distribution to pet shops (ie posters, flyers, plastic bags). Once the
business relationship is established with wholesale-customers, personal selling (including
annual personal visits) will be used to maintain the relationship.
As production increases in Year 2, further sample shipments to new wholesaler-customers in
Victoria, New South Wales and Queensland wholesalers will start. At least one personal
visit to each wholesaler-customer will be conducted in Year 2. In order to consolidate
demand for Tas Angels product a pull promotional strategy will be adopted. Publicity, aimed
at consumers, through local and interstate media will be sought by Tas Angels contacting
lifestyle programs to do a story on the business. Print media such as Practical Aquariums &
Water Gardens will also be contacted to do promotional features on Tas Angels. To
capitalise on this publicity, Tas Angels will commence advertising in Practical Aquariums &
Water Gardens to coincide with a feature story on Tas Angels.
186
The push-pull promotion strategy will be continued in Year 3 with advertising in the trade
and consumer magazines maintained. Further publicity will be generated through feature
articles on Tas Angels, in the trade and consumer magazines, updating wholesaler-customers,
pet shops and consumers on Tas Angels. The sales effort will focus on servicing current
wholesaler-customers and maintaining the established business relationship through personal
selling and at least one personal visit during the year. Further sample shipments to new
wholesaler-customers in the target segments will be made as wvll as personal visits to
wholesaler-customers.
Advertising in the trade and consumer magazines will continue throughout Years 4 and 5 to
maintain the push-pull promotional drive. Promotional features in wholesaler catalogues will
be conducted throughout the year to assist in maintaining awareness of Tas Angels and its
products by pet shops and their advantages over competitors. These features will focus on
the quality, and particularly the low mortality of Tas Angels fish, to justify the increase in
price ofTas Angels fish relative to the market (see Section 5.4.4). Personal selling will
continue to play an impmiant role in servicing wholesaler-customers and at least one
personal visit will be conducted to each wholesaler-customer per year. As new P. sea/are
varieties are developed through ongoing product development, samples may be distributed to
wholesaler-customers. Although not included in the financials, test-marketing of new
product variations may be used to assess likely market demand and prices for the new
varieties. The marketing schedule, detailed above, and its estimated costs for the first five
years operation are summarised in Table 46.
5.3.6 Summary of marketing strategy
As the product of Tas Angels is difficult to differentiate from competitors' products, the
marketing strategy for Tas Angels will rely heavily on positioning strategy. This strategy is
based on positioning Tas Angels as an innovative producer of a premium quality Australian
product and who offers excellent customer service.
Pticing strategies in the ornamental fish industry are largely competition based strategies,
with prices generally set by the real cost of imported fish. As such Tas Angels will utilise
competition based pricing and initially accept the going rate for its product. As production
187

....... 00 00
II able 46. Tas Angels marketing schedule for the frrst five years of operation
Marketing costs
1 ,, llarketing action Year 1 Year2 Year3 Year4
~,i;~~lling
Initial contacts to wholesaers 300 300 250 250 (letters and phone calls)*
Personal visits to 700 1,300 1,900 1,900 wholesalers •
Sales promotion
Sample shipments* 100 120 120 360
Promotional material 895 150 150 150 - A3 colour poster'
Promotional material 155 65 65 65 - A4 single colour flyers •
Promotional material 900 1,875 2,520 3,000 - Printed plastic bags *
Advertising
Advertisements 0 628 628 628 - Aquarium magazine •
Advertisement 1,100 580 580 580 -Pet Industry News •
Publicity
Total 4,150 5,018 5,793 6,533
• see Appendix E for a breakdown of these marketing costs
YearS
250
1,900
300
150
65
3,105
628
580
6,578

increases and Tas Angels establishes a reputation for excellent customer service and premium
quality fish an above market pricing strategy will be adopted. This will see prices increase from
one per cent above the market price in Year 3 to approximately five per cent above the market
by Year 5.
The distribution strategy will have a significant impact on the quality of fish reaching pet shops
and consumers. The most efficient means of distribution is to operate within the established
distribution networks offered by wholesalers and operate in a two-level channel, rather a one or
zero-level channel.
As sales will be primarily to wholesalers, promotion will rely heavily on personal selling to
wholesaler-customers. However, promotion to both pet shops and consumers through
advertising and publicity will also be useful in stimulating demand for Tas Angels fish. By
adapting a push-pull promotion strategy, demand for Tas Angels product will be maintained
throughout the initial establishment period and continue when maximum production is reached.
5.4 Financial statements and analysis for Tas Angels
This section examines financial details for the establishment and operation of Tas Angels during
the first five years of business. These financial details have been developed using the biological
submodel detailed in Section 3.6, the physical culture system detailed in Section 5.2, and
marketing data from Section 5.3. However, when applying experimental data to commercial
situations and developing farm plans a range of assumptions must be made (Medley et al., 1994),
particularly for items not determined during experimentation. The following key assumptions
have been made in developing financial data for Tas Angels:
1. economies of size have been assumed to be negligible between experimental
results and commercial production;
2. the enterprise is constructed from scratch, and it is assumed that no land and
or plant and equipment is previously owned;
3. only P. scalare will be produced at the facility, while in reality more than one
species is generally produced by ornamental fish farms;
4. the owner is responsible for the sales function and is involved in the management
189
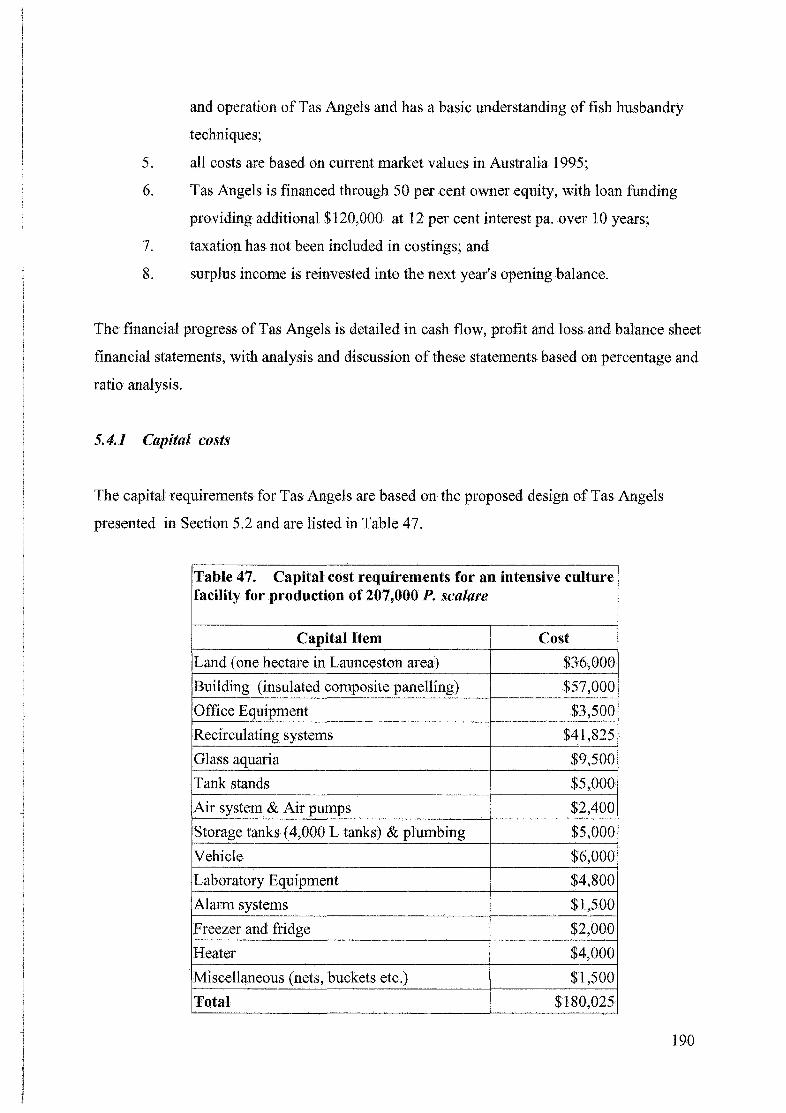
and operation of Tas Angels and has a basic understanding of fish husbandry
techniques;
5. all costs are based on current market values in Australia 1995;
6. Tas Angels is financed through 50 per cent owner equity, with loan funding
providing additional $120,000 at 12 per cent interest pa. over 10 years;
7. taxation has not been included in costings; and
8. surplus income is reinvested into the next year's opening balance.
The financial progress of Tas Angels is detailed in cash flow, profit and loss and balance sheet
financial statements, with analysis and discussion of these statements based on percentage and
ratio analysis.
5.4.1 Capital costs
The capital requirements for Tas Angels are based on the proposed design of Tas Angels
presented in Section 5.2 and are listed in Table 47.
Table 47. Capital cost requirements for an intensive culture facility for production of 207,000 P. scalare
Capital Item Cost
Land (one hectare in Launceston area) $36,000
Building (insulated composite panelling) $57,000
Office Equipment $3,500
Recirculating systems $41,825
Glass aquaria $9,500
Tank stands $5,000
Air system & Air pumps $2,400
Storage tanks (4,000 L tanks) & plumbing $5,000
Vehicle $6,000
Laboratory Equipment $4,800
Alarm systems $1,500
Freezer and fridge $2,000
Heater $4,000
Miscellaneous (nets, buckets etc.) $1,500
Total $180,025
190

These capital costs represent a substantial investment for a small business. They may be reduced
if the owner already has suitable land and or buildings, existing infrastructure (ie already has fish
farm) or is able to lease suitable premises. These options will be explored in more detail in a
subsequent section.
5.4.2 Financial statements
Computer spreadsheets allow easy expression of detailed financial actions and analysis through
financial ratios (McBryde, 1994). This study utilises such spreadsheets to detail the operation of
Tas Angels over the first five years of operation, in the form of detailed cash flow, profit and
loss, and balance sheet statements. These financials were developed based on the key
assumptions outlined above, as well as data from the biological sub-model (see Section 5.1 ),
marketing strategy detailed in Section 5.3, and details of the proposed operation ofTas Angels
as detailed in Section 5.2.1. Depreciation and loan amortisation schedules were developed as
inputs to these statements.
Depreciation schedule calculations were performed using the straight-line method based on the
economic life of the asset and the expected salvage price (see Table 48).
Table 48. Depreciation schedule of capital items for Tas Angels
Item Life span Purchase Salvage Depreciation (years) Price ($) Value($) ($)
Culture tanks 3 41,100 10,000 10,366
Tank stands 5 5,000 0 1,000
Air Compressor 5 1,400 500 180
Storage tanks (4,000 L tanks) 3 2,500 500 667
Pumps, Pipes & Fittings 3 2,500 0 833
Vehicle 10 6,000 2,500 350
Laboratory Equipment 5 4,800 2,000 560
Alarm systems 5 1,500 500 200
Freezer and fridge 5 2,000 200 360
Miscellaneous (nets, buckets 1 1,500 0 1,500 etc.)
Heater 10 4,000 1,000 300
191

A loan amortisation schedule was calculated on the basis of a 12.5 per cent annual interest rate
over 10 years, assuming a $120,000 loan for capital purchases and working capital. Table 49
details the loan repayment schedule for the first five years of operation.
Table 49. Loan repayment schedule for Tas Angels
Interest ($) Capital($)
Year 1 15,000 6,674
Year2 14,165 7,508
Year3 13,227 8,447
Year4 12,171 9,503
Year 5 10,983 10,691
A cash flow statement was developed for the first five years of operation (see Table 50). All
prices indicate current market prices in 1995. From this cash flow statement a profit and loss
statement was developed (see Table 51). A balance sheet for Tas Angels was then developed
based on the cash flow and profit and loss statements, and is detailed in Table 52. A detailed
description of calculations used in the development of these financial data is presented in
Appendix F.
The following section discusses these financial statements in more detail and uses financial ratios
to illustrate the financial progress of Tas Angels during its first five years of operation.
5.4.3 Financial analyses
Financial analysis can be used to determine the merit of any given business venture. These
methods can be classified into two types:
1. percentage analysis; and
2. ratio analysis.
These methods of analysis generally indicate changes in the relationship between financial data
through expression as a percentage of a base figure, or as a ratio between two relevant financial
192
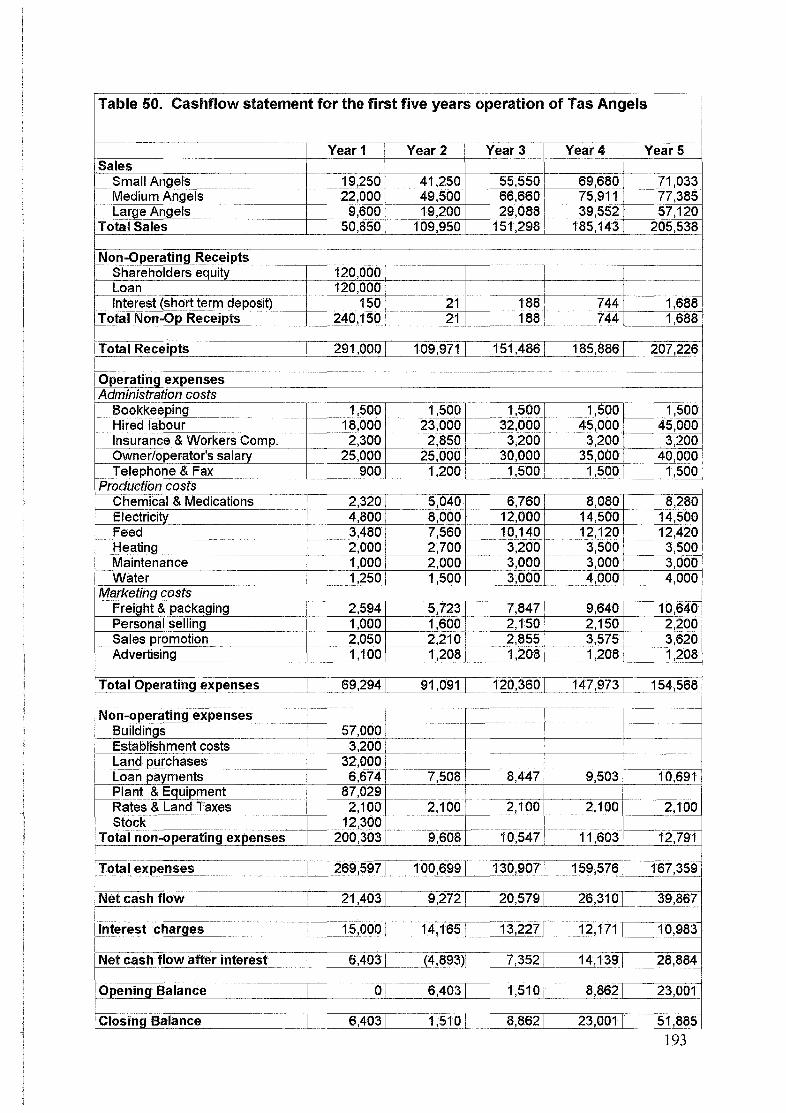
Table 50. Cashflow statement for the first five years operation of Tas Angels
r----Year1 Year 2 Year3 Year4 Yea-~
Sales Small Angels 19,250 41,250 55,550 69,680 71,033
--Medium Angels 22,000 49,500 66,660 75,911 77,385 Large Angels 9,600 19,200 29,088 39,552 57,120
Total Sales 50,850 109,950 151,298 185,143 205,538
Non-Operating Receipts Shareholders equity 120,000 Loan 120,000 Interest (short term deposit) 150 21 188 744 1,688
Total Non-Op Receipts 240,150 21 188 744 1,688
Total Receipts 291,000 109,971 151,486 185,886 207,226
--Operating expenses Administration costs
Bookkeeping 1,500 1,500 1,500 1,500 1,500 Hired labour 18,000 23,000 32,000 45,000 45,000 Insurance & Workers Comp. 2,300 2,850 3,200 3,200 3,200 Owner/operator's salary 25,000 25,000 30,000 35,000 40,000 Telephone & Fax 900 1,200 1,500 1,500 1,500
Production costs Chemical & Medications 2,320 5,040 6,760 8,080 8,280 Electricity 4,800 8,000 12,000 14,500 14,500 Feed 3,480 7,560 10,140 12,120 12~420 Heating 2,000 2,700 3,200 3,500 3,500 Maintenance 1,000 2,000 3,000 3,000 3,000
~--
Water 1,250 1,500 3,000 4,000 4,000 JV!arketing costs
Freight & packaging 2,594 5,723 7,847 9,640 10,640 Personal selling 1,000 1,600 2,150 2,150 2,200 Sales promotion 2,050 2,210 2,855 3,575 3,620 Advertising 1,100 1,208 1,;w8 1,208 1~
Total Operating expenses I 69,2941 91,091 [ 154,568 12o,36o 1 147,9731 ---
-- --Non-operating expenses
------
---Buildings
---57,000
Establishment costs 3,200 Land (:)Urchases 32,00Q_
---~---
Loan payments 6,674 --
7,508 8,447 9,503 10,691 Plant & Equipment 87,029
------
---=----- --2,100 2,100 2,100 2,100 2,100 Rates & Land Taxes
~ock 12,300 ---'-----
Total non-operating expenses 200,303 9,608 10,547 11,603 12,791
Total expenses 1 269,597 100,699 130,907 159,576 167,359
Net cash flow 21,403 9,272 20,5791 26,31o 1 39,867 c_
Interest charges 15,000 14,165 13,227 12,171 10,983
Net cash flow after interest 6,403 (4,893) 7,352 14,139 28,884
Opening Balance 0 6,4031 1 ,s1o I 8,862 23,001
Closing Balance 6,403 1,510 8,862 23,001 51,885
193
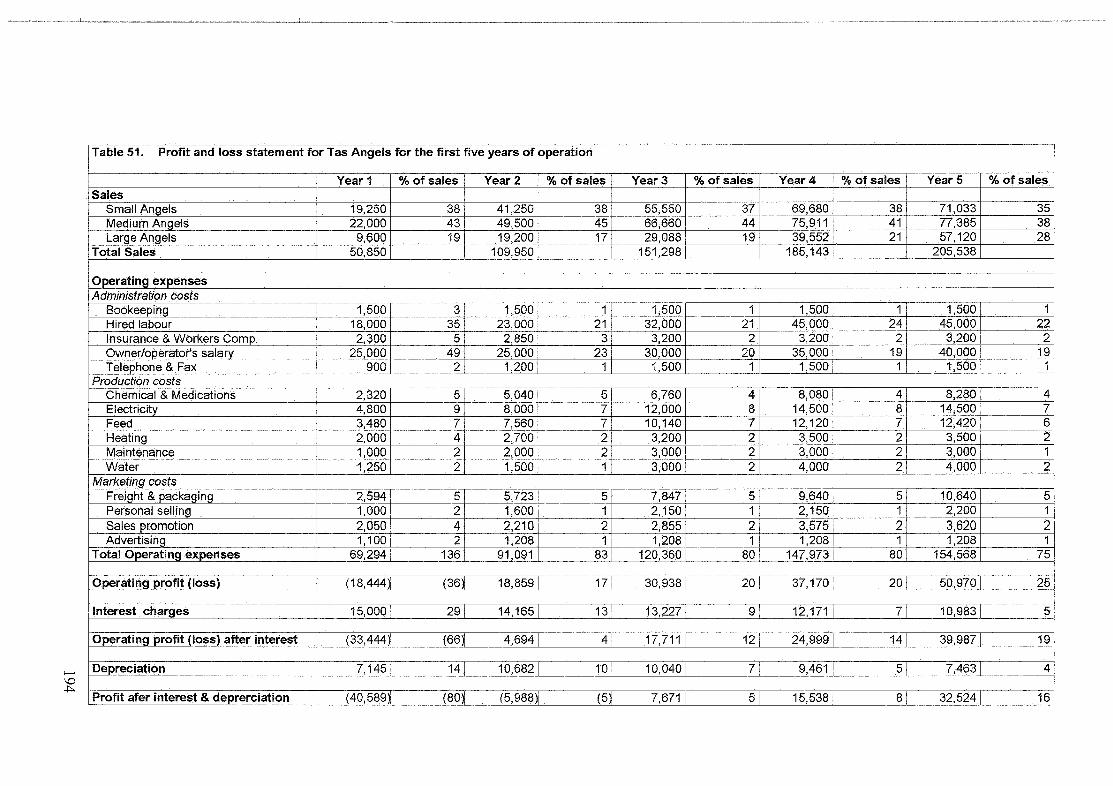
......... \0 .J:>.
j Table 51. Profit and loss statement for Tas Angels for the first five years of operation ------
Year1 %of sales Year2 %of sales Year3 %of sales Year4 %of sales Year5 %of sales Sales
Small Angels 19,250 38 41,250 38 55,550 37 69,680 38 71,033 35 Medium Angels 22,000 43 49,500 45 66,660 44 75,911 41 77,385 38
I Large Angels 9,600 19 19,200 17 29,088 19 39,552 21 57,120 28 Total Sales 50,850 109,950 151,298 185,143 205,538
Operating expenses Administration costs
Bookeeping 1,500 3 1,500 1 1,500 1 1,500 1 1,500 1 Hired labour 18,000 35 23,000 21 32,000 21 45,000 24 45,000 22 Insurance & Workers Comp. 2,300 5 2,850 3 3,200 2 3,200 2 3,200 2 Owner/operator's salary 25,000 49 25,000 23 30,000 20 35,000 19 40,000 19 Telephone & Fax 900 2 1,200 1 1,500 1 1,500 1 1,500 1
Production costs Chemical & Medications 2,320 5 5,040 5 6,760 4 8,080 4 8,280 4 Electricity 4,800 9 8,000 7 12,000 8 14,500 8 14,500 7 Feed 3,480 7 7,560 7 10,140 7 12,120 7 12,420 6 Heating 2,000 4 2,700 2 3,200 2 3,500 2 3,500 2 Maintenance 1,000 2 2,000 2 3,000 2 3,000 2 3,000 1 Water 1,250 2 1,500 1 3,000 I 2 4,000 2 4,000 2
Marketing costs Freight & packaging I 2,594 5 5,723 5 7,847 5 9,640 5 10,640 5 Personal selling 1,000 2 1,600 1 2,150 1 2,150 1 2,200 1 Sales promotion 2,0501 4 2,210 2 2,855 21 3,575 2 3,620 2 Advertising 1,100 2 1,208 1 ' 1,208 1 I 1,208 1 1,208 1
Total Operating expenses 69,294 136 91,091 83 120,360 80' 147,973 80 154,568 75
Operating profit (loss) (18,444~ (36~ 18,859 17 30,938 20 37,170 20 50,970 25
Interest charges 15,000 29 14,165 13 13,227 91 I 12,171 7 10,983 5
Operating profit (loss) after interest (33,444~ (66~ 4,694 4 17,711 121 24,999 14 39,987 19
Depreciation 7,145 14 10,682 10 10,040 71 9,461 5 7,463 4
Profit afer interest & deprerciation I (40,589~ (80~ (5,988~ (5~ 7,6711 51 15,5381 81 32,5241 16

Table 52. Balance sheet for end of Year 1 and Year for Tas Angels
Year 1 YearS
Current Assets
Cash at Bank 3,253 6,885
Short term deposits 3,000 45,000
Debtors 3,520 16,312
Broodstock 12,300 32,000
Work in progress 16,742 31,000
Total Current Assets 38,815 131,197
Fixed Assets
Land and Building (less depreciation) 89,000 84,000
Plant & Equipment (less depreciation) 72,739 34,893
Total Fixed Assets 161,739 118,893
Total Assets 200,554 250,090
Current Liabilities
Creditors 13,981 23,076
Total current liabilities 13,981 23,076
Non-current liabilities
Loan principal 113,326 70,743
Total non-current liabilities 113,326 70,743
Total liabilities 127,307 93,819
Owner's equity 73,247 156,271
items. These percentages and ratios allow financial data to be meaningfully examined over any
given time period for a single enterprise and also allow comparison between different
enterprises.
Percentage analysis can be further divided into vertical analysis or the proportional change
between financial items in different years; horizontal analysis, or the change between financial
items in different years; and trend analysis, where financial items for a series of years are
195

compared as a proportion of the earliest year (Hoggett and Edwards, 1987). As the period
examined in this case represents the construction and establishment of Tas Angels, trend and
horizontal analysis will not be used as only the final year is indicative of normal trading. Table
51 details a profit and loss statement for the first five years operation of Tas Angels and also
expresses financial data as a percentage of total sales.
Generally, financial ratios indicate the financial state of a business in the key areas of financial
stability, liquidity and profitability (Hoggett and Edwards, 1987). The use of ratios by
themselves may reveal little of what is actually happening in a business, rather these ratios
should be examined in comparison with those of industry benchmarks or for similar business
ventures (Hoggett and Edwards, 1987). In the absence of such industry and benchmark data, the
ratios may be examined over a period of time, with trends in the ratios established and
monitored. A downward trend in the ratios may indicate problems in the financial state of the
firm, whereas an upturn in the ratios may indicate an improvement in the financial state of the
enterprise.
The use and limitations of financial analysis should also be considered. One of the biggest
limiting factors is that data is historical and the nature of relationships between various data may
change significantly in the future due to a range of factors within the macro and micro
environments. As well, historical data may not give a true indication of past performance when
compared to current performance due to inflationary changes during the time period examined.
Therefore the analyst must ensure inflation changes are compensated for in any analysis
(Hoggett and Edwards, 1987). Generally year-end data are used for development of financial
statements, consequently ratios may not aptly describe the financial situation of a company's
average financial state throughout the year as companies may significantly adjust their position
through management changes at the end of year for tax purposes (Hoggett and Edwards, 1987).
Financial end of years also often coincide with the off-season or low point of the year and the
financial position of the firm may not be indicative of the norm throughout the year. In the case
of Tas Angels, there are no data available on the finances of ornamental fish farms and therefore
no industry benchmarks available for comparison. Consequently, percentage and ratio analysis
will rely on analysing any changes and! or trends in the ratios. Table 53 details changes in the
financial state of Tas Angels by illustrating changes in key financial ratios between the end of
Year 1 and Year 5 of operation.
196

Table 53. End of year financial ratios for Tas Angels
Financial Ratio Year 1 YearS Liquidity ratios
Current Ratio 2.78 5.71 (current assets/current liabilities)
Current Debt 0.11 0.25 (current liabilities I total liabilities)
Financial stability
Leverage 1.74 0.6 (total liabilities I owner's eqtuty)
Net capital 1.58 2.67 (total assets I total liabilities)
Equity value 0.45 0.63 (owner's equity I total assets)
Financial efficiency
Gross 1.98 0.84 (operating costs I sales)
Turnover 0.25 0.82 (sales I total assets)
Debt servicing 0.43 0.11 (loan payments I sales)
Expense structure 0.23 0.13 (loan payments I loan payment + operating costs)
Profitability
Profit margin (79)% 15.8%
Return on assets (16.6)% 16% (net profit I total assets)
Return on investment (45)% 25.6% (profit I equity
These financial ratios indicate that during the five year period the financial position of Tas
Angels improves somewhat, although improvements are slow in some areas. These changes are
discussed below in terms of liquidity, financial stability, and profitability in the following
paragraphs.
Liquidity. The liquidity of a business venture indicates its ability to service short term cash
requirements or current liabilities. The liquidity of Tas Angels improves substantially over the
five year period examined. The current ratio improves from 2.78 at the end of Year 1 to 5.71 at
the end of Year 5, indicating that once maximum production is reached Tas Angels has 3.72
times more assets than liabilities. This is a reflection of the large numbers of fish being grown
197
up for future sale (ie current assets) and is common for aquacultural and other livestock
enterprises (McBryde, 1994).
The current debt ratio is a measure of the level of current liabilities as a proportion of total
liabilities. The current debt ratio ofTas Angels increases from 0.11 in Year 1 to 0.25 in Year 5,
indicating that the level of current liabilities is increasing relative to non-current liabilities. This
is a reflection of changes in the debt structure of Tas Angels, with decreasing interest payments
as capital repayments are made on long term loans. The current debt ratio should continue to
increase in subsequent years as the long term loan is paid off.
Financial stability and solvency. The solvency of Tas Angels (as indicated by the leverage, net
capital, and equity value ratios) is increasing gradually over the five year period examined.
Initially Tas Angels is in an insolvent state, due to high debt load with 1.74 times more liabilities
than assets, however, as the owner's equity and stock levels increase, Tas Angels reaches a
solvent state with the leverage ratio decreasing to 0.60 by Year 5. Improvements in the net
capital ratio ( 1.58 in Year 1 to 2.67 in Year 5) and equity value (0.45 in Year 1 to 0.63 in Year
5) of Tas Angels are also evidenced over the five year period. These improvements in solvency
are due to:
1. changes in the debt structure (ie. reducing long term debt);
2. increase in cash at bank; and
3. increase in broodstock and stock levels on the farm.
Similar changes in solvency were found for an intensive red drum culture facility, with
substantial improvements in solvency mainly due to decrease in debt load of the firm (McBryde,
1994).
Profitability. The profitability of Tas Angels also improves over time, with net profit before tax
increasing from -$40,589 in Year 1 to $32,524 in Year 5. The first profitable year of production
occurs in Year 3, with a net profit before tax of $7,671 (5 per cent of sales). As increases in
production begin to slow in Years 4 to 5, the net profit increases from 8.4 per cent of sales to
15.8 per cent of sales in Year 5 respectively (see Table 51). These changes in profitability are
reflected in the financial ratios. The return on assets ratio increases from -16.6 per cent in Year
198

1 to 16 per cent in Year 5. The return on equity also improves markedly over the same time
rising from -45 per cent in Year 1 to 25.6 per cent in Year 5, indicating a reasonable return on
equity. The debt-equity levels play a major role in profitability of the enterprise. Interest
payments account for 21.6 per cent of total expenses in Year 1. However, by Year 5 interest
payments have decreased to just 7.1 per cent of total expenses when maximum production is
reached (see Table 51). Tas Angels operates at a reasonable profit margin, of 15.8 per cent,
when maximum production is reached in Year 5, with good returns on assets and equity by this
time.
As well as discussing these ratios, some discussion of percentage analysis of Tas Angels is
warranted. As would be expected variable costs maintain their relative importance over the five
year period examined. However, fixed costs decrease substantially as a percentage of sales over
the same time period. This reflects the substantial overheads needed to service Tas Angels, such
as business administration, utilities and debt servicing. These overheads remain relatively stable
over the five year period and therefore decrease in relative importance as sales increase during
the five years.
Hired labour is one of the major costs for Tas Angels, consisting of 22 per cent of sales in Year
5. When the owner/manager's salary is included the labour component increases to 36 per cent
of sales in Year 5. Losordo and Westerman ( 1994) found that for the production of Til apia in
recirculating systems labour costs accounted for just 13.33 per cent of costs, whereas the labour
costs for Tas Angels are substantially higher at 44 per cent of total costs. The higher labour cost
for Tas Angels is due mainly to the extra care and management needed in producing ornamental
fish which result in more handling of fish ( eg. grading and smiing of fish) and disease and water
quality monitoring, as well as marketing costs. Automation of some labour functions is be
possible, ie. feeding and water quality control, and would reduce labour costs. However,
automation of these labour functions is capital intensive and has not been included in this
analysis.
Generally feed is one of the major costs in intensive culture operations. An example of this is
the intensive culture of atlantic salmon, for which feed costs are the single largest cost of
production accounting for up to 56 per cent of total costs (McKelvie and Maguire, 1991; and
Logan and Johnston, 1992). However in the case ofTas Angels feed is not a major cost and
199
accounts for only 7.8 per cent of total expenses when maximum production is reached in Year 5.
This major difference in the relative importance of feed costs is due to the relative value of
omamental fish compared to food fish. P. seafare exhibits similar food conversion ratios to
salmonids (ie. 1.4:1), however, farm gate prices for P. seafare range between $350- 500 per kg
depending on size (see Table 31) whereas farm gate prices for atlantic salmon are
approximately $10- 15 per kg. Therefore the prices of direct inputs, such as feed, do not have
as great an impact on P. seafare culture as for food fish.
Heating costs account for only three per cent of total expenses when maximum production is
reached. Similar costs are encountered by commercial producers and reflect the importance of
utilising well insulated buildings to conserve heat loss. This indicates that the higher capital
costs for constructing a well insulated building are justified by the low heating costs indicated by
this study.
Therefore, Tas Angels offers some merit as an investment by an owner/operator. The poor
profitability in the first three years, however, make this investment fairly risky with the very real
possibility of failure of the business during this time if there are problems in production of P.
seafare (eg disease outbreaks). The following section discusses improvements and
recommendations for increasing the financial viability of Tas Angels.
5.4.4 Improvements and recommendations
As noted, investment in Tas Angels by an owner/operator offers reasonable retums as a long
term investment. However, the poor profitability during the first three years of operation leaves
Tas Angels particularly vulnerable in the advent of crop failure with little or no safety margin.
This risk element is due to several factors including:
1. high level of capital investment;
2. lag time in production; and
3. long establishment period.
200

The level of capital investment needed to establish Tas Angels is quite high with an initial total
investment of $240,000 through equity and loan funding, and the capital costs required to
construct the production facilities may not be justified for the limited margins involved. The
plan for Tas Angels presented here has been based on the assumption that the farm is being built
from scratch and everything needs to be purchased, consequently land and buildings need to be
purchased as well as plant and equipment. The major capital costs are for the purchase of land
(17 per cent of capital costs) and construction of the building (30.3 per cent of capital costs).
Plant and equipment purchases account for only 46.2 per cent of capital costs, with the
remaining 6.5 per cent of capital costs for stock purchases.
Therefore over 47 per cent of capital costs are utilised for providing a suitable facility in which
production facilities can be established. The long establishment period is also an important
factor for Tas Angels. Maximum production is not expected to be reached until Year 4, and the
first full year of maximum production is not until Year 5. This long start-up time is due to the
construction of facilities, establishing sufficient broodstock to produce the targeted production,
and building up stock numbers within the production facility. This raises the issue of the merit
of initially establishing the whole production facility. Although the whole facility is constructed
in Year 1, some of the culture systems are not utilised until Year 3 and therefore tie up money
that could otherwise be used as working capital and/or the level of loan funding may be reduced.
In order to illustrate possible solutions to these problems two additional scenarios to the baseline
scenario have been developed. For both these scenarios it is assumed that production schedules,
sales and production costs are the same as the baseline study. The first of these additional
scenarios details the construction and establishment of Tas Angels in three stages over the first
three years. Financial statements and assumptions for this scenario are presented in Appendix G.
The second additional scenario details a strategy in which Tas Angels leases suitable premises to
house the culture facilities. The financial statements and assumptions for this scenario are
detailed in Appendix H. To offer a comparison between the baseline scenario and these two
additional scenarios, key financial ratios and data for the end of Year 5 are presented in Table
54 and are discussed below.
201

Table 54. Comparison of end of year financial ratios of three scenarios for Tas Angels
Ratio Baseline Staged Lease
Current ratio 5.71 6.51 4.4
Current debt 0.25 0.25 0.50
Leverage 0.6 0.47 0.27
Net Capital 2.67 3.13 3.72
Equity value 0.63 0.68 0.73
Gross 0.84 0.79 0.92
Turnover 0.82 0.76 1.45
Debt service 0.11 0.08 0.03
Expense structure 0.13 0.1 0.03
Profit margin 15.8% 17% 7.7%
Return on Assets 16% 13.6% 10.8%
Return on equity 25.6% 20% 15.8%
These data indicate that the viability of Tas Angels may be increased through a three staged
expansion strategy to achieve maximum production over the five year petiod. By constructing
half of the building in Year 1, with a third of the culture systems, the first stage ofTas Angels
production facilities can act as a pilot scale facility in which the necessary numbers of
broodstock can be developed and minimal production commenced. The construction of the
remaining part of the building and culture systems would be delayed until the second and third
years when sufficient broodstock numbers have been established to meet production targets.
This would delay much of the capital cost requirements during the first two years, while still
maintaining production schedules. With careful planning and management of production,
sufficient numbers of juvenile P. seafare may be produced in the first stage of the production
facility, so that when construction of the rest of the facility is completed, the newly constructed
culture systems can be stocked with juvenile fish.
In contrast, all the building and culture systems are constructed prior to production for the
baseline scenario. Consequently more loan funds are needed to construct all the facilities and to
provide sufficient working capital to service the loan repayments. The financial statements in
202

Appendix G indicate that by using a staged expansion policy, the need for loan funding can be
reduced to $90,000 (secured during Year 1 and Year 2) compared with $120,000 for the baseline
scenatio. This reduction in loan funding is the result of securing loan funding as is needed for
the acquisition of additional plant and equipment and working capital.
Therefore the main difference between these two scenarios is the level of loan funding needed
with the financial stability of the staged expansion scenatio higher than for the baseline
scenario. This is demonstrated in the stability ratios (see Table 54), with the staged expansion
scenario ratios reflecting the greater capacity to service long term debt. The use of staged
expansion decreases the profitability of Tas Angels, with measures of profitability such as return
on assets and return on equity lower than the baseline scenario (see Table 54). However, the
value of the first five years cash flow is approximately $3,000 higher than for the baseline
scenano.
The limitation with staged expansion is that a high level of capital investment is still needed
initially to secure suitable land and building construction. These capital costs could be reduced
significantly if suitable premises could be leased. By leasing the premises that the culture
systems are housed in, the capital costs can be reduced by as much as 47 per cent of the initial
capital costs (see Appendix H). In developing a scenario based on leasing suitable premises, it
is assumed that the costs of constructing the culture systems are the same as those detailed for
staged expansion, except that land and building costs are not included. Instead, it is assumed
that suitable premises are secured on a lease at $25,000 pa (quotes were from $19,000 to 36,000
pa.). By reducing the initial capital costs involved with purchasing land and constructing
suitable premises by leasing premises, the level of loan funding needed to establish Tas Angels is
reduced to $30,000 (secured in Year 2 and Year 3). This scenario realises a closing balance of
only $22,700 after Year 5, compared $51,885 for the baseline scenario and $54,765 for the
staged expansion scenario.
This relatively poor profitability of the leasing scenario is due to the costs of leasing the
premises and servicing loans which combined total $30,419. However, in providing premises
for Tas Angels, the first two scenarios have rates and loan servicing which cost $18,356 per year
203

for staged expansion and $23,774 per year for the baseline scenario. Therefore the cost of
housing the culture systems is substantially higher when leasing with a resultant decrease in
profitability. This is evidenced by a reduction in the profit margin to 7. 7 per cent of sales for the
leasing scenario, compared with a profit margin of 19 per cent of sales for the baseline and 17
per cent for the staged expansion scenarios respectively (see Table 54). However, as with
staged expansion, leasing further increases financial stability, due to changes in the debt
structure of Tas Angels. These changes in debt structure are highlighted by the debt servicing
and expense structure ratios which are substantially lower for the leasing scenario than both
other scenarios. The current debt ratio (0.43) indicates the vastly increased importance of
current debt as a proportion of total liabilities (ie the decrease in non-current liabilities) over the
baseline and staged expansion scenarios at 0.25. This is also highlighted by changes in leverage
with total liabilities accounting for just 0.40 of owner's equity compared with 0.47 for staged
expansion and 0.60 for the baseline scenario.
These financial data indicate that although leasing offers substantially less profitability over the
period examined, it offers far greater financial stability through the ability of Tas Angels to
service both short and long term debt, and thus offers less risk of failure in the advent of
production problems.
The profitability and financial stability of Tas Angels may be improved in other ways besides
different methods of financing and establishment of Tas Angels. Increasing sales of P. sea/are
for Tas Angels should produce economies of scale and result in increased profit and financial
stability. Increasing sales of P. seafare further in Australia will also result in increased
competition with other Australian producers. There are no data on the possible ramifications of
increased competition with other Australian producers, however, it is thought that with a
continued emphasis on a push-pull promotional strategy and a more aggressive penetration
strategy Tas Angels would achieve a greater market share.
Another possible option for Tas Angels would be to increase sales through entering export
markets. A logical export market would be New Zealand. This market is geographically close
to Australia (thus minimising freight costs) and is easily accessed through flights from Hobart
and Melbourne. An important factor in accessing export markets would be the establishment of
204

disease free certification by Tas Angels. With this certification it may be possible to by-pass
quarantine in New Zealand and effectively reduce the cost of Tas Angels costs in export
markets. However, more market data are needed before any conclusions and recommendations
can be made regarding export markets.
Another way of increasing the profitability and financial stability of the enterprise is to utilise
polyculture techniques and culture P. seafare in conjunction with other species. Polyculture
techniques are used throughout the world to increase productivity and profitability of
aquaculture ventures. Low and Wong (1984) found that the red-tailed shark (Labeo erythrusus)
was a suitable candidate for polyculture with P. seafare, with the interaction of the two species
having limited impact on their respective growth and survival. Polyculture of P. seafare with
catfish, Cmydoras sp. and Aneistrus sp., has also proved successful and is regularly utilised by
commercial producers. Brown and Gratzek (1982) also indicate that many species of ornamental
fish are suitable for polyculture and the practice can be used to increase productivity of an
ornamental fish farm, with results from the industry survey conducted as part of this study
indicating that most producers in Australia produce more than one species of ornamental fish
and quite often do so through polyculture.
As there are no data on which production costs can be determined, an economic comparison of
culturing additional species cannot be made here. However, because it is common practice for
producers to culture more than one species on a farm and often in polyculture, it is suspected
that this option may further improve the viability of Tas Angels. This option would also solve
the long term problem of further expansion of P. seafare production by Tas Angels, which is
limited by the relatively small market for P. seafare in Australia (see Section 4.3.5). Production
of additional species to P. seafare by Tas Angels could expand sales through additional markets
to P. seafare. Consequently this is an area where further research is needed.
In summary, it appears that although Tas Angels may be a risky investment due to high capital
costs, long establishment time and a lag time in production. This risk may be reduced by
adopting different establishment strategies. These strategies include using a staged expansion
plan, utilising leased premises for the culture facility, or producing other species in conjunction
205

with P. seafare at Tas Angels in either polyculture or as a secondary crop. Although the leasing
option gives Tas Angels a greater level of financial stability through reduced debt levels, it is far
less profitable than the other two scenarios. By utilising staged expansion Tas Angels can
achieve the same degree of profitability as the baseline scenario, while reducing the level of loan
funding by 25 per cent. Consequently staged expansion offers a greater safety margin through
greater financial stability over the first few years of establishment. For these reasons it appears
to be the best option for establishing Tas Angels.
5.5 Summary
It appears that intensive production of P. seafare is profitable although it is a risky investment
due to high capital investment, long establishment and lag time in production, and limited
markets. Larger corporate structures would be unlikely to invest with the margins suggested by
this research (ie net present value of approximately $35,000 over five years). However
profitability may be improved if the following points can be addressed:
1. minimise capital requirements;
2. minimise labour requirements and cost; and
3. expand market.
By utilising staged expansion Tas Angels can achieve the same degree of profitability as the
baseline scenario, while reducing the level of loan funding by 25 per cent of the baseline
scenario. Consequently staged expansion offers a greater safety margin through greater financial
stability over the first few years of establishment. Although leasing gives Tas Angels a greater
level of financial stability and thus a greater safety margin in the case of production problems, it
is far less profitable than purchasing and constructing land and premises. Although there are no
data to support it, production of P. seafare in conjunction with other species appears less risky
through improvements in labour utilisation and spreading fixed costs. Further financial
improvements in Tas Angels may be achieved through economies of scale by increasing markets
206

through a more aggressive penetration strategy in Australia or by entering export markets such
as New Zealand.
Marketing strategies play an important role in Tas Angels overall establishment and expansion
strategy. In adopting a positioning strategy of premium quality product and service Tas Angels
will be able to differentiate itself from competitors supported by a push-pull promotion strategy.
An organised and efficient distribution system and strategy will be vital in ensuring supply of
product is timely and product quality is not compromised during transit. Initially Tas Angels
pricing strategy will be to accept the going-rate for its fish. However, as Tas Angels
consolidates its image as a supplier of premium quality product and service, an
above-competition pricing strategy ( eg. 5 per cent above the going-rate by Year 5) will be
adopted. Therefore, Tas Angels offers merit as an investment, particularly as a small family
business, in which case an initial investment of $120,000 by an owner/operator would return a
net present value of approximately $35,000 over the five year period examined.
207

CHAPTER6
CONCLUSION AND DIRECTIONS FOR
FUTURE RESEARCH
6.1 Purpose and value of the study
Aquaculture has been practised in various parts of the world for some 2,500 years and is
thought to have originated in China with the keeping and breeding of goldfish ( Carrassius
auratus). Since then the keeping and breeding of ornamental fish has increased in popularity
and is now one of the most popular hobbies in the western world. The market for ornamental
fish is well established, with retail sales in 1986 worth more than US$7.2 billion (Andrews,
1992) and in Australia in excess of$80 million annually (pers comm R. McKay, 1991).
The majority of ornamental fish sold in Australia are imported, with 7,872,909 ornamental
fish imported at a value of $2,720,000 landed in Australia in 1993- 94. Domestic production
is increasing, due to opportunities arising out of increasing importation costs and restrictions,
with production in 1993- 94 at 7,345,600 fish worth $4,921,700. The industry is expected to
continue to expand rapidly during the rest of the 1990's and is rated as having good prospects
for the future (O'Sullivan, 1991), with production expected to be worth in excess of$10
million by the end of the decade.
An example of a species produced in Australia is the freshwater Angelfish, Pterophyllum
seafare (Lichtenstein) (Pisces; Cichlidae ). The production of this species is minimal in
Australia, however the market demand is high due to recent problems in overseas production.
There is an opportunity for increased Australian production of good quality, reliable stocks.
208

However, the biological, marketing and economic aspects of commercial production are
poorly understood and it is difficult to assess the culture potential of P. seafare and the
possible returns and/or problems that producers may face without such data.
Bioeconomics offers a rigorous approach to studying the culture potential of a species by
treating a culture system as comprising three sub-models, viz. biological, physical and
economic/marketing. This study used bioeconomic principles to provide a preliminary
analysis of the culture potential of P. seafare, through assessing the feasibility of producing
P. seafare in an indoor, intensive culture system, situated in Launceston, Tasmania.
During this study a range of factors has been considered regarding the intensive culture of P.
seafare and has determined valuable information in the following areas:
1. This study has utilised a series of experiments and procedures to assess the culture
potential of P. seafare. The methodology and principles used here could easily be adapted to
provide preliminary analysis of the culture potential of other ornamental fish species, and
indeed food fish species as well.
2. This study has increased the understanding of the biology of P. seafare, patticularly the
quantification of reproduction and growth. These data complement the current
understanding of the biology of P. seafare and provide numerical data that can be used to
develop models of growth and reproduction.
3. This study highlights the versatility of P. seafare and its ability to adapt to intensive
culture. To date, little work has been done on intensive culture of P. seafare or indeed other
ornamental species, however, this study indicates that P. seafare is suited to intensive
culture. This suggests that intensive culture techniques may be suitable for production of
ornamental fish particularly in cold climates where traditional pond culture is not feasible.
Intensive culture technology may further increase the opportunities for production of
ornamental fish as import replacements due to better production control, year round
production and quality control.
209

4. To date there have been few studies on the production of ornamental fish in Australia
and this study has indicated the considerable potential of the ornamental fish industry to
provide opportunities for aquaculturalists. The study provides data not previously available
for the Australian industry and indicates that the impmiance of the industry is higher than
government sources have previously suggested. Although not exhaustive, this study provides
an invaluable benchmark for future studies.
6.2 Summary of results
As previously discussed this study has examined a range of biological, technical, and
economic data to determine the feasibility of intensive culture of P. seafare. The following
results were attained.
Biological sub-model
Morphometric data have been established for P. seafare, between 2.85 and 50 mm standard
length. The length weight data for P. seafare conforms to the general relationship for length
and weight in fish. Such morphometric data are essential in the development of growth
models to allow conversion between weight and length data and were used in subsequent
development of the biological submodel. Calculation of food particle size preferences for P.
seafare, between 15 and 50 mm standard length, have been used to establish a suitable
nutrition regime for P. seafare. The development of such regimes is essential in providing
an optimal diet to allow the maximum growth possible while minimising food conversion
ratios. In providing particles either too small or large, poor growth and conversion may
result as well as food may be wasted and may significantly affect the profitability of an
intensive culture system.
The choice of incubation method for eggs and larvae was found to significantly affect the
spawning frequency, inter spawning interval and fecundity of P. seafare. The results
indicate that egg removal and artificial incubation had no adverse effect on egg or larval
survival and growth, and significantly increased cumulative fecundity of P. seafare
broodstock over the experimental period. Therefore artificial incubation of eggs and larvae
can be used effectively to increase cumulative fecundity in P. seafare, without compromising
210

hatch rate larval size or survival, and is recommended for commercial producers in order to
minimise broodstock numbers and increase the reproductive efficiency of P. seafare. In
minimising broodstock numbers, the capital and operating cost requirements are reduced,
thus improving profitability of the culture facility.
Another important factor in intensive culture is fast growth rates. P. seafare exhibits good
growth rates throughout the production cycle with calculated grow-out times of 116 days for
large, 81 days for medium and 60 days for small sized P. seafare. The relatively short
production cycle for P. seafare compares favourably with many food fish species which
have considerably longer production cycles, generally more than one year. This suggests that
production of P. seafare will be more efficient in terms of productivity than food fish
production. In achieving short production cycles, production infrastructure ( eg. tanks and
ancillary equipment) are minimised as fish do not need to be kept in tanks over long
grow-out periods.
Throughout the experiments conducted in this study, P. seafare exhibited high survival rates,
with a calculated survival rate of 82 per cent to Stage V. The majority of mortalities occur
during Stage I and II. The high survival of P. seafare indicated here suggests its suitability
for intensive culture and that the methods used in this study are appropriate. The good
growth rates achieved in the study and resultant short production cycle coupled with this high
survival gives rise to an efficient production system with minimal losses and rapid turnover
of stock.
The feeding rate was found to affect the growth of Stage III - IV P. seafare. However, tank
hygiene was compromised at higher feeding rates and a feeding rate of 8 % day"1 is
recommended for Stage III - IV. Low food conversion ratios are also achieved, with an
expected food conversion ratio of 1.3:1 (at the recommended feeding rate of8 % day-1) for
Stage III- IV, which are similar to other intensively cultured species. This suggests that
feed costs for intensive P. seafare production will be similar to other intensively cultured
species, however, due to the much higher value (based on weight) of P. seafare the
importance of feed cost as a proportion of total production costs is greatly reduced.
211

Stocking density has a variable effect on growth of P. seafare between the arbitrary densities
of 0.5 fish L"1 and 2 fish L"1 for fish between 0.5 - 3g with no clear relationship between
stocking density and growth over the range tested. However, stocking density was found to
affect the fin factor of P. seafare, with fin factor decreasing linearly with increasing density
over the range examined. It was found that a density of 1 fish per litre for Stage III to IV
gave the best results in terms of minimal fin damage and maximum production. The
mechanism of this relationship is unclear, but may be due to competitive hierarchical
interactions between individuals at higher densities. This suggests that although similar
growth rates are achieved at higher densities, the loss of fin quality results in production of
substandard fish at these higher densities, and the resultant economic losses are
unacceptable.
Market analysis
The ornamental fish industry in Australia is cutTently undergoing a period of rapid expansion
after a period of pioneering by a few farms, with 34 registered ornamental fish farms in
Australia. The number of farms has remained stable since 1989- 90, however, production in
Australia has nearly doubled since 1989 - 90 with up to 40 different species cutTently
produced on a commercial scale. The importance of the ornamental fish industry is
expected to continue to grow over the next few years with production predicted to be worth
over $10 million per annum by the end of the decade.
The greatest opportunities for production of ornamental fish in Australia, and other western
countries, cutTently exist for production of fish to replace imports. These opportunities arise
from the increase of freight costs, decreases in the wild catch of species, and increasing land
use pressures and pollution in Asian countries (responsible for up to 80 per cent of world
supply of ornamental fish). Production of Australian native species will also increase in
importance as export markets for these fish are established and expanded.
Market analysis indicates that production of P. seafare in Australia for import replacement is
one such opportunity. The market is cutTently supplied by four Australian producers and
imports, mainly from Asia. Domestic production is minimal and imports are variable in
supply and quality. Therefore there is a market for production of high quality, reliable
212

stocks of P. sea/are in Australia, however, the market size is relatively small with an
estimated 350,000 tails sold per annum.
Tas Angels, a fictitious enterprise, has been used as an example to illustrate the potential of
the P. sea/are market. Tas Angels, situated in Launceston, Tasmania consists of an
intensive production facility utilising energy conservation technology providing optimal
production conditions all year, with no seasonal fluctuations in production. Although higher
capital costs are needed to construct such premises, ongoing costs are minimised. In being
situated in Launceston, Tas Angels has easy access to all the infrastructure and support
services needed to operate such a facility. Launceston is also closely located to the major
markets of Melbourne, Sydney and Brisbane, thus minimising freight costs which are a major
cost in the production of ornamental fish. Three alternative scenarios for the establishment
and financing of Tas Angels were used to illustrate the economics of producing P. sea/are,
and are reviewed below.
Farm design
Intensive production of P. sea/are is profitable and appears to offer considerable merit as a
family business. However, it is a risky investment due to high capital investment, long
establishment and lag-time in production, and limited markets, and therefore may be less
appealing to larger corporate structures. The financial stability of Tas Angels baseline
scenario is not good and the high debt loading of the business means that any problems
affecting the cash flow could result in bankruptcy. The two alternative strategies, including a
staged expansion plan and leasing premises (rather than constructing them), minimise the
capital requirements for construction of the facilities and therefore reduce the level of loan
funding needed. The staged expansion offers the best alternative to establishing Tas Angels
by minimising loan funding needed and thus offers a greater level of financial stability while
maintaining a similar level of profitability as the baseline scenario. The leasing scenario
further minimises the loan funding needed, however profitability is reduced to nearly half
that of the other two scenarios.
Further improvements in the profitability of Tas Angels may be achieved by addressing the
following:
213

1. reducing capital requirements;
2. improving production efficiencies; and
3. expanding the market size.
Although there are no data to support it, production of P. seafare in conjunction with other
species in either polyculture or as a secondary crop may be less risky, particularly through
improvements in production yields, spreading fixed costs over more than one crop species
and by minimising the risks associated with producing just one species. These
improvements result from growing an additional species (such as Corydoras catfish and
red-tailed sharks) in the same tanks asP. seafare. Such species do not occupy the same niche
as the main culture species and thus do not interact with them or compete for food and/or
space.
Marketing strategies play an important role in Tas Angels overall establishment and
expansion plan. In adopting a positioning strategy of premium quality product and service
Tas Angels would be able to differentiate itself from competitors supported by a push-pull
promotion strategy. An organised and efficient distribution system would be vital in
ensuring supply of product is timely and product quality is not compromised during transit.
Although an initial pricing policy of accepting the going-rate is recommended, the prices can
be modified to reflect the positioning strategy as production increases in Years 3 - 5 through
an above-competition pricing strategy.
Therefore, Tas Angels has merit as an investment, particularly as a small family business, in
which case an initial investment of $120,000 by an owner/operator would realise a closing
balance of approximately $54,000 over the five year period examined.
6.3 Limitations of this study
This study provides a preliminary analysis of the intensive culture of P. seafare in a facility
based in Launceston, Tasmania. As such, many of the costs and assumptions used in the
development of the marketing and financial statements may not be applicable to other
locations. Much of these data, particularly marketing data, address a finite time frame and
214
may change significantly in a relatively short period of time (ie one- two years). Limitations
may also result from errors in the collection of survey and other market infomation.
Although this study has addressed a wide range of parameters in the development of the
model for Tas Angels, it is a preliminary analysis and consequently a range of factors have
not been addressed. One such factor is that of the impact of disease on Tas Angels.
Although a quarantine and hygiene program would be used, this does not readily address the
impact that a disease outbreak could have on such an operation. In reality, disease outbreaks
have the potential to cause decreases in growth and reproduction as well as 100 per cent
mortalities.
Where data have been lacking, assumptions have been made to enable completion of the
model. Although many of these assumptions have been based on industry data and
experiences of commercial producers, they may be erroneous.
6.4 Directions for future research
During the course of conducting this study, a number of areas have been identified where
future research could be used to increase the robustness of this model.
Biological sub-model
Further investigation into the considerable variability in individual fecundity of P. seafare is
needed to increase the reliability of egg production and reduce the numbers of broodstock.
This research may include a study of the reproductive endocrinology of P. seafare as well as
oocyte maturation and ovulation.
Several aspects of the nutrition of P. seafare need to be addressed. Artemia ~p. have proved
to be a suitable live feed for first feeding P. seafare, however research into the use of larger
zooplankton species and/or the use of nutritionally boosted Artemia ~p. may improve the
growth and survival of P. sea/are during the nursery culture phase. The salmonid diet used
here is a cost effective alternative diet, but further research on the qualitative nutritional
requirements of P. seafare needs to be conducted with a view to developing a species
215

specific diet. A specifically prepared diet may substantially increase the growth and
reproductive performance of P. sea/are and therefore may reduce the cost of production.
The issue of feeding frequency used during Stages II - V also needs to be addressed and may
be of particular use in ensuring more even growth among siblings, particularly at higher
densities.
The relationship between increasing stocking density and decreasing fin factor has been
established, however the mechanism of this relationship is unclear. Further research may
determine the cause of fin erosion in P. seafare and may reveal possible ways in which fin
erosion can be reduced at high densities. Such information would allow higher stocking
densities to be used, without compromising the quality of fins.
The tolerances for pH, water hardness and temperature are well established for P. sea/are,
and water quality had no obvious negative effects on the performance of P. sea/are during
this study. However, more data are needed to determine the effects of other water quality
parameters, particularly nitrogenous compounds, on growth and performance of P. sea/are.
Market an.a/ysis
The lack of data regarding the Australian ornamental fish industry highlights the need for
further research. Although the industry survey carried out in this study is a good starting
point, a more comprehensive study of the industry is needed to establish benchmark data on
the production and marketing of ornamental fish in Australia.
Further work is also needed to improve identification of consumers and their needs as regards
ornamental fish. Consumer studies may reveal pertinent data regarding how the industry
may better service the needs of the consumer, as well as consumer preferences for different
colour and/or fin varieties.
There is also a lack of data regarding the nature of the international market for P. seafare,
which needs to be addressed before export markets can be considered.
216

Farm design
Labour has been shown to be a major production cost. Therefore research into reducing the
cost of labour through improvements in labour utilisation, new methodology, and labour
saving technology may reduce the cost of labour and increase the profitability of intensive
culture facilities such as Tas Angels. Further research into the design, construction and
operation of indoor intensive culture facilities may also improve profitability by reducing the
capital investment needed to establish such a facility.
Research into polyculture of P. scalare with other ornamental fish may also be useful in
improving the productivity of an ornamental fish farm such as Tas Angels. Although
polyculture is widely practiced in the industry, there are no data at present on which the
practice can be judged.
6.5 Final comment
Production of P. scalare in Australia is risky due to the relatively small market size, high
capital costs and long build up time in production. However, P. scalare seems to offer merit
as an aquaculture species in Australia, particularly as a family business, with production and
marketing aimed at import replacement. Further research in the biological performance of P.
scalare, increasing market size, and polyculture may further increase the culture potential of
this species.
217

REFERENCES
Al-Ahmad, T., Ridha, M., and Al-Ahmed, A.A., 1988. Production and feed ration of the tilapia
Oreochromis spilurus in seawater. Aquaculture, vol. 73, pp 111-118.
Allen, K.O., 1974. Effects of stocking density and water exchange rate on growth and survival
of channel catfish Ictalurus punctatus in circular tanks. Aquaculture, vol 4, pp 29- 39.
Allen, P.G., Botsford, L.B., Schuur, A.M., and Johnston, W.E., 1984. Bioeconomics of
aquaculture. Elsevier Science Publishers B.V. New York.
Amend, D.F., Croy, T.R., Goven, B.A., Johnson, K.A., and McCarthy, D.H., 1982.
Transportation of fish in closed systems: methods to control ammonia, carbon dioxide, pH and
bacterial growth. Transaction of the American Fisheries Society., vol. 111, pp 603 - 611.
Anderson, M.J., and Fast, A.W., 1991. Temperature and feed rate effects on Chinese catfish,
Clarias fuscus (Lacepede ), growth. Aquaculture And Fisheries Management. Vol 22, pp 435 -
441.
Andrews, C., 1992. The Ornamental Fish Trade and Fish Conservation. Infofish International,
2/92, pp 25 -29.
Anon, 1973. Tasmania Inland Fisheries Regulations 1973. Tasmanian Government Printing
Office.
218

Anon, 1979. Fish health management Volume I. Fishery Resources and Office of Continuing
Education. University of Idaho. USA.
Anon, 1989. Hach DR/2000 Spectrophotometer Handbook. Hach Company, USA.
Anon, 1991. The Student Edition ofExecustat. PWS-Kent Publishing Company.
Anon, 1992. CA-Cricket Graph III User Guide. Computer Associates International Inc.
Annon, 1994. Wholesaler/Distributor Directory. Pet lndustty News. Vol4. No.5, p 50.
Axelrod, H.R., and Burgess, W.E., 1979. Freshwater Angelfish. T .F .H. Publications Inc. USA.
Bassleer, G., 1994. The international trade in aquarium/ornamental fish. Infofish International,
5/1994, pp 15- 17.
Balarin, J.D. and Haller, R.D., 1982, in Muir, J. and Roberts, R. (eds), Recent Advances in
Aquaculture, Croom Helm Ltd.
Beamish, F.W., and Thomas, E., 1984. Effects of dietary protein and lipid on nitrogen losses in
rainbow trout, Salmo gairdneri. Aquaculture, Vol41, No.4, pp 359- 371.
Beford-Clark, S.,1993. Ornamental Fish Can Be Money Earners. Fish Farming International,
vol 21 no. 8, pp 42.
Bergmen, H., 1967. Eine deskriptive Verhaltensanalyse des Segelflossers (Pterophyllum seafare
cuv. & Val., Cichlidae, Pisces).
Blaxter, J.H., 1979. Development: Eggs and Larvae. In Hoar, W. and Randall, D. (eds). Fish
Physiology Volume III. Reproduction and Growth, Bioluminesence, Pigments and Poisons.
Academic Press Inc.
219

Bleher, H., 1989. Fish diseases are on the increase. The Australian Pet Dealer. Vol2 pp 4- 5.
Blum, V., and Fiedler, K., 1965. Hormonal control of reproductive behaviour in some cichlid
fish. General and comparitive endocrinology. Vol 5, pp 186-196.
Brett, J.R., 1979. Environmental factors and growth. In: Hoar, W., Randall, D., and Brett, J.,
Fish Physiology. Volume VIII. Academic Press Inc.
Brown, E. E., Gratzek, J. B., 1982. Fish Farming Handbook., AVI Publishing Company.
Cacho, O.J., Hatch, U., and Kinnucan, H., 1990. Bioeconomic analysis offish growth: effects
of dietary protein and ration size. Aquaculture, vol 88, pp 223-238.
Chisnall, P.M., 1991. The essence of marketing research. Prentice Hall. New York.
Chye, W.C., 1991. Ornamental Fish Breeding. Infofish International, June issue, pp 54 -59.
Coffey, D.J., 1977. The encyclopedia of aquarium fish. Rainbird Publishing Group Limited.
London.
Courtney, W. R., 1989. Fish introductions and translocations, and their impacts in Australia. In:
Pollard, D. ( ed). Introduced and translocated fishes and their ecological effects. Australian
Society for fish biology workshop. Bureau of Rural Resources proceedings No. 8.
Dabrowski, K., and Bardega, R., 1984. Mouth size and predicted food size preferences of larvae
of three cyprinid fish species. Aquaculture, vol. 40, pp 41 - 46.
Damas, T., and Kamio, H., 1978. Culture of Pterophyllum scalare (Lichtenstein, 1823) in
cement and fibrocement tanks., Rev. Cub. Invest. Pesq., Vol. 3, pp 34- 47.
220
Dambo, W.B., and Rana, K.J, 1992. Effect of stocking density on growth and survival of
Oreochromis niloticus (L.) fry in the hatchery. Aquaculture And Fisheries Management. vol23
pp 71 - 80.
Daud, S.K., Hasbollah,D. and Law, A.T., 1988. Effects of unionized ammonia on red tilapia
(Oreochromis mossambicus I 0. niloticus hybrid) fry. The second International Symposium on
Tilapia in Aquaculture. ICLARM Conference Proceedings 15.
Degani, G., 1993. Growth and body composition of juveniles of Pterophyllum sea/are
(Lichenstein) (Pisces; Cichlidae) at different densities and diets. Aquaculture And Fisheries
Management, Vol 24, pp 725-730.
Doroshev, S.I., and Cornacchia, J.W., 1979. Initial swim bladder inflation in the larvae of
Tilapia mossambicus (Peters) and Marone saxatilis (Walbaum). Aquaculture, vol 16, pp 57-66.
Egami, N., and Ishii, S., 1962. Hypophyseal control of reproductive functions in teleost fishes.
General and Comnparitive Endocrinology. Supplement 1, pp 248-253.
Fernando, A.A, and Lim, S.J., 1989. Aquarium fish are a Singapore specialty. The Australian
Pet Dealer. Vol2. pp 35- 37.
Forteath, N., 1990. A Handbook on Recirculating Systems for Aquatic Organisms. Fishing
Industry Training Board of Tasmania Inc.
Forteath, N., 1993. Fish associated factors affecting the productivity of an aquaculture facility.,
Austasia Aquaculture, Vol 7, No.3., pp 44- 45.
Fowler, J., and Cohen, L., 1992. Practical statistics for field biology. John Wiley and Sons Inc.
New York.
221

Gilbert, J.( ed), 1984. The complete aquarists guide to freshwater tropical fishes. Methuen
Australia. Sydney.
Goetz, F.W, 1983. Hormonal control of oocyte final maturation and ovulation in fishes. In:
Hoar, W.S., Randall, D.J., and Donaldson, E.M., (eds). Fish Physiology volume IX part B.
Academic Press Inc.
Goolish, E.M and Adelman, I.R., 1984. Effects of ration size and temperature on the growth of
juvenile common carp (Cyprinus carpio L.). Aquaculture, vol. 36, pp 27- 35.
Gratzek, J.B., Shotts, E.B., and Dawe, D.L., 1992. Infectious diseases and parasites of
freshwater ornamental fish. In.Gratzek, J.B., and Matthews, J.J., (eds), 1992. Aquariology. The
science of fish health management. Tetra Press Inc. USA.
Gunther, J., and Boza Abarca, J., 1992. Growth performance of Colossoma macropomum
(Cuvier) juveniles at different feed rations. Aquaculture And Fisheries Management. vol 23, pp
81 -93.
Halliwell, N., and Halliwell, D., 1991. Retailer's survey. Fish-keepers in New South Wales.
Pet Industry News. vol 1, no. 6. pp 41.
Hasan, M.R., and Macintosh, D.J., 1992. Optimum food particle size in relation to body size of
common carp, Cyprinus carpio L., fry. Aquaculture And Fisheries Management Vol23, pp
315-325
Haylor, G.S., 1991. Controlled hatchery production of Clarias gariepinus (Burchell 1822):
growth and survival of fry at high stocking density. Aquaculture And Fisheries Management,
vol. 22, pp 405 - 422.
Haylor, G.S., 1993. Controlled hatchery production of African catfish, Clarias gariepinus
(Burchell): an overview. Aquaculture And Fisheries Management, vol 24, pp 245-252.
222
Hoedeman, J.J, 1975. Naturalists guide to freshwater fish. Sterling publishing company. New
York
Hogendoom, H., 1980, Controlled Propagation of the African Catfish, Clarias Lazera (C & V).
III. Feeding and Growth of Fry. Aquaculture, Vol21. pp 233- 241.
Hoggett, J. and Edwards, L., 1987. Accounting in Australia. John Wiley and Sons. New York.
Holm, J.C., Refstie, T., and Bo, S., 1990. The effect of fish density and feeding regimes on
individual growth rate and mortality in rainbow trout ( Oncorhyncus myldss). Aquaculture, vol
89, pp 225- 232.
Hopkins, K., 1992. Reporting Fish Growth: A review of the books. World Aquaculture Society,
Vol. 23, No.3, pp 173- 179.
Huguenin, JE., and Colt, J, 1986. Application of aquacultural technology. In: M. Bilio, H.
Rosenthal, and C. Sinderman. Realism in aquaculture: Acheivements, constraints, perspectives.
European Aquaculture Society. Belgium.
Humphrey, J.D., 1989. Extensive livestock Industries- The Fish Industry. Australian Veterinary
Journal. Vol 66,. No. 20, pp 411 - 415.
Hutt, M.D, and Speh, T.W., 1995. Business marketing management. A strategic view of
industrial and organisational markets. Dryden Press. USA.
Ingram, M., 1987. The Lure of the Other Market. Fish Farmer. May-June issue, pp 17 - 18,
1993
Iwanto, R.N., and Sower, S.A., 1985. The identification of the sex steroid testosterone, in
various commercial salmon diets. Aquaculture, Vol. 49, No. 1, pp 11 - 17.
223

Jones, A., and Houde, E.D., 1986. Mass rearing of fish fry for aquaculture. In: M. Bilio, H.
Rosenthal, and C. Sinderman. Realism in aquaculture: Acheivements, constraints, perspectives.
European Aquaculture Society. Belgium.
Khada, R.B., and Rao, T.R., 1986. Prey size selection by common carp (Cyprinus carpio var.
communis) larvae in relation to age and prey density. Aquaculture, vol. 54, pp 84- 96.
Kindler, P.M., Bahr, J.M., and Philipp, D.P., 1989. Prolactin: A parental behaviour hormone in
fish. Program for the 22nd meeting of the society for the study ofreproduution. Vol40. p 157.
Abstract only.
Kindschi, G., 1987. Method for Quantifying Degree of Fin Erosion., Progressive Fish
Culturist, Vol 49, pp 314- 315.
Kindschi, G., Shaw, H.T., and Bruhn, D.S., 1991, Effects of baffles and isolation on dorsal fin
erosion in steelhead trout, Oncorhynchus mykiss (Walbaum). Aquaculture and Fisheries
Management. Vol22, pp 343-350.
Knights, B., 1983. Food particle size preferences and feeding behaviour in warmwater
aquaculture of European eel, Anguilla anguilla (L.). Aquaculture, vol. 30, pp 173 - 190.
Knights, B., 1985. Feeding behaviour and fish culture. In: Cowey, C.B., Mackie, A.M., and
Bell, J.G., Nutrition and feeding in fish. Academic Press. London.
Kotler, P., Shaw, R., Fitzroy, P., Chandler, P., 1983. Marketing in Australia. Prentice Hall of
Australia Pty Ltd.
Kreyszig, E., 1983. Advanced engineering mathematics. John Wiley & Sons, Inc. Canada.
Krise, W.F., and Meade, J.W., 1986. Review of the intensive culture of walleye fry.
Progressive Fish Culturist, Vol. 48, No.2, pp 81 - 89.
224

Lagler, K.F., Bardach, J.E., Miller, R., Pausino, D.R., 1977. Ichthyology. John Wiley & Sons
Inc. Canada.
Laird, L., and Needham, T., 1988. Salmonid and Trout Farming. Ellis Horwood Limited.
England.
Lam, T.J., 1983. Environmental influences on gonadal activity in fish. In: Hoar, W.S., Randall,
D.J., and Donaldson, E.M., (eds). Fish Physiology volume IX part B. Academic Press Inc.
Lamboume, S., 1991, Angelfish Update, Pet Industry News, Voll., No. 1, pp 23.
Langdon J.S., 1988, Investigation ofFish Kills, Proceedings 106- Fish Diseases, Post Graduate
Foundation in Veterinary Science of the University of Sydney.
Lee. C.,1991. Aquarium Fish have Market Potential., Austasia Aquaculture Magazine. Vol. 5.
No.6. Feb.
Liley, N.R., 1979. Hormones and Reproductive Behaviour in Fishes. In W. Hoar and D.
Randall, (eds) 1979. Fish Physiology Vol III, Reproduction and growth. Bioluminesence,
Pigments and Poisons. Academic Press Inc.
Logan, S.H. and Johnston, W.E., 1992. Economics of Commercial Trout production.
Aquaculture, Vol 100. pp 25- 46.
Losordo, T.M., and Westerman, P.W., 1994. An analysis of biological, economic and
engineering factors affecting the cost of fish production in recirculating aquaculture systems.
Journal of the world aquaculture society. Vol25, No.2. pp 193- 203.
Low, S. J. and Wong, C.C., 1984. The growth and survival of Labeo erythrusus Fowler, in
monoculture and in ployculture with Pterophyllum scalare (Lichenstein) respectively, in
cage-nets in a pond. Singapore Journal ofPrimary Industry., Vol 12(2)., pp 110-119.
225

Macintosh, D.J. and De Silva, S.S., 1984. The Influence of Stocking Density and Food Ration
on Fry Survival and Growth in Oreochromis mossambicus and 0. niloticus Female X 0. aureus
Male Hybrids Reared in a Closed Circulated System. Aquaculture. Vol41. pp 345- 358.
McKay, R., and Reynolds, L.F., 1983. Aquarium Fish. In Proceedings of the first freshwater
aquaculture workshop. New South Wales State Fisheries.
McBryde, G., 1994. Financial characteristics of a red drum aquaculture firm with winter nursery
production. Aquaculture, vol 122, pp 107- 118.
Mcinenry, D., and Gerrard, G., 1989. All about tropical fish. Hutchinson Australia. Singapore.
McKay. R., 1977. The Australian Aquarium fish industry and the possibility of the introduction
of exotic fish species and diseases. Australian Department of Primary Industry - Fisheries
Papaer No. 25.
McKay, R., and Wharton, J., 1992. A preliminary analysis of ornamental fish importation
Brisbane 1985 to 1991. no place a,{ publication given.
McVey, J.P. (ed), 1983, CRC Handbook ofMariculture. Volume I Crustacean Culture. CRC
Press Inc.
Mangosi, S., 1992. Contribution of the pet care industry to the Australian economy. BIS
Shrapnel Pty Ltd, Sydney, Australia.
Mansfield, E., 1988. Micro-economics. Theory and Applications. W.W. Norton & Company
Inc. USA.
Mazik, P.M., Brandt, T.M., and Tomasso, J.R., 1989. Effects of Dietary Vitamin Con growth,
Caudal Fin Development and Tolerance of Aquaculture- Related Stressors in Channel Catfish.
Progressive Fish Culturist, Vol49, pp 13- 16.
226

Merola, N. and de Souza, J.H., 1988. Cage Culture of the Amazon Fish Tambaqui, Colossoma
macropomum, at Two Stocking Densities. Aquaculture, 71: pp 15 - 21.
Mork, J., Jarvi, T., and Hansen, L.P., 1989. Lower Prevalence of Fin Erosion in Mature than in
Immature Atlantic Salmon (Salmo salar) Parr. Aquaculture, Vol 80. pp 223- 229.
Muir, J., 1982. Recirculated water systems in aquaculture. In J. Muir, and R. Roberts (eds),
1982. Recent Advances in Aquaculture. Croom Helm Ltd. London.
Munro, A.D., Scott. A.P. and Lam, T.J., 1990. Reproductive Seasonality in Teleosts:
Environmental Influences. CRC Press Inc. Florida.
Nagahama, Y., 1983. The functional morphology of teleost gonads. In: Hoar, W.S., Randall,
D.J., and Donaldson, E.M., (eds). Fish Physiology volume IX part A. Academic Press Inc.
Noakes, D.L, 1979. Parent-touching behaviour by young fishes: incidence, function and
causation. Environmental biology of fishes. vol. 4, no. 4, pp 389- 400.
0' Hanlon, P., 1988. Bioeconomic considerations in aquaculture. In Proceedings of the first
Australian shellfish aquaculture conference. Curtin University of Technology.
O'Sullivan, D., 1991. Status of Aquaculture in Australia. Austasia Aquaculture Magazine, .
Paessun, M.A. and Allison, R., 1984. Maximising Tilapia Production in Recirculating Systems
by Sequential Rearing. Aquaculture, Vol42. pp 185- 189.
Pannevis, M.C., 1993. Nutrion of ornamental fish. Waltham International Focus. Vol 3; pp 17
-22.
Parasuraman, A., 1992. Marketing Research. Addison-Wesley Publishing Company. USA.
227
Parker, N., 1981. Considerations for selecting fish production facilities. In: L. C., Allen and
E. C., Kinney (editors), Proceedings of the Bio-Engineering Symposium for Fish Culture.
American Fisheries Society. USA.
Patti, C.H., Hartley, S.W., and Kennedy, S.L., 1991. Business to business advertising: a
marketing appraoch. NTC Books. USA.
Penzes, B. and Tolg, 1., 1986. Goldfish and ornamental carp. BaiTons Educational Series Inc.
Petrovicky, 1., 1984. Tropical aquarium fishes. Hamlyn Publishing Group Ltd. Great Britian.
Pillay, T.V.R., 1990. Aquaculture. Principles and practices. Fishing News Books Ltd. Great
Britian.
Rana, K., 1988, in Muir, J., and Roberts R., (eds), Recent Advantages in Aquaculture Volume 3.
Croom Helm. London.
Raven, P.H., and Johnson, G.B., 1986. Biology. Times MiiTor/Mosby College Publishing.
USA.
Redding, J., and Patino, R., 1993. Reproductive Physiology. In Evans, D. (ed.). The
Physiology of Fishes. CRC Press Inc. USA.
Refstie, T., 1977. Effect of density on growth and survival of rainbow trout. Aquaculture, vol
11, pp 329- 334.
Ricker, W.E., 1979. Growth Rates and Models. In Hoar, W. and Randall, D. (eds). Fish
Physiology Volume VIII. Academic Press Inc.
Rogers, G.L. and Klemetson, S.L., 1984. Ammonia removal in selected aquaculture water reuse
biofilters. Aquacultural Engineering, vol4 pp 135-154.
228

Sampath, K., 1984. Preliminary report on the effects of feeding frequency in Channa striatus.
Aquaculture, vol 40, pp 301 - 306.
Sampson, D.R and Macintosh, D.J., 1986. Transportation of live carp fry in sealed polythene
bags. Aquaculture, vol 54, pp 123 - 127.
Schimdt, M.E., and Love, M.D., 1985. The Australian quarantine system for live ornamental
fish. Queensland Agricultural Journal. Jan-Feb issue, pp 29 - 30.
Shang, Y.C., 1981. Aquaculture economics. Basic concepts and methods of analysis. Westfield
Press. USA.
Shaw, S.A., 1986. Marketing the products of aquaculture. F AO Fish Technical Paper number
276. 106 p.
Shaw, S.A., 1990. Marketing. A practical guide for fish farmers. Fishing News Books. London.
Shepherd, J., and Bromage, N., 1988. Intensive fish fmming. BSP Professional Books. London.
Singh, H., Griffith, R., Takahashi, A., Kawauch, H., Thomas, P., and Stegeman, J., 1988.
Regulation of gonadal streoidogenesis in Fundulus heteroclitus by recombinant salmon growth
hormone and purified salmon prolactin. General and comparitive endocrinol06YJl· vol 72., pp
144- 153.
Soderberg, R.W., and Meade, J.W., 1987. Effects of Rearing Density on Growth, Survival and
Fin Condition of Atlantic Salmon. Progressive Fish Culturist, Vol 49, pp 280 -283.
Stanton, W.J., Etzel, M.J., and Walker, B.J, 1994. Fundamentals of marketing. McGraw-Hill
Inc. New York.
Stickney, R., 1994. Principles of aquaculture. John Wiley and Sons Inc. New York.
229
Storebakken, T., Hung, S., Calvert, C., and Plisetskaya, E., 1991. Nutrient partitioning in
rainbow trout at different feeding rates. Aquaculture, vol 96 pp 191 - 203.
Spotte S. , 1979, Fish and Invertebrate Culture. Water Management in Closed Systems. John
Wiley and Sons.
Suresh, A.R., and Lin, C.K., 1992. Effect of stocking density on water quality and prodution of
red tilapia in a recirculated water system. Aquacultural engineering, Vol. 11, No. 1, pp 1 - 22.
Teo, L.H., Chen, T.W. and Lee, B.H., 1989. Packaging of the guppy, Poecilia reticulata, for air
transport in a closed system. Aquaculture, vol 78, pp 321 - 332.
Thacker, S.G., and Griffin, W.L., 1994. Indoor intensive red drum aquaculture: A stochastic
analysis. Journal of the World Aquaculture Society. vol25, no. 1, pp 86- 100.
Tiews, K. (Ed.), 1981. Aquaculture in heated effluents and recirculation systems. Vol. II,
Heenemann, Hamburg.
Treadwell, R., McKelvie, L., and Maguire, G.B., 1992. Potential for Australian Aquaculture.
Abare Research Report 92.2. Abare, Canberra
VanDamme, P., Appelbaum, S., and Hecht, T., 1989. Sibling cannibalism in Koi carp,
Cyprinus carpio L., larvae and juveniles reared under controlled conditions. Journal of Fish
Biology, vol. 34, pp 855 - 863.
Verdegem, M.C. and McGinty, A.S., 1987, Effects of Frequency of Egg and Fry Removal on
Spawning by Tilapia nilotica in Hap as. Progressive Fish Culturist, Vol 49, pp 129 - 131.
Vijayan, M.M. and Leatherland, J.F., 1988. Effect of stocking density on the growth and stress
response in Brook Charr, Salvelinus fontinalis. Aquaculture, vol 75, pp 159- 170.
230

Watnabe, T., Kitajima, C. and Fujita,S., Nutritional Values of Live Organisms Used in Japan for
Mass Propagation of Fish: A Review. Aquaculture., Vol 34: pp 115 - 143. 1983.
Wee, K.L., and Tuan, N.A, 1988. Effects of dietary protein level on growth and reproduction
in nile tilapia ( Oreochromis niloticus). Second International Symposium on Tilapia in
Aquaculture, ICLARM proceedings 15. Manila, Philippines.
Wendelaar Bonga, S.E,1993. Endocrinology. In Evans, D. (ed.). The Physiology of Fishes.
CRC Press Inc. USA
Wharton, J., 1979. Impact of exotic animals, espaecially European carp Cyprinus carpio, on
native fauna. Victorian Fisheries and Wildlife Papers. vol20, pp 1 - 13.
Wheaton, F.W., 1977. Aquacultural Engineering, Wiley Interscience, New York, USA
Willis, S., 1992. Aquarium fish production in Australia: Part 2. Austasia Aquaculture. vol 6 no.
4., pp 40- 41.
Willis, S., Froby, D., and Morrison R., 1993. A Comparison of Artificial Diets for P. seafare.
Unpublished Data - University of Tasmania at Launceston.
Winfree, RA, Tropical Fish., World Aquaculture, Vol20, No 3, Sep 1989.
231

APPENDIX A
QUESTIONNAIRE USED IN INDUSTRY SURVEY
The questionnaire used in both stages of the survey is shown in the following pages. The
questionnaire shown was used in stage one of the survey, with the only changes for stage two
being in question 10 in which the time frame was 1992 - 93 to 1994 - 95.
232

Australian Ornamental Fish Production Survey.
Thankyou for taking the time to participate in this survey of the ornamental fish industry in Australia. The information you provide in this survey will remain strictly confidential and individual farm data will not be presented when reporting the results of this survey. In return for your assistance in completing and returning the questionnaire, I will provide you with a summary of the results from the survey. Again, thankyou for your time and assistance.
Shane Willis University of Tasmania, at Launceston. Department of Applied Science.
Please tick the appropriate response or print the relevant information in the space provided. Feel free to include any additional information and comments that you feel are relevant.
1. Would you characterise the area your farm is located in as:
DUrban D Rural
D Other------------
2. Please indicate the volume and number of tanks used in your operation in the following table.
Tank type Volume Number
Glass aquaria
Fibreglass I Plastic tanks
Ponds I dams
Other
Would you class your production as:
D Intensive (ie. high stocking rates, large reliance on artificial diets) D Semi-intensive (ie. moderate stocking densities, some reliance on artificial
diets) D Extensive (ie. low stocking densities, little reliance on artificial diets).
233

3. Do you use some form of supplementary heating for your culture systems'!
DNo DYes (if so, please specify)-------------
4. What major problems have you encountered over the past two years?
5. How many staff currently work on your farm?
Status
Family
Full- time (more than 30 hrs/wk
Part- time (less than 30 hrs/wk)
Other
6. Who do you sell your fish to?
D Wholesalers D Retailers D Exporters
Number
D Other (Please specify) -------------
7. Have you had any major disease problems (ie. severe mortalities) over the past two years?
DNo D Yes (if so please specify) --------------
234
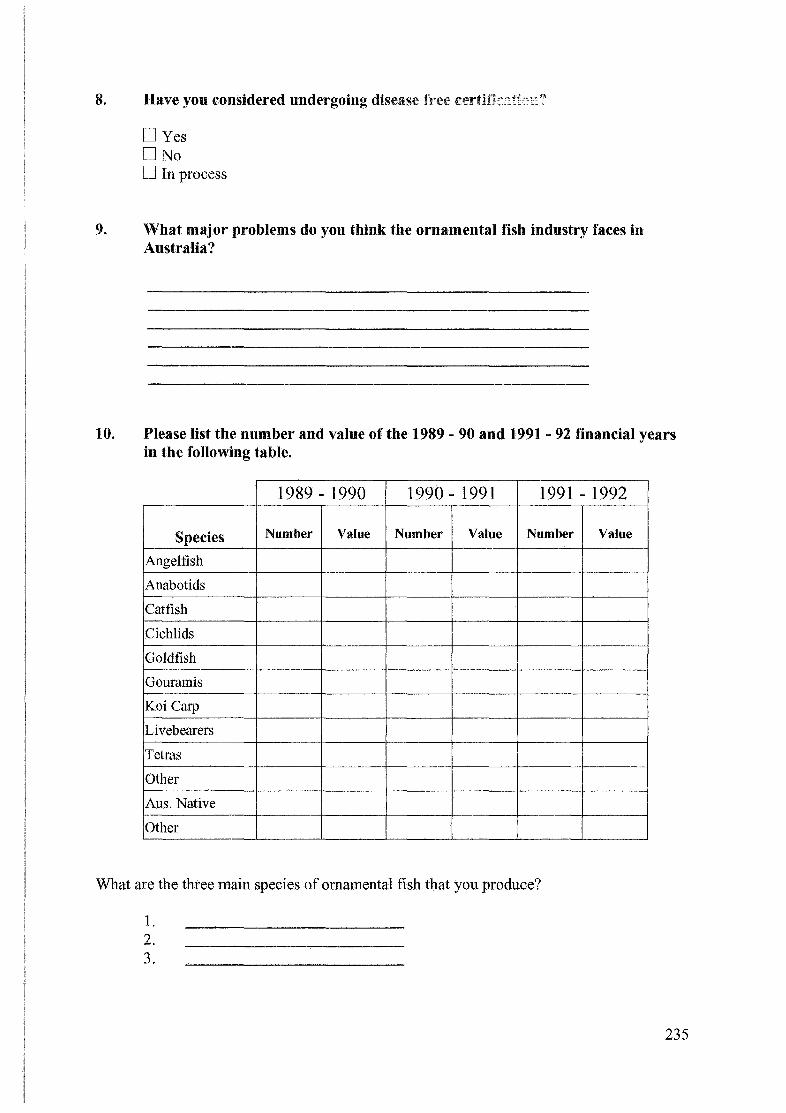
8. Have you considered undergoing disease
DYes DNo DIn process
9. What major problems do you think the ornamental fish industry faces in Australia?
10. Please list the number and value of the 1989- 90 and 1991 - 92 financial years in the following table.
1989- 1990 1990- 1991 1991 - 1992
Species Number Value Number Value Number Value
Angelfish
Anabotids
Catfish
Cichlids
Goldfish
Gouramis
Koi Carp
Livebearers
Tetras
Other
Aus. Native
Other
What are the three main species of ornamental fish that you produce?
1. 2. 3.
235

APPENDIXB
COVER-LETTER USED
IN THE INDUSTRY SURVEY
A copy of the cover-letter used in both stages of the survey is included on the following
page.
236

University of Tasmania at Launceston
Dear Sir,
Shane Willis
National Key Centre for Teaching and Research in Aquaculture
Newnham Drive Newnham
P.O. Box 1214 Launceston Tasmania 7250 Australia
I am currently employed by the National Key Centre for Teaching and Research in Aquaculture as a part-time tutor in Aquaculture. As well, I am conducting research towards a Masters Degree in Aquaculture. My research is based on assessing the potential of commercially producing Aquarium Fish in Australia to replace imported species and for export.
As part of this research I am conducting a survey of Aquarium Fish producers in Australia to assess the species produced, the numbers of these species produced, problems faced by the industry and future trends the industry faces.
The information gained from this survey will be made available to all those who participate, in a summarised form. This summary will provide information on production for each state and no individual farm data will be made available. All replies will be held strictly confidential.
I have enclosed a copy of the survey form and appreciate if you could accurately fill this out and return it as soon as possible. It is important that as many people as possible participate in the survey so that it provides accurate, meaningful information.
I greatly appreciate your help in making this survey a success. I will send you a copy of the summarised data when all the survey forms have been returned. Thank you for your time.
Yours Sincerely,
Shane Willis.
Phone: (003) 26 0536 Fax: (003) 26 6464
On the 1st January 1991 the Tasmanian State Institute of Technology and the University of Tasmania amalgamated to form the new University of Tasmania
APPENDIXC
FOLLOW--UP LETTER
USED IN THE INDUSTRY SURVEY
A copy of the follow-up letter used in both stages of the survey is included on the following
page.
238

University of Tasmania at Launceston
Dear Sir
Shane Willis National Key Centre for Teaching and Research in Aquaculture
Newnham Drive Newnham
P.O. Box 1214 Launceston Tasmania 7250 Australia
I am writing to you in reference to the Aquarium Fish Production Survey that was sent out to you during Novemeber and December last year.
Several people have responded, however, I am still waiting for a reply from about half of these surveys. I realise the time the survey was sent out is a very busy time of the year and many people would not have had time to complete the survey and return, therefore I am sending out survey forms to all the farms again in the hope that they will be completed and returned to me by the 21st of February 1992.
Again I would like to stress that this work is for my Masters Thesis and all those who participate in the survey will receive a summary of the results. However the success and value of this information will depend on your support as a lack of response from people will lead to inaccuracies in the data.
Thank you for you time and assistance in making this survey a success. I look forward to your response.
Yours faithfully
Shane Willis
Phone: (003) 26 0536 Fax: (003) 26 6464
On the 1st January 1991 the Tasmanian State Institute of Technology and the University of Tasmania amalgamated to form the new University of Tasmania

APPENDIXD
IMPORTS OF ORNAMENTAL FISH BY
COUNTRY OF ORIGIN
Table 55 lists the number and value of imports between 1990-91 and 1992-93 by country of origin, based on Australian Bureau of Statistics data.
Table 55. Imports by country of ornamental fish between 1990- 91 and 1992 - 93
1990- 1991 1991 - 1992 1992- 1993
Number FOB Value Number FOB Value Number FOB Value Country ($) ($) ($) China 15,418 19,000 0 0 0 0
Germany 120,834 71,000 96,049 90,000 97,493 150,000
Hong Kong 1,612,708 426,000 1,559,391 398,000 1,545,017 403,000 1-------- -Indonesia 208,308 117,000 322,407 137,000 449,957 212,000
Malaysia 218,591 157,000 166,837 63,000 655,298 204,000
Singapore 5,274,788 1,415,000 5,244,027 1,575,000 4,274,845 1,338,000
Thailand 165,552 63,000 170,481 78,000 221,497 90,000
Philippines 0 0 11,923 20,000 14,117 18,000
Other 6,282 19,000 22,697 25,000 10,618 22,000
Total 7,622,481 2,294,000 7,593,812 2,385,000 7,268,842 2,438,000
240

Selling
APPENDIXE
DETAILS OF PROMOTIONAL
ACTIVITIES AND COSTS
Initial contacts to wholesalers (letter and phone calls). Includes estimated cost of telephone, fax
and correspondence with potential wholesaler-customers.
Personal visits. Includes the estimated costs for the owner/manager to visit
wholesaler-customers once per year and assumes that all wholesaler-customers are visited on the
one trip. These costs are based on the following prices:
1. $189 for a return trip Launceston to Melbourne (21 day saver fare);
2. $256 for a return trip Launceston to Sydney (21 day saver fare);
3. $488 for a return trip Launceston to Brisbane, via Sydney, (21 day saver fare);
4. accommodation is assumed to be $120 per night;
eg. Total costs for Year 4 and 5 are:
1. $488 for airfares;
2. $600 for accommodation (2 nights Melbourne, 2 nights Sydney, 1 night
Brisbane);
3. Taxis and transfers $360; and
4. Food etc. $400.
241

Sales promotion
Sample shipments. The costs of sample shipments are based on the following costs:
1. Packaging $2.72
2. Fish $25 (includes fish of all varieties and sizes available);
3. Freight cost include $12 surcharge: Melbourne- $17.12, Sydney- $18.30, and
Brisbane- $20.80.
A3 sized full colour poster. The cost of A3 sized full colour posters is $895 for the first 500
(includes art and plate costs), with additional print runs of 500 costing $150.
Single colour A4 flyers. The cost of single colour A4 flyers is $155 per 1,000, with additional
print runs of 1,000 costing $65.
Printed plastic bags. The cost of printed plastic bags is $0.015 per bag for runs of 5,000 or
more.
Advertising
Pet Industry News. The cost of advertising in Pet Industry News (a trade journal) varies with the
size of advertisement. Initially a half page full colour advertisement will be run for the first 12
months ( 6 issues) costing $1,100, with a full colour quarter page advertisement
a cost of $580 for 12 months (6 issues).
Practical Aquariums and Water Gardens. Advertising in Practical Aquariums and Water
Gardens (a hobbyist magazine) will cost $628 for a full colour, quarter page run for 6 issues or
12 months.
242

APPENDIX F
DETAILS OF COST CALCULATIONS
USED TO DEVELOP FINANCIAL STATEMENTS
FOR TAS ANGELS
Cash flow and profit and loss statements
Receipts.
Sales. Sales revenue has been calculated based on projected production outlined in Section 5.3
and the pricing strategy outlined in Section 5.4.3.
eg Small Angels - production Year 1
therefore sales of small angels in Year 1
Non-operating receipts
=
=
35,000
35,000 X $0.55
$19,250
Shareholder's equity. Indicates the amount of money invested in Tas Angels by the
owner/manager. It is assumed that the owner/manager makes an initial investment of $120,000
in Tas Angels.
Loan funds. Assumes remaining money for capital purchases and working capital is secured
through loan funding at an annual interest rate of 12.5 per cent. Annual capital and inerest
243
payments have been calculated using the amortisation table provided in Microsoft Excel version
4.0.
Interest (short term deposits). Indicates the amount of interest recieved on cash at bank. An
interest rate of five per cent has been used in the calculation of interest earned.
Operating costs
Book keeping. This includes the cost of bookkeeping and preparation of annual tax returns and
is based on a quote by a local accountant.
Hired labour. At present wages for workers at land-based fish farms are not covered by any
awards. Therefore the cost of hired labour has been based on the existing award for sea-based
fish farms as follows:
1. full-time hourly rate of $9 .58; and
2. casual hourly rate of $11.51.
An additional 30 per cent of the hourly rate has been allowed for additional employment costs
( eg superannuation, leave loading and workers compensation).
Insurance & worker compensation. Insurance payments are as per a quote from Mercantile
Mutual.
Owner/operator's salary. The owner/operator's salary rises from $25,000 per annum in Year 1
to $40,000 per annum by Year 5. While not a high wage it is thought that this wage reflects
wage levels within the industry.
Telephone & Fax. Expected to increase from $150 per quarter to $200 per quarter. The cost of
initial contact phone calls to wholesaler-customers has been included in promotion costs.
244

Chemicals and medications. This is an estimate based on the findings of commercial producers
that indicate four cents per fish is spent on chemicals.
Electricity. Electricity costs have been based on unit cost of 11.4 cents (primary producer tariff),
and the calculated running costs for pumps, compressors, lights and ancillary electrical
equipment.
Feed. Feed costs have been based on the feeding schedules detailed in Section 5.2.5 and the
projected production outlined in Section 5.3. The following calculations have been used:
Weight of fish (No. fish held) x (ave weight of fish held at facility = 2.5g)
Food fed per day = Daily ration x Weight of fish
Number of bags
of food = Food fed per day /35 kg
Cost of artificial
= (Number ofbags of food x $40) x 30 feed per month
Tins of Artemia
used per month = (No.of fish per month) /870 (Number oftins used per 1,000
fish)
Cost of Artemia
per month
Feed
Tins of Artemia used per month x $20
= ((Cost of Artemia per month) x (Cost of artifical feed per
month)) x 12
Heating. Heating costs have been based on those encountered at similar facilities at the
Tasmanian Ornamental Fish Farm, using a 47 kw wood furnace.
Maintenance. The annual cost of maintenance is based on 0.6 per cent of fixed costs for Year 1,
increasing to 2.5 per cent of fixed assets in Year 5.
245

Water. The annual cost of water is budgeted at $4,000 or 2,560,000 litres per annum at full
production. This is an ample volume for maintaining good water quality and other needs.
Freight & packaging. The cost of freight and packaging has been based on the the assumption
that the average weight of a box of fish is 8 kg, and that Ansett Airfreight charges are as follows
(including a $12.00 surcharge per 20 boxes):
Brisbane =
Sydney =
Melbourne =
$8.80 per box;
$4.30 per box; and
$3.60 per box.
The cost of packaging (including, polystyrene box, plastic bags, rubber bands and oxygen) has
been calculated at an additional $2.72 per box.
Personal selling. Indicates the cost of personal selling as detailed in Appendix D.
Sales promotion. Indcates the cost of sales promotion as detailed in Appendix D.
Advertising. Indicates the cost of advertising as detailed in Appendix D.
Non-operating expenses
Buildings. Based on quotes and prices listed in Table 45.
Establishment costs. Includes incorporation costs, registration of business names and cost of
attaining a fish farm licence and council permits.
Land purchases. Based on quotes and prices listed in Table 45.
Loan payments. Principal repayments have been calculated using the amortisation table
provided in Microsoft Excel version 4.0 based on loan period of 10 years.
246

Plant & Equipment. Based on quotes and prices listed in Table 45.
Rates and Land Taxes. Rates and land taxes are based on current charges for the size land and
builkding described in Section 5.3 in the Launceston area.
Stock Purchases. Provision for the purchase of additional stock has been made to enhance the
number of varieties available. This would also include sufficient money for quarantine of these
fish on a separate premises.
Interest charges. Interest payments are based on amortisation scedule listed in Table 49 and
were calculated using the amortisation table provided in Microsoft Excel version 4.0.
Depreciation. The depreciation of assets has been calculated using the straight-line method. A
depreciation schedule is detailed in Table 48.
Balance sheet
Current assets
Cash at bank. Indicates the level of working capital in working bank account. Assumes that
the amount of cash at bank equals the closing balance minus short term deposits.
Short term deposits. Indicates the money invested in short term deposits. Based on making
investments in $2,500 blocks, while maintaining a minimum closing balance of at least $5,000
cash at bank.
Debtors. Assumes debtors are equal to 40 days production (the industry norm pers. comm R.
Datodi, 1992). Debtors is therefore determined by calculating daily operating costs (ie operating
costs I 365 days) and multiplying by 40 (days). It has been assumed that there are no
outstanding debts.
Broodstock. Indicates value of P. sea/are broodstock, based on a value of $500 per pair.
247

Work in progress. Indicates value of stock currently being grown up for sale. Assumes the
following values of fish:
Large $3.00
Medium $1.10
Small $0.55
Baby (25 - 35 mm) $0.25
Larvae $0.00
Fixed assets
Land and building. Inducates the value ofland and buildings (see Table 47) minus depreciation
(see Table 48).
Plant & equipment. Indicates the value of plant and equipment held by Tas Angels (see Table
47) minus depreciation (see Table 48).
Current liabilities
Creditors. Assumes that Tas Angels owes creditors for the previous months operating costs ( eg
feed, chemicals, freight). It is also assumed that the following year's interest payments are a
current liability.
Non-current liabilities.
Loan principal. Assumed to be equal to the capital repayments owed on cmTent loan funds.
248

APPENDIXG
ASSUMPTIONS AND COSTS FOR STAGED
EX-PANSION OF TAS ANGELS
In order to improve the profitability and financial stability of Tas Angels, construction of the
culture facility and systems can be conducted in three stages over the first three years of
operation. The first stage in Year 1, involves purchase of the land and construction of half of the
building (containing the hatchery, laboratory, office and workshop) and a third of the culture
systems (broodstock tanks and a recirculating system for limited production and grow-out of
additional broodstock). This first stage of the production facilities can then act as a pilot scale
facility in which the necessary numbers of broodstock can be developed while production targets
are achieved. The second stage of expansion is commenced in Year 2 and entails construction
of the remaining part of the building and a further third of the culture systems. With careful
planning and management of production, sufficient numbers of juvenile P. seal are may be
produced in the pilot scale production facility, so that when construction of the rest of the
facilities is completed, the newly constructed culture systems can be stocked with juvenile fish.
The third stage of expansion is commenced in Year 3 with the construction of the remaining
culture systems which would be commissioned and used for production straight away.
In developing this scenario it is assumed that the increase in production follows the same pattern
as detailed for the baseline scenario, with the same operating costs. The following financial
statements detail the impact of staged expansion on the financial state of Tas Angels and are
based on financial data presented in Tables 50 -52. Table 56 details a partial cash flow for this
scenario.
249

Table 56. Partial cash flow statement for staged expansion of Tas Angels
Year 1 Year2 Year3 Year4
Salesa 50,850 109,950 149,800 179,750
Non operating receiptsb 170,000 40,226 160 87
Total receipts 220,850 150,176 151,458 185,230
Operating costsc 69,294 91,091 120,360 147,973
Non-operating costsd 138,156 46,929 26,898 8,876
Total costs 207,450 138,020 147,258 156,849
Net cash flow 13,400 12,156 4,200 28,381
Intereste 6,250 10,902 10,593 9,480
Net cash flow after interest 7,150 1,254 (6,393) 18,901
Opening balance 0 7,150 8,404 2,011
Closing balance 7,150 8,404 2,011 20,912
Notes:
a sales are assumed to be the same as the baseline scenario (see Appendix F).
b assumes initial investment of$120,000 by owner and loan funds of$50,000 and
$40,000 secured in Years 1 and 2. Interest earnings from cash at bank and short term
deposits are based on five percent per annum.
c operating costs are assumed to be the same as the baseline scenario (see Appendix F).
d non-operating costs are assumed to be the same as the baseline scenario, except loan
repayments are based on an amortisation schedule for a $50,000 and $40,000 loans
over ten years at 12.5 per cent interest per annum.
e interest payments are based on an amortisation schedule for a $50,000 and $40,000
loan over ten years at 12.5 per cent interest per annum.
YearS
195,750
1,239
206,777
154,568
9,723
164,291
42,486
8,633
33,853
20,912
54,765
The cash flow statement in Table 56 was used to develop a profit and loss statement for the
staged expansion of Tas Angels, which is detailed in Table 57.
250
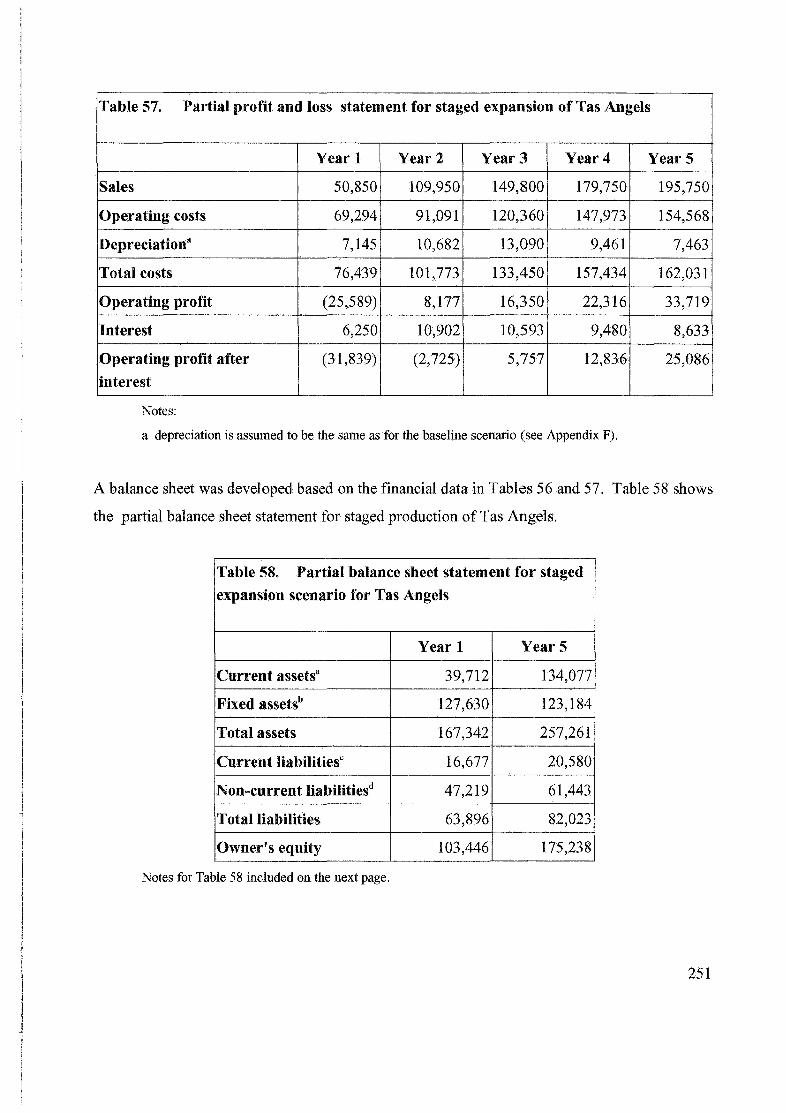
Table 57. Partial profit and loss statement for staged expansion of Tas Angels
Year 1 Year2 Year3 Year4 YearS
Sales 50,850 109,950 149,800 179,750 195,750
Operating costs 69,294 91,091 120,360 147,973 154,568
Depreciationa 7,145 10,682 13,090 9,461 7,463
Total costs 76,439 101,773 133,450 157,434 162,031
Operating profit (25,589) 8,177 16,350 22,316 33,719
Interest 6,250 10,902 10,593 9,480 8,633
Operating profit after (31,839) (2,725) 5,757 12,836 25,086
interest
Notes:
a depreciation is assmned to be the same as for the baseline scenario (see Appendix F).
A balance sheet was developed based on the financial data in Tables 56 and 57. Table 58 shows
the partial balance sheet statement for staged production of Tas Angels.
Table 58. Partial balance sheet statement for staged expansion scenario for Tas Angels
Year 1 YearS
Current assetsa 39,712 134,077
Fixed assetsb 127,630 123,184
Total assets 167,342 257,261
Current liabilitiesc 16,677 20,580
Non-current liabilitiesd 47,219 61,443
Total liabilities 63,896 82,023
Owner's equity 103,446 175,238
Notes for Table 58 included on the next page.
251

Notes:
a assumed to be the same as the baseline scenario except for cash atbank and short tenn
deposits (see Appendix F).
b assumed to be the same as for the basline scenario (see Appendix F).
c assumed to be 1112 of operating costs plus the following years interest payments
(which is based on an amortisation schedule for a $50,000 and $40,000 over ten years
at 12.5 per cent interest per annum).
d assumed to be the remaining debt equity (which is based on an amortisation schedule
tor a $50,000 and $40,000 over ten years at 12.5 per cent interest per annum.
252

APPENDIXH
ASSUMPTIONS AND COSTS FOR
LEASING SCENARIO OF TAS ANGELS
The initial capital costs involved with establishing Tas Angels can be reduced through leasing
suitable premises. This scenario has been developed on the assumption that a staged expansion
(see Appendix F) is used but that suitable premises are secured on a lease of $25,000 pa (quotes
were from $19,000 to 36,000 pa.).
It is assumed that these premises are constructed as is detailed in Section 5 .2, with sales and
costs as detailed in Appendix F. The level ofloan funding needed is reduced to $30,000
(secured in Year 2 and Year 3).
Based on these assumptions a partial cash flow statement for the leasing option for Tas Angels
was developed (see Table 59).
253

Table 59. Partial cash flow statement for leasing production facility by Tas Angels
Year 1 Year2 Year3 Year4
Sales a 50,850 109,950 151,298 185,143
Non operating receiptsb 120,000 20,611 10,067 0
Total receipts 170,850 130,561 161,365 185,143
Operating costsc 94,294 118,091 144,940 172,563
Non-operating costsd 61,275 23,587 20,582 2,034
Total costs 155,569 141,678 165,522 174,597
Net cash flow 15,281 (11,117) (4,157) 10,546
Intereste 0 2,500 3,611 3,385
Net cash flow after interest 15,281 (13,617) (7,768) 7,161
Opening balance 0 15,281 1,664 (6,104)
Closing balance 15,281 1,664 (6,104) 1,057
Notes:
a sales are assumed to be the same as the baseline scenario (see Appendix F).
b assumes initial investment of $120,000 by owner and loan funds of $20,000 and
$10,000 secured in Years 2 and 3. Interest earnings from cash at bank and short tenn
deposits are based on five percent per annum.
c operating costs are assmned to be the same as the baseline scenario (see Appendix F).
d non-operating costs are assumed to be the same as the baseline scenario, except loan
repayments are based on an amortisation schedule for a $20,000 and $10,000 loans
over ten years at 12.5 per cent interest per annum. Rates and land taxes are assumed to
be included in rent. Rent is assumed to be $25,000 per annum.
e interest payments are based on an amortisation schedule for a $20,000 and $10,000
loan over ten years at 12.5 per cent interest per rumum.
YearS
205,538
642
206,180
179,118
2,288
181,406
24,774
3,131
21,643
1,057
22,700
Table 60 details a partial profit and loss statement for Tas Angels leasing suitable premises.
254

Table 60. Partial profit and loss statement for leasing scenario for Tas Angels
Year 1 Year2 Year3 Year4
Sales 50,850 109,950 151,298 185,143
Operating costsa 94,294 118,091 144,940 172,563
Depreciationb 7,145 10,682 13,090 9,461
Total costs 101,439 128,773 158,030 182,024
Operating profit (50,589) (18,823) (6,732) 3,119
Interestc 0 2,500 3,611 3,385
Operating profit after (50,589) (21,323) (10,343) (266)
interest
Notes:
a operating costs are assumed to be the same as for the baseline scenario (see Appendix
F), except that rent of $25,000 is included.
b depreciation is assumed to be the same as for the baseline scenario (see Appendix F),
except no depreciation value is given for land and buildings.
c interest payments are based on an amortisation schedule for a $20,000 and $10,000
loan over ten years at 12.5 per cent interest per annwn.
Table 61 lists a balance sheet statement for Tas Angels leasing suitable premises.
YearS
205,538
179,118
7,463
186,581
18,957
3,131
15,826
255

Table 61. Partial balance sheet statement for Tas Angels leasing suitable premises
Year 1 YearS
Current assetsa 47,843 101,726
Fixed assetsb 38,630 39,184
Total assets 86,473 140,910
Current liabilitiesc 10,357 17,827
Non-cnrrent liabilitiesd 0 22,759
Total liabilities 10,357 40,586
Owner's equity 76,116 100,324
Notes:
a assumed to be the same as the baseline scenario, except for cash atbank and short term
deposits (see Appendix E).
b assmned to be the same as the plant and equipment listed in the basline scenario (see
Appendix E).
c assumed to be 1/12 of operating costs plus the following years interest payments
(which is based on an amortisation schedule for a $20,000 and $10,000 over ten years
at 12.5 per cent interest per annum).
d assumed to be the remaining debt equity (which is based on an amortisation schedule
for a $20,000 and $10,000 over ten years at 12.5 per cent interest per annum.
256


![ORNAMENTAL AQUACULTURE [objectives] – Chapter 15 Meaning and nature Components Management Selection factors Production methods Plant selection and culture.](https://static.fdocuments.in/doc/165x107/56649db05503460f94a9ef55/ornamental-aquaculture-objectives-chapter-15-meaning-and-nature-components.jpg)