
Chapter4. Data Analysis & interpretation -...
45
65 | Page Chapter4. Data Analysis & interpretation Questionnaire 1 has taken from objective No. 1 (To identify the Customer Relationship Management (CRM) practices in banking sector in Pune city.) . Q4.1 Are you utilizing any services of bank? (a) Yes (b) No Respondents Percentage Yes 1000 91% No 100 9% Total 1100 100% Table 4.1
Transcript of Chapter4. Data Analysis & interpretation -...

65 | P a g e
Chapter4. Data Analysis & interpretation
Questionnaire 1 has taken from objective No. 1 (To identify the Customer Relationship
Management (CRM) practices in banking sector in Pune city.)
.
Q4.1 Are you utilizing any services of bank?
(a) Yes (b) No
Respondents Percentage
Yes 1000 91%
No 100 9%
Total 1100 100%
Table 4.1

66 | P a g e
Figure 4.1
With the help of the graph it is clear that 91% customer utilizing any services of bank out of
1000 Respondents.

67 | P a g e
Questionnaire 2 has taken from objective No. 2. (To study the advantage of Customer
Relationship Management in SBI Bank, CBI, ICICI Bank, HDFC Bank in Pune city.)
Q4.2 If yes, which product
(a) ATM card (b) Credit card (c) Personal loan (d) Auto loan
(e) House loan (f) Bank account
Name of bank ATM card
Credit card
Personal loan
Auto loan
House loan
Bank account
SBI Bank 50% 5% 10% 15% 15% 5%
ICICI Bank 40% 10% 15% 15% 19% 1%
CBI Bank 45% 5% 10% 10% 20% 10%
HDFC Bank 40% 15% 10% 19% 15% 1%
Table 4.2

68 | P a g e
Figure 4.2 With the help of the graph it is clear that customers used product as ATM card with 50% SBI
Bank, 40% ICICI Bank, 45% CBI Bank and 40% HDFC Bank out of 250 customers each
bank.

69 | P a g e
Questionnaire 3 has taken from objective No. 1. (To identify the Customer Relationship
Management (CRM) practices in Banking sector in Pune city.)
Q4.3 which type of bank you prefer?
(a) Government (b) Private
Name of bank Respondents Percentage
SBI Bank 237 95%
ICICI Bank 175 70%
CBI Bank 225 90%
HDFC Bank 150 60%
Table 4.3

70 | P a g e
0
10
20
30
40
50
60
70
80
90
100
Yes No
SBI Bank
ICICI Bank
CBI Bank
HDFC Bank
Figure 4.3 With the help of the graph it is clear that customers prefer Government bank with 95% SBI
Bank, 70% ICICI Bank, 90% CBI Bank and 60% HDFC Bank out of 250 customers each
bank.

71 | P a g e
Questionnaire 4 has taken from objective No. 2. (To study the advantage of Customer
Relationship Management in SBI Bank, CBI, ICICI Bank, HDFC Bank in Pune city.)
Q4.4 when you need to borrow money for things other than cars, home appliances and home
purchase etc., then
Table 4.4
Name of bank
< 1 Lac < 5 Lac <10 Lac >10 Lac
SBI Bank 20% 55% 15% 10%
ICICI Bank 25% 50% 15% 10%
CBI Bank 30% 50% 15% 5%
HDFC Bank 20% 65% 10% 5%

72 | P a g e
Figure 4.4 With the help of the graph it is clear that customers need to borrow money for things other
than cars, home appliances and home purchase etc., then customers take loan amount as <5
Lac with 55% SBI Bank, 50% ICICI Bank, 50% CBI Bank and 65% HDFC Bank out of 250
customers each bank.

73 | P a g e
Questionnaire 5 has taken from objective No. 2. (To study the advantage of Customer
Relationship Management in SBI Bank, CBI, ICICI Bank, HDFC Bank in Pune city.)
Q4.5 where would you prefer to invest your saving?
(a) Fixed Deposit (b) Saving account (c) Mutual Funds (d) Insurance
(e) Shares Market (f) Others
Table 4.5
Name of bank Fixed Deposit
Saving account
Mutual Funds
Insurance Shares Market
others
SBI Bank 50% 20% 10% 10% 5% 5%
ICICI Bank 40% 10% 10% 20% 15% 5%
CBI Bank 45% 30% 5% 10% 5% 5%
HDFC Bank 35% 10% 15% 20% 15% 5%

74 | P a g e
0
10
20
30
40
50
60
SBI Bank
ICICI Bank
CBI Bank
HDFC Bank
Figure 4.5
With the help of the graph it is clear that customers prefer to invest our saving as Fixed
Deposit with 50% SBI Bank, 40% ICICI Bank, 45% CBI Bank and 35% HDFC Bank out of
250 customers each bank.

75 | P a g e
Questionnaire 6 has taken from objective No. 2. (To study the advantage of Customer
Relationship Management in SBI Bank, CBI, ICICI Bank, HDFC Bank in Pune city.)
Q4.6 is the customer using any of the following channels and value added product?
(a) Debit cards Yes No
(b) Net banking Yes No
(c) Phone banking Yes No
(d) SMS Alerts Yes No
(e) Bill pay Yes No
Table 4.6
Name of bank
Debit cards Net banking
Phone banking
SMS Alerts
Bill pay
SBI Bank 60% 10% 5% 20% 5%
ICICI Bank 50% 20% 5% 15% 10%
CBI Bank 55% 5% 10% 25% 5%
HDFC Bank 45% 25% 5% 15% 10%

76 | P a g e
Figure 4.6 With the help of the graph it is clear that customers using value added product as Debit cards
with 60% SBI Bank, 50% ICICI Bank, 55% CBI Bank and 45% HDFC Bank out of 250
customers each bank.

77 | P a g e
Questionnaire 7 has taken from objective No. 3 (d) Customer communication channel.
Q4.7 how offend does the customer visits his bank branch?
(a) Once a 3 months (b) Once a 1 month (c) Once a week (d) Once a day
Name of bank Once a 3
months Once a 1 month
Once a week Once a day
SBI Bank 20% 50% 25% 5%
ICICI Bank 30% 40% 20% 10%
CBI Bank 25% 55% 10% 10%
HDFC Bank 35% 40% 15% 10%
Table 4.7

78 | P a g e
Figure 4.7
With the help of the graph it is clear that customer’s visit their bank branch once a 1 month
with 50% SBI Bank, 40% ICICI Bank, 55% CBI Bank and 40% HDFC Bank out of 250
customers each bank.

79 | P a g e
Questionnaire 8 has taken from objective No. 3(a) Customer Retention.
Q4.8 Do you believe that private banks provide superior services than government banks?
(a) Yes (b) No
Table 4.8
Name of bank Respondents Percentage
SBI Bank 237 95%
ICICI Bank 175 70%
CBI Bank 225 90%
HDFC Bank 150 60%

80 | P a g e
Figure 4.8
With the help of the graph it is clear that customers believe that private banks provide superior
services than government banks with 95% SBI Bank, 70% ICICI Bank, 90% CBI Bank and
60% HDFC Bank out of 250 customers each bank.

81 | P a g e
Questionnaire 9 has taken from objective No. 3(b) Customer value and CRM performance
.
Q4.9 Are you satisfied with bank services?
(a) Yes (b) No
Table 4.9
Name of bank Respondents Percentage
SBI Bank 225 90%
ICICI Bank 175 70%
CBI Bank 200 80%
HDFC Bank 187 75%

82 | P a g e
Figure 4.9
With the help of the graph it is clear that customers satisfied with bank services with 90%
SBI Bank, 70% ICICI Bank, 80% CBI Bank and 75% HDFC Bank out of 250 customers
each bank.

83 | P a g e
Questionnaire 10 has taken from objective no. 3(b) Customer value and CRM performance.
.
Q4.10 what is recommendation by the unsatisfied customers?
(a) Bank polices (c) Interest rate
(b) Customers services (d) No recommendation
Name of bank Bank polices
Customers services
Interest rate No recommendation
SBI Bank 5% 80% 5% 10%
ICICI Bank 10% 60% 10% 20%
CBI Bank 5% 70% 10% 15%
HDFC Bank 10% 55% 10% 25%
Table 4.10

84 | P a g e
0
10
20
30
40
50
60
70
80
90
SBI Bank
ICICI Bank
CBI Bank
HDFC Bank
Figure 4.10
With the help of the graph it is clear that the unsatisfied customers recommendation
customers services with 80% SBI Bank, 60% ICICI Bank, 70% CBI Bank and 55% HDFC
Bank out of 250 customers each bank.

85 | P a g e
Questionnaire 11 has taken from objective No. 3(a) Customer Retention.
Q4.11 Does your bank keep a track of the key (frequent and profitable) customers?
(a) Yes (b) No
Name of bank Respondents Percentage
SBI Bank 200 80%
ICICI Bank 225 90%
CBI Bank 175 70%
HDFC Bank 237 95%
Table 4.11

86 | P a g e
0
10
20
30
40
50
60
70
80
90
100
Yes No
SBI Bank
ICICI Bank
CBI Bank
HDFC Bank
Figure 4.11
With the help of the graph it is clear that banks are keep a track of the key (frequent and
profitable) customers with 80% SBI Bank, 90% ICICI Bank, 70% CBI Bank and 95% HDFC
Bank out of 250 customers each bank.

87 | P a g e
Questionnaire 12 has taken from objective No. 3(a) Customer Retention.
Q4.12 Does your bank collect any data about these customers?
(a) Yes (b) No
Name of bank Respondents Percentage
SBI Bank 200 80%
ICICI Bank 225 90%
CBI Bank 175 70%
HDFC Bank 237 95%
Table 4.12

88 | P a g e
0
10
20
30
40
50
60
70
80
90
100
Yes No
SBI Bank
ICICI Bank
CBI Bank
HDFC Bank
Figure 4.12
With the help of the graph it is clear that banks are keep a track of the key (frequent and
profitable) customers with 80% SBI Bank, 90% ICICI Bank, 70% CBI Bank and 95% HDFC
Bank out of 250 customers each bank.

89 | P a g e
Questionnaire 13 has taken from objective No. 3(b) Customer value and CRM performance.
Q4.13 what type of data do you collect?
(a) Demographic (b) Buying pattern (c) Life style (d) Channel Preferences
(e) Habits (f) others
Table 4.13
Name of bank
Demographic
Buying pattern
Life style
Channel Preferen
ces
Habits others
SBI Bank
60% 10% 5% 10% 10% 5%
ICICI Bank
50% 10% 10% 15% 10% 5%
CBI Bank
50% 15% 5% 10% 15% 5%
HDFC Bank
40% 20% 10% 10% 15% 5%

90 | P a g e
0
10
20
30
40
50
60
70
SBI Bank
ICICI Bank
CBI Bank
HDFC Bank
Figure 4.13 With the help of the graph it is clear that banks collect data from customers with 60%
Demographic data from SBI Bank, 50% ICICI Bank, 50% CBI Bank and 40% HDFC Bank
out of 250 customers each bank.

91 | P a g e
Questionnaire 14 has taken from objective No. 3(c) Customer loyalty.
Q4.14 Does your bank reward the key (frequent and profitable) customers?
(a) Yes (b) No
Table 4.14
Name of bank Respondents Percentage
SBI Bank 200 80%
ICICI Bank 225 90%
CBI Bank 188 75%
HDFC Bank 213 85%

92 | P a g e
0
10
20
30
40
50
60
70
80
90
100
Yes No
SBI Bank
ICICI Bank
CBI Bank
HDFC Bank
Figure 4.14
With the help of the graph it is clear that banks rewarded the key (frequent and profitable)
customers with 80% SBI Bank, 90% ICICI Bank, 75% CBI Bank and 85% HDFC Bank out of
250 customers each bank.

93 | P a g e
Questionnaire 15 has taken from objective No. 3(c) Customer loyalty.
Q4.15 how do you reward these customers?
(a) gifts/discounts (b) dinner/lunch party (c) Loyalty programmes (d) others
Table 4.15
Name of bank
Gifts/discounts Dinner/lunch party
Loyalty programmes
Others
SBI Bank
70 10 15 5
ICICI Bank
80 5 10 5
CBI Bank 60 10 20 10
HDFC Bank
75 15 5 5

94 | P a g e
Figure 4.15
With the help of the graph it is clear that banks rewarded these customers as gifts/discounts
with 70% SBI Bank, 80% ICICI Bank, 60% CBI Bank and 75% HDFC Bank out of 250
customers each bank.

95 | P a g e
Questionnaire 16 has taken from objective No. 3(b) Customer value and CRM performance.
Q4.16 is your employee empowered to take decision that may positively affect Customer Satisfaction, in the absence of his superior?
(a) Yes (b) No
Name of bank Respondents Percentage
SBI Bank 175 70%
ICICI Bank 225 90%
CBI Bank 200 80%
HDFC Bank 212 85%
Table 4.16

96 | P a g e
0
10
20
30
40
50
60
70
80
90
100
Yes No
SBI Bank
ICICI Bank
CBI Bank
HDFC Bank
Figure 4.16
With the help of the graph it is clear that bank employee empowered to take decision that may
positively affect customer satisfaction, in the absence of his superior with 70% SBI Bank, 90%
ICICI Bank, 80% CBI Bank and 85% HDFC Bank out of 250 customers each bank.
97 | P a g e
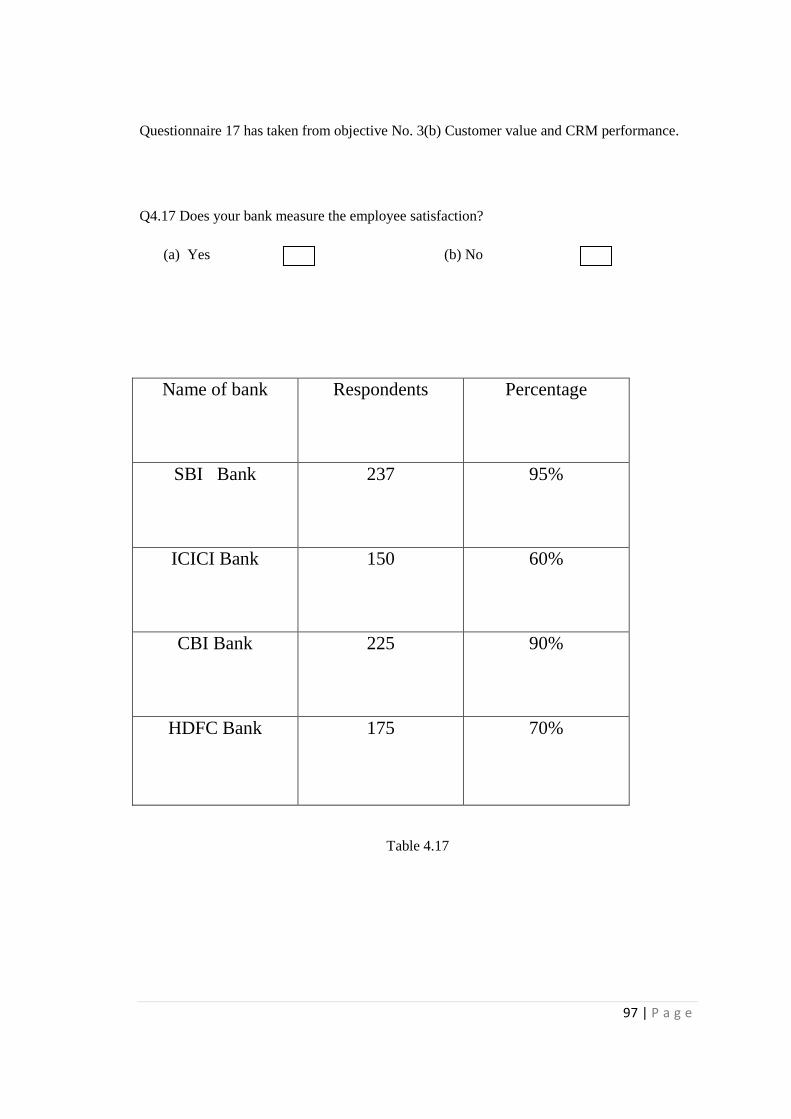
Questionnaire 17 has taken from objective No. 3(b) Customer value and CRM performance.
Q4.17 Does your bank measure the employee satisfaction?
(a) Yes (b) No
Table 4.17
Name of bank Respondents Percentage
SBI Bank 237 95%
ICICI Bank 150 60%
CBI Bank 225 90%
HDFC Bank 175 70%

98 | P a g e
Figure 4.17
With the help of the graph it is clear that banks measure the employee satisfaction with 95%
SBI Bank, 60% ICICI Bank, 90% CBI Bank and 70% HDFC Bank out of 250 customers each
bank.

99 | P a g e
Questionnaire 18 has taken from objective No. 3(d) Customer communication channel.
Q4.18 If yes, what are the tools that you use to measure the employee satisfaction? (a) Formal dialogue (b) Suggestion box (c) Feedback form (d) others
Table 4.18
Name of bank
Formal dialogue
Suggestion box
Feedback form
Others
SBI Bank
60 20 15 5
ICICI Bank
70 5 20 5
CBI Bank
50 25 20 5
HDFC Bank
60 15 20 5

100 | P a g e
Figure 4.18
With the help of the graph it is clear that banks use to measure the employee satisfaction as
formal dialogue with 60% SBI Bank, 70% ICICI Bank, 50% CBI Bank and 60% HDFC Bank
out of 250 customers each bank.

101 | P a g e
Questionnaire 19 has taken from objective No. 3(d) Customer communication channel.
Q4.19 does your bank train employees in customer service?
(a) Yes (b) No
Table 4.19
Name of bank Respondents Percentage
SBI Bank 200 80%
ICICI Bank 237 95%
CBI Bank 288 75%
HDFC Bank 225 90%

102 | P a g e
0
10
20
30
40
50
60
70
80
90
100
Yes No
SBI Bank
ICICI Bank
CBI Bank
HDFC Bank
Figure 4.19
With the help of the graph it is clear that banks have trained employees in customer service
with 80% SBI Bank, 95% ICICI Bank, 75% CBI Bank and 90% HDFC Bank out of 250
customers each bank.

103 | P a g e
Questionnaire 20 has taken from objective No. 3(d) Customer communication channel.
.
Q4.20 State the communication channel you use for customer interaction? (a) E-mail /fax/letters (b) Call centers (c) Executive visit (d) others
Table 4.20
Name of bank
E-mail/ fax/letters
Call centers Executive visit
Others
SBI Bank 75 10 5 10
ICICI Bank
60 20 15 5
CBI Bank 70 15 5 10
HDFC Bank
50 20 20 10

104 | P a g e
0
10
20
30
40
50
60
70
80
E-mail /fax/letters
Call center s Executive visit
Others
SBI Bank
ICICI Bank
CBI Bank
HDFC Bank
Figure 4.20
With the help of the graph it is clear that banks use the communication channel as E-mail
/fax/letters for customer interaction with 75% SBI Bank, 60% ICICI Bank, 70% CBI Bank and
50% HDFC Bank out of 250 customers each bank.

105 | P a g e
Questionnaire 21 has taken from objective No. 4 (To study the level of awareness about the
CRM Strategy amongst banks in Pune city)
Q4.21 Kindly indicates the CRM status at your bank. (A) Already implemented (b) In implementation (c) Convinced and planning to implement (d) Unaware (e) Convinced but not planning to implement (f) Aware but convinced
Table 4.21
Name of bank
Already implemented
In implementation
Convinced and
planning to implement
Unaware
Convinced but not
planning to
implement
Aware but
convinced
SBI Bank
10 34 40 5 1 10
ICICI Bank
20 23 45 5 2 5
CBI Bank
10 21 55 5 5 4
HDFC Bank
20 22 45 1 7 5

106 | P a g e
Figure 4.21
With the help of the graph it is clear that banks indicate the CRM status as In implementation
with 34% SBI Bank, 23% ICICI Bank, 21% CBI Bank and 22% HDFC Bank out of 250
customers each bank.

107 | P a g e
4.22 Hypothesis test result
We make an attempt to test the unproven statements framed in the beginning of study.
“Four banks (State bank of India, ICICI Bank, Central Bank of India, HDFC Bank) in Pune
city aware of CRM strategy tends to be not more than 20 % of the population”
Null Hypothesis Ho: P = Po = 20% (Proportion of banks in Pune city aware of CRM strategy
is 0.20)
Alternative Hypothesis H1: P > 20 % i.e. P > 0.20 (Proportion of banks in Pune city aware of
CRM strategy is more than 0.20)
Level of significance i.e. level of error allowed α = 0.05
The sample size n = 250 responds (For each Bank)
Because measuring CRM status is a qualitative characteristic, therefore
ONE-SAMPLE Z TEST for proportion was selected for α = 0.05 the normal table critical
value of Z = ±1.645.
Thus, if the calculated Z value is larger than ±1.645 the null hypothesis is rejected otherwise
accepted.
1) Calculated value of Z is using the formula for SBI Bank.
= = = 5.6
Z= 5.6
Where, P = Observed Value = 34 % = 0.34 (Observed 0.34 % of CRM awareness)
Po = Assumed Value = 20 % = 0.20 (Assumed 0.20 % of CRM awareness)
Qo = 1- Po = 1- 0.20 = 0.80
n = 250,
Thus, the Calculated Z = 5.6 value is larger than ±1.645, so the null hypothesis is rejected for
SBI Bank. With 95% of confidence it can be Calculated that there is significant difference
between the assumed 20 % of CRM awareness and the observed 34 % of CRM awareness,
thus the tentative statement that “Four banks (State bank of India, ICICI Bank, Central Bank
of India, HDFC Bank) in Pune city aware of CRM strategy tends to be not more than 20 % of
the population” stands false for SBI Bank.
108 | P a g e
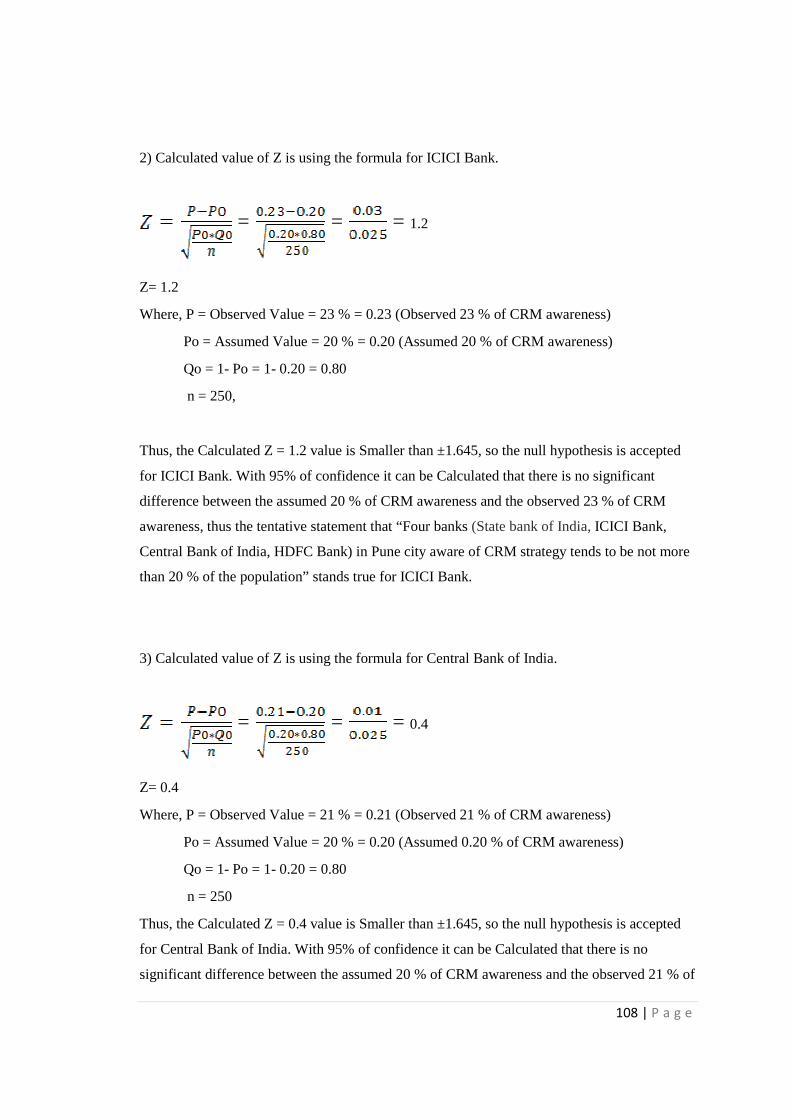
2) Calculated value of Z is using the formula for ICICI Bank.
= = = 1.2
Z= 1.2
Where, P = Observed Value = 23 % = 0.23 (Observed 23 % of CRM awareness)
Po = Assumed Value = 20 % = 0.20 (Assumed 20 % of CRM awareness)
Qo = 1- Po = 1- 0.20 = 0.80
n = 250,
Thus, the Calculated Z = 1.2 value is Smaller than ±1.645, so the null hypothesis is accepted
for ICICI Bank. With 95% of confidence it can be Calculated that there is no significant
difference between the assumed 20 % of CRM awareness and the observed 23 % of CRM
awareness, thus the tentative statement that “Four banks (State bank of India, ICICI Bank,
Central Bank of India, HDFC Bank) in Pune city aware of CRM strategy tends to be not more
than 20 % of the population” stands true for ICICI Bank.
3) Calculated value of Z is using the formula for Central Bank of India.
= = = 0.4
Z= 0.4
Where, P = Observed Value = 21 % = 0.21 (Observed 21 % of CRM awareness)
Po = Assumed Value = 20 % = 0.20 (Assumed 0.20 % of CRM awareness)
Qo = 1- Po = 1- 0.20 = 0.80
n = 250
Thus, the Calculated Z = 0.4 value is Smaller than ±1.645, so the null hypothesis is accepted
for Central Bank of India. With 95% of confidence it can be Calculated that there is no
significant difference between the assumed 20 % of CRM awareness and the observed 21 % of

109 | P a g e
CRM awareness, thus the tentative statement that “Four banks (State bank of India, ICICI
Bank, Central Bank of India, HDFC Bank) in Pune city aware of CRM strategy tends to be not
more than 20 % of the population” stands true for Central Bank of India.
4) Calculated value of Z is using the formula for HDFC Bank.
= = = 0.8
Z= 0.8
Where, P = Observed Value = 22 % = 0.22 (Observed 22 % of CRM awareness)
Po = Assumed Value = 20 % = 0.20 (Assumed 0.20 % of CRM awareness)
Qo = 1- Po = 1- 0.20 = 0.80
n = 250,
Thus, the Calculated Z = 0.8 value is Smaller than ±1.645, so the null hypothesis is accepted
for HDFC Bank. With 95% of confidence it can be Calculated that there is no significant
difference between the assumed 20 % of CRM awareness and the observed 22 % of CRM
awareness, thus the tentative statement that “Four banks (State bank of India, ICICI Bank,
Central Bank of India, HDFC Bank) in Pune city aware of CRM strategy tends to be not more
than 20 % of the population” stands true for HDFC Bank.


