
Chapter4. Cross Recurrence Quantification of Interpersonal ... · The inherent instability of...
36
CHAPTER 4 Cross Recurrence Quantification of Interpersonal Postural Activity Kevin Shockley Department of Psychology University of Cincinnati Cincinnati, OH 45221-0376 U. S. A. E-mail: [email protected]
Transcript of Chapter4. Cross Recurrence Quantification of Interpersonal ... · The inherent instability of...

CHAPTER 4
Cross Recurrence Quantification ofInterpersonal Postural Activity
Kevin Shockley
Department of PsychologyUniversity of CincinnatiCincinnati, OH 45221-0376U. S. A.E-mail: [email protected]
Interpersonal Postural Activity
143
Measuring interpersonal coordination in the context of
conversation has been a challenging problem in psychology for at least
three decades. This is an interesting problem because observations of
interpersonal coordination in the context of cooperative conversation
appear to index the coordination that is required to complete the goals
of a particular interaction (Clark, 1996). This type of coordination has
been indexed in a number of ways, including the convergence of
speaking rate (Street, 1984), vocal intensity (Natale, 1975), pausing
frequency (Cappella & Planalp, 1981), and even in the convergence of
conversational partners’ dialects (Giles, Coupland, & Coupland, 1991).
Conversational partners have also been observed to mirror or mimic
each others’ postures (LaFrance, 1982). Until very recently, however,
such indices of coordination have been based on fairly subjective
observation procedures. For example, Condon and Ogston (1971)
assessed interpersonal coordination by hand scoring video-taped
interactions to evaluate the timing of listeners’ movements with
reference to the rhythmic properties of a speaker.
More recent techniques of quantifying interpersonal
coordination have made the visual scoring approach somewhat more
systematic by sketching joint angles from video tapes and quantifying
the number of joint angle changes (Newtson, 1994; Newtson, Enquist, &
Bois, 1977; Newtson, Hairfield, Bloomingdale, & Cutino, 1987). Spectral
profiles of periodicity of joint angle changes were then compared
across conversers. This strategy has revealed apparent coupling of the
behavioral waves of conversers. While the Newtson et al. approach is
certainly an improvement over previous methods, problems with
distortions from scoring 2-dimensional video tapes of 3-dimensional
Shockley
144
movements cannot be avoided. The magnitude of angle changes of
joints based on visual estimates of a 2-D video is dependent upon the
angle of the video-taped person relative to the 2-D viewing plane of the
video screen. Thus, visual estimates of angle changes from video will
be distorted unless the movements are always aligned with the viewing
plane. An additional drawback is that the degree of joint angle change
is not measured—all that is measured is that joint angles changed.
Shockley, Santana, and Fowler (2003) introduced a strategy for
evaluating the degree of interpersonal coordination that involves
submitting measurements of postural sway to cross recurrence
quantification (CRQ) analysis. The advantage of CRQ over
conventional linear methods is that it requires no assumptions about the
nature of the data in question, and it offers an objective method for
studying interpersonal coordination. The purpose of this chapter is to
provide a tutorial for how to apply this recently developed analysis to
postural data using the method and data of Shockley et al. (2003).
Before discussing the CRQ technique and its theoretical foundations,
however, some understanding of postural sway is necessary to make it
clear why such an approach is warranted.
POSTURAL SWAY
Although standing upright seems straightforward and effortless
to most of us, it is actually quite challenging to explain how we are able
to accomplish this task. Consideration of the underlying anatomical
constraints and surrounding physiological processes reveals that the
apparently simple act of standing upright is quite complex and yields a
correspondingly complex behavior that is not straightforward to

Interpersonal Postural Activity
145
quantify. The fact that postural activity is complex motivates the need
for measures that are not restricted by the assumptions of linear
methods.
Operationally, upright stance is best understood as the
maintenance of the horizontal position of the center of mass of the body
within the boundaries of the base of support of the body. Imagine a line
drawn straight down to the ground along the direction of gravity from
the center of mass of the body (generally in the region of the
abdomen). In order to avoid falling down, the projected line from the
center of mass must remain within the base of support of the body
(usually the anterior-posterior and lateral extents of the feet).
The simplest image of this control requirement is to keep an
inverted pendulum upright. To build your intuitions, try to balance an
inverted broomstick on one finger. Note that in order to keep the
inverted broomstick upright, quick adjustments to the position of the
supporting finger are required as the broomstick begins to fall in one
direction or another. This is a useful image, but the inverted pendulum
image is certainly not an adequate model of postural control, however,
given that most animals are of the multi-segmental variety. The
consequence of this fact is that the center of mass must effectively be
balanced over the base of support across many joints.
One may imagine that simply freezing all joints in a particular
position would achieve the desired goal of standing upright. The
physiological activity surrounding all of our actions, however, must also
be considered. For example, instability in the position of the center of
mass is introduced by physiological processes such as the inherent
tremor of muscular tensile states, heart compressions, and the

Shockley
146
expansion and compression of the chest cavity involved in breathing.
These inherent perturbations result in instability of the position of the
center of mass over time; this is generally referred to as postural sway
(see Figure 4.1).
Postural sway occurs even during so-called quiet stance
(standing without engaging in other activities; Collins & De Luca, 1994;
Newell, Slobounov, Slbounova, & Molenaar, 1997), but occurs
especially when supra-postural tasks (e.g., reading, talking, pointing,
reaching) are added to the demands of maintaining upright stance
(Balasubramaniam, Riley, & Turvey, 1997; Belen’kii, Gurfinkel’, &
Pal’tsev, 1967; Fel’dman, 1966; Riccio & Stoffregen, 1988; Riley, Mitra,
Stoffregen, & Turvey, 1997; Stoffregen, Pagulayan, Bardy, & Hettinger,
2000). For example, the seemingly benign act of raising one’s arm
compromises postural stability and requires concurrent (and often
prior) compensation of the muscles of the thighs, hips, and trunk to
keep the center of mass within the base of support (Belen’kii,
Gurfinkel’, & Pal’tsev, 1967; Pal’tsev & Elner, 1967). Speaking and
gesturing are ubiquitous in conversation and, accordingly, add to the
instability of the location of the body’s center of mass.
CAPTURING THE DYNAMICS OF UNKNOWN NONLINEAR SYSTEMS
The inherent instability of postural activity described above has
made the quantification of postural sway quite challenging. The most
direct methods for measuring postural sway involve the measurement
of the center of pressure of the body using a force platform or the
measurement of displacement of the center of mass using a motion

Interpersonal Postural Activity
147
Figure 4.1. Sample postural sway time series during quiet stance. The abscissa corresponds totime (sec) while the ordinate corresponds to anterior-posterior displacement (cm).
tracking system.1 These measures yield time series that are typically
irregular, non-stationary (i.e., there is drift in the mean and/or standard
deviation of the time series over time), and non-periodic (Carroll &
Freedman, 1993; Collins & De Luca, 1993). Thus, conventional (linear)
analyses that assume normal distributions and stationarity, such as
correlational or spectral methods, are not appropriate for postural sway
1 The center of pressure corresponds to the point of application of the sum of forces actingbetween the feet and the surface of support (see Pellecchia & Shockley, Chapter 3).

Shockley
148
data (see Riley, Balasubramaniam, & Turvey, 1999; see also Pellecchia
& Shockley, Chapter 2, for a comparison of linear and nonlinear
methods of analyzing postural sway).
Linearity vs. Nonlinearity
By definition, linear time series analysis methods assume
independence and additivity of the multiple degrees of freedom that
contribute to a given observable. Nonlinear systems have degrees of
freedom that interact multiplicatively. Relatively recent investigations
into nonlinear systems have inspired the development of analysis
methods that capitalize on the interactive nature of nonlinear systems
(see Abarbanel, 1996). In some cases, the variables that contribute to
the dynamics of some nonlinear systems are known and can be
indexed. Most often, however, the variables that contribute to the
dynamics of a system under investigation are not known. The
advantage of a nonlinear system, however, is that the dynamical
variables interact. Thus, the influence of unknown (or perhaps
unmeasurable) variables can be indexed by variables that are readily
measurable. To illustrate this peculiar feature of nonlinear systems, I
will show how the measurement of a single variable from a system with
known dimensions can be used to capture the dynamics of the whole
system.
The Lorenz Attractor: A Nonlinear System With Known Dynamics
The Lorenz (1963) system is a model of convection (i.e., heat
transfer) in the atmosphere. The dynamics (i.e., changes in states) of
the Lorenz model can be characterized with three first order differential
equations,
Interpersonal Postural Activity
149
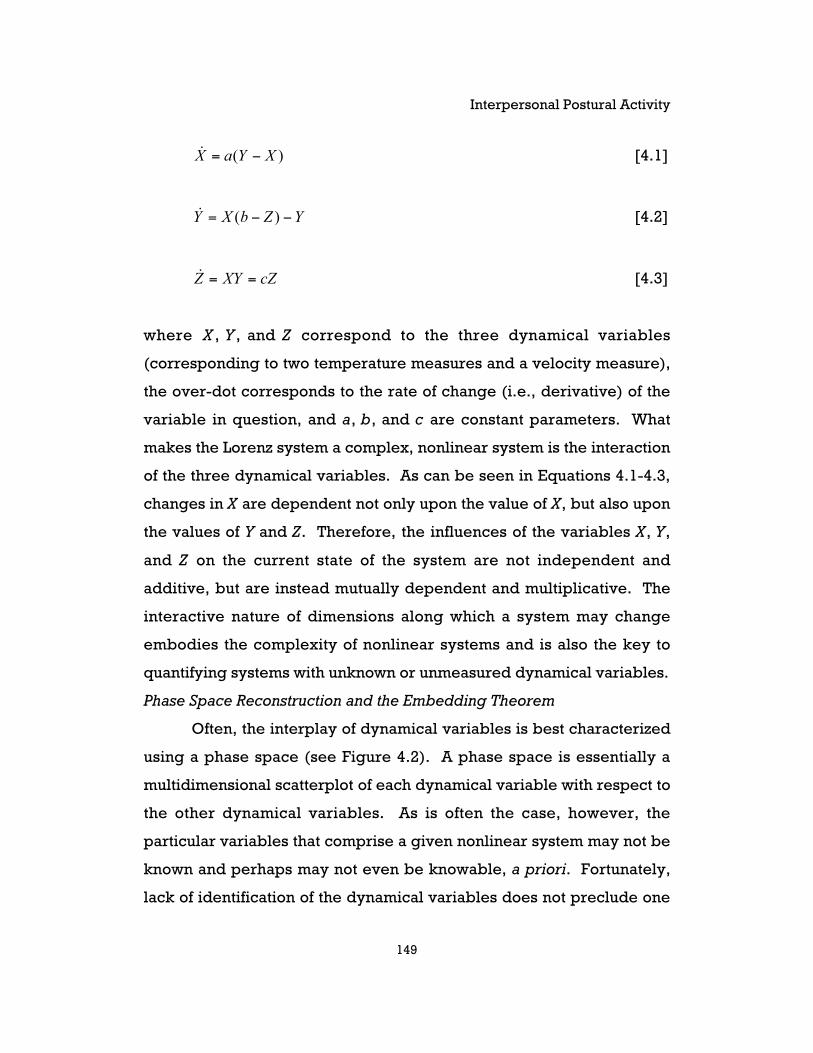
)( XYaX −=& [4.1]
YZbXY −−= )(& [4.2]
cZXYZ ==& [4.3]
where X , Y , and Z correspond to the three dynamical variables
(corresponding to two temperature measures and a velocity measure),
the over-dot corresponds to the rate of change (i.e., derivative) of the
variable in question, and a, b, and c are constant parameters. What
makes the Lorenz system a complex, nonlinear system is the interaction
of the three dynamical variables. As can be seen in Equations 4.1-4.3,
changes in X are dependent not only upon the value of X, but also upon
the values of Y and Z. Therefore, the influences of the variables X, Y,
and Z on the current state of the system are not independent and
additive, but are instead mutually dependent and multiplicative. The
interactive nature of dimensions along which a system may change
embodies the complexity of nonlinear systems and is also the key to
quantifying systems with unknown or unmeasured dynamical variables.
Phase Space Reconstruction and the Embedding Theorem
Often, the interplay of dynamical variables is best characterized
using a phase space (see Figure 4.2). A phase space is essentially a
multidimensional scatterplot of each dynamical variable with respect to
the other dynamical variables. As is often the case, however, the
particular variables that comprise a given nonlinear system may not be
known and perhaps may not even be knowable, a priori. Fortunately,
lack of identification of the dynamical variables does not preclude one

Shockley
150
from gaining access to the underlying dynamics of the system in
question.
Figure 4.2. A three-dimensional plot (phase space) of the time evolution of the three dynamicalvariables (X, Y, & Z) of the Lorenz system (Equations 4.1-4.3).
Takens (1981) introduced the embedding theorem, which
revealed that the preferred relations of the dynamical variables in a
nonlinear system (its attractors) may be discovered by reconstructing a
phase space for the system in question using time-delayed copies of a
single, observable dynamical variable of the system. That is, the time
series of a single dynamical variable can be used to reveal the
underlying dynamics of the entire system by using time-delayed copies

Interpersonal Postural Activity
151
of the measured time series. This is possible because (as described
previously) in nonlinear systems the multiple dynamical variables
interact with one another. The interactive nature of the dynamical
variables comprising the nonlinear system generally yields quite
messy and unpredictable time series of the variables in question.
However, the interactive nature of the degrees of freedom of a
nonlinear system dictate that the activity of a single variable will be
influenced by the activity of all other dynamical variables. Access to
one of the variables of a dynamical system can, accordingly, allow the
dynamics of the entire system to be evaluated by unfolding the time
series into the appropriate number of dimensions to reveal the
underlying dynamics. In the next section I will illustrate how the
dynamics of the Lorenz system may be unfolded using time-delayed
copies of a single variable.
Distortions Due to Projection
Consider the time series of X in Figure 4.3. The evolution of this
variable does not resemble the clearly defined attractor in Figure 4.2.
This is because the time series of the observed variable is represented
by only one dimension (X), whereas the Lorenz system requires three
dimensions to reveal the influence of the three dynamical variables.
While the time series depicted in Figure 4.3 does embody the dynamics
of the entire system, one cannot see the dynamics unfold properly
because the dynamics of the 3-dimensional system are ‘projected’ onto
a single dimension. Such a distortion can be illustrated using a less
abstract example.
Imagine positioning your two hands such that both hands are
between a light source and a wall. Both hands are some distance apart

Shockley
152
Figure 4.3. The time series X(t) generated from Equations 4.1-4.3. Given that the data aresimulated, time (t) corresponds to data points with no particular time units.
along the dimension separating the light source and the wall, but the
two hands occupy the same position along the horizontal and vertical
dimensions of the wall. In this configuration, the projected shadows of
the two hands on the wall will appear to occupy the same space. This
shadow example illustrates a distorted, two-dimensional projection of
three-dimensional space.
Unfolding the Time Series
The lesson to be learned from Takens’ theorem is that the
dynamics of a nonlinear system of multiple degrees of freedom (e.g.,

Interpersonal Postural Activity
153
Figure 4.4. A reconstructed phase space of the Lorenz attractor using X(t) to create time-delayed copies to serve as surrogate dimensions. The delay (τ) used was 55 data points.
the Lorenz system) may be seen properly by unfolding the system into
the appropriate number of dimensions using time-delayed copies of
one measured dimension as surrogate dimensions in reconstructed
phase space. This can be accomplished by using the original time
series, X(t), as the first dimension, X(t + τ) as the second dimension, and
X(t + 2 τ) as the third dimension, and so on for four and higher
dimensions. In this example, I used a delay of 55 data points. So, the
first dimension, X(t), begins at data point 1 of the original time series.
The second dimension, X(t + 55), begins at data point 56 of the original
time series. The third dimension begins at data point 111 of the original

Shockley
154
time series. What Takens demonstrated is that the reconstructed phase
space is isomorphic to the true phase space of the system and,
accordingly, allows the system in question to be evaluated in the
appropriate number of dimensions (compare Figures 4.2 and 4.4). The
purpose of the Lorenz example is to show that a phase space of a
system can be reconstructed even with access to only one of the many
possible dimensions of change.
QUANTIFICATION OF POSTURAL SWAY
How can one take advantage of the technique of phase space
reconstruction to quantify what appears to be terribly complex postural
activity? Recent efforts have made headway in this regard and have
demonstrated that nonlinear methods of quantification are useful in
differentiating among postural sway time series that correspond to
subtly different activities of the person standing (see Riley et al., 1999;
Riley & Clark, 2003). For example, Riley et al. (1999) detected
deterministic structure in postural sway time series that cannot reliably
be differentiated from stochastic noise using conventional methods.
The method they used was recurrence quantification analysis (RQA;
Webber & Zbilut, Chapter 2), which capitalizes on Takens’ embedding
theorem.
Recurrence Analysis
Webber and Zbilut (1994) introduced the basic RQA strategy,
which involves reconstructing a phase space for a given time series, in
the manner described above for the Lorenz system, and then tallying
the number of instances that an unfolded time series visits each location
in reconstructed phase space (i.e., how often a value recurs). The

Interpersonal Postural Activity
155
degree of deterministic structure in the system may be assessed by
quantifying how many sequences of recurrent points are repeated (i.e.,
repeating patterns of recurrent points). The variety of differing lengths
of these sequences of recurrent points (number of data points forming a
recurring sequence) may be used to determine the complexity of the
signal by computing the Shannon entropy (see below) of the
distribution of the lengths. The stability of the system may be
measured by the longest of these sequences of recurrent points
(maxline) (Eckmann, Kamphorst, and Ruelle, 1987). Finally, the degree
of stationarity of the system may be assessed by determining the slope
of the density of recurrent points as the points become more separated
in time (trend). This procedure is known as auto-recurrence since a
time series is compared to itself. See chapters in this volume by
Webber and Zbilut (Chapter 2) and Pellecchia and Shockley (Chapter
3) for more extensive discussion and illustration of RQA measures.
C ROSS R ECURRENCE Q UANTIFICATION AS A M EASURE OF
COUPLING
Cross Recurrence Quantification (CRQ) was introduced by
Zbilut, Giuliani, and Webber (1998) as an extension to RQA (see also
Webber & Zbilut, Chapter 2). This extension involves effectively
embedding two synchronous time series in a reconstructed phase
space. Rather than tallying the recurring locations of a single
embedded time series (auto-recurrence), the number of instances for
which locations are shared by the two time series is tallied in CRQ (see
Figure 4.5). Measures comparable to those of RQA are available with
CRQ. Percent recurrence (%REC) in CRQ corresponds to the ratio of

Shockley
156
Figure 4.5. Illustration of time series collection, phase space reconstruction, and CRQmeasures %REC and MAXL. Blue corresponds to data from one member of the participant pairand red corresponds to data from the other member of the participant pair. %REC quantifiesshared locations in reconstructed phase space of two points from the two time series. MAXLquantifies the longest of parallel trajectory of the two time series in reconstructed phase space.
the number of shared location relative to the number of possible shared
locations (see Figure 4.5). Percent determinism (%DET) is the ratio of
the number of shared locations that are part of a sequence of shared
locations relative to the total number of shared locations. Maxline
(MAXL) is the longest shared trajectory and is a measure of the stability
of the shared activity (see Figure 4.5). Entropy (ENT) is the Shannon
entropy of the distribution of lengths of sequences of shared locations.
It was recently demonstrated that CRQ is a useful measure of the
coupling of two signals by evaluating physically coupled oscillators
(Shockley, Butwill, Zbilut, & Webber, 2002). An apparatus was

Interpersonal Postural Activity
157
constructed that immersed a rotor with a paddle into a container filled
with viscous fluid. The container (i.e., the driver) was then oscillated in
a translational fashion at a fixed frequency while the immersed rotor
was allowed to spin in the fluid at its natural frequency. The idea was to
vary the strength of the coupling of the two oscillators by changing the
viscosity of the fluid. In this coupled-oscillator system, the coupling
strength of the signals was directly manipulated so that the efficacy of
CRQ for detecting shared activity could be evaluated. Very subtle
couplings between two signals were detected by CRQ measures that
remained undetected by conventional, linear measures of coupling,
such as cross-spectral analysis. For example, in medium and low
coupling conditions, CRQ was able to detect the influence of the driver
tray on the rotor oscillation to which linear spectral analysis was blind.
Having CRQ as a tool for quantifying the shared activity between two
signals allowed Marie-Vee Santana, Carol A. Fowler, and I to turn our
attention to the problem of quantifying interpersonal coordination
(Shockley et al., 2003). We endeavored to evaluate the utility of CRQ in
detecting subtle postural coupling that may exist between two people
engaged in conversation.
V ERBAL C OORDINATION OF INTERPERSONAL POSTURAL
ACTIVITY—THE EXPERIMENT
The Task
The strategy of Shockley et al. (2003) was to track the postural
activity of two people engaged in a conversation. In order to generate
conversation, a puzzle task was used that required participants to
determine the differences between two similar cartoon pictures.
Shockley
158
Similar types of puzzles can often be found in puzzle books or
newspapers. Typically, however, the task involves a single person
comparing two pictures. The innovation we introduced was to give
each member of a participant pair one of the two similar cartoon
pictures. We did not allow participants to visually inspect each other’s
picture during the course of a trial. This constraint left only verbal
interaction to facilitate finding differences between the two pictures.
This method was quite effective in generating normal conversation.
Furthermore, the participants expressed genuine interest in the task
both during and after data collection, as indicated by their reluctance
to stop at the end of a trial and their unsolicited positive comments
following the data collection session.
In recognition that visual interaction may influence postural sway
in addition to the verbal interaction required by the task, two
independent variables were factorially combined, Task Partner and
Body Orientation. There were two levels of each variable (see Figure
4.6). A participant’s Task Partner could be either the other member of
the participant pair (Participant) or one of the experimenters
(Confederate), who was seated out of view. The Body Orientation of the
participant pairs involved either facing each other (Facing) or facing
away from each other (Away). In all conditions, participants were
instructed to discuss their pictures with their task partner and
determine as many differences as possible between the two pictures
over the course of two minutes. In all trials, the dependent measures
were the postural sway of the two members of a given participant-pair,
irrespective of the Task Partner on a given trial. Thus, the shared
postural activity between two persons engaged in conversation with

Interpersonal Postural Activity
159
Figure 4.6. Method for evaluating interpersonal postural constraints involved in cooperativeconversation. Participants faced toward or away from one another and conversed with eachother or a confederate (C). Figure adapted from Shockley, Santana, and Fowler (2003).
each other could be compared to the shared postural activity of the
same two persons engaged in conversation with others. Greater
shared postural activity (i.e., greater %REC) was expected when
participant pairs were conversing with each other than when
participant pairs were conversing with confederates.
Data Collection and Reduction
A Polhemus FasTrak magnetic motion capture system (Polhemus,
Inc., Colchester, VT) was used with 6-D Research System software (Skill
Technologies, Phoenix, AZ) to track the participants’ movements in the
anterior-posterior direction. Sensors were placed using Velcro straps
at the waist and the forehead. For the purposes of this chapter I am
only reporting data measured at the waist. Participants stood on
opposite sides of the magnetic field emitter and were each

Shockley
160
approximately 18 inches away from the emitter. Data columns of
displacement in the anterior-posterior direction were extracted from
the data file recorded by the motion capture software.
Unless otherwise indicated, for the subsequent analyses
Recurrence Quantification Analysis software was used (the package is
available free of charge from http://homepages.luc.edu/~cwebber/).
Detailed instructions for how to use the recurrence analysis software
can be found in the README.TXT file, which is provided with the
software. It is assumed that the user has a working knowledge of an
MS-DOS environment. The program ZSCORE.EXE was used to convert
our displacement data into z-scores to ensure a common scale for all
participants.
CRQ Parameters
Prior to calculating recurrence quantities, one must select the
settings for seven parameters (embedding dimension, delay, range,
norm, rescaling, radius, and line length). Embedding dimension,
delay, and radius are among the most challenging parameters to
determine. When the system in question is of unknown dimensionality
and periodicity (e.g., postural sway data), one method for estimating
these parameters is to evaluate the number of recurrent points for a
range of these parameter settings (Zbilut & Webber, 1992; Riley et al.,
1999; see Pellecchia & Shockley, Chapter 3). For a range of parameter
settings it is important that there are smooth changes in the number of
recurrent points in response to small changes in parameter values (see
Trulla, Giuliani, Zbilut, & Webber, 1996). A large, discontinuous
change in the number of recurrent points may correspond to a change
in the scale of activity in the system to which the recurrence measures
Interpersonal Postural Activity
161
are sensitive. Selecting parameters that are near such a threshold of
sensitivity could, therefore, yield changes in recurrence values due to
crossing the threshold, rather than changes due to experimental
manipulations. Thus, it is safer to use parameter values within a range
that exhibits smooth changes in %REC.
The program KRQS.EXE may be used to calculate %REC for a
range of the three parameters in question. For each execution of the
program, one inputs the file names corresponding to the two time
series to be compared as well as an output file name to which the
recurrence measures are saved. In our case, the input files
corresponded to the z-score time series for Person A and Person B,
respectively, of a given participant pair for a given 2-minute trial. After
entering the command to execute KRQS.EXE, one is prompted for the
minimum and maximum values for delay, embedding dimension, and
radius.
Embedding Dimension. Embedding dimension specifies how
many dimensions will be used in reconstructing the phase space. As
discussed previously, the goal is not to determine exactly how many
dimensions the system has. The goal is to be confident there are
sufficient embedding dimensions to allow the dynamics of the system to
be revealed without distortions. Webber (2004) suggested, for
physiological data, starting with embedding dimensions between 10
and 20 and working downward. Based on Webber’s suggestion and
previous investigations of postural activity using recurrence analysis
(e.g., Balasubramaniam, Riley, & Turvey, 2000; Riley et al., 1999), I
elected a range of 8 through 14 embedding dimensions for the present
discussion.

Shockley
162
Delay. The delay parameter specifies the time lag to use for the
time-delayed copies of the original time series (i.e., the surrogate
dimensions in the reconstructed phase space). For illustrative purposes
of this chapter and data processing economy, I selected delays ranging
between 15 and 25 data points. A larger range, however, would
certainly be appropriate. The sampling rate of the motion capture
system used in the present study was 60 Hz. This means that delays of
15 to 25 data points would correspond to time delays of 0.25 to 0.42 s.
Radius. The radius parameter specifies the Euclidean distance
within which points from the two time series are considered neighbors
(i.e, recurrent) in the reconstructed phase space. The selected radius
should yield a sparse recurrence matrix. That is, %REC should remain
low (no larger than 5%), but not so small as to produce a floor effect
(%REC at or near 0%). I selected radii ranging between 20 and 40, with
a step size of 2. Given that mean distance rescaling will be selected
(see below), the radius corresponds to the percentage of the mean
distance separating points in reconstructed phase space.
Norm. The norm parameter specifies how distances are
normalized in reconstructed phase space. I selected Euclidean
normalization, which is consistent with previous studies using
recurrence analysis to evaluate postural activity (see Riley, et al., 1999;
Riley & Clark, 2003).
Rescale. The rescale parameter determines the method used to
rescale the distance matrix (i.e., matrix of all distances among postural
data points of person A and person B). Given that each participant pair
may have had different distance magnitudes, Shockley et al. (2003)
elected to rescale the distances among the points to the mean distance.
Interpersonal Postural Activity
163
This served to intrinsically define the inclusion radius (see above) to a
percentage of the average distance separating the postural trajectories
of a given participant pair, rather than using an arbitrarily defined
threshold (e.g., an absolute Euclidean distance). A distance
corresponding to the mean distance separating postural locations in
reconstructed phase space would, therefore, have a value of 100. Mean
distance rescaling also serves to minimize the influence of an outlier
value (e.g., large postural excursion due to laughing or sneezing)—as
compared to rescaling to the maximum distance, for example.
Range. Each time series consisted of 7200 data points (120
seconds of data at 60 Hz). In the present study, there is no reason not to
include as many data points as possible. Therefore, the first data point
should be 1 and the last point should be 6875 (given a maximum
embedding dimension of 14 and a maximum delay of 25). These values
guarantee the use of the maximal number of data points and the same
number of data points within each surrogate dimension in the phase
space (see Pellecchia & Shockley, Chapter 3, for a detailed explanation
of how to determine the last data point). The value for the last data point
does not need to be determined, however. The software will provide a
range of values, and the user can simply enter the maximum in the
range presented by the software.
Line Length. Line length specifies the number of consecutive
recurrent points required to define a line segment. This parameter
should be set to two points (the minimum option) unless one has reason
to believe that a more conservative estimate of a line is warranted.
The next step in determining parameters for CRQ is to randomly
select a few trials from each experimental condition and execute the

Shockley
164
program KRQS.EXE to compute recurrence measures for the selected
parameter ranges for the selected trials. For illustrative purposes, I
selected four sets of data to submit to KRQS.EXE.
Surface Plots for Parameter Selection in CRQ
One method of evaluating the %REC values for the selected
range of parameter values is to use surface plots, which can be
generated in the MatLab software environment (Mathworks, Inc.,
Natick, MA). For each embedding dimension, one can plot the %REC
values returned from KRQS.EXE for a given data set as a surface (see
Figure 4.7). A surface corresponds to a numeric matrix (stored in a
MatLab variable that I arbitrarily named “rec”). The number of rows of
the matrix corresponds to the number of values of radius used by
KRQS.EXE and the columns of the matrix correspond to the number of
values of delay used by KRQS.EXE. The values in the matrix correspond
to the %REC values for one set of data (generated by KRQS.EXE) for
each radius (rows) and delay (columns) for a given embedding
dimension. To review, the extents of the two sides of each surface
correspond to the range of radius and delay, respectively.
To create a surface plot in MatLab, one needs two vectors—one
of extents corresponding to the numbers of columns and rows of the
%REC matrix, respectively, and the matrix that I called “rec” in MatLab.
First, create two MatLab vectors—“radius” [20 22 24 26 28 30 32 34,36
38 40] and “delay” [15 16 17 18 19 20 21 22 23 24 25]—to be used for all
surfaces plotted. As discussed above, the matrix should be created
from the %REC values returned from KRQS.EXE. The values of %REC
will, therefore, be different for each trial analyzed. The matrix will,
accordingly, need to be re-created for each surface to be plotted. Each

Interpersonal Postural Activity
165
Figure 4.7. Shared postural locations (%REC) in reconstructed phase space for a randomlyselected subset of data from Shockley, Santana, & Fowler (2003) for a range of values of thefollowing parameters: Embedding dimension, delay, and radius. Each surface in a given plotcorresponds to a different data set and each plot represents the same data sets for theparameter ranges.
surface plot is created by the following command: surf(delay, radius,
rec). To plot multiple surface plots on one graph (as seen in Figure
4.7), type ‘hold’ after the first surf command. I have found that it is most
useful to create a different plot for each embedding dimension. To
generate new plots, open a new figure window and repeat the
procedure. For illustrative purposes I have plotted four of the eight
embedded dimensions (see Figure 4.7).

Shockley
166
Inspection of Surface Plots
Embedding Dimension. Notice in Figure 4.7 that the recurrence
values for the sampled data files tend to bottom out (%REC equals 0)
for higher values of the delay and low values of the radius for
embedding dimensions 12 and 14. Thus, an embedding dimension of
10 allows sufficient unfolding of the time series and still yield a sparse
recurrence matrix (i.e., recurrence values just above 0%).
Delay. The particular delay selected is often arbitrary for
postural data. What is most important is that the patterning of
recurrence measures is consistent across a range of delay values. If so,
one can be confident that any observed differences across
experimental conditions are not artifacts of the delay. Shockley et al.
(2003) selected a delay of 25 data points, which fits these criteria.
Radius . As discussed above, the radius is the maximum
Euclidean distance by which points can be separated in reconstructed
phase space and still be considered recurrent points. One should
choose a value of radius that ensures that the number of recurrent
points is reasonably low (so as to avoid global recurrence, i.e., all
points recurrent). Webber (personal communication, June 2000)
suggested that recurrence should be approximately 1%. Given that
CRQ must be performed on multiple trials of multiple participants,
however, Webber’s prescribed recurrence range tends to be a bit too
low. This is so because data from some trials may yield %REC = 0 for
the same parameter settings that yield 1% recurrence for other
participants. For biological movement data, I have found that
recurrence of around 3%-5% for a randomly selected subset of data

Interpersonal Postural Activity
167
tends to yield non-zero %REC values for all subjects, but still offers
sufficiently low recurrence.
In summary, Shockley, et al. (2003) selected a delay of 25 data
points, an embedding dimension of 10, and a radius of 30% of the mean
distance separating points in reconstructed phase space. Modest
changes of each of the values of those parameters does not change the
patterning of results found by Shockley et al. (2003).
Full Analysis
After the parameters to be used for the analysis have been
selected, the next step is to run the CRQ with the selected parameter
settings on the entire set of experimental data. Shockley et al. (2003)
used KRQE.EXE to compute the recurrence variables—%REC, %DET,
MAXL, and ENT—for each participant pair. The reason for using
KRQE.EXE, rather than KRQD.EXE, for example, is that the former allows
multiple analyses to be executed in batch mode, rather than waiting for
each file to be analyzed and then typing the next command for the next
file to be analyzed.
To review, the following parameter settings were used with
KRQE.EXE: delay = 25, embedding dimension = 10, range = 1-6875,
norm = Euclidean, rescaling = mean distance, radius = 30, and line
length = 2. The program KRQEP.EXE was used to generate a parameter
file to be accessed by the commands in the batch file. This obviates the
need to type in the parameters for each file to be analyzed. An ASCII
(text), tab-delimited batch file (filename.bat) was set up such that each
row corresponded to the MSDOS command for analyzing one file using
KRQE.EXE. The number of rows corresponded to the number of files to
be analyzed (see README.TXT file for complete instructions). Program

Shockley
168
run time for the present data was several hours. Mean values for the
recurrence measures were calculated for the four trials of each
condition. Separate ANOVAs were conducted on each recurrence
measure for postural time series pairs.
Results of Shockley, Santana, & Fowler (2003)
Among the measures derived from the tallied cross recurrence
values, %REC (the ratio of the number of recurrent points to the
number of possible recurrent points) and MAXL (the length of the
longest trajectory of consecutive parallel recurrent points; a measure of
the stability of the shared activity) were found to be significantly
influenced by the experimental manipulations. Representative cross
recurrence plots are provided in Figure 4.8A and 4.8B. The plots are
organized such that the postural time series of one member of a
participant pair (A) is indexed along the abscissa while the postural
time series of the other member of a participant pair (B) is indexed
along the ordinate. Points are plotted in the cross recurrence plot when
the trajectories of the unfolded time series, A and B, occupy the same
area of the reconstructed phase space within some radius of inclusion.
That is, if a given position (i) in time series A occupies the same position
in reconstructed phase space as the position (j) of time series B (i.e.,
A[i] = B[j]), then the point is considered recurrent (see Figure 4.5).
Shockley et al. (2003) found greater shared postural activity among
pairs of participants engaged in conversation with each other as
compared to the activity shared among the same participants engaged
in conversation with confederates, regardless of visual interaction.
They also found that trajectories of participant pairs stayed
parallel longer when the participant pairs were engaged in

Interpersonal Postural Activity
169
Figure 4.8. (A) Sample cross recurrence plot of the postural activity of two persons engaged inconversation with confederates. (B) Sample cross recurrence plot of the postural activity of twopersons engaged in conversation with each other. Both are examples of the participant-pairfacing away from each other. Indices along the abscissa (i) and the ordinate (j) corresponds todata points of person A and B, respectively of a participant-pair. Illuminated pixels correspondto shared postural locations in reconstructed phase space.

Shockley
170
conversation with each other than when participant pairs were
engaged in conversation with others. As far as the authors could
determine, their observations mark the first objective measures of
interpersonal postural coordination. Representative examples of a
linear method of shared signal activity—coherence analysis—are
provided in Figure 4.9. In Figure 4.9A, the participants were speaking
to each other. In Figure 4.9B, the participants were each speaking to a
confederate. Coherence analysis is effectively a correlation of Fourier
spectrum power estimates compared across two signals for a range of
frequencies. Note that there are not distinct frequencies at which
power is correlated in either plot. Furthermore, on average the
coherence for the two plots is the same (~0.085). This is consistent with
the Shockley et al. (2002) finding that CRQ is a more sensitive measure
of coupling than linear measures. Perhaps of greater importance,
however, is the fact that CRQ is a more appropriate method for
quantifying shared postural activity than linear methods, given that
CRQ does not require the assumptions of normal distributions and
stationarity of the data required by linear methods. That is, any
significant effects that may have been discovered with linear methods
would be suspect due to violations of the assumptions of those methods.
It is encouraging that recurrence strategies continue to prove
their usefulness for the study of postural control. It remains to be seen
how sensitive of a measure CRQ may prove to be. For example, is the
degree of postural coordination scaled by the degree of cooperation of
a given verbal interaction? Giles (1973) recognized changes in
coordination among conversers with his observation that conversers in
a cooperative and friendly setting show convergence of dialects, while

Interpersonal Postural Activity
171
Figure 4.9. (A) Representative example of a coherence plot of the postural activity of twopersons engaged in conversation with confederates. (B) Representative example of acoherence plot of the postural activity of two persons engaged in conversation with each other.Both are examples of the participant pair facing away from each other. Frequency (Hz) isplotted along the abscissa and the ordinate corresponds to the coherence between the powerof the Fourier spectra of the individual time series of the participant pair.

Shockley
172
hostile conversations show divergence of dialects. Will %REC
decrease in a less cooperative situation as compared to a more
cooperative situation? Furthermore, it remains to be seen what is the
mechanism of coupling that was observed by Shockley et al. (2003).
Investigations are currently under way to determine what aspects of the
interaction (e.g., speaking rhythms, conversational turn-taking, word
similarity) facilitate the type of shared postural activity that was
observed. I leave these questions to future investigations.

Interpersonal Postural Activity
173
REFERENCES
Abarbanel, H. D. I. (1996). Analysis of observed chaotic data. New York,
NY: Springer-Verlag New York, Inc.
Balasubramaniam, R., Riley, M. A., & Turvey, M. T. (2000). Specificity of
postural sway to the demands of a precision task. Gait and Posture, 11,
12-24.
Belen’kii, V., Gurfinkel’, V. S., & Pal’tsev, Y. (1967). Elements of control
of voluntary movement. Biophysics, 12, 154-161.
Cappella, J., & Planalp, S. (1981). Talk and silence sequences in
informal conversations: III. Interspeaker influence. H u m a n
Communication Research, 7, 117-132.
Carroll, J. P., & Freedman, W. (1993). Nonstationarity properties of
postural sway. Journal of Biomechanics, 26, 409-416.
Clark, H. H. (1996). Using language. New York, NY: Cambridge
University Press.
Collins, J. J., & De Luca, C. J. (1993). Open-loop and closed-loop control
of posture: a random-walk analysis of center-of-pressure trajectories.
Experimental Brain Research, 95, 308-318.
Collins, J. J., & De Luca, C. J. (1994). Random walking during quiet
standing. Physical Review Letters, 73, 764-767.

Shockley
174
Condon, W., & Ogston, W. (1971). Speech and body motion synchrony
of the speaker-hearer. In D. Horton and J. Jenkins (Eds). The Perception
of Language. (pp. 150-184) Columbus, OH: Charles E. Merrill.
Eckmann, J. P., Kamphorst, S. O., & Ruelle, D. (1987). Recurrence plots
of dynamical systems. Europhysics Letters, 4, 973-977.
Fel’dman, A. (1966). Functional tuning of the nervous system during
control of movement or maintenance of a steady posture: III.
Mechanographic analysis of the execution by man of the simplest motor
tasks. Biophysics, 11, 766-775.
Giles, H. (1973). Accent mobility: A model and some data.
Anthropological Linguistics, 15, 87–105.
Giles, H., Coupland, N., & Coupland, J. (1991). Accommodation theory:
Communication, context, and consequence. In H. Giles, J. Coupland, &
N. Coupland (Eds.), Contexts of Accommodation: Developments in
Applied Sociolinguistics (pp. 1-68). New York, NY: Cambridge
University Press.
LaFrance, M. (1982). Posture mirroring and rapport. Interaction rhythms.
New York, NY: Human Sciences Press, Inc.
Lorenz, E. N. (1963). Deterministic nonperiodic flow. Journal of
Atmospheric Science, 20, 130-141.

Interpersonal Postural Activity
175
Natale, M. (1975). Social desirability as related to convergence of
temporal speech patterns. Perceptual and Motor Skills, 40, 827-830.
Newell, K. M., Slobounov, S. M., Slobounova, E. S., & Molenaar, P. C. M.
(1997). Short-term nonstationarity and the development of postural
control. Gait and Posture, 6, 56-62.
Newtson, D. (1994). The perception and coupling of behavior waves.
In R. R. Vallacher & A. Nowak (Eds.) Dynamical Systems in Social
Psychology (pp. 139-167). San Diego, CA: Academic Press Inc.
Newtson, D., Enquist, G., & Bois, J. (1977). The objective basis of
behavior units. Journal of Personality and Social Psychology, 35, 847-
862.
Newtson, D., Hairfield, J., Bloomingdale, J., & Cutino, S. (1987). The
structure of action and interaction. Social Cognition, 5, 191-237.
Pal’tsev, , Y. I., & Elner, A. M. (1967). Preparatory and compensatory
period during voluntary movement in patients with involvement of the
brain of different localization. Biophysics, 12, 161-168.
Riccio, G. E., & Stoffregen, T. A. (1988). Affordances as constraints on
the control of stance. Human Movement Science, 7, 265-300.
Shockley
176
Riley, M. A., Balasubramaniam, R., & Turvey, M. T. (1999). Recurrence
quantification analysis of postural fluctuations. Gait and Posture, 9, 65-
78.
Riley, M. A., & Clark, S. (2003). Recurrence analysis of human postural
sway during the sensory organization test. Neuroscience Letters, 342,
45-48.
Riley, M. A., Mitra, S., Stoffregen, T. A., & Turvey, M. T. (1997).
Influences of body lean and vision on unperturbed postural sway.
Motor Control, 1, 229-246.
Shockley, K., Butwill, M., Zbilut, J. P., & Webber, C. L., Jr. (2002). Cross
recurrence quantification of coupled oscillators. Physics Letters A, 305,
59 – 69.
Shockley, K., Santana, M., & Fowler, C. A. (2003). Mutual interpersonal
postural constraints are involved in cooperative conversation. Journal
of Experimental Psychology: Human Perception and Performance, 29,
326–332.
Stoffregen, T. A., Pagaulayan, R. J., Bardy, B. G., & Hettinger, L. J.
(2000). Modulating postural control to facilitate visual performance.
Journal of Experimental Psychology: Human Perception and Performance,
19, 203-220.

Interpersonal Postural Activity
177
Takens, F. (1981). Detecting strange attractors in turbulence. Lecture
Notes in Mathematics, 898, 366-381.
Trulla, L. L., Giuliani, A., Zbilut, J. P., & Webber, C. L., Jr. (1996).
Recurrence quantification analysis of the logistic equation with
transients. Physics Letters A, 223, 255-260.
Webber, C. L., Jr. (1997). Introduction to recurrence quanitification
analysis, v. 4.1. Unpublished software documentation (available with
RQA v. 4.1 software).
Webber, C. L., Jr., & Zbilut, J. P. (1994). Dynamical assessment of
physiological systems and states using recurrence plot strategies.
Journal of Applied Physiology, 76, 965-973.
Zbilut, J.P., & Webber, C.L., Jr. (1992). Embeddings and delays as
derived from quantification of recurrence plots. Physics Letters A, 171,
199-203.


![1. Distinguish between Sway and Non sway type … IV 1. Distinguish between Sway and Non – sway type problems?[M/J-15] Because of sway, there will be rotations in the vertical members](https://static.fdocuments.in/doc/165x107/5af80c3b7f8b9a5f588c535c/1-distinguish-between-sway-and-non-sway-type-iv-1-distinguish-between-sway.jpg)