Chapter22 Penetration Testing
58
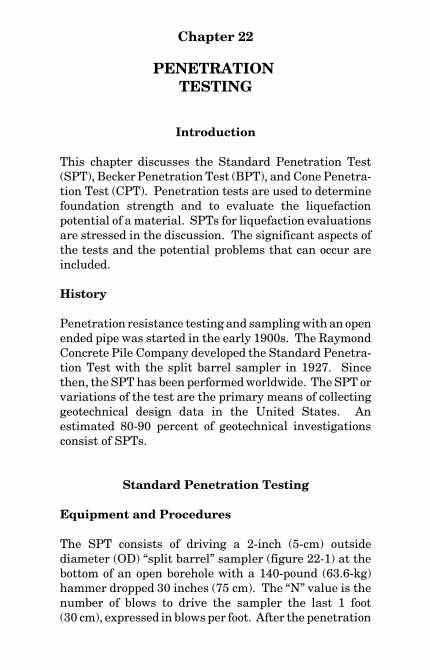
Chapter 22 PENETRATION TESTING Introduction This chapter discusses the Standard Penetration Test (SPT), Becker Penetration Test (BPT), and Cone Penetra- tion Test (CPT). Penetration tests are used to determine foundation strength and to evaluate the liquefaction potential of a material. SPTs for liquefaction evaluations are stressed in the discussion. The significant aspects of the tests and the potential problems that can occur are included. History Penetration resistance testing and sampling with an open ended pipe was started in the early 1900s. The Raymond Concrete Pile Company developed the Standard Penetra- tion Test with the split barrel sampler in 1927. Since then, the SPT has been performed worldwide. The SPT or variations of the test are the primary means of collecting geotechnical design data in the United States. An estimated 80-90 percent of geotechnical investigations consist of SPTs. Standard Penetration Testing Equipment and Procedures The SPT consists of driving a 2-inch (5-cm) outside diameter (OD) “split barrel” sampler (figure 22-1) at the bottom of an open borehole with a 140-pound (63.6-kg) hammer dropped 30 inches (75 cm). The “N” value is the number of blows to drive the sampler the last 1 foot (30 cm), expressed in blows per foot. After the penetration
-
Upload
blackcat-freeman -
Category
Documents
-
view
54 -
download
2
Transcript of Chapter22 Penetration Testing
Chapter 22
PENETRATION TESTING
Introduction
This chapter discusses the Standard Penetration Test(SPT), Becker Penetration Test (BPT), and Cone Penetra-tion Test (CPT). Penetration tests are used to determinefoundation strength and to evaluate the liquefactionpotential of a material. SPTs for liquefaction evaluationsare stressed in the discussion. The significant aspects ofthe tests and the potential problems that can occur areincluded.
History
Penetration resistance testing and sampling with an openended pipe was started in the early 1900s. The RaymondConcrete Pile Company developed the Standard Penetra-tion Test with the split barrel sampler in 1927. Sincethen, the SPT has been performed worldwide. The SPT orvariations of the test are the primary means of collectinggeotechnical design data in the United States. Anestimated 80-90 percent of geotechnical investigationsconsist of SPTs.
Standard Penetration Testing
Equipment and Procedures
The SPT consists of driving a 2-inch (5-cm) outsidediameter (OD) “split barrel” sampler (figure 22-1) at thebottom of an open borehole with a 140-pound (63.6-kg)hammer dropped 30 inches (75 cm). The “N” value is thenumber of blows to drive the sampler the last 1 foot(30 cm), expressed in blows per foot. After the penetration
FIELD MANUAL
352
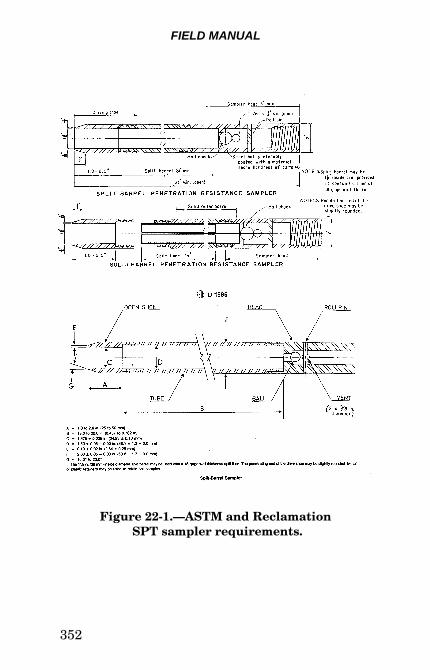
Figure 22-1.—ASTM and Reclamation SPT sampler requirements.
PENETRATION TESTING
353
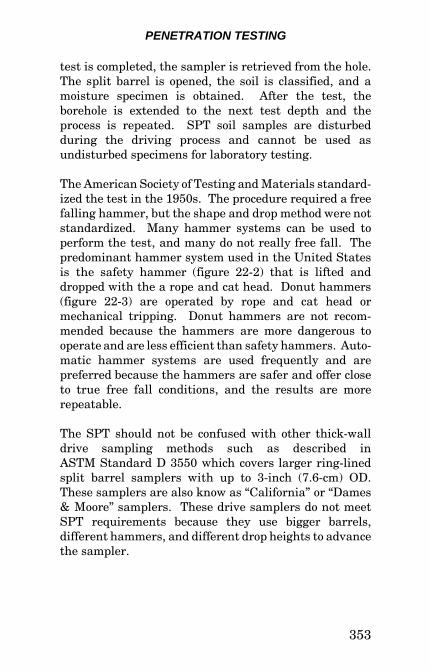
test is completed, the sampler is retrieved from the hole.The split barrel is opened, the soil is classified, and amoisture specimen is obtained. After the test, theborehole is extended to the next test depth and theprocess is repeated. SPT soil samples are disturbedduring the driving process and cannot be used asundisturbed specimens for laboratory testing.
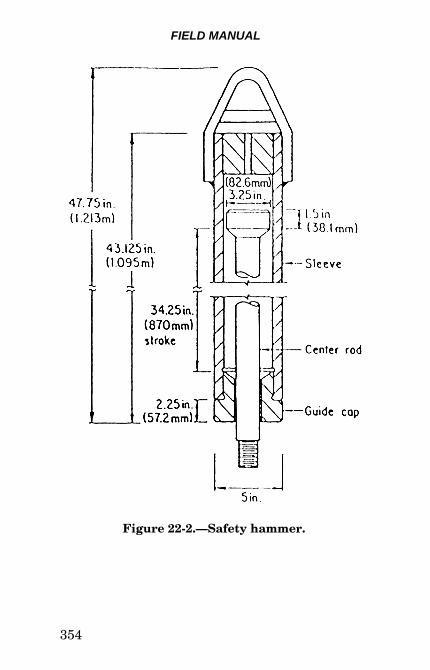
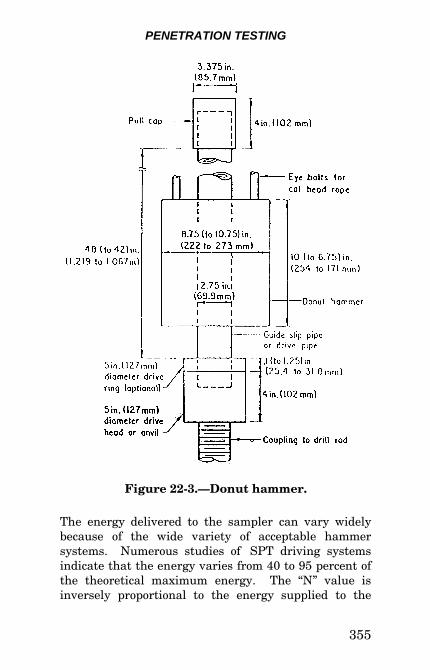
The American Society of Testing and Materials standard-ized the test in the 1950s. The procedure required a freefalling hammer, but the shape and drop method were notstandardized. Many hammer systems can be used toperform the test, and many do not really free fall. Thepredominant hammer system used in the United Statesis the safety hammer (figure 22-2) that is lifted anddropped with the a rope and cat head. Donut hammers(figure 22-3) are operated by rope and cat head ormechanical tripping. Donut hammers are not recom-mended because the hammers are more dangerous tooperate and are less efficient than safety hammers. Auto-matic hammer systems are used frequently and arepreferred because the hammers are safer and offer closeto true free fall conditions, and the results are morerepeatable.
The SPT should not be confused with other thick-walldrive sampling methods such as described inASTM Standard D 3550 which covers larger ring-linedsplit barrel samplers with up to 3-inch (7.6-cm) OD.These samplers are also know as “California” or “Dames& Moore” samplers. These drive samplers do not meetSPT requirements because they use bigger barrels,different hammers, and different drop heights to advancethe sampler.
FIELD MANUAL
354
Figure 22-2.—Safety hammer.
PENETRATION TESTING
355
Figure 22-3.—Donut hammer.
The energy delivered to the sampler can vary widelybecause of the wide variety of acceptable hammersystems. Numerous studies of SPT driving systemsindicate that the energy varies from 40 to 95 percent ofthe theoretical maximum energy. The “N” value isinversely proportional to the energy supplied to the
FIELD MANUAL
356
sampler, and the energy delivered to the sampler iscritical. Because of energy losses in the impact anvil,energy from the hammer should be measured on the drillrod below the impact surface. Drill rod energy ratio isdetermined by measuring the force-time history in thedrill string. Both acceleration and force-time history canbe measured and are important in determining thenormalized penetration resistance of sands forliquefaction resistance evaluations (ASTM D 6066).Common practice is to normalize the SPT N value to a60-percent drill rod energy ratio. Adjustment factors canbe as large as 20 to 30 percent.
The largest cause of error in the SPT is drillingdisturbance of the material to be tested. This is especiallytrue when testing loose sands below the water table.Field studies have shown that “sanding in” can beprevented by using rotary drilling with drill mud andupward-deflected-discharge bits and by maintaining thefluid level in the drill hole at all times. Hollow-stemaugers are especially popular for drilling in theimpervious zones in dams but can cause problems whenloose sand is encountered below the water table. Manyother drilling methods are available for performing SPTs,and each should be evaluated relative to potentialproblems and how the data will be used.
Information Obtainable by SPT
The SPT does provide a soil sample. Sampling is notcontinuous because the closest recommended test intervalis 2.5 feet (75 cm). Typical sampling is at 5-foot (1.5-m)intervals or at changes in materials. The test recovers adisturbed soil sample that can be classified on site, or thesample can be sent to the laboratory for physicalproperties tests.
PENETRATION TESTING
357
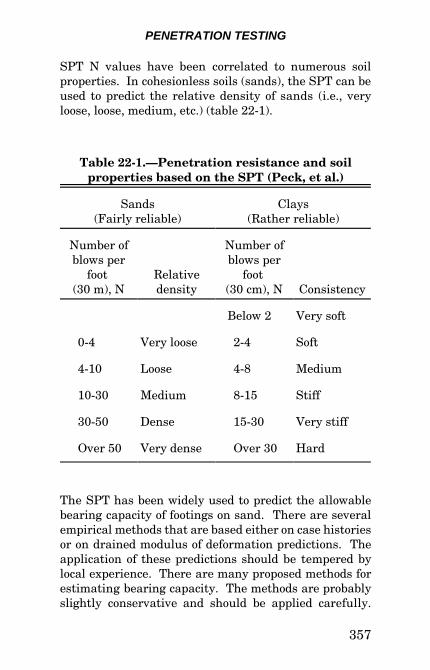
SPT N values have been correlated to numerous soilproperties. In cohesionless soils (sands), the SPT can beused to predict the relative density of sands (i.e., veryloose, loose, medium, etc.) (table 22-1).
Table 22-1.—Penetration resistance and soilproperties based on the SPT (Peck, et al.)
Sands(Fairly reliable)
Clays(Rather reliable)
Number ofblows per
foot (30 m), N
Relativedensity
Number ofblows per
foot (30 cm), N Consistency
Below 2 Very soft
0-4 Very loose 2-4 Soft
4-10 Loose 4-8 Medium
10-30 Medium 8-15 Stiff
30-50 Dense 15-30 Very stiff
Over 50 Very dense Over 30 Hard
The SPT has been widely used to predict the allowablebearing capacity of footings on sand. There are severalempirical methods that are based either on case historiesor on drained modulus of deformation predictions. Theapplication of these predictions should be tempered bylocal experience. There are many proposed methods forestimating bearing capacity. The methods are probablyslightly conservative and should be applied carefully.
FIELD MANUAL
358
SPT N values must be corrected for overburden pressuresand the location of the water table.
For clays, the SPT is less reliable for predicting strengthand compressibility, especially for weaker clays. The SPTis commonly used to assess the consistency of clays bygrouping clays as very soft, soft, medium, etc. Predictionsof undrained strengths should be used with extremecaution, especially in weak clays, because the SPT barrelremolds the clay, and the penetration resistance is morea measure of remolded strength. For evaluatingundrained strength in clays, vane shear, unconfinedcompression, or CPTs are better than SPTs. SPT datashould not be used to estimate the compressibility ofclays. To evaluate compression behavior of clays, useeither empirical factors based on water content andatterberg limits or obtain undisturbed samples forlaboratory consolidation testing.
SPT data routinely have been used for predictingliquefaction triggered by earthquake loading. Ifliquefaction is predicted, the SPT data can be used toestimate the post-earthquake shear strengths. Extensivecase history data have been collected to evaluateliquefaction; however, the data are subject to drillingdisturbance errors and the energy delivered by thehammer system must be known. If drilling disturbanceis evident or suspected, the CPT is an alternative becausethe soil can be tested in place. Procedures for evaluatingliquefaction from SPTs are given in Reclamation’s DesignStandards No. 13, Embankment Dams, “Chapter 13,Seismic Design and Analysis.” SPT N data can be usedto estimate the shear modulus of clean sands, but themethod is approximate. If the shear modulus is needed,directly measuring the shear wave velocity is preferred.
PENETRATION TESTING
359
Liquefaction occurs when water pressure builds up ingranular soils during an earthquake. Soils mostlysusceptible to liquefaction are “cohesionless” soils,primarily clean sands and gravels (GP, SP, GW, SW, GP-GM, SP-SM) and silty sands and gravels (SM, GM). Theterm, “sands,” in the following discussion refers to allthese soils. The water pressure buildup results instrength loss and possibly deformation, slippage, andfailure. Data collected at liquefaction sites have beenused to assess whether a deposit is liquefiable.
Testing Cohesionless Soils
Earthquake induced liquefaction is commonly associatedwith sands below the water table. Good drilling techniqueis critical to ensuring that the sands are undisturbedprior to the SPT. Unfortunately, loose sand is one of themost difficult materials to drill.
If disturbed sands are present, take measures to avoidcontinued disturbance. Perform depth checks to assessthe sand depth at the bottom of the drill hole. Thesedepth checks are made by seeing exactly where thesampler rests before testing. Depth checks that can bemade during drilling will be discussed below. Do not drillat excessive rates. Signs of disturbance are excessiveslough in the SPT barrel, drill fluid in the sample, andfailure of the sampler to rest at the proper cleanout depth.Slough is the disturbed material in the drill hole thatcaves from the sidewalls but can include disturbed sandthat heaves or flows upward into the drill hole. Sloughcan also consist of cuttings which settle from the drillfluid before testing.
The SPT sampler must rest at the intended depth. Thisdepth is to the end of the cleanout bit or the end of thepilot bit in hollow-stem augers. If the sampler rests at an
FIELD MANUAL
360
elevation that is 0.4 foot (12 cm) different from thecleanout depth, disturbance of the soil may be occurring,and the hole must be recleaned. There are a number of advantages to the SPT:
(1) The test is widely used, and often local experienceis well developed.
(2) The test is simple, and many drillers can performthe test.
(3) The SPT equipment is rugged, and the test can beperformed in a wide range of soil conditions.
(4) There are numerous correlations for predictingengineering properties with a good degree ofconfidence.
(5) The SPT is the only in place test that collects a soilsample.
Although the SPT is commonly used and is a flexible inplace test, there are significant disadvantages. The testdoes not provide continuous samples. Different soils inthe SPT interval tend to be logged as one soil, especiallyif the soil core is combined into one laboratory testspecimen and laboratory data are used in the logs.Hollow-stem augers can give disturbed samples betweentest intervals, and the intervals between tests can belogged. The greatest disadvantage to SPTs is the lack ofreproducibility of the test results. Drilling disturbance,mechanical variability, and operator variability all cancause a significant variation in test results. The SPTshould not be used unless the testing is observed andlogged in detail. Old data where drilling and testprocedures are not documented should be used with
PENETRATION TESTING
361
extreme caution. Another disadvantage to SPTs is thatprogress is slower than other in place tests because ofincremental drilling, testing, and sample retrieval, andSPTs may be more expensive than other in place tests.The SPT is influenced by more than just overburdenstress and soil density. The soil type, particle size, soilage, and stress history of the soil deposit all influenceSPT results.
Drilling Methods
Fluid Rotary Drilling
Rotary drilling with clear water results in N values thatare much lower than N values that are obtained whendrilling mud is used. Two factors are involved: (1) thewater from drilling can jet into the test intervaldisturbing the sand, and (2) the water level in theborehole can drop and the sand can heave up the boreholewhen the cleanout string is removed. These two factorsmust be minimized as much as is practical.
The best way to drill loose, saturated sands is to usebentonite or polymer-enhanced drill fluid and drill bitsthat minimize jetting disturbance. Also when drillingwith fluid, use a pump bypass line to keep the hole fullof fluid as the cleanout string is removed from the drillhole. The lack of fluid in the hole is one of the mostfrequent causes of disturbed sands. If the soils arefine-grained, use a fishtail-type drag bit with baffles thatdeflect the fluid upwards. A tricone rockbit is acceptableif gravels or harder materials are present, but adjust theflow rates to minimize jetting.
Casing can help keep the borehole stable, but keep thecasing back from the test interval a minimum of 2.5 feet
FIELD MANUAL
362
(75 cm) or more if the hole remains stable. Using abypass line to keep the hole full of fluid is even moreimportant with casing because the chance of sand heaveup into the casing is increased if the water in the casingdrops below natural groundwater level. The imbalance isfocused at the bottom, open end of the casing. In extremecases, the casing will need to be kept close to the testinterval. Under these conditions, set the casing at thebase of the previously tested interval before drilling to thenext test interval. Intervals of 2.5 feet (75 cm) arerecommended as the closest spacing for SPTs.
Use drilling mud when the SPT is performed forliquefaction evaluation when rotary drilling. Abentonite-based drilling mud has the maximumstabilizing benefit of mud. Bentonite provides themaximum weight, density, and wall caking propertiesneeded to keep the drill hole stable. When mixing mud,use enough bentonite for the mud to be effective. Thereare two ways to test drill mud density or viscosity—aMarsh Funnel or a mud balance. A mud sample is pouredthrough a Marsh Funnel, and the time needed to passthrough the funnel is a function of the viscosity. Waterhas a Marsh Funnel time of 26 seconds. Fine-grainedsoils require mud with Marsh Funnel times of 35 to50 seconds. Coarser materials such as gravels mayrequire funnel times of 65 to 85 seconds to carry thecuttings to the surface. If using a mud balance, typicaldrill mud should weigh 10-11 pounds per gallon (lbs/gal)(1-1.1 kilograms per liter [kg/L]). Water weighs about8 pounds per gallon (0.8 kg/L).
Exploration holes are often completed as piezometers.Revertible drilling fluids have been improved, and thereare synthetic polymers that break down more reliably. Ifnecessary, specific “breaker” compounds can be used tobreak down the mud and clean the borehole. If the
PENETRATION TESTING
363
borehole cannot be kept stable with polymer fluid,bentonite mud should be used and a second hole drilledfor the piezometer installation. Do not combine drill holepurposes if the data from SPTs or piezometers arecompromised.
Drilling sands with clear water is possible, but only if thedriller is very experienced. As long as drilling is carefullyperformed, drilling with water can result in SPT N valuesclose to those obtained using mud. Disturbance can beavoided; but without drill mud, jetting disturbance, cave,and sand heave caused by fluid imbalance are likely.
If the water level in the sand layer is higher than theground surface, sand heave is really going to be aproblem. Under these conditions, heavy bentonite mud(80 to100 sec on the Marsh Funnel) is required. A fluidbypass to keep the hole full of mud is required, and anelevated casing or drill pad to hold down the sand can beused. Some successful mud improvement is possible withBarite or Ilmenite additives. Mud can be weighted toabout 15 lb/gal with these additives. Sodium or calciumchloride can be used to give polymer fluid better gelstrength. In artesian conditions, it may not be possible tokeep the sand stable. In these cases, other tests such asthe CPT can be used to evaluate the sand.
When using fluid rotary drilling, circulate the drill fluidto remove the cuttings. Pull back the cutting bit severalfeet, cut fluid circulation, and then slowly and gentlylower the bit to rest on the bottom of the hole. Check tosee if the depth is within 0.4 foot (10 cm) of the cleanoutdepth. This check determines if there is cuttingssettlement, wall cave, or jetting disturbance.
The bottom of the borehole normally heaves when thecleanout drill string is pulled back creating suction. Fluid
FIELD MANUAL
364
should be added to the drill hole as the cleanout string isremoved to help avoid problems. Once the sampler isplaced, check the sampler depth and compare it to thecleanout depth. A difference of 0.4 foot (10 cm) isunsatisfactory. If sands or silty sands heave up into theborehole, the SPT sampler will often sink through most ofthe slough. The only way to check for this situation is tocarefully inspect the top of the sampler and the ball checkhousing for slough or cuttings. If the ball check area isplugged with cuttings, the SPT N value may have beenaffected. A thin plastic cover is sometimes used to keepthe slough out of the sampler. The cover is either shearedoff at the first blow or it is shoved up into the sampler.
The fluid rotary method is probably the best method fordetermining SPT N values in saturated sands. In thefollowing sections, two other acceptable drilling methodsare discussed. If these methods do not work, use the fluidrotary method.
Hollow-Stem Augers
Hollow-stem augers (HSA) have been used successfully todo SPTs in loose saturated sands. With the properprecautions, hollow-stems can be used reliably in sands,but there are some problems with HSAs. The primaryproblem with the HSA in loose sands is sand heaving intothe augers. This occurs when the pilot bit or the HSAsampler barrel is removed in preparation for the SPT.Sometimes, sand can heave 5 to 10 feet (1.5 to 3 m) upinside the augers. SPT N values taken with this amountof disturbance are unacceptable. These problems can beovercome in most cases by using water-filled augers andremoving the pilot bit or HSA sampler slowly to avoid thesuction. Drilling mud is not usually required and cancause sealing problems.
PENETRATION TESTING
365
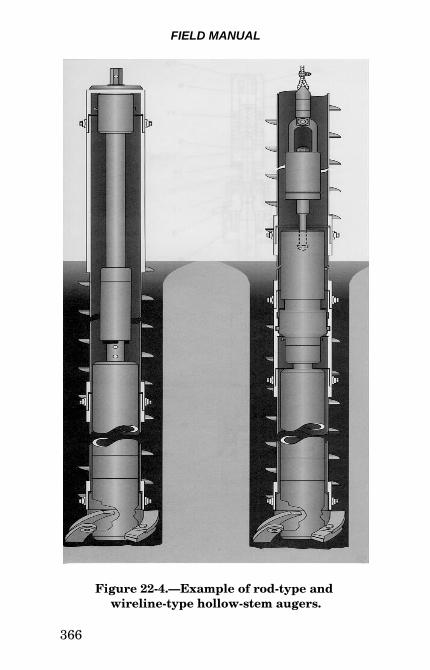
There are two types of HSA systems shown infigure 22-4—wireline and rod type. With either type ofsystem, removal of the pilot bit or HSA sampler barrel canresult in sand heaving into the augers. The rod typesystem is best at preventing sample barrel rotationduring soil sampling. In sanding conditions, the wirelinesystem is sometimes harder to operate because thewithdrawal rate of the bit or HSA sampler is harder tocontrol. Sanding-in also prevents re-latching of thewireline barrel. Rod type systems are recommended whendrilling in heaving sands. If sand heaves a considerableheight into the augers, the auger will need to be cleanedor retracted in order to continue drilling using eithersystem. If the augers have to be pulled up 3 feet (1 m) tore-latch a pilot bit or sampler barrel, tremendous suctionoccurs at the base of the boring, which can disturb thenext SPT test interval.
When using HSAs below the water table, the hole must bekept full of fluid, just like it must when using fluid rotarymethods. A water or mud source and a bypass lineare required. Some successful techniques for hollow-stem drilling in flowing sands are:
� When approaching the test interval, slow the augerrotation to just enough to cut the soil; do not continueto rotate without advancement near the test interval.In flowing sands, continued rotation near the testinterval will create a large void around the holeannulus and increase the chance of caving anddisturbance of the test interval. If high down pres-sure is used with wireline systems, the pressureshould be relaxed; and the augers should be slightly
FIELD MANUAL
366
Figure 22-4.—Example of rod-type and wireline-type hollow-stem augers.
PENETRATION TESTING
367
retracted ½ inch (1 cm) or so to re-latch bits orbarrels. There is no need to release down pressure orretract the augers with rod-type systems.
� Add water to a level higher than the surroundinggroundwater level before pulling the pilot bit orsampling barrel. In most cases, water can be addedto the top of the augers without concern fordisturbance. Add water by removing the drive capusing a hose from the bypass line. When removingthe drive cap on rod-type systems, be careful todisconnect the drive cap bearing from the inner rods,or the pilot bit or sampler will be pulled prematurelybefore adding water. When using a wireline system,the latching device can be sent down the hole andlatched before adding water.
The water level is not always maintained at the top of thecolumn, especially if there is a thick layer of unsaturatedsoil above the test zone. Water can leak through theauger joints, and it may be necessary to add a lot of water.
Pulling the Sampler Barrel.—The sample barrelassembly is generally 5 feet (1.5 m) long. This barrel doesnot have much clearance with the inside of the augers,especially in the bushing at the base of the augers. Withthe augers full of water, reconnect the drive cap to theinner rods. Pull the barrel slowly up 0.1 to 0.3 foot (3 to10 cm) and observe the water level in the augers. If waterflows upward, out of the augers, there is a seal betweenthe augers and the sampler, and the sampler barrel isacting like a syringe. If water flows from the top with rodtype systems, rotate the barrel or work the barrel slightlydown and up to try to break the seal and vent. Forwireline systems, release the pulling force and re-apply.Pull slowly and attempt to break the seal. Once the sealis broken, remove the sampler slowly. Remember, with
FIELD MANUAL
368
rapid withdrawal rates, suction can be created anywherein the auger column. For rod systems, add water duringpulling to account for water level drop. The same ruleapplies for wireline systems, but less water is needed.
Pulling the Pilot Bit.—Most pilot bits are seated flushin a brass bushing in the end (crown) of the augers. Thepilot bit cutting teeth should be set to a lead distance thesame as the outer cutting teeth, so that the body of thepilot bit sits correctly in the bushing. Do not drill withthe pilot bit in advance of the outer cutting teeth. Auseful procedure in heaving sands is to use a pilot bit onesize smaller than the augers being used. For example, ifa 4.25-inch (11-cm) inside diameter (ID) HSA is used, a3.75-inch (9.5-cm) ID HSA pilot bit can be used to reducevacuum and suction effects.
When drilling with the pilot bit, pull the bit back slowlyabout 0.1 to 0.2 foot (3 to 6 cm) to allow any seal in thebushing to vent. If the bit is withdrawn quickly, suctionwill likely occur. If water flows out the top of the augers,suction is occurring. If suction is occurring, rotate thepilot bit and work it down and up to try to break the seal.Once the bit clears the bushing, the tendency to bind isreduced. Withdraw the pilot bit slowly and add water, toaccount for water level drop as the rods are removed.Remember, with rapid withdraw rates, suction effects canbe created anywhere in the auger column.
If sanding-in cannot be controlled with fluid or slowpulling, there are special flap valves that can be placed inthe pilot bit seat. Drill without the pilot bit with flapvalves.
Once the sampler has been inserted to the base of theboring, determine the depth to the sampler tip as aquality check. If there is more than 0.4 foot (12 cm) of
PENETRATION TESTING
369
slough or heave, the test may not be acceptable. Thisguideline is arbitrary, and it is possible to get a reliabletest with as much as 0.5 foot (15 cm) or more slough aslong as the vent and ball check of the sampler are notplugged. If the SPT barrel is used to test the bottom ofthe hole, the sampler will often penetrate loose slough orheave. Checks with a weighted tape may be moreaccurate in determining the depth to the slough. Whenusing the HSA sampler barrel to core before testing, sandfalling out of the barrel could be the cause of slough insidethe auger. To avoid this problem, use catcher baskets inthe HSA sampler barrel.
When testing at close intervals of 2.5 feet (75 cm) or less,it may be necessary to add water to the augers as theSPT sampling string is removed to avoid water levelimbalance and possible heave.
It’s a good idea to combine the continuous sampler of theHSA with SPT operations. If SPTs are at 2.5-foot (75-cm)intervals, perform the SPT and then sample the 2.5-foot(75-cm) and over-sample the 1.5-foot (45-cm) test interval.This adds some time, but allows continuous sampling.This sampling method provides a look at the soils betweenthe test intervals. It is also helpful if recovery is low.
Rotary Casing Advancers
Rotary casing advancers can provide good SPT N valuesin sands. The casing advancer method uses drilling fluid(bentonite and water) as a circulation medium and is afluid rotary drilling method. This method is successfulbecause the large diameter outer rods remain filled withdrill fluid and keep the sand down. The casing advancernormally has a diamond bit but can be equipped withtungsten carbide drag bits on the outside edge to over-cutsoil. Typically, an HQ- or HW-size casing advancer is
FIELD MANUAL
370
used with or without a pilot bit. The pilot bit can be atricone bit removed via wire line. Suction is possiblewhen a pilot bit is removed. If suction occurs, drillingwithout a pilot bit should be tried. An advantage ofdrilling with a wireline is that when the pilot bit isremoved, the line takes up little volume and results in aminor drop in fluid level inside the rod column. Since agood fluid column remains in the rods, a fluid bypass isnot needed. The only problem is that whenever addingrods to the SPT drill string, fluid flows out of theadvancer.
The casing advancer must be operated very carefully toavoid sand disturbance. Fluid is pumped down the casingand up a narrow annulus along the exterior of the casing.A casing advancer, especially without a pilot bit, isequivalent to a bottom discharge bit. If excessive fluidpressures are used or if circulation is lost, jetting orhydraulic fracturing the material in the SPT test intervalis possible. Drilling the material with a slow advancerate and with low pressure while maintaining circulationis necessary to drill successfully with this system. Ifcirculation return stops, blockage may be occurring; andif pump pressures increase, hydraulic fracturing couldoccur. If the advance rate is too fast, circulation will beblocked. Water is not an acceptable drill fluid with thismethod, and drill mud must be used.
Summary of Drilling Effects
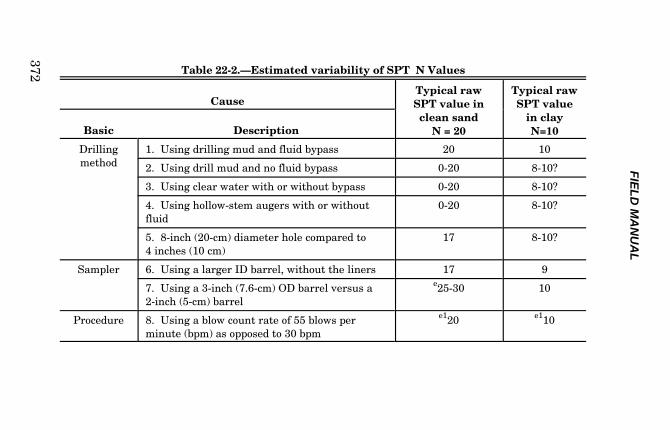
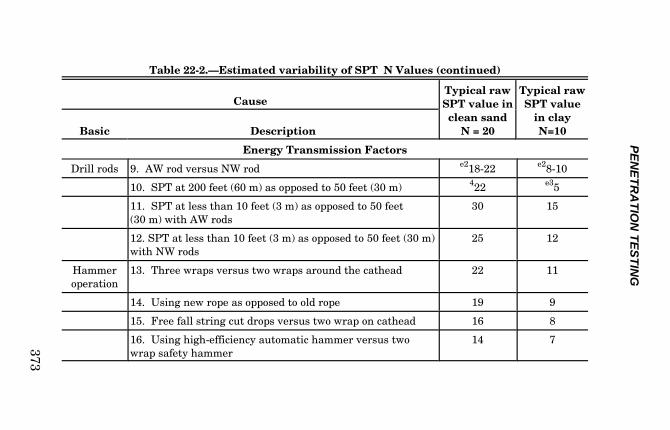
Table 22-2 illustrates the effects of different drilling andmechanical variables on the SPT N value (items 1through 5). A typical N value in clean quartz sand is20 blows per foot (30 cm). The possible range of N for thematerial is shown if the material is subject to errors intesting.
PENETRATION TESTING
371
Table 22-2 shows that drilling disturbance can havedrastic effects on the N value. In fact, zero blows can beobtained. Zero blows may not be realistic because, inmany cases, loosened sand settles back to the bottom ofthe hole. Also, very loose sand normally does not allowthe sampler to settle under the weight of the assembly.Drilling disturbance usually results in a low N value.Low blow counts indicate loose, weak soils, and a weakfoundation may be assumed. Erroneous low disturbedN values can result in costly over design of structures.The most important aspect of SPT testing is the way thehole is drilled.
Procedure Variables
The recommended 2.5-foot (75-cm) interval is to ensurethat the next interval is not disturbed. If material thatonly has a few thin layers of sand is drilled, continuoussampling is possible, but difficult, and should not beattempted unless necessary.
Hammer Blow Rate
The blow count rate is important when soil drainageneeds to be considered. Most test standards requestSPT blows at a rate of 20 to 40 blows per minute (bpm).Blows at 55 bpm are not likely to have an effect on cleansand; but at some fines content, blows will be reduced bythe lack of drainage. Blows should be between 20 and40 bpm if a hammer with a controllable rate is used.Some hammer systems are designed to deliver blows at afaster rate. The automatic hammer is designed to deliverblows at a rate of 50 to 55 bpm. The hammer can be setto run at 40 bpm by adding a spacer ring to the impactanvil. If a hammer rate differs from 50 bpm, clearly noteit on the drill logs.
FIE
LD
MA
NU
AL
372 Table 22-2.—Estimated variability of SPT N Values
CauseTypical rawSPT value inclean sand
N = 20
Typical rawSPT value
in clayN=10Basic Description
Drillingmethod
1. Using drilling mud and fluid bypass 20 10
2. Using drill mud and no fluid bypass 0-20 8-10?
3. Using clear water with or without bypass 0-20 8-10?
4. Using hollow-stem augers with or withoutfluid
0-20 8-10?
5. 8-inch (20-cm) diameter hole compared to4 inches (10 cm)
17 8-10?
Sampler 6. Using a larger ID barrel, without the liners 17 9
7. Using a 3-inch (7.6-cm) OD barrel versus a2-inch (5-cm) barrel
e25-30 10
Procedure 8. Using a blow count rate of 55 blows perminute (bpm) as opposed to 30 bpm
e120 e110
PE
NE
TR
AT
ION
TE
ST
ING
373
Table 22-2.—Estimated variability of SPT N Values (continued)
CauseTypical rawSPT value inclean sand
N = 20
Typical rawSPT value
in clay N=10Basic Description
Energy Transmission Factors
Drill rods 9. AW rod versus NW rod e218-22 e28-10
10. SPT at 200 feet (60 m) as opposed to 50 feet (30 m) 422 e35
11. SPT at less than 10 feet (3 m) as opposed to 50 feet(30 m) with AW rods
30 15
12. SPT at less than 10 feet (3 m) as opposed to 50 feet (30 m)with NW rods
25 12
Hammeroperation
13. Three wraps versus two wraps around the cathead 22 11
14. Using new rope as opposed to old rope 19 9
15. Free fall string cut drops versus two wrap on cathead 16 8
16. Using high-efficiency automatic hammer versus twowrap safety hammer
14 7
FIE
LD
MA
NU
AL
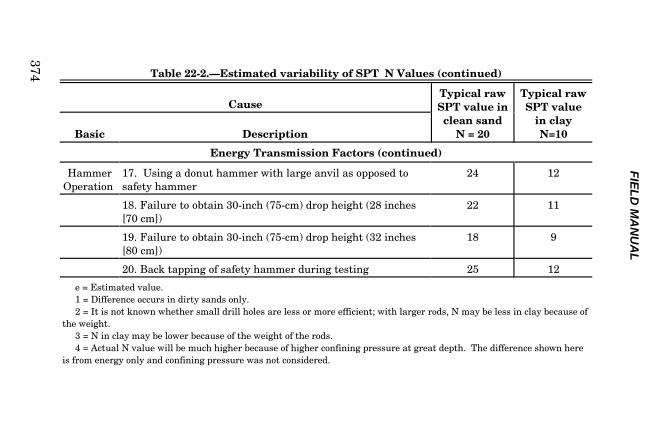
374 Table 22-2.—Estimated variability of SPT N Values (continued)
CauseTypical rawSPT value inclean sand
N = 20
Typical rawSPT value
in clay N=10Basic Description
Energy Transmission Factors (continued)
HammerOperation
17. Using a donut hammer with large anvil as opposed tosafety hammer
24 12
18. Failure to obtain 30-inch (75-cm) drop height (28 inches[70 cm])
22 11
19. Failure to obtain 30-inch (75-cm) drop height (32 inches[80 cm])
18 9
20. Back tapping of safety hammer during testing 25 12
e = Estimated value. 1 = Difference occurs in dirty sands only. 2 = It is not known whether small drill holes are less or more efficient; with larger rods, N may be less in clay because ofthe weight. 3 = N in clay may be lower because of the weight of the rods. 4 = Actual N value will be much higher because of higher confining pressure at great depth. The difference shown hereis from energy only and confining pressure was not considered.
PENETRATION TESTING
375
Limiting Blow Counts
The Reclamation test procedure calls for stopping the testat 50 blows per foot (30 cm). Other agencies sometimes goto 100 blows per foot (30 cm) because the ASTM teststandard D 1586 sets a 100-blow limit. The Reclamationstandard is lower to reduce equipment wear. Using the soil liquefaction criteria for sand at a depth of100 feet (30 m), 50 blows would not be consideredliquefiable. SPT data are corrected to a stress level of1 ton per square foot (ton/ft2). In a typical ground mass,a 1 ton/ft2 stress level occurs at a depth of 20 to 30 feet(6 to 9 m), depending on the location of the groundwatertable. Blow counts in a sand of constant density increasewith depth. A correction factor is used to adjust for thisoverburden effect. In earthquake liquefaction clean sandN160 values greater 30 blows per foot (bpf) are notliquefiable. A blow count of 50 bpf at 100 feet (30 m)corrects to about 30 bpf at 1 ton/ft2. Higher blow countswould not be considered liquefiable. If testing is deeperthan 100 feet (30 m) it will be necessary to increase thelimiting blow counts to 100. The refusal rule still applies;if there is no successive advance after 10 blows, the testcan be stopped.
SPT N values in gravels generally are much higher thanin sands. Liquefaction criteria for sands are not reliablecriteria for gravels.
Penetration per Blow or Blows per 0.1 Foot (3 cm)
Penetration for each blow should be recorded whendrilling in gravelly soils. If penetration per blow isrecorded, sand layers can be resolved, and the N value ofthe sand can be estimated. The blow count in sand can beestimated from a graph of penetration per blow. The
FIELD MANUAL
376
extrapolation is generally reliable if the blows start insand. If the interval starts with gravel and then pene-trates into sand, the extrapolation is less reliable becausethe sampler could be plugged by gravel.
The number of blows for 0.1 feet (3 cm) is the minimumpenetration rate data that should be collected. If threepeople are present, it is very easy to record “penetrationper blow,” and these data are preferred over the coarserblows per 0.1 feet (3 cm). To record penetration per blow,make a form with three columns. In one column, list theblows 1 through 100. Mark the drill rods in 0.1-foot(3-cm) intervals or use a tape starting at zero from theedge of a reference point. In the second column, recordthe total penetration as the test is performed. This willrequire a reader to call off the total penetration. Thereader can interpolate between the 0.1-foot (3-cm)increments, or the penetration can be read directly froma tape. After the test is done the incremental penetrationcan be calculated from the cumulative penetration dataand recorded in the third column.
Equipment and Mechanical Variables
Sampler Barrel
The standard sampler barrel is 2 inches (5.1 cm) in ODand is the barrel that should be used. In private industry,2.5- (6.4-cm) and 3-inch (7.6-cm) OD barrels areoccasionally used. If sample recovery in coarse materialsis poor, it is acceptable to re-sample with a 3-inch (7.6-cm)barrel equipped with a catcher.
Gravelly soils generally do not provide reliable SPT datafor liquefaction evaluations that are based on sands.Other methods use larger samplers and hammers to
PENETRATION TESTING
377
evaluate the liquefaction potential of gravelly soils. TheBPT is used at gravel sites. Often, the BPT is used atgravel sites after a first round of SPT testing showsconsiderable gravels present.
Sampler Shoe
The dimensions of the sampler shoe should meet ASTM D1586 requirements. Some drill equipment catalogs claimto have special “heavy duty” sample barrels and shoes.The “Terzaghi” style does not meet the ASTM andReclamation requirements. When buying shoes, checktheir dimensions to be sure they meet test requirements.Figure 22-1 shows both Reclamation and ASTM samplerrequirements.
Shoe ruggedness can be improved by “carburizing” themetal. This is a process where the shoe is heated in acarbon gas to improve the surface hardness of the steel.This makes the shoe more rugged but also more brittle.Most drill manufacturers supply untreated low carbonsteel such as 1040 alloy. Generally, a local machine shopcan “carburize” the shoe, an inexpensive process.
Sample Retainers
A sample retainer should not be used for liquefactionstudies except in desperation because the effects areunknown. If the sample cannot be retained, a samplemay be taken with a large diameter split barrel samplerwith a retainer re-driven through the test interval. Theover coring procedure discussed earlier using HSAs couldalso be used.
There are several types of retainers available and sometypes are better than others. There is a flap valve devicethat actually looks like a toilet seat (a small one) that
FIELD MANUAL
378
places a large constriction inside the barrel. This deviceis the least desirable of the retainers if the N value isimportant. The basket type catcher is made of curvedfingers of steel, brass, or plastic. This type of retainer isonly a minor constriction because the holding ring fitsinto the recessed area between the shoe and the barrel.The problem with this catcher is that the fingers may notalways fall back into position to hold the core. A bettervariation of this catcher is the “Ladd” type retainer thatcombines the finger basket with a plastic sleeve. Thisretainer is the most successful at retaining flowing sandbecause the bag adds extra retaining capability.
Sampler Liners
Most of the SPT samplers in the USA accept liners, butthe liner is usually omitted. To determine if the samplerwill accept a liner, feel for an offset (increased diameter)inside the shoe. If an offset is present, the barrel is1½-inch (3.8-cm) ID. Log whether a constant diameter oran enlarged diameter barrel is used because the sampletype can effect recovery. For liquefaction evaluation, aconstant ID barrel is recommended.
A sampler used without liners is actually better forrecovery. Average recovery of a constant ID barrel isabout 60 percent, and the average for the barrel withoutliners is about 80 percent. The difference in N valuebetween constant and enlarged diameter barrels is notknown, but an increase in blows in the range of 1 to 4 islikely with a constant ID barrel.
PENETRATION TESTING
379
Sampler Length
A 24-inch- (61-cm-) long split barrel can normally accom-modate any slough in the drill hole without plugging theball check device.
Sampler Vent Ports
The required vent ports for the sampler top subassemblyin ASTM and Reclamation test procedures are inadequatewhen drilling with mud. The ASTM standard requirestwo �-inch (1-cm) diameter vents above the ball check.When drilling with mud, the fluid gets loaded with sandand can easily plug these ports. The sampler and rods fillwith mud as they are lowered into the drill hole. A bigcolumn of drill mud may try to push the sample out if theball check does not seat. Drill larger vent ports in the topsubassembly to avoid this problem. Some drillers use a0.5- to 1-foot (15- to 30-cm) drill rod sub just above thesampler with extra holes drilled in it to easily drain drillfluid from the rod column.
Hammers, Anvils, Rods, and Energy Effects
The variables in energy transmission are hammer type,hammer drop height, hammer drop friction, energy lossesin impact anvil(s), and energy losses in rods. The energyin the drill rods is called the “Drill Rod Energy Ratio” orERi.
Some hammers, especially donut (casing type) hammerswith large anvils, deliver approximately 50 percent of thetotal potential energy of a 140-lb (63.6-kg ) hammerdropping 30 inches (75 cm). The N value is proportionalto the energy delivered, and the N values can be adjustedto a common energy delivery level. The current practiceis to adjust SPT N values to 60-percent drill rod energy.
FIELD MANUAL
380
Safety Hammers
There are many kinds of SPT hammers. Pin-guided anddonut type hammers were common in the past, but thesehammers have generally been replaced by the “safety”hammer which has an enclosed anvil (figure 22-2). Thereare also new automatic hammers that improve therepeatability of delivered hammer energy to the sampler.
The safety hammer provides an economical and safemethod of performing the SPT. The enclosed anvilremoves hazards from flying metal chips, and operatorscannot get their hands in the impact surface. Due to theirinherent geometry, safety hammer energy transmissioncan vary only by about 20 percent as long as the hammersare operated correctly and consistently.
Safety hammers should be designed with a total stroke ofabout 32 inches (80 cm), and there should be a mark onthe guide rod so the operator can see the 30-inch (75-cm)drop. The hammer weight should be 140 pounds(63.6 kg). These characteristics should be verified on thehammer. An easy way to weigh the hammer is to placethe total assembly on a platform scale, get the totalweight, then lift the outer hammer off the anvil, andweigh the guide rod and anvil. The difference in the twoweights is the hammer weight. The hammer weightshould be 140 +/- 2 lb (63.6 kg +/- 0.9 kg). Hammersshould be stamped with an ID number. It is best to keepa given hammer for a specific drill, especially if the energytransmission of the drill has been measured in the past.
The assumption is that safety hammers deliver60-percent drill rod energy with two wraps of rope aroundthe cathead. Actually, the hammers deliver about 60 to75 percent depending on their construction. The guiderod is one factor that affects the energy transmission.
PENETRATION TESTING
381
Some safety hammers come with a solid steel guide rod,and others use a hollow AW drill rod. The solid guide rodabsorbs energy, and the solid steel guide rod safetyhammer will deliver lower energy than the hollow guiderod safety hammer. These differences are not enough torecommend one design over another. Another variablewith safety hammers is a vent. Some hammers havevents near the top of the hammer. A vent allows some airto escape as the anvil moves toward the impact surface.These vents allow the best free fall possible.
Donut Hammers
These hammers are not recommended except in specialcases such as when clearance is a problem. If the testingis for liquefaction evaluation, it may be necessary tomeasure the energy of the donut hammer used. Thedonut hammer is supposed to be inefficient, but if thehammer has a small anvil, efficiencies may be similar tothe safety hammer. The larger anvil absorbs part of thehammer energy.
Rope and Cathead Operations
Most SPTs are performed using the rope and catheadmethod. In this method, the hammer is lifted by acathead rope that goes over the crown sheaves. ASTMand Reclamation standards require two wraps of ropearound the cathead. After the hammer is lifted to the30-inch (75-cm) drop height, the rope is thrown towardthe cathead, allowing the hammer to drop as freely aspossible.
Three wraps will reduce the drill rod energy by about10 percent and will result in a higher N value. As therope gets old, burned, and dirty, there is more friction onthe cathead and across the crown sheaves. New rope is
FIELD MANUAL
382
stiffer and is likely to have higher friction than a ropethat has been broken in. A wet rope may have lessfriction, but the energy differences are small enough thatit is not necessary to stop testing in the rain. Rain shouldbe noted on the drill report and log. Frozen rope mayhave considerably more friction. Under wet and freezingconditions, exercise the rope and warm it up prior totesting.
Consistent rope and cathead operations depend on havingwell maintained crown sheaves on the mast. Crownsheaves should be cleaned and lubricated periodically toensure that they spin freely.
Automatic Hammers
Automatic hammers are generally safer and provide goodrepeatability. Central Mine Equipment (CME) made oneof the first automatic hammers commercially available inthe United States. This hammer uses a chain cam to lifta hammer that is enclosed in a guide tube. The chain camis driven with a hydraulic motor. The drop height of thishammer depends on the chain cam speed and the anvillength. Problems with this hammer system primarilyresult from the speed not being correctly adjusted. Thehammer should be run at 50 to 55 bpm to obtain a 30-inch(75-cm) drop. There are blow control adjustments on thehammer, and there is a slot on the side of the hammercasing to observe the hammer drop height. Be sure thehammer is providing a 30-inch (75-cm) drop by adjustingthe blow control.
The CME automatic hammer is designed to exert a downforce on the rods. This down force from the assembly isabout 500 lbs (227 kg). A safety hammer assemblyweighs from 170 to 230 pounds (77 to 104 kg). In very
PENETRATION TESTING
383
soft clays, the sampler will more easily sink under theweight of the assembly, and with the automatic hammer,the blow counts will be lower.
The Foremost Mobile Drilling Company hammer “floats”on a wireline system. The drop mechanism does notdepend on rate. Energy transfer is about 60 to 70 percent.
Energy transfer of some automatic hammers is signi-ficantly higher than rope and cathead operated hammers.The CME hammer can deliver up to 95 percent energy.This could result in very low blow counts in sands.Energy corrections are usually required for automatichammers. The Mobile Drilling Company hammer is lessefficient because of a large two-piece anvil.
If an automatic hammer is used, report detailedinformation on the hammer use. Report make, model,blow count rates, and any other specific adjustments onthe drilling log. In liquefaction investigations, the energytransfer must be known. For some hammer systems, suchas the CME and Mobile Drilling Company, the energytransfer is known if the hammers are operated correctly,but for some systems, energy measurements may berequired.
Spooling Winch Hammers
Mobile Drilling Company developed a hammer called the“Safety Driver.” This hammer system used a steel wire-line cable connected to an automated spooling winch withmagnetic trip contacts. The contacts sensed when thehammer was lifted 30 inches (75 cm), and the hammerthen dropped with the spool unrolling at the correct ratefor the dropping hammer.
FIELD MANUAL
384
Energy measurements of this hammer system show someextreme energy variations. Apparently, the contacts andspooling systems require continual adjustment to operatecorrectly. This type of hammer system is not recom-mended because of energy transmission problems.
Drill Rods
Any rod from AW to NW size is acceptable for testing.There is some concern about whipping or buckling ofsmaller AW rods at depths greater than 75 feet (23 m). Inthese cases, use BW rods or larger. There is not muchdifference in energy transfer between AW and NW rods.The type of rod changes a blow count in sand only byabout two blows and maybe less.
SPT drill rods should be relatively tight during testing.Energy measurements on differing locations of the drillrods do not show significant energy loss on joints that areloose. There has to be a real gap on the shoulders tocause significant energy loss. This is because when therod is resting in the hole, the shoulders of the joints are incontact. There is no need to wrench tighten joints unlessrod joints are really loosening during testing. Be sure tofirmly hand tighten each joint.
Drill Rod Length
When using very short rods, energy input to the sampleris attenuated early because of a reflected shock wave. Thedriller can usually hear this because there is a secondhammer tap. The early termination of energy is aproblem to depths of 30 feet (9 m), but the correction issmall and is often ignored. The energy termination is alsoa function of the size of the drill rods. There is someenergy loss for drill rod strings longer than 100 feet(30 m), and a correction is necessary. A constant density
PENETRATION TESTING
385
sand will have an increasingly higher penetrationresistance as depths increase. This is because theconfining pressure increases in the ground mass withdepth.
Summary How Good is the SPT Test
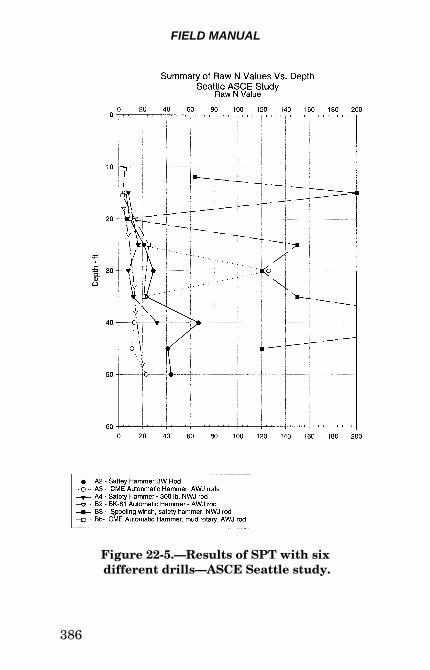
Figure 22-5 is a summary graph of a study performed inSeattle by the American Society of Civil Engineers(ASCE). In this study, several private geotechnical firmsand agencies drilled SPTs at the same site. Six drillswere used. Some had safety hammers, and others hadautomatic hammers. One drill was equipped with a300-lb (136-kg) safety hammer.
The graph shows a wide variation in raw N value versusdepth. The soil conditions at the site are not welldocumented. Some gravel layers are present. Note thatthe spooling winch system resulted in unreliably highSPT N values.
The variability of SPT drilling can be reduced if drillersare aware of the problems inherent to the SPT. Inter-pretation of the data improves if all unusual occurrencesduring SPTs are reported. Drill logs should clearlydescribe in detail the equipment used.
Liquefaction studies are done in loose sands below thewater table. Unfortunately, this material is the hardestto drill without disturbance. Fluid rotary drilling is thepreferred approach for keeping the sand stable. HSAsand casing advancer systems have also been successfullyused.
FIELD MANUAL
386
Figure 22-5.—Results of SPT with six different drills—ASCE Seattle study.
PENETRATION TESTING
387
The drilling part of SPTs is the most important.Generally, disturbance from improper drilling techniqueresults in lower N values.
Energy transfer effects can be important, especially ifhighly efficient automatic hammers are used.
Becker-Hammer Penetration Testing for Gravelly Soils
Introduction
The BPT is used to test the density of materials that aretoo coarse for the SPT or the CPT. Gravel can causemisleading results in the SPT and CPT. Because thediameter of the BPT penetrometer tip is much larger thanthat of the SPT sampler or the cone penetrometer, gravel-sized particles do not seriously affect the BPT.
The BPT consists of driving a plugged steel casing intothe ground using a diesel pile-driving hammer. The blowsper foot (30 cm) of penetration are recorded and adjustedfor driving conditions. An empirical correlation is thenused to estimate equivalent SPT values. The BPT isperformed with a Becker Drills, Ltd. model AP-1000 orB-180 drill rig, equipped with an InternationalConstruction Equipment (ICE) model 180 closed-enddiesel hammer. The standard configuration uses 6.6-inch(16.8-cm) OD double-wall casing and a plugged “crowd-out” bit. Some ICE 180 hammers are marked “Linkbelt.”
The BPT is rapid and economical to perform. Productioncan reach 500 feet (150 m) per day. A disadvantage isthat no sample is retrieved with the BPT, so othersampling, such as SPT or coring, is also required.Another disadvantage is the uncertainty in interpretation
FIELD MANUAL
388
of the data. Since the BPT is generally used to estimateequivalent SPT blow counts, significant uncertainty isintroduced by that step, in addition to the uncertaintythat exists in predictions of soil behavior from N values.
The penetration resistance of soils is influenced by a largenumber of factors, including soil type (grain-sizedistribution, plasticity, particle sizes, particle shapes),density, confining stress, energy delivered to thepenetrometer, size and shape of the penetrometer, andfriction on the sides of the penetrometer. The BPT differsfrom the SPT test in many ways, and correlation betweenBPT and SPT data is not consistent. The BPT is notperformed in an open hole with a diameter greater thanthe rod diameter, and the penetrometer tip is not openlike a SPT tip, so there is substantial friction on the drillstring. This greatly complicates the analysis. Like theSPT, the BPT may give misleading results in soilscontaining boulders, cobbles, or even large amounts ofgravel coarser than about 1½ inches (4 cm).
The effect of fines in the relationship between Beckerpenetration resistance and liquefaction potential has notbeen established by experiment or field performance. Theeffect of fines is generally assumed to be similar to whatoccurs with the SPT. Since the BPT does not return asample, it is often necessary to estimate the fines contentfrom nearby drill holes or to neglect the potential benefitof fines.
Role of BPT in Exploration
In soils containing gravel, measured SPT or CPT resist-ance may be misleadingly high, and there is potential fordamage to CPT equipment. CPT equipment generallycannot be advanced through thick gravel layers with morethan about 30 percent gravel, depending on the size of the
PENETRATION TESTING
389
gravel and the density of the soil. Results may bemisleading with smaller gravel contents. BPTs are rarelyperformed at the start of an investigation and aregenerally done after SPTs or CPTs have been attemptedand found to be inappropriate because of too much gravel.BPT testing generally should not be relied on as the solebasis for liquefaction evaluation without site-specificverification of the SPT-BPT correlation, corroboration byshear-wave velocities, or other liquefaction resistancepredictors.
A Becker drill can also be used for other tasks such asinstallation of instrumentation or holes for geophysicaltesting. Some soil is compacted around each Becker hole,and the holes may be more prone to deviate from verticalthan holes drilled by conventional methods. The extent ofdensification is not known, so if the holes are to be usedfor geophysical measurements (such as shear-wavevelocity), vary the spacings to evaluate the effect ofcompaction around the hole. Rotary drilling can also bedone inside the double-wall Becker casing to socketinstallations such as inclinometers into bedrock. This ismore expensive than standard Becker testing because ofdelays and the need for a second rig. Becker rigs do nothave rotary drilling capability.
Equipment
Becker drills can be operated with a variety of equipmentconfigurations, but for penetration testing, the standardtesting setup is as follows:
• Drill rig: Becker Drills, Ltd. model AP-1000 rig
• Hammer: Supercharged ICE model 180 dieselhammer
FIELD MANUAL
390
• Casing (rods): 168-mm (6.6-in) OD, double-wall
• Drive bit: Crowd-out plugged bit
The correlation between BPT and SPT data proposed byHarder and Seed relies on the use of the standardequipment configuration. The method proposed by Syrequires that at least the last two conditions be met. Allfour conditions should be met because analyses by theSy method would probably be duplicated by the Harder-Seed method for preliminary calculations and/orverification. Harder and Seed determined that open-bittests were inconsistent and erroneously low relative to theclosed-bit standard. The older model B-180 and HAV-180rigs, equipped with the same hammer, transfer about50 percent more of the energy to the drill string than doAP-1000 rigs. This factor has been tentatively confirmedby energy measurements, but it is preferable to avoid theissue by specifying the use of AP-1000 rigs only.
The diesel hammer does not provide consistent energy tothe drill string. This is because the energy depends oncombustion conditions, which are affected by fuelcondition, air mixture, ambient pressure, drivingresistance, and throttle control. The closed-end diesel pilehammer is equipped with a “bounce chamber” where airis compressed by the rising ram after each blow; the airacts as a spring to push the ram back down for the nextblow (unlike the more common open-ended diesel hammerthat uses gravity alone to return the ram). Measuring thebounce-chamber pressure provides an indirect measure ofcombustion energy.
Harder-Seed Method of BPT Interpretation
The Harder-Seed method of interpreting the BPT usesmeasurements of bounce-chamber pressure as an
PENETRATION TESTING
391
indication of the energy imparted to the rods by eachblow. The bounce-chamber pressure is used to adjust theblow count for the actual combustion condition to thatproduced by a hypothetical constant combustioncondition. The measured bounce-chamber pressure mustbe adjusted at altitudes above 1000 feet (300 m). Thethrottle should be kept wide open and the superchargershould be operated any time data are being recorded.Some drillers prefer to use a smaller throttle opening orno supercharger at the beginning of driving when theblowcounts are smaller, producing high blow counts. Ifthe blowcounts required for analysis are near the surface,the driller should be instructed to keep the throttle wideopen. Instances where full throttle and supercharger arenot used should be recorded in the field notes.
The bounce chamber pressure needs to be monitoredcontinuously during testing. An electronic recordingsystem is available to monitor the bounce chamber. Thepressure gauge provided by the hammer manufacturercan be used to record the data manually, but the gaugereading is sensitive to the length of hose used to connectthe gauge to the hammer.
If a B-180 or HAV-180 rig is used, the data can beadjusted by multiplying by the factor 1.5 to account forthe difference in energy transmitted to the rods. Thisfactor is supported by few data and is consideredapproximate. An AP-1000 rig is preferred.
Testing for the Harder-Seed Method of Interpretation
The Harder-Seed method requires that the number ofblows to drive BPT rods each foot (30 cm) of depth andbounce-chamber pressure during that interval be
FIELD MANUAL
392
recorded. Record the driving conditions and note if thedrillers pull the rods back to loosen them up to reduce thedriving friction.
Sy Method of BPT Interpretation
The method proposed by Sy and Campanella is morerigorous, but more costly and time-consuming. Frictionon the sides of the rods may contribute a substantialportion of the driving resistance. A pile-driving analyzer(PDA) is used to record acceleration and rod force duringindividual blows of the hammer. The PDA also measuresthe driving energy for each blow. The force and accelera-tion histories are then analyzed to separate the resistanceto driving contributed by the bearing capacity of the tipand by the side friction using a computer program calledCAPWAP. PDA operation and CAPWAP analyses areusually done by the contractor.
The PDA measurement eliminates concern about theperformance of the hammer, effects of altitude, or loss ofenergy between the hammer and the rods. At least intheory, analyses should eliminate the effects of varyingamounts of side friction on the blow count. The primarydrawback is the need for PDA measurements and specialanalyses. These substantially increase the cost of thetesting program and slow the process of testing andinterpretation.
The side friction can also be measured directly bypullback tests, where the force required to pull the rodsback a few inches is measured by a load cell. Thismeasurement can be substituted for some of the CAPWAPdata, but it is not recommended that CAPWAP calcu-lations be completely eliminated. CAPWAP data is thestandard from which the method was developed.
PENETRATION TESTING
393
Testing for the Sy Method of Interpretation
The Sy method requires:
Using the PDA, record rod force, acceleration, andtransmitted energy. Record the number of blows for each1-foot (30-cm) interval of BPT driving. Record drivingconditions, and note if the drillers pull the rods back toloosen them up to reduce the driving friction.
Discussion of Methods
For routine investigations of typical alluvial materialsthat do not have dense material overlying them, a PDA isgenerally not necessary, and the Harder-Seed approachshould usually be sufficient. In cases where drill rodfriction is likely to be a problem (penetration throughcompacted fill or deep deposits), the Sy method may bebetter. BPTs can be done after pre-drilling and casing orafter pre-driving the BPT with an open bit throughcompacted fill overlying the tested layers. This reducesthe friction but does not necessarily provide validpredictions of SPT N60 with the Harder-Seed method andmay cause them to be low.
With either method, the field notes should mention anytime that the drillers pull back the rods to reduce thefriction. There is no way to explicitly account for this inthe Harder-Seed method. When using the Sy method, thelocations for calculations should be selected with thepullbacks in mind. Ideally, pullbacks should be done onlybefore and after critical layers are penetrated. This way,the rod friction can be interpolated between analyzedzones with no pullbacks between them to invalidate theinterpolation. Zones to be tested and pullbacks should bediscussed with the drillers prior to each hole. Substantialuncertainties exist both in the correlations to estimate the
FIELD MANUAL
394
equivalent SPT N60 and in the correlations to estimate soilbehavior from the SPT blow count.
Contracting for Becker Drilling Services
In addition to the usual specifications requirements, thework statement for BPT should address:
� Work requirements — explain general workrequirements.
� Purpose and scope — state which portions of the workare for liquefaction assessment and which are forinstrumentation or other purposes.
� Local conditions and geology — describe anticipateddrilling conditions and potential problem areas.
� Equipment and personnel to be furnished by the con-tractor — specify complete details on the equipment:rig model numbers, hammers, superchargers, anddouble wall pipe for rods. See above for details.
� Drilling requirements — list special considerationssuch as staking, calibration requirements, andrefusal criteria.
� Hole completion — describe all hole completion orabandonment procedures.
� Driller’s logs — list requirements for the driller’sreport, including forms to be used.
� Field measurement — specify method of measure-ment of depths for payment.
PENETRATION TESTING
395
In the contract for PDA work, specify the following:
� Purpose and scope of testing.
� Estimated number of feet of driving to be monitoredby PDA.
Cone Penetration Test
Test History
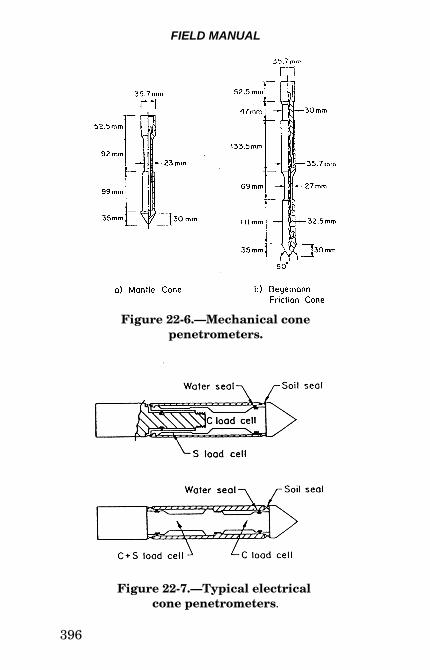
The CPT was introduced in northern Europe in the 1930sto facilitate the design of driven pile foundations in softground. Early devices were mechanical penetrometersthat incrementally measured the cone tip resistance. Inthe 1960s, mechanical cones, known as Begemann frictioncones, were developed. This penetrometer measured boththe tip resistance and the side resistance along a sleeveabove the cone tip (figure 22-6). At about this same time,the CPT was introduced in North America. Usingtechnology from the rapidly advancing electronicsindustry, an electric cone penetrometer was developedthat used electrical transducers to measure the tip andside resistance (figure 22-7). Most of the work today isperformed with electronic cone penetrometers, and themanual does not discuss mechanical systems. The use ofelectronics allows the incorporation of additional sensorsin the cone system, including those for pore water stress,temperature, inclination, acoustic emissions, down-holeseismic, and resistivity/conductivity. In the 1990s,sensors such as laser or other energy-induced fluorescencespectroscopy sensors, membrane interface probes, andeven video cameras have been added to detectgroundwater contamination. Penetrometers capable ofmeasuring dynamic or static pore water pressures arecalled piezometric cones or piezocones (CPTU). CPT
FIELD MANUAL
396
Figure 22-6.—Mechanical conepenetrometers.
Figure 22-7.—Typical electrical cone penetrometers.
PENETRATION TESTING
397
has continued to gain wide acceptance as an effective siteinvestigation tool in North America.
Test Procedure
The procedures for performing CPTs are standardized inReclamation procedures USBR 7020 and 7021 andASTM D-5778 and D-6067. The test is highlyreproducible as opposed to SPTs. Test standards call fora cone tip 35.7 mm in diameter with a 10-square-centimeter (cm2) projected area and an apex angle of60 degrees. The friction sleeve is 150 cm2. Largerdiameter penetrometers of 15-cm2 projected area aresometimes used in very soft soils. Smaller diameterpenetrometers are sometimes used for laboratory studiesof soils.
The cone is advanced at a constant rate of 20 mm persecond. Since the penetration resistance dependssignificantly on the advance rate, the push rate must bechecked in the field. The basic equipment required toadvance any cone penetrometer is a hydraulic jackingsystem. Trucks or vehicles built for CPT are typicallyused; but, in some cases, the hydraulics of rotary drill rigsare used. Semi-portable equipment has been developedfor remote site testing. Rigs can be mounted on trucks,tracked vehicles, trailers, barges, or diving bells,depending on accessability. The capacity of cone rigsvaries from 100 to 200 kilonewtons (kN) (11.2 to22.4 tons). The upper bound is the maximum allowablethrust on the cone penetration rods.
Electronic cone penetrometers have built in load cells tomeasure the tip and side resistance simultaneously(Figure 22-7). Bonded strain gauges typically are used inthe load cells because of their simplicity and ruggedness.The load cells commonly have a range of 90 kN (10 tons)
FIELD MANUAL
398
for tip resistance and 9 kN (1 ton) for side resistance. Theload cell capacity can be varied, depending on thestrength of the soils to be penetrated. The load cells areusually connected by an electric cable passing through thedrill rods to a data acquisition system at the surface.Cordless models are also available that transmit sonicallyand “Memo” cones that store the data internally untilretrieved at the surface. Data are recorded digitally,which greatly enhances the use of CPT results inengineering applications. The data can be sent in daily bye-mail to the engineer and geologist.
Nearly all electronic cone penetrometers are equippedwith a pore pressure element. This pore pressure sensoris typically located between the tip and the friction sleeve.The element can record dynamic water pressure as thecone is being pushed, as well as static water pressuresduring pauses in testing. The typical capacity of thewater pressure transducer is 2.2 kN (500 lb/in2), and theaccuracy of water pressure head is about ± 3 cm (0.1 foot).Cones are almost always equipped with inclinometers.The inclinometers are used to monitor rod bending duringpush and are an essential part of protecting the cone fromdamage. The inclinometer can be monitored by computer,and pushing can be stopped if bending is excessive. Conerods can bend as much as 10 to 20 degrees. If the cone isused to detect bedrock or hard layers, this error can besignificant. The inclinometer is not directional, so theerror from bending can only be estimated.
Advantages and Disadvantages
The CPT has several advantages over other routine inplace tests. The tests are rapid and inexpensive comparedto other geotechnical profiling techniques. Penetrationrates of 3 feet (1 m) per minute are common in many soils.Penetration is stopped only to add sections of push rods,
PENETRATION TESTING
399
except when pore water stress dissipation measurementsare made with the piezocone. With electrical equipment,continuous profiles are recorded and plotted aspenetration progresses, and operator effects areminimized. As discussed below, the test results have beencorrelated to a variety of soil properties. Digital dataacquisition with electrical cones enhances interpretationand provides continuous profiles of soil propertyestimates.
Although the tests are applicable to a wide range of soilconditions, penetration is limited in certain groundconditions. Well-cemented soils, very stiff clays, and soilscontaining gravel and cobbles may cause damage to thepenetrometer tips.
The CPT can be used at nearly any site because portabledevices are available. Portable hydraulic jacking systemscan be used for soft soils in locations not accessible tostandard rigs.
The CPT has several disadvantages. The test does notprovide soil samples. The test is unsuited for well-cemented, very dense and gravelly soils because thesesoils may damage the relatively expensive penetrometertips.
Local experience with this test is less than that with theSPT. Although the test is rapidly gaining acceptance inthe United States, some drilling contractors do not havethe equipment or experience necessary to perform thetest. The equipment is expensive and may not beavailable in some locations. Maintaining the electronicsfor the CPT and CPTU equipment may be a problem insome test locations.
FIELD MANUAL
400
Data Obtainable
The CPT is primarily a logging tool and provides some ofthe most detailed stratigraphic information of anypenetration test. With electronic cones, data are typicallyrecorded at 5-cm-depth intervals, but data can be recordedat closer spacings. Layers as thin as 10 mm can bedetected using the CPT, but the tip resistance can beinfluenced by softer or harder material in the layer belowthe cone. Full tip resistance of an equivalent thicker layermay not be achieved. The penetration resistance of thesoil is a function of the drainage conditions duringpenetration. In sands that are drained, the penetrationresistance is high, but in clays that are undrained, thepenetration resistance is low.
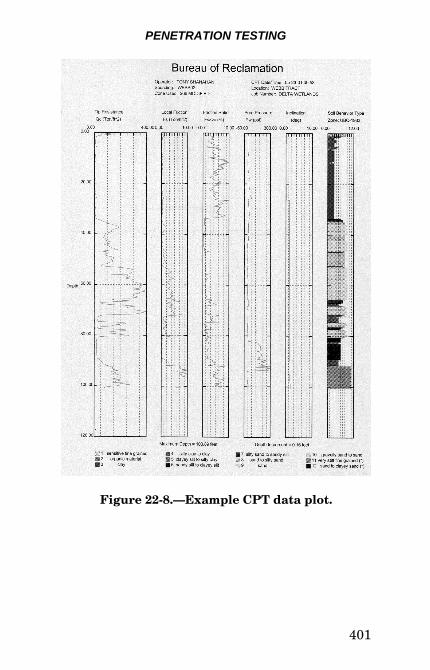
A typical CPT data plot is shown in figure 22-8.CPT plots should show all recorded data (i.e., TipResistance, qc , Sleeve Resistance, fs , Pore pressure, u,and for this example, cone inclination and temperature).CPT data should be plotted to consistent scales on a givenproject so that the plots can be more easily evaluated.
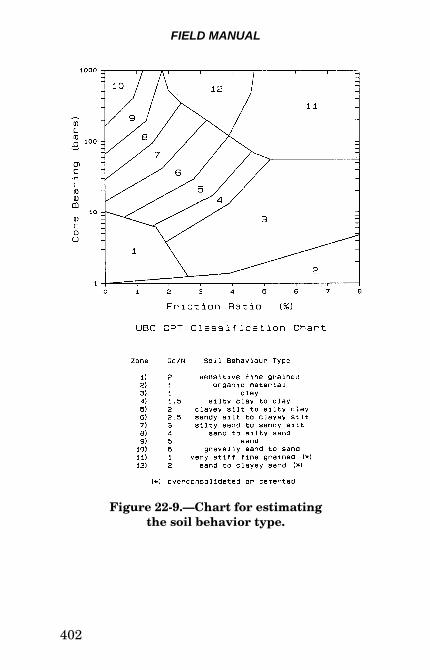
The CPT does not obtain a soil sample. However, the soilsmay be classified by comparing the tip resistance to theratio of tip to sleeve resistance which is known as thefriction ratio, Fr . Friction ratio should also be shown onthe summary plots. Figures 22-9 and 10 show commonlyused relationships to estimate the “soil behavior type.”Clay soils have low tip resistance and high friction ratio,while sands have high tip resistance and low frictionratio. Mixed soils fall in zones 4 through 7. There arealso classification methods that incorporate the dynamicpore water pressure generation. The CPT cannot exactlyclassify soil according to the Unified Soil ClassificationSystem. Experience at many sites shows that soils giveconsistent signatures; and even though the soil behavior
PENETRATION TESTING
401
Figure 22-8.—Example CPT data plot.
FIELD MANUAL
402
Figure 22-9.—Chart for estimatingthe soil behavior type.
PENETRATION TESTING
403
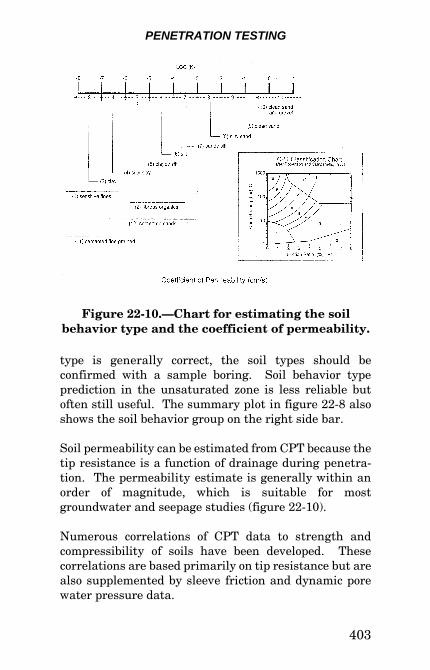
Figure 22-10.—Chart for estimating the soilbehavior type and the coefficient of permeability.
type is generally correct, the soil types should beconfirmed with a sample boring. Soil behavior typeprediction in the unsaturated zone is less reliable butoften still useful. The summary plot in figure 22-8 alsoshows the soil behavior group on the right side bar.
Soil permeability can be estimated from CPT because thetip resistance is a function of drainage during penetra-tion. The permeability estimate is generally within anorder of magnitude, which is suitable for mostgroundwater and seepage studies (figure 22-10).
Numerous correlations of CPT data to strength andcompressibility of soils have been developed. Thesecorrelations are based primarily on tip resistance but arealso supplemented by sleeve friction and dynamic porewater pressure data.
FIELD MANUAL
404
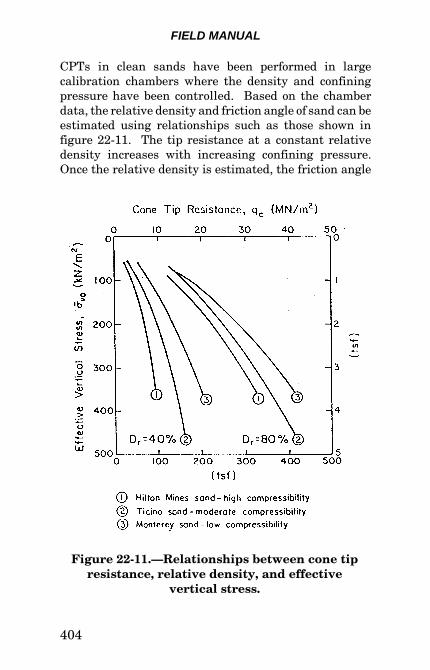
Figure 22-11.—Relationships between cone tipresistance, relative density, and effective
vertical stress.
CPTs in clean sands have been performed in largecalibration chambers where the density and confiningpressure have been controlled. Based on the chamberdata, the relative density and friction angle of sand can beestimated using relationships such as those shown infigure 22-11. The tip resistance at a constant relativedensity increases with increasing confining pressure.Once the relative density is estimated, the friction angle
PENETRATION TESTING
405
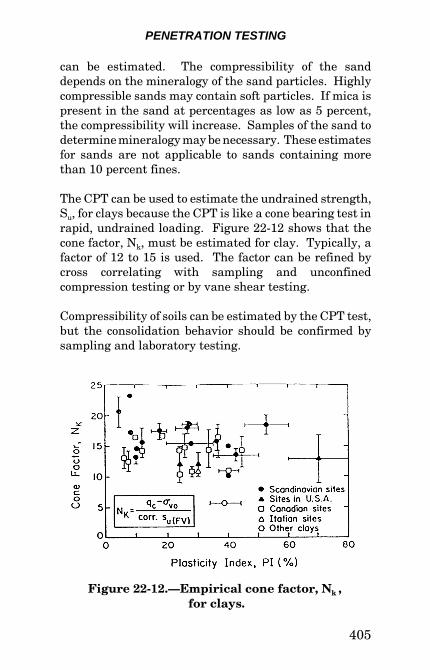
Figure 22-12.—Empirical cone factor, Nk , for clays.
can be estimated. The compressibility of the sanddepends on the mineralogy of the sand particles. Highlycompressible sands may contain soft particles. If mica ispresent in the sand at percentages as low as 5 percent,the compressibility will increase. Samples of the sand todetermine mineralogy may be necessary. These estimatesfor sands are not applicable to sands containing morethan 10 percent fines.
The CPT can be used to estimate the undrained strength,Su, for clays because the CPT is like a cone bearing test inrapid, undrained loading. Figure 22-12 shows that thecone factor, Nk, must be estimated for clay. Typically, afactor of 12 to 15 is used. The factor can be refined bycross correlating with sampling and unconfinedcompression testing or by vane shear testing.
Compressibility of soils can be estimated by the CPT test,but the consolidation behavior should be confirmed bysampling and laboratory testing.
FIELD MANUAL
406
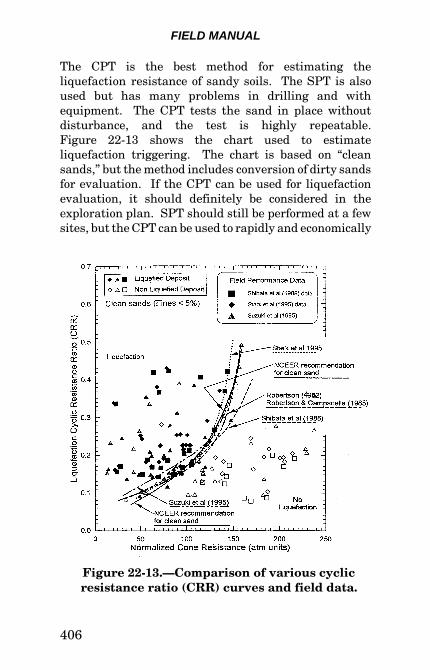
Figure 22-13.—Comparison of various cyclicresistance ratio (CRR) curves and field data.
The CPT is the best method for estimating theliquefaction resistance of sandy soils. The SPT is alsoused but has many problems in drilling and withequipment. The CPT tests the sand in place withoutdisturbance, and the test is highly repeatable.Figure 22-13 shows the chart used to estimateliquefaction triggering. The chart is based on “cleansands,” but the method includes conversion of dirty sandsfor evaluation. If the CPT can be used for liquefactionevaluation, it should definitely be considered in theexploration plan. SPT should still be performed at a fewsites, but the CPT can be used to rapidly and economically
PENETRATION TESTING
407
map the extent of liquefiable strata. CPT is also usedextensively for evaluating ground improvement ofliquefiable deposits.
The cone is like a miniature pile and is used forevaluating pile capacity. CPT tests are often performedat the abutments of bridges for pile design. Numerousmethods exist for estimating pile capacity.
Economics
Equipment costs for CPT range from low for mechanicaldevices to high for piezocones, and generally twotechnicians are required to perform CPTs. Thesepersonnel should have a working knowledge of theequipment, but highly trained technicians are notrequired. The equipment mobilization is similar to thatrequired for the SPT, but portable devices can be used forremote locations. Unit costs are difficult to estimatebecause the tests provide continuous or nearly continuousmeasurements. Rig costs are comparable to costs for theSPT, with an added capital cost to convert a conventionaldrilling rig for CPT testing. However, 200 feet (60 m) ofpenetration per day is typical; and in some cases,maximum production of 400 feet (120 m) per day ispossible. This cost is the lowest of any geotechnicaldrilling, sampling, and logging method.
Bibliography
Harder, L.F., Application of the Becker Penetration Testfor Evaluating the Liquefaction Potential of Gravelly Soils,NCEER Workshop on Evaluation of LiquefactionResistance, held in Salt Lake City, Utah, 1997.
FIELD MANUAL
408
Harder, L.F. and Seed, H.B., Determination of PenetrationResistance for Coarse-Grained Soils Using the BeckerHammer Drill, Report No. UC/EERC-86-06, NTIS PB87-124210, Earthquake Engineering Research Center,College of Engineering, University of California, Berkeley,California, May 1986.
Peck, Ralph B., Foundation Engineering, Second Edition,John Wiley & Sons, 1973.
Rausche, F., Goble, G.G., and Likins, Jr., G.E., DynamicDetermination of Pile Capacity, Journal of GeotechnicalEngineering, ASCE, Vol. 111, No. 3, pp. 367-383, 1985.
Sy, A. and Campanella, R.G., Becker and StandardPenetration Tests (BPT-SPT) Correlations withConsideration of Casing Friction, Canadian GeotechnicalJournal, 31(3): 343-356, 1994.
Sy, A., Campanella, R.G., and Stewart, R.A., BPT-SPTCorrelations for Evaluation of Liquefaction Resistance ofGravelly Soils, Static and Dynamic Properties of GravellySoils, ASCE Special Publication 56, M.D. Evans and R.J.Fragazy, Editors, American Society of Civil Engineers,New York, New York, 1995.