Chapter13 designing forms and reports
21
Copyright 2002 Prentice-Hall, Inc. Modern Systems Analysis and Design Third Edition Jeffrey A. Hoffer Joey F. George Joseph S. Valacich Chapter 13 Designing Forms and Reports 13.1
-
Upload
dhani-ahmad -
Category
Software
-
view
146 -
download
3
Transcript of Chapter13 designing forms and reports
Copyright 2002 Prentice-Hall, Inc.
Modern Systems Analysisand Design
Third Edition
Jeffrey A. Hoffer Joey F. George
Joseph S. Valacich
Chapter 13Designing Forms and Reports
13.1
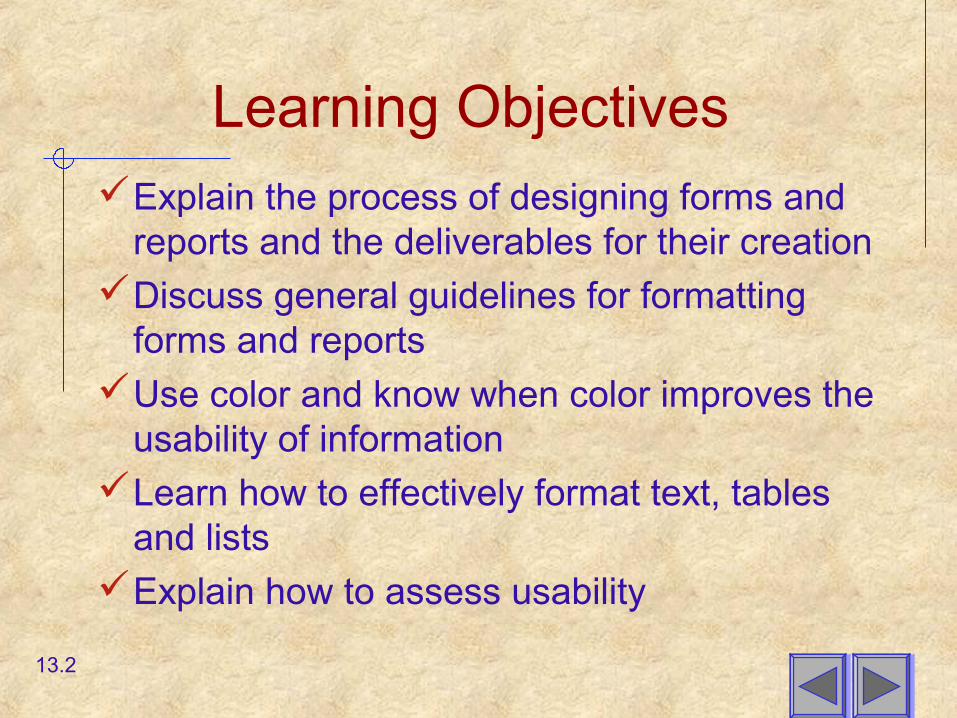
Learning ObjectivesExplain the process of designing forms and
reports and the deliverables for their creationDiscuss general guidelines for formatting
forms and reportsUse color and know when color improves the
usability of informationLearn how to effectively format text, tables
and listsExplain how to assess usability
13.2
Learning Objectives
Explain interface design guidelines unique to the design of Internet-based electronic commerce systems
13.3
Designing Forms and Reports System inputs and outputs are produced at the end of the analysis phase
Precise appearance was not defined during this phase
Forms and reports are integrally related to DFD and E-R diagrams
13.4
Designing Forms and ReportsKey Concepts
Form A business document that contains some predefined data
and may include some areas where additional data are to be filled in
An instance of a form is typically based on one database record
Report A business document that contains only predefined data A passive document for reading or viewing data Typically contains data from many database records or
transactions
13.5
The Process of Designing Forms and Reports
User-focused activity
Follows a prototyping approach
Requirements determination Who will use the form or report? What is the purpose of the form or report? When is the report needed or used? Where does the form or report need to be
delivered and used? How many people need to use or view the form or
report?
13.6
The Process of Designing Forms and Reports
Prototyping Initial prototype is designed from
requirements Users review prototype design and either
accept the design or request changes If changes are requested, the construction-
evaluation-refinement cycle is repeated until the design is accepted
13.7
Deliverables and Outcome
Design specifications are major deliverable and contain three sections
1. Narrative overview
2. Sample design
3. Testing and usability assessment
13.8
General Formatting Guidelines for Forms and Reports
Highlighting Use sparingly to draw user to or away from
certain information Blinking and audible tones should only be
used to highlight critical information requiring user’s immediate attention
Methods should be consistently selected and used based upon level of importance of emphasized information
13.9
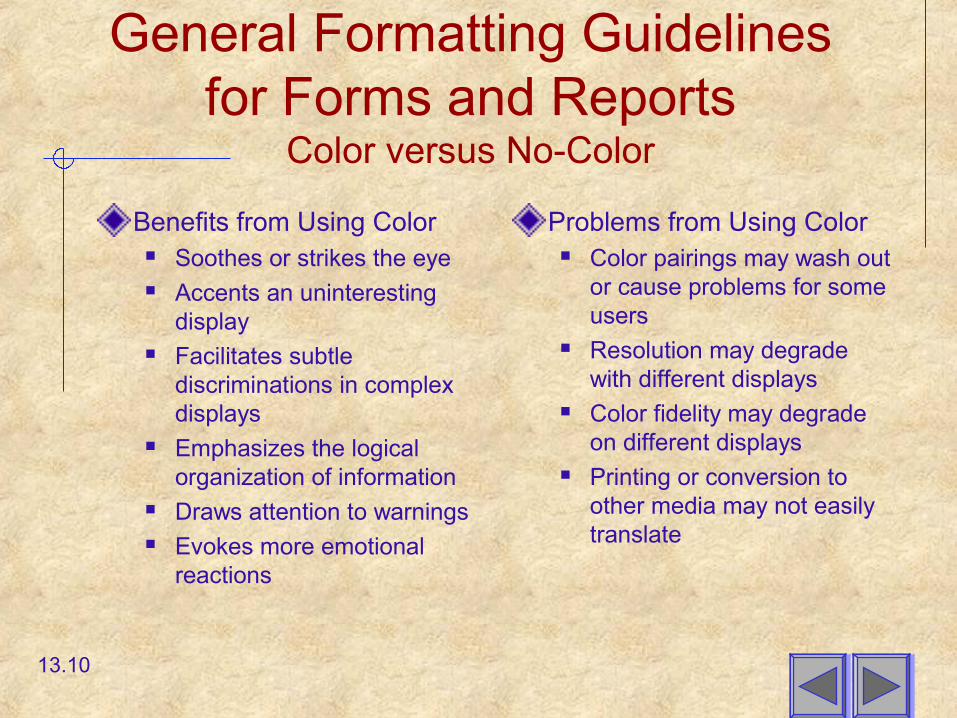
General Formatting Guidelines for Forms and Reports
Color versus No-Color
Benefits from Using Color Soothes or strikes the eye Accents an uninteresting
display Facilitates subtle
discriminations in complex displays
Emphasizes the logical organization of information
Draws attention to warnings Evokes more emotional
reactions
Problems from Using Color Color pairings may wash out
or cause problems for some users
Resolution may degrade with different displays
Color fidelity may degrade on different displays
Printing or conversion to other media may not easily translate
13.10
General Formatting Guidelines for Forms and Reports
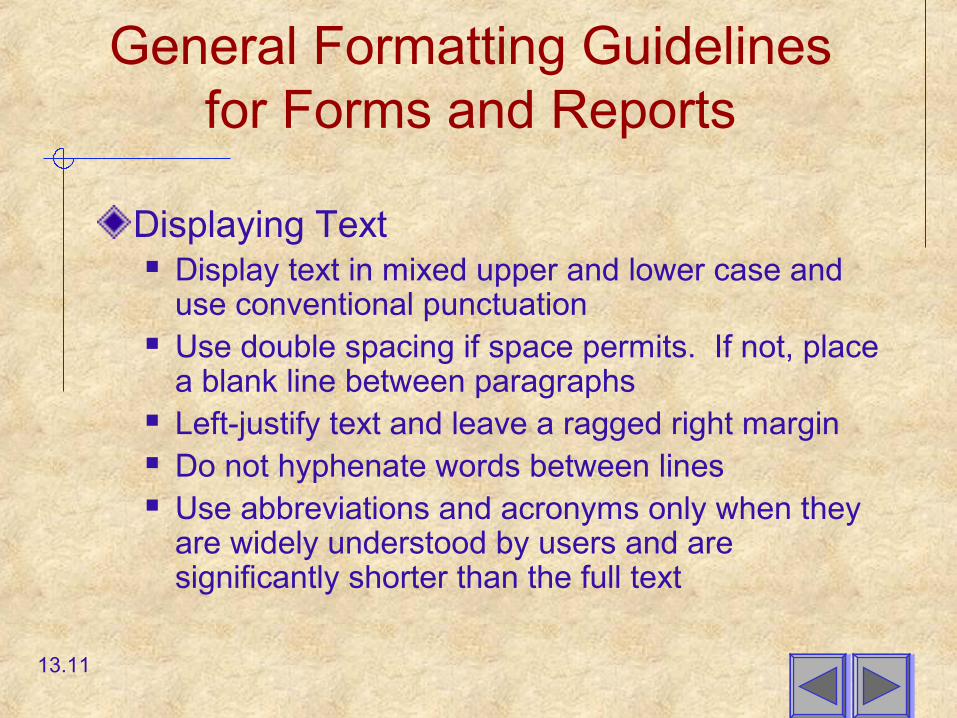
Displaying Text Display text in mixed upper and lower case and
use conventional punctuation Use double spacing if space permits. If not, place
a blank line between paragraphs Left-justify text and leave a ragged right margin Do not hyphenate words between lines Use abbreviations and acronyms only when they
are widely understood by users and are significantly shorter than the full text
13.11
General Formatting Guidelines for Forms and Reports
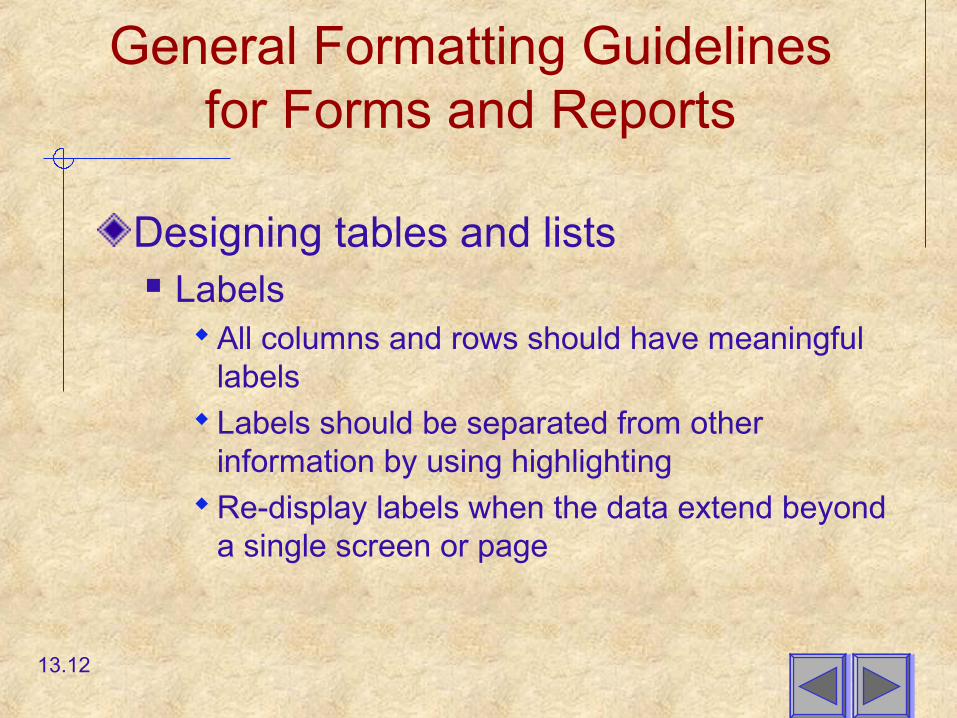
Designing tables and lists Labels
All columns and rows should have meaningful labels
Labels should be separated from other information by using highlighting
Re-display labels when the data extend beyond a single screen or page
13.12
General Formatting Guidelines for Forms and Reports
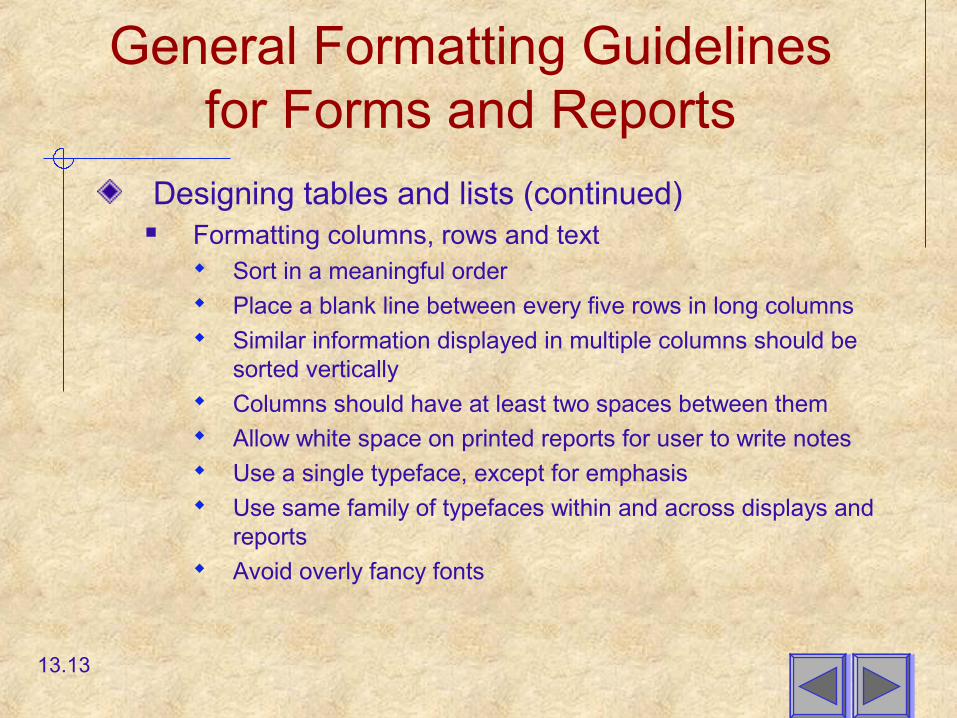
Designing tables and lists (continued) Formatting columns, rows and text
Sort in a meaningful order Place a blank line between every five rows in long columns Similar information displayed in multiple columns should be
sorted vertically Columns should have at least two spaces between them Allow white space on printed reports for user to write notes Use a single typeface, except for emphasis Use same family of typefaces within and across displays and
reports Avoid overly fancy fonts
13.13
General Formatting Guidelines for Forms and Reports
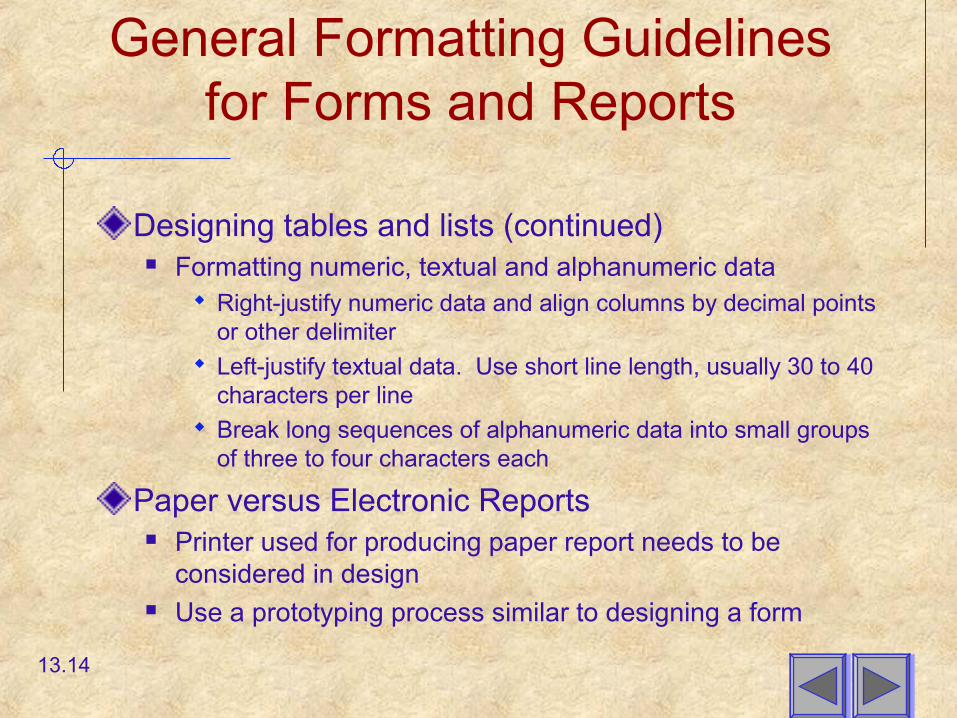
Designing tables and lists (continued) Formatting numeric, textual and alphanumeric data
Right-justify numeric data and align columns by decimal points or other delimiter
Left-justify textual data. Use short line length, usually 30 to 40 characters per line
Break long sequences of alphanumeric data into small groups of three to four characters each
Paper versus Electronic Reports Printer used for producing paper report needs to be
considered in design Use a prototyping process similar to designing a form
13.14
Assessing Usability
Overall evaluation of how a system performs in supporting a particular user for a particular task
Three characteristics1. Speed
2. Accuracy
3. Satisfaction
13.15
Assessing Usability
Success Factors Consistency
Design elements all appear in the same place on all forms and reports
Table 13-8 presents usability factors and associated guidelines
Context Users Tasks Environment Table 13-9 presents several characteristics that may
influence the usability of a design
13.16
Assessing Usability
Measures of Usability Considerations
Time to learn Speed of performance Rate of errors Retention over time Subjective satisfaction
Collection methods Observation Interviews Keystroke capturing Questionnaires
13.17
Electronic Commerce Application:Designing the Human Interface at Pine
Valley Furniture
General Guidelines Table 13-10 provides a summary of errors
that are detrimental to the user’s experience
13.18
Designing Forms and Reports at Pine Valley Furniture
Lightweight Graphics The use of small images to allow a Web page to
be displayed more quickly
Forms and Data Integrity All forms that record information should be clearly
labeled and provide room for input Clear examples of input should be provided to
reduce data errors Site must clearly designate which fields are
required, which are optional and which have a range of values
13.19
Designing Forms and Reports at Pine Valley Furniture
Template-based HTML Templates to display and process common
attributes of higher-level, more abstract items
Creates an interface that is very easy to maintain
13.20
SummaryDesigning Forms and Reports
General guidelines for designing forms and reports
Formatting text, tables and lists
Assessing Usability
Interface design guidelines unique to the Internet
13.21