CHAPTER VI CONSUMERS’ PERCEPTIONS -...
51
232 CHAPTER VI CONSUMERS’ PERCEPTIONS The world of marketing is an ever changing one. This is not simply because the consumer’s desires are changing but because of the entry of new competitors with novel product features. In a competitive environment there is nothing more crucial to success than keeping the customers satisfied and engaged. Creation of a satisfied customer is the goal of marketing. Achievement of this goal to a large extent depends on how quickly and efficiently the producer is able to gather quality consumer insights and perceptions. Perception means how one views or perceives matters under the influence of one’s past experience and personal opinion. By understanding the perception of his consumers, the producer can know how the consumers view his product or service. Marketers make use of these perceptions to formulate suitable marketing strategies. They use a perceptual map wherein they find out the attributes or characteristics that the consumers associate with the product and then they make the product to suit the consumers’ interests. The market of Kitchen appliances in Kerala is also rapidly changing where more and more companies are entering with product differentiation strategies. As a result, the perceptions of the consumers in the industry are also changing. So it is important from the part of manufacturers of kitchen appliances to know what the consumer really expects from them and what is actually delivered to him. This chapter tries to analyze the perception of the consumers of kitchen appliances with regard to their brand choice, nature of purchase, performance of their products,
Transcript of CHAPTER VI CONSUMERS’ PERCEPTIONS -...

232
CHAPTER VI
CONSUMERS’ PERCEPTIONS
The world of marketing is an ever changing one. This is not simply because
the consumer’s desires are changing but because of the entry of new competitors
with novel product features. In a competitive environment there is nothing more
crucial to success than keeping the customers satisfied and engaged. Creation of a
satisfied customer is the goal of marketing. Achievement of this goal to a large extent
depends on how quickly and efficiently the producer is able to gather quality
consumer insights and perceptions.
Perception means how one views or perceives matters under the influence of
one’s past experience and personal opinion. By understanding the perception of his
consumers, the producer can know how the consumers view his product or service.
Marketers make use of these perceptions to formulate suitable marketing strategies.
They use a perceptual map wherein they find out the attributes or characteristics that
the consumers associate with the product and then they make the product to suit the
consumers’ interests.
The market of Kitchen appliances in Kerala is also rapidly changing where
more and more companies are entering with product differentiation strategies. As a
result, the perceptions of the consumers in the industry are also changing. So it is
important from the part of manufacturers of kitchen appliances to know what the
consumer really expects from them and what is actually delivered to him. This
chapter tries to analyze the perception of the consumers of kitchen appliances with
regard to their brand choice, nature of purchase, performance of their products,

233
determinants of their purchase decision, responsibility of retailer in providing after
sales service, quality of service offered by the manufacturer, incentives offered for
referrals and the type of incentives offered. It also makes an effort to identify how
the residential location, which might be a proxy of the demographic profile of the
customers, affects the perception of consumers of kitchen appliances industry.
6.1 Location of Consumers
This part of analysis is made on the basis of the area of residence of
consumers. For every study in the context of marketing we should have consumers
from different geographical area in order to get their outlook and attitude in general.
So for this study the State is classified into three segments, taking into consideration
the various aspects, as Urban, Semi Urban and Rural. Consumers residing in a
particular area will have difference in education, culture and social outlook from
those residing in other areas. Therefore to get a balanced result, it is required to select
consumers from all segments. Location wise breakup of the sample is given in Table
T6.1
Table T6.1 Location Wise Distribution of the Consumers
Location No of Respondents Percent
Urban 240 40.0
Semi Urban 200 33.3
Rural 160 26.7
Total 600 100.0

234
Figure F6.1 Location Wise Distribution of the Consumers
Among the selected consumers 40 percent is from the urban area, 33.3
percent from semi urban area and the remaining 26.7 percent reside at rural area.
6.2 Ownership of Kitchen Appliances and Residential Location of Consumers
It is very important to know which of the Kitchen appliances specified in the
study are owned by the respondents. It will indirectly reveal the order of necessity
and order of preference by the consumers. An appliance which is considered to be a
necessity by a consumer in an urban area might be a luxury in the rural area. The
respondents residing in different areas have difference in patterns of ownership of
Kitchen appliances because of the diversity in their needs, culture, customs and
usages, purchasing power, attitudes and outlooks. This can be analyzed from the
possession of various appliances by the consumers in different areas. Table T6.2
reveals the uniformity and diversity of people residing in urban, semi urban and rural
areas with respect to their ownership pattern of kitchen appliances.
Urban40%
Semi Urban33%
Rural27%

235
Table T 6.2 Location Wise Distribution of Consumers of Kitchen Appliances
Types of Kitchen Appliances
Area of residence Total
Urban Semi Urban Rural
No. % No. % No. % No. %
All 200 83.3 120 60 80 50 400 66.7
All except Refrigerator & Grinder
Nil - Nil - 80 50 80 13.0
All except Grinder
40 16.7 80 40 Nil - 120 20.0
Total 240 100 200 100 160 100 600 100
Pearson Chi-Square Value 54.000 P Value - 0.001* *Significant at 1 per cent level
Figure F6.2 Location Wise Distribution of Consumers of Kitchen Appliances
Analysis shows that 66.7percent of the consumers have all the Kitchen
appliances specified and 13.3 percent have everything except Refrigerator and
Grinder and 20 percent do not use Grinder among the selected product portfolio.
Thus majority of the consumers have all types of kitchen appliances under study.
0
10
20
30
40
50
60
70
80
90
Urban Semi Urban Rural
All
All except Refrigerator & Grinder
All except Grinder
236
83 percentage of the urban population has the entire categorized home
appliances whereas only 60 percent of the semi urban and 50 percent of the rural
households have only selected category of appliances. This shows that the urban
community has found more utility in using the kitchen appliances than the rural
community. This can be related to the pattern of their lifestyle.
Non- parametric test- Pearson’s chi-square test of independence is applied to
find out whether this type of difference exists in the population from which the
sample selected is statistically significant or not. The test result shows that location
wise diversity in the patterns of ownership of the appliances is significant even at 1
per cent level.
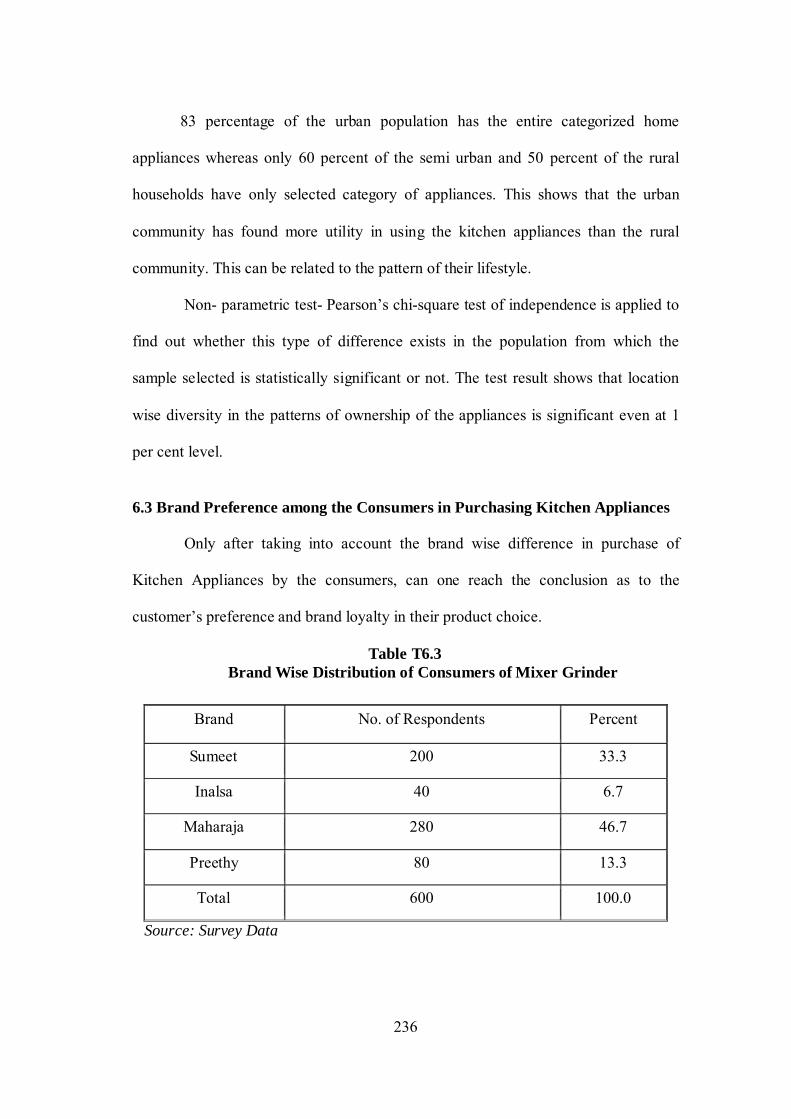
6.3 Brand Preference among the Consumers in Purchasing Kitchen Appliances
Only after taking into account the brand wise difference in purchase of
Kitchen Appliances by the consumers, can one reach the conclusion as to the
customer’s preference and brand loyalty in their product choice.
Table T6.3 Brand Wise Distribution of Consumers of Mixer Grinder
Brand No. of Respondents Percent
Sumeet 200 33.3
Inalsa 40 6.7
Maharaja 280 46.7
Preethy 80 13.3
Total 600 100.0
Source: Survey Data

237
Figure F6.3 Brand Wise Distribution of Consumers of Mixer Grinder
It is clear from Table T6.3 that majority of the consumers of Mixer Grinder
are using famous brands established in the market; 46.7percent of them are using
Maharaja brand, 33.3 percent are using Sumeet brand and the balance 13.3 percent
and 6.7 percent are shared by Preethy and Inalsa respectively.
Table T6.4 Location Wise Distribution of the Consumers in Choosing
Brand of Mixer Grinder
Brand of Mixer Grinder
Area of residence Total
Urban Semi Urban Rural
No. % No. % No. % No. %
Sumeet 160 66.6 40 20 Nil - 200 33.3
Inalsa 40 16.7 Nil - Nil - 40 6.7
Maharaja Nil - 120 60 160 100 280 46.7
Preethy 40 16.7 40 20 Nil - 80 13.3
Total 240 100 200 100 160 100 600 100
Pearson Chi-Square Value 109.267 P value = <0.001* Source: Survey Data *Significant at 1 per cent level
Sumeet33%
Inalsa7%
Maharaja47%
Preethy13%

238
66.6 percent of urban population has Sumeet brand of Mixer Grinder, while
60 percent of semi urban and 100 percent rural population has bought Maharaja
brand. This shows that Maharaja Brand is mainly preferred by consumers in semi
urban and rural areas while Sumeet is perceived better in quality by the urban
segment. (Table T6.4). Such differences in brand preferences by the consumers from
different geographic segments of mixer grinder market were found statistically
significant at 1 per cent level.
6.4 Brand Wise Distribution of Consumers of Grinder
After taking into consideration the various branded and non branded Grinders
used by the consumers, analysis will be possible to reach the conclusions regarding
the consumers preference and brand loyalty
Table T6.5
Brand Wise Distribution of Consumers of Grinder
Source: Survey Data
Brand of Grinder used No of respondents Percent
Laxmi 155 38.75
Inalsa 40 10
Maharaja 90 22.5
Butterfly 115 28.75
Total 400 100

239
39%
10%22%
29%
Laxmi Inalsa Maharaja Butterfly
Figure F6.4 Brand Wise Distribution of Consumers of Grinder
Table T6.5 reveals that Laxmi and Butterfly are the most popular brands of
Grinders among the selected brands. 38.75 percent and 28.75 percent of consumers
are using Laxmi and Butterfly brand of Grinders respectively. Inalsa is the least
popular product of this kind. So according to the analysis consumers are fond of
mainly popular and established brands in the market.
Table T6.6 Location Wise Distribution of Consumers in Choosing Brand of Grinder
Brand of Grinder
Area of residence Total
Urban Semi Urban Rural No. % No. % No. % No. %
Laxmi 80 40 40 33 35 44 155 39
Inalsa 25 13 15 13 - - 40 10
Maharaja 45 22 35 29 10 12 90 22
Butterfly 50 25 30 25 35 44 115 29
Total 200 100 120 100 80 100 400 100
Pearson Chi-Square Value 12.904 P value = 0.012* Source: Survey Data *Significant at 5 per cent level

240
40 percent of urban population, 33 percent of semi urban and 44 percent of
rural population have got Laxmi Brand of Grinders. Another 25 percent each of
urban and semi urban and 44 percent of rural population has Butterfly brand.
Maharaja is another popular brand with their presence in all segments. They have 22
percent in urban, 29 percent in semi urban and 12 percent in rural area. Inalsa brand
has presence only in urban and semi urban area. Market wise differences in brand
preferences of consumers of Grinder market in Kerala were statistically proved by
the inferential analysis at 5 percent level of significance.
6.5 Brand Wise Distribution of Refrigerator Used by Consumers
After taking into consideration the various branded and non branded
Refrigerators used by the consumers, analysis will be possible to reach the
conclusions regarding the consumer’s preference and brand loyalty.
Table T 6.7 Brand wise Distribution of Consumers of Refrigerator
Brand of Refrigerator No of respondents Percent
Godrej 120 23
BPL 80 15.5
LG 120 23
Samsung 80 15.5
Whirlpool 120 23
Total 520 100
Source: Survey Data

241
23%
15%
23%
16%
23%
Godrej BPL LG Samsung Whirlpool
Figure F6.5 Brand wise Distribution of Consumers of Refrigerator
It is evident from Table T6.7 that the consumers of Refrigerator look for a
famous brand with long year’s presence in the market while making their purchase
decision. When popular brand in white goods industry- Godrej, LG and whirlpool
have consumers at equal rate (23 percent) in the segment of Refrigerator, other
competitors in the same industry- BPL and Samsung have a lesser percentage of 15.5
percent each.
Table T6.8 Location Wise Distribution of Consumers in Choosing Brand of Refrigerators
Brand of Refrigerator
Area of residence Total
Urban Semi Urban Rural
No. % No. % No. % No. %
Godrej 80 33.3 40 20 - - 120 23
BPL 80 33.3 - - - - 80 15.5 LG 40 16.7 30 15 50 62.5 120 23
SAMSUNG 40 16.7 40 20 30 37.5 80 15.5 Whirlpool - - 90 45 - - 120 23
Total 240 100 200 100 80 100 520 100
Pearson Chi-Square Value 12.353 P value = 0.015 Source: Survey Data

242
Two third of the urban market for Refrigerator is equally shared by the
traditional Indian brands—Godrej and BPL. When Whirlpool enjoys 45 percent of
semi urban market; 62.5 percent of the rural demand is met by LG. When Samsung
and LG have made their presence in all segments of market, Whirlpool is pushing
their product mainly in semi urban areas. The results of the chi square analysis
confirmed the statistical validity of the hypothesis that there is a significant
difference among the customers of refrigerator across the market in choosing their
brand of refrigerators.
6.6 Brand Wise Distribution of Consumers of Gas Stove
After taking into consideration the various branded and non branded Gas
Stoves used by the consumers, analysis will be possible to reach the conclusions
regarding the consumer’s preference and brand loyalty
Table T 6.9 Brand Wise Distribution of Consumers of Gas Stove
Brand of Gas Stove No of respondents Percent
Butterfly 370 61.7
Inalsa 160 26.7
Bajaj 70 11.6
Total 600 100
Source: Survey Data

243
Figure F6.6 Brand Wise Distribution of Consumers of Gas Stove
Table T6.9 reveals that 61.7 percent of the consumers own Butterfly brand
which is considered to be a synonym of Gas Stove by the housemaids in Kerala. The
remaining 38.3 percent of the market is shared by all other brands together.
Table T 6.10
Location Wise Distribution of Consumers in Choosing Brand of Gas Stove
Brand of
Gas Stove
Area of residence Total
Urban Semi Urban Rural
No. % No. % No. % No. %
Butterfly 160 66.7 120 60 90 56 370 61.7
Inalsa 80 33.3 40 20 40 25 160 26.7
Bajaj Nil - 40 20 30 19 70 11.6
Total 240 100 200 100 160 100 600 100
Pearson Chi-Square Value 3.191 P value = 0.203
Source: Survey Data
Butterfly62%
Inalsa27%
Bajaj11%

244
It is evident from Table T6.10 that the brand “Butterfly” has the major market
share in the gas stove segment of Kerala kitchen appliances industry. 66.7 percent of
the urban population, 60 percent of the semi urban and 56 percent of the rural
population have got Butterfly brand of Gas stoves. This shows that majority of the
consumers in all the three market segments prefer the most popular brand of gas
stove, Butterfly. Other brands like Inalsa and Bajaj have relatively very few
demands. The results of the hypothesis test found no statistically significant
difference among the customers from various market segments in choosing the brand
of Gas stove they use in their kitchen.
Table T6.11 Brand Wise Distribution of Consumers of Pressure Cooker
Name of brand No of respondents Percent
Prestige 240 40.0
Hawkins 160 26.7
Butterfly 200 33.3
Total 600 100 Source: Survey Data
Figure F 6.7
Brand Wise Distribution of Consumers of Pressure Cooker
Prestige40%
Hawkins27%
Butterfly33%

245
All the established brands of Pressure Cooker have been influenced the
buying decision of consumers. Table T6.11 shows 40 percent of consumers prefer
Prestige, 33.3 percent opted Butterfly and 26.7 percent selected Hawkins. Thus it can
be inferred that consumers of pressure cooker have affinity to those brands which
have been in the market for a long period of time.
Table T6.12 Location Wise Distribution of Consumers in Choosing Brand of Pressure
Cooker
Brand of Pressure Cooker
Area of residence Total
Urban Semi Urban Rural
No. % No. % No. % No. %
Prestige 130 54 70 35 40 25 240 40
Hawkins 40 17 60 30 60 37.5 160 26.7
Butterfly 70 29 70 35 60 37.5 200 33.3
Total 240 100 200 100 160 100 600 100
Pearson Chi-Square Value 41.417 P value = 0.001*
Source: Survey Data *Significant at 1 per cent level
Table T6.12 gives the brand preference of consumers in purchasing their
Pressure Cookers. 54 percent of urban population 35 percent of semi urban and 25
percent of rural population has Prestige brand of Pressure cooker. Butterfly and
Hawkins brands have almost equal presence in semi urban and rural segment. The
chi square analysis also found statistically significant difference in the brand choice
of consumers of pressure cooker from various geographical segments of the state of
Kerala at 1 per cent level of significance. Such a result is an indirect indication of the
popularity of different brands in the different ways in varied parts of the state.

246
6.7 Reason for Choosing the Brand of Kitchen Appliances
While choosing a particular brand of product by a consumer, his decision
might have been influenced by so many factors. These factors may include Brand
name, Lesser Price, and Better after sale service etc. Only after getting proper insight
into the reasons or factors which are influencing the decision of a customer, can one
make possible improvements in the right direction in future.
Table T 6.13 Reason for Choosing the Brand of Kitchen Appliances
Reasons Mixer
Grinder Grinder Refrigerator Gas Stove Pressure Cooker Total
Because of brand name
360 (60) 80 (20) 160 (30.7) 360 (60) 280 (47) 1240 (46)
Because of better after service
40 (6.7) 60 (15) 80 (15.3) 120 (20) 50 (8) 350 (13)
Lesser price 80 (13.3) 20 (5) - - 30 (5) 130 (5)
Because of brand name & better after service
120 (20) 240 (60) 280 (54) 120 (20) 240 (40) 1000 (36)
Total 600(100) 400
(100) 520 (100)
600(100) 600
(100) 2720(100)
Source: Survey Data Figures given in parentheses indicates percent
Analysis of Table T6.13 unfolds the facts on major factors influencing the
brand choice of consumers in their purchase decisions. These facts definitely help the
manufacturers of kitchen appliances under study to adjust their market mix
accordingly.

247
60 percent of the respondents choose the Mixer Grinder because of
established brand name and 20 percent consider the after sales service also along
with the brand name while 13.3 percent look for cheaper price and 6.7 percent
consider only the after sales service while selecting their product.
All of the consumers who have Grinder opined brand name as the major
factor that persuade them to choose a particular brand of Grinder. A lion share of the
group (i.e. 60 percent) also consider the after sale service along with brand name
while making their purchase decision.
54 percent of the consumers make choice of their Refrigerator on the basis of
brand name as well as after sales support, while another 30.7 percent by taking into
account the brand name alone. The rest 15.3 percent consider only good after sales
service as the most important decisive factor of their brand selection process.
Among the consumers of Gas Stove 60 percent strongly look for the brand
name which has established a presence in almost all kitchens. 20 percent look only
for the after sales service while choosing their product whereas the rest 20 percent
look for the brand as well as better after sales service.
47 percent of the users of Pressure Cooker strongly look for the Brand name
which has established its presence in almost all kitchens. 40 percent give importance
to better after sales service in addition to the reputation of the brand. Only a nominal
fraction of the population is attracted to a particular brand of Pressure Cooker
because of lesser price and exchange offer given by the manufacturers.
Thus almost all consumers of different product segments believe brand name
and after sales service to be the most important factors for evaluating the quality of
the product they intend to buy. However, some of the consumers from the segment of

248
Pressure Cooker consider the price factor also while making the final decision on
their purchase.
6.8 Reason for Choosing a Particular Brand of Kitchen Appliance -- Location
Wise Analysis
Since there is a difference in the socio-economic profile of the consumers in
different areas of the state, the factors which influence brand choice of their product
may also be different. So it is necessary to analyze the major determinants of brand
choice by the consumers on the basis of their area of residence so as to reach a
rational conclusion as to the most important factor that influences the brand selection
process of kitchen appliances by consumers of Kerala. Table T6.14, T6.15, T6.16,
T6.17 and T6.18 analyses the location wise differences in the factors which the
consumers believe to be influenced in their brand choice of Mixer Grinder, Grinder,
Refrigerator, Gas Stove and Pressure Cooker respectively.
Table T6.14 Reason for Choosing a Particular Brand of Mixer Grinder-
Location Wise Analysis
Reason for choosing Brand
Area of residence Total
Urban Semi Urban Rural
No. % No. % No. % No. %
Because of brand name 120 50 160 80 80 50 360 60
Because of better after service - 40 20 - - 40 6.7
Lesser price - - - - 80 50 80 13.3
Because of brand name & better after service 120 50 - - - - 120 20
Total 240 100 200 100 160 100 600 100 Source: Survey Data

249
Analysis of Table T6.14 reveals that the urban population always looks for
both brand name and after sales service in the selection of a particular Mixer Grinder.
But 80 percent of semi urban population looks for brand alone. In the case of rural
population, one half of them consider pricing as the major factor influencing their
purchase decision. This can be attributed to the relatively low income distribution of
the rural population.
Table T6.15 Reason for Choosing a Particular Brand of Grinder-Location Wise Analysis
Reason for choosing Brand of Grinder
Area of residence Total
Urban Semi Urban Rural
No. % No. % No. % No. %
Because of brand name 80 40 - - - - 80 20
Because of better After service - - - - 60 75 60 15
Lesser price - - - - 20 25 20 25
Because of brand name & better after service
120 60 120 100 - - 240 60
Total 200 100 120 100 80 100 400 100 Source: Survey Data
The data in Table T6.15 shows that urban and semi urban population
while purchasing the product of Grinder always look for both brand name and after
sales service. Cent percent of semi urban and 60 percent of urban give priority to
these two aspects in opting a particular brand. But 75 percent of the rural consumers
of Grinder consider better after-sales service and remaining 25 percent feels lesser
price as the decisive factor of their purchase. This is an indication of the fact that
consumers from the developed area of the state are keener on reliability factor
through established brand and proven after sales service.

250
Table T 6.16 Reason for Choosing a Particular Brand of Refrigerator-
Location Wise Analysis
Brand of Refrigerator
Area of residence Total
Urban Semi Urban Rural
No. % No. % No. % No. % Because of brand name 130 54 60 30 70 88 260 50
Because of better after service 40 17 50 25 - - 90 17
Lesser price - - - - 10 12 10 2 Because of brand name & better after service
70 29 90 45 - - 160 31
Total 240 100 200 100 80 100 520 100 Source: Survey Data
Analysis of the data given in Table T6.16 reveals that 88 percent of rural
population and 54 percent of urban population always look for brand name alone in
choosing their Refrigerator. 45 percent of semi urban population and 29 percent of
urban take into account brand as well as after sales service while making their choice
of refrigerator.
Table T 6.17 Reason for Choosing a Particular Brand of Gas Stove-
Location Wise Analysis
Reason for Choosing Brand
Area of residence Total
Urban Semi Urban Rural No. % No. % No. % No. %
Because of brand name 120 50 80 40 160 100 360 60 Because of better after service - - 120 60 - - 120 20
Lesser price - - - - - - - - Because of brand name & better after service 120 50 - - - - 120 20
Total 240 100 200 100 160 100 600 100 Source: Survey Data

251
It is evident from Table T6.17 that a full fraction of rural population - 50
percent of urban and 40 percent of semi urban population seek brand name in their
product choice. Remaining 50 percent of urban population considers the brand name
and also the after sales service before making their final decision on purchase. Thus
altogether 60 percent of the entire population takes brand name as the sole or most
important factor for evaluating the quality of the product they intend to buy.
Table T6.18 Reason for Choosing a Particular Brand of Pressure Cooker-
Location Wise Analysis
Brand of Pressure Cooker
Area of residence Total
Urban Semi Urban Rural
No. % No. % No. % No. %
Because of Brand Name 80 33.3 80 40 120 75 280 46.6
Due to free gift/exchange offer 40 16.7 - - - - 40 6.7
Lesser Price - - - - 40 25 40 6.7
Because of Brand Name and After Sale Service
120 50 120 60 - - 240 40
Total 240 100 200 100 160 100 600 100 Source: Survey Data
The data in Table T6.18 shows that majority of consumers look for brand
name and after sales service, 60 percent of semi urban population, 50 percent of
urban population are keen on brand and after sales service, while 75 percent of rural
population selects the product only because of the established brand name. 25
percent of rural population considers pricing as an important factor and they look for
lower priced items. This can be ascribed to the lower income profile of the rural
population.
252
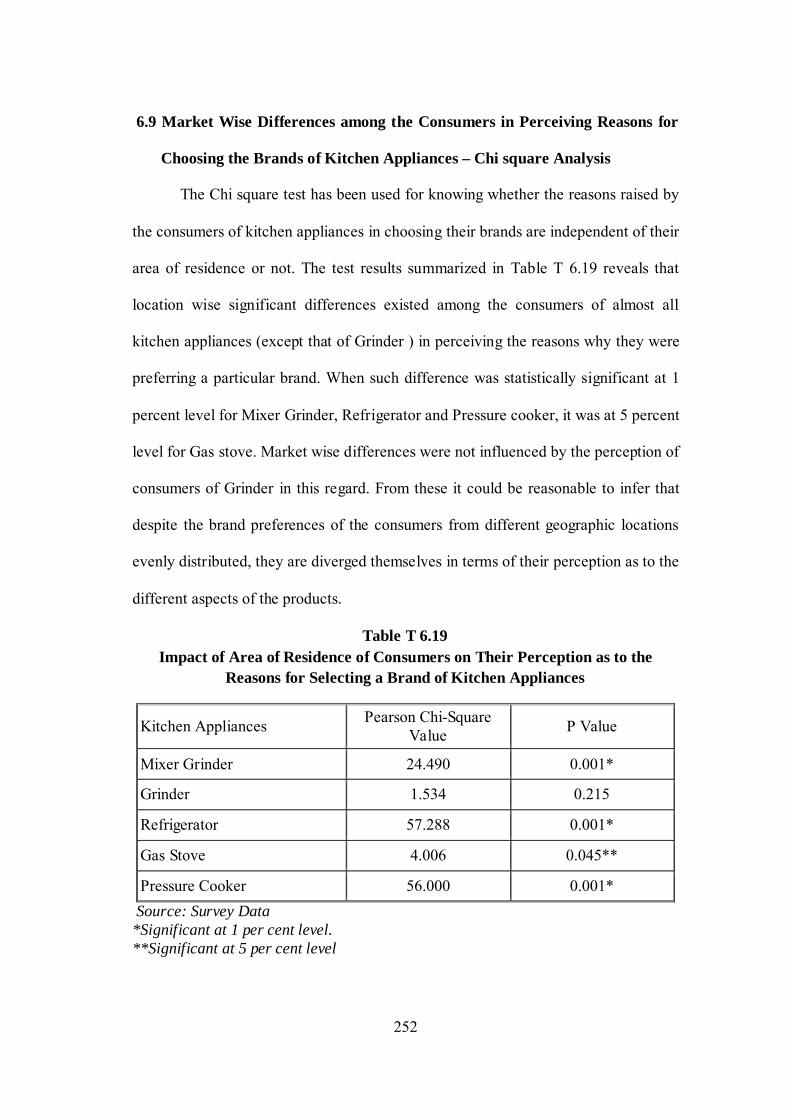
6.9 Market Wise Differences among the Consumers in Perceiving Reasons for
Choosing the Brands of Kitchen Appliances – Chi square Analysis
The Chi square test has been used for knowing whether the reasons raised by
the consumers of kitchen appliances in choosing their brands are independent of their
area of residence or not. The test results summarized in Table T 6.19 reveals that
location wise significant differences existed among the consumers of almost all
kitchen appliances (except that of Grinder ) in perceiving the reasons why they were
preferring a particular brand. When such difference was statistically significant at 1
percent level for Mixer Grinder, Refrigerator and Pressure cooker, it was at 5 percent
level for Gas stove. Market wise differences were not influenced by the perception of
consumers of Grinder in this regard. From these it could be reasonable to infer that
despite the brand preferences of the consumers from different geographic locations
evenly distributed, they are diverged themselves in terms of their perception as to the
different aspects of the products.
Table T 6.19 Impact of Area of Residence of Consumers on Their Perception as to the
Reasons for Selecting a Brand of Kitchen Appliances
Kitchen Appliances Pearson Chi-Square Value P Value
Mixer Grinder 24.490 0.001*
Grinder 1.534 0.215
Refrigerator 57.288 0.001*
Gas Stove 4.006 0.045**
Pressure Cooker 56.000 0.001* Source: Survey Data *Significant at 1 per cent level. **Significant at 5 per cent level

253
6.10 Perception towards the Performance of Kitchen Appliances
The performance of the appliance that the consumers enjoy at present in
general will decide whether it is a reliable one or will be a friend to house maids in
the kitchen. gathering information on the perception of consumers towards the
performance of their kitchen appliances definitely help its manufacturers to
rationalize their products through better technology and innovations. So the analysis
of performance in general and particular about various brands are necessary to reach
at various conclusions. Table T6.20 gives a detailed description on the satisfaction
level of consumers as to the performance of their kitchen appliances.
Table T 6.20 Performance of Kitchen Appliances
Level of Satisfaction
Mixer Grinder
Grinder Refrigerator Gas Stove Pressure Cooker
Total
Good 440 (73) 265 (66) 395 (76) 520 (87) 440 (73) 2060 (76)
Satisfactory 160 (27) 135 (34) 125 (24) 80 (13) 80 (13) 580 (21)
Bad - - - - 80 (13) 80 (3)
Total 600 (100) 400 (100) 520 (100) 600 (100) 600 (100) 2720 (100) Source: Survey Data Figures given in parentheses indicates percent
Among the respondents of Mixer Grinder 73 percent are happy with the
performance of their product and 27 percent are satisfied and with the current
performance of their product. Most of the consumers are either happy or satisfied
with the performance of their Mixer Grinders.
66 percent of the people who use the Grinder have the opinion that the
performance of this domestic device is good and 34 percent feel that it is satisfactory.
Hence the quality of Grinders available in the market is reasonably good.

254
76 percent of the consumers are happy with the performance of their
Refrigerator and 24percent are satisfied with the product. This reveals that the
performance of almost all the Refrigerators is reasonably good because non branded
manufacturers are not there in the segment of Refrigerators
87 percent of the consumers are happy with the performance of their Gas
Stoves and 13 percent is satisfied with their product. This reveals that the
performances of almost all the Gas Stoves are reasonably good because the gas stove
manufacturers strictly follow rigid quality control measures.
73 percent of the consumers are happy with the performance of their Pressure
Cookers and 13 percent is satisfied while the rest 13 percent have the opinion that the
performance of their Pressure Cooker is not satisfactory. This shows that the
performance of almost all the Pressure Cookers is reasonably good. Because of the
intense competition in this product segment; the manufacturers give more thrust to
the quality of the product.
Table T 6.21 Level of Satisfaction in Performance of Kitchen
Appliances -Location Wise Analysis
Kitchen Appliances
Area of residence Total
Urban Semi Urban Rural Good Satisf-
actory Bad Good Satisf-
actory Bad Good Satisf-
actory Bad
MixerGrinder 200(83) 40(17) - 150(75) 50(25) - 90(56) 70(44) - 600 Grinder 150(75) 50(25) - 70(58) 50(42) - 45(56) 35(44) - 400
Refrigerator 160(80) 40(20) - 140(78) 40(22) - 95(68) 45(32) - 520 Gas Stove 180(75) 60(25) - 170(85) 30(15) - 140(88) 20(12) - 600
Pressure Cooker 200(83) 40(17) - 160(80) 40(20) - 80(50) - 80(50) 600
Total 890 230 - 690 210 450 170 80 2720 Source: Survey Data Figures given in parentheses indicates percentage

255
83 percent proportion of the urban population has good opinion about the
performance of their Mixer Grinder, when 75 percent of semi urban population and
56 percent of rural population commented so. 17 percent of urban population, 25
percent of semi urban and 44 percent of the rural population have the opinion that the
performance of their Mixer Grinder is satisfactory. This divergence between the rural
and urban with the same brand of Mixer Grinder revealed by Table T6.21 may be
due to the lack of proper product knowledge among the rural population. From all the
segments none of them has the opinion that they are not satisfied with the
performance of their Mixer Grinder.
The analysis of the grinder discloses that the majority of the urban population
(ie.75 percent) has good opinion about the performance of the Grinder which they
are using for their domestic purpose. But only 58 percent of the respondents from the
semi urban area and 56 percent from the rural area expressed their observation as
‘good’ with regard to the performance the Grinder they use at this degree of scale .
However 44 percent of rural, 42 percent of semi urban and 25 percent urban
consumers of this household device are satisfied with its performance. This shows
that with the same brand of Grinder where urban, semi urban and rural population
has different scale of opinion but only at narrow range
Analysis of Refrigerator shows that 80 percent of urban, 78 percent of semi
urban and 68 percent of rural population have good opinion about the performance of
the Refrigerator. But 20 percent of urban and semi urban population and 32 percent
of rural segment have the opinion that it is satisfactory.
Analysis of Gas Stove reveals that 88 percent of the rural population, 85
percent of the semi urban and 75 percent of the urban population have good opinion

256
about the performance of Gas stoves they are using. This shows that the Gas stove
manufacturers are keen in supplying durable products at the same time providing
good after sales service to avoid the risk of loss of customers due to post purchase
dissonance. The satisfied customers from all segments together constitute 18 percent
only.
The analysis of pressure cooker shows that 83 percent of the urban
population, 80 percent of semi urban and 50 percent of rural population have good
opinion about the performance of Pressure cooker. 40 percent of urban and 20
percent of semi urban are satisfied with the performance of their Pressure cookers. In
rural area 50 percent of the respondents are not satisfied with the performance of
their pressure cookers.
6.11 Impact of Demographic Profile (Residential Location) on the Consumers
Level of Satisfaction about Performance of Kitchen Appliances
The analysis on the basis of Chi-Square test statistically proved that, the
consumer satisfaction on the performance of their kitchen appliances differs from
market to market. Inference drawn on the basis of the values obtained through the
test states that the residential locations of the consumers (indirectly their socio
economic profile) have significant impact on their level of satisfaction as to the
performance of Kitchen appliances. Among the five selected products only in the
case of pressure cooker the analysis shows the opposite to this. Moreover, except in
the case of Refrigerator, in all other cases such differences among the consumers
were significant at 1 percent level.

257
Table T 6.22 Impact of the Area of Residence of Consumers on the Level of Satisfaction
About Performance of Kitchen Appliances
Kitchen Appliances Pearson Chi-Square Value P Value
Mixer Grinder 36.435 0.001*
Grinder 13.790 0.001*
Refrigerator 7.147 0.028**
Gas Stove 12.245 0.002*
Pressure Cooker 3.644 0.162 Source: Survey Data
*Significant at 1 per cent level **Significant at 5 per cent level
6.12 Purchase Point of Kitchen Appliances
A particular product, after its manufacturing process, will be distributed
through different channels to make it available among the consumers as and when it
is required. There are different distribution channels as well as different systems to
have the product presence in all markets. But to find out the effective system of
distribution, the preference of the consumers to buy it from a particular point is very
important. This can be identified and analyzed by the Table T 6.23
Table T 6.23 Purchase Point of Kitchen Appliances
Purchase Pont Mixer Grinder Grinder Refrigerator Gas Stove Pressure Cooker
Total
From Authorized dealer
360 (60) 290(73) 480(92) 330(55) 400(67) 1860(68)
From the retail shop 120 (20) 50(12) - 130(22) 160(27) 460 (17)
From Company outlet in Exhibitions
40 (6.7) - - 35 (6) 40 (6) 115 (4)
From Company representatives
80 (13.3 60(15) 40 (8) 105(17) - 285(11)
Total 600 (100) 400(100) 520 (100) 600(100) 600(100) 2720(100) Source: Survey Data Figures given in parentheses indicates the percentage

258
Majority of the consumers of Kitchen appliances under study prefer to purchase
the product from authorized dealer of that product. The analysis in Table T6.23
shows that 60 percent of the consumers of Mixer Grinder purchase it from authorized
dealers and the rest 40 percent purchase it from other sources like retail shop,
company outlet in exhibitions and company representatives etc.
73 percent of consumers who use Grinders buy it from the authorized dealers.
This reveals that consumers give more importance to the reliability factor of the
product.
92 percent of the consumers purchase Refrigerator from the authorized
Dealer while 8 percent buy it through the representatives. Here also consumers are
much particular about the supply of reliable products from the direct sources of the
Company.
55 percent of the consumers purchase Gas Stove from the authorized Dealers
while 22 percent gets it from retail outlets. 17 percent purchases it through company
representatives and 6 percent buys it through the company outlets in exhibitions.
67 percent of the consumers purchase Pressure Cookers from the authorized
Dealers, 27 percent from the retail shops and 6 percent from company outlets in
Exhibitions.
So from the above analysis it can be inferred that customers irrespective of
the kitchen appliance they use, give importance to quality factor while making their
purchase. Majority of the customers have the habit of purchasing goods from direct
sources of Companies such as authorized dealers and company outlets.

259
6.13 Location Wise Analysis of Purchase Point of Kitchen Appliances by
Consumers
Normally there is a general view that consumers from different geographical
background may have different outlook towards the quality of the product which
they procure from various purchase points. This might be attributed to different
factors such as degree of urbanization, education level, knowledge about the product
etc. For examining whether such disparity in terms of purchase points of different
types of kitchen appliances exist among consumers from different geographical
background, a location wise analysis has been made. The results of such analysis are
explained in Table 6.24 to Table 6.28
6.14 Purchase Point of Mixer Grinder
Table T 6.24 Purchase Point of Mixer Grinder-Location Wise Analysis
Purchase point of Mixer Grinder
Area of residence Total
Urban Semi Urban Rural
No. % No. % No. % No. %
From Authorized Dealer
120 50 160 80 80 50 360 60
From Retail Shop 40 16.7 40 20 40 25 120 20
Co. Outlet in Exhibitions
- - - - 40 25 40 6.7
From Co. Representatives
80 33.3 - - - - 80 13.3
Total 240 100 200 100 160 100 600 100
Source: Survey Data

260
6.15 Purchase Point of Grinder
Table T 6.25 Purchase Point of Grinder-Location Wise Analysis
Purchase point of Grinder
Area of residence Total
Urban Semi Urban Rural
No. % No. % No. % No. %
From Authorized Dealer 150 75 90 75 50 63 290 72.5
From Retail Shop 30 15 20 17 - - 50 12.5
From Co. outlet in Exhibitions - - - - - - - -
From Co. Representatives 20 10 10 8 30 37 60 15
Total 200 100 120 100 80 100 400 100 Source: Survey Data
6.16 Purchase Point of Refrigerator
Table T 6.26 Purchase Point of Refrigerator-Location Wise Analysis
Purchase point of
Refrigerator
Area of residence Total
Urban Semi Urban Rural
No. % No. % No. % No. %
From Authorized
Dealer 200 83.3 200 100 80 100 480 92.3
From Company
Representatives 40 16.7 40 7.7
Total 240 100 200 100 80 100 520 100
Source: Survey Data

261
6.17 Purchase Point of Gas Stove
Table T 6.27
Purchase Point of Gas Stove-Location Wise Analysis
Purchase point of Gas Stove
Area of residence Total
Urban Semi Urban Rural
No. % No. % No. % No. %
From Authorized Dealer 130 54 110 55 90 56 330 55
From Retail Shop 50 21 40 20 40 25 130 22
From Co. Outlet in Exhibitions 20 8.33 15 7.5 - - 35 5
From Company Representatives 40 16.67 35 17.5 30 19 105 18
Total 240 100 200 100 160 100 600 100 Source: Survey Data
6.18 Purchase Point of Pressure Cookers
Table T 6.28 Purchase Point of Pressure Cooker-Location Wise Analysis
Purchase Point of Pressure Cookers
Area of residence Total
Urban Semi Urban Rural
No. % No. % No. % No. %
From authorized Dealer 240 100 160 80 - - 400 66.6
From Retail Shop - - 40 20 120 75 160 26.7
Company outlet in Exhibitions - - - - 40 25 40 6.7
From Company Representatives - - - - - - - -
Total 240 100 200 100 160 100 600 100 Source: Survey Data

262
The authorized distributor is the major source to the consumers in their
purchase of kitchen appliances. From the descriptive analysis of the data, we cannot
perceive any dissimilarity on this aspect between the consumers of different kitchen
appliances. 100 percent of consumers of Pressure Cookers, more than 75 percent of
consumers of Grinder and Refrigerator and about one half of the users of Gas stove
and Mixer Grinder from the urban area decide authorized dealer as point of purchase
of their products. Similarly, at least 75 percent of consumers of selected kitchen
appliances (except consumers of gas stove, where only 55 percent) from semi urban
area prefer to buy their products from authorized dealers. Even though majority of
the consumers from rural area also opt to purchase their appliances from the
authorized dealer, their proportion is relatively lower than that of those who come
from other two segments. It has also been noticed that in the case of gas stove 75
percent of rural consumers approach retail outlets to procure their products. Marginal
percent of consumers of the whole rural population have got the inclination to buy
the product through exhibition sales during festival seasons. All of these facts
substantiate the basic characteristics of consumers regardless of their residential
location to get genuine products from a reliable channel of company’s distribution
system.
Non parametric form of test of independence – Chi square analysis used in
the study for measuring market wise differences among the consumers of Kitchen
appliances in deciding their purchase points and the test found such differences
among the consumers statistically significant at 1 percent level in the case of Mixer
grinder, Refrigerator and Pressure cooker. The test results are reported in Table
T6.29. From the analysis of these results it can also be inferred that the diversity in

263
the habit of choosing their purchase sources by the consumers of different segments
are more specific than general.
Table T6.29 Association between Residential Location of Consumers and their
Decisions on Points of Purchase
Kitchen Appliances Chi-Square Value P value
Mixer Grinder 29.847 0.001*
Grinder 0.356 0.949
Refrigerator 9.658 0.002*
Gas Stove 0.651 0.957
Pressure Cooker 54.609 0.001* Source: Survey Data *Significant at 1 per cent level
6.19 Responsibility of Retailer in Providing After-Sales Service
In the distribution process starting from the Manufacturer and ending with the
consumer, the nearest contact point for the customer will be the last link of the
distribution process, the retailer. Similarly, the nearest place where the consumer can
approach for the support and service of a product is the next door retailer. But, most
of the retailers will be focused only on sales because every branded product will have
authorized service centers to take care of the after-sales service and the retailer would
like to avoid encounter with the customers who approach him with complaints on the
performance of a product and demand for maintenance and service. How far these
retailers do justice to the customers who have purchased the product from them, by
providing good after sales service is explained in Table T6.30

264
Table T 6.30 Support Provided by Retailers in Getting After-Sales Service
Opinion
Mixer Grinder
Grinder Refrigerator Gas Stove
Pressure Cooker
Total
Giving Support 200(33.3) 70(17.5) 80 (15) 120(20) 126(21) 596 (22)
Not giving Support
400(66.7) 330(82.5) 440 (85) 480(80) 474(79) 2124(78)
Total 600 (100) 400(100) 520(100) 600(100) 600(100) 2720(100) Source: Survey Data Figures given in parentheses indicate the percentage
Majority of the consumers of kitchen appliances unanimously opined that the
retailers do not show any interest in providing back up service to their customers.
Among the respondents, two third of the consumers of the Mixer Grinder, 82.5
percent of consumers of Grinder, 85 percent of the consumers of Refrigerator and
about 80 percent of consumers of Gas stove and Pressure Cooker commented that the
retailers are not ready to spend time on after sales service and consider it as the
responsibility of the manufacturer. Since the retailer is the direct link with the
consumer in the distribution process, any negative response from the part of them
with respect to service support to the customers shall definitely affect the trust and
confidence of the consumers which in turn shall lead to the shift in their product
choice.
6.20 Location Wise Analysis of Consumer Perception Regarding After-Sales
Support by the Retailers
Consumers from different locality may have difference in accessing for after
sales service. Usually the manufacturers set up their service centers in urban area.
Hence consumers from semi urban and rural areas find it difficult to get the after
sales service. At this juncture the retailer’s role is prominent in extending maximum
265
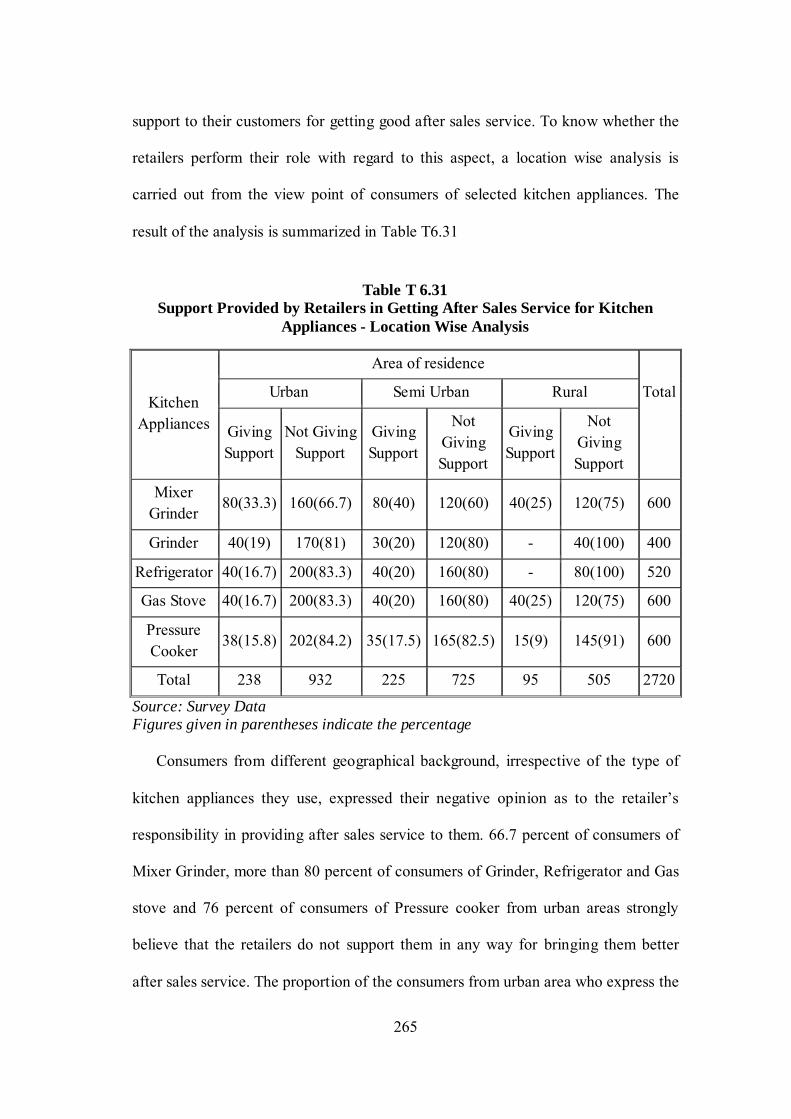
support to their customers for getting good after sales service. To know whether the
retailers perform their role with regard to this aspect, a location wise analysis is
carried out from the view point of consumers of selected kitchen appliances. The
result of the analysis is summarized in Table T6.31
Table T 6.31
Support Provided by Retailers in Getting After Sales Service for Kitchen Appliances - Location Wise Analysis
Kitchen Appliances
Area of residence
Total
Urban Semi Urban Rural
Giving Support
Not Giving Support
Giving Support
Not Giving Support
Giving Support
Not Giving Support
Mixer Grinder
80(33.3) 160(66.7) 80(40) 120(60) 40(25) 120(75) 600
Grinder 40(19) 170(81) 30(20) 120(80) - 40(100) 400
Refrigerator 40(16.7) 200(83.3) 40(20) 160(80) - 80(100) 520
Gas Stove 40(16.7) 200(83.3) 40(20) 160(80) 40(25) 120(75) 600
Pressure Cooker
38(15.8) 202(84.2) 35(17.5) 165(82.5) 15(9) 145(91) 600
Total 238 932 225 725 95 505 2720
Source: Survey Data Figures given in parentheses indicate the percentage
Consumers from different geographical background, irrespective of the type of
kitchen appliances they use, expressed their negative opinion as to the retailer’s
responsibility in providing after sales service to them. 66.7 percent of consumers of
Mixer Grinder, more than 80 percent of consumers of Grinder, Refrigerator and Gas
stove and 76 percent of consumers of Pressure cooker from urban areas strongly
believe that the retailers do not support them in any way for bringing them better
after sales service. The proportion of the consumers from urban area who express the

266
same view with regard to after sales service is almost the same as that of urban
consumers. In the case of rural population their argument against the initiative of
their retailers in providing support to them on this factor is stronger than the other
two groups. Among them cent percent of the consumers of Grinder and Refrigerator
have their unanimous opinion of the retailer’s indifference in extending any support
to their customers in time in getting their products serviced. Such differences of
opinion among the consumers hailing from different geographic segments of the
Kitchen appliances market of Kerala were statistically verified with the help of
inferential statistical analysis and the results are reported in Table T6.32
Table T 6.32 Market Wise Differences in Perception of Consumers of Kitchen Appliances
as to the Level of Support Extended by the Retailers – Chi square Analysis
Kitchen Appliances Chi-Square Value P value
Mixer Grinder 9.000 0.11**
Grinder 160.000 0.001*
Refrigerator 18.121 0.01**
Gas Stove 4.167 0.125
Pressure Cooker 81.000 0.001*
Source: Survey Data *Significant at 1 per cent level **Significant at 5 per cent level From the analysis it can be observed that there were market wise differences
existing in the perception of customers as to the level of support extended by their
dealers in getting their products being serviced. Of the five kitchen appliances under
study, except Gas stove, in all other four products their customers from different
market segments have differences of opinion in this regard, which was found to be

267
statistically significant at 1 percent level for Grinder and Pressure cooker and at 5
percent level for Mixer grinder and Refrigerator.
6.21 Opinion about After Sales Service
In the present competitive world, the companies give importance not only to
the supply of quality products but also to extending good after sales service which is
considered to be the prime component of augmented form of a durable product. Once
the core product has been successfully delivered to the customer, the efforts are taken
by the manufacturers to retain them with the companies by winning their confidence
and satisfaction through better after sales service.
In a study of the marketing of kitchen appliances, the perception of customers
towards the quality of after sales service provided by the manufacturers of their
products is an important area which is to be analyzed for getting the knowledge
about their overall satisfaction level with regard to their products. Every appliance
which is used regularly will have some problems because of the continuous use or of
using it in an improper way. The satisfied customer will be an asset to any brand and
at the same time, if they do not get prompt and proper service, they will start bad
mouthing about the brand and may affect the other products of the same brand. The
good opinion about the after sales service of a product, especially during the
warranty period will be a referral for further sale.

268
Table T 6.33 Opinion about After Sales Service
Opinion
Mixer
Grinder Grinder Refrigerator Gas Stove
Pressure
Cooker Total
Good 350(58) 220(55) 380(73) 440(73) 250(63) 1640(65)
Satisfactory 170(29) 130(33) 120(23) 90(15) 110(27) 620 (25)
Bad 80 (13) 50 (12) 20 (4) 70(12) 40(10) 260 (10)
Total 600 (100) 400(100) 520 (100) 600 (100) 400(100) 2520 (100)
Source: Survey Data Figures given in parentheses indicate the percentage
More than 55 percent of consumers of Mixer Grinder and Grinder, 73 percent
each of consumers of Refrigerator and Gas Stove and 63 percent of the consumers of
Pressure Cooker opined that the after sales service provided by the manufacturers of
their products to them was really good. About 30 percent of the consumers of Mixer
Grinder and Grinder, more than 20 percent of the consumers of Pressure Cooker and
Refrigerator and 15 percent of Gas Stove customers are satisfied with the present
services offered by the suppliers of their products even after making the sales. The
proportion of unsatisfied customers in this regard is very nominal. When we take
these data’s altogether, it can be said that 90 percent of the total customers is at least
satisfied with the back-up service provided by the suppliers and only 10 percent of
them are upset with this aspect of product service. From this we can infer that most
of the customers are satisfied with the efforts taken by the manufacturers for bringing
them better after sales service even though the retailers do not show a keen interest in
this regard.

269
Table T 6.34 Opinion about After Sales Service of Kitchen Appliances –
Location Wise Analysis
Kitchen Appliances
Area of residence Total
Urban Semi Urban Rural
Good Satisf-actory Bad Good Satisf-
actory Bad Good Satisf-actory Bad
Mixer Grinder 160(67) 70(29) 10(4) 120(60) 50(25) 30(15) 70(44) 50(31) 40(25) 600
Grinder 130(65) 60(30) 10(5) 70(56) 30(24) 25(20) 20(27) 40(53) 15(20) 400
Refrigerator 200(83) 40(17) - 160(80) 40(20) - 20(25) 40(50) 20(25) 520
Gas Stove 210(87.5) 30(12.5) - 170(85) 20(10) 10(5) 60(37.5) 40(25) 60(37.5) 600
Pressure Cooker 190(79) 40(17) 10(4) 160(80) 30(15) 10(5) 90(56) 50(31) 20(13) 600
Total 890 240 30 680 170 75 260 220 155 2720
Source: Survey Data Figures given in parentheses indicate the percentage
Table T 6.34 discloses the location wise difference in customer’s opinion as
to the quality of after sales service received by them from their suppliers. Virtually
no difference could be visible in the level of the satisfaction of customers of various
kitchen appliances from urban and semi urban regions. Majority of the customers
from both of these segments where at least satisfied with the after sales service
rendered by their suppliers. Only a very nominal fraction of the customers of these
regions opined negatively as to the quality of the service they received. None of the
customers of Refrigerator from these segments raised any negative reply as to the
after sale service.
But the perception of the respondents from rural segment differs much from
those of the other two segments. Customers of Grinder and Refrigerator from rural
segments who have replied “satisfied” outnumbered the customers who replied

270
“Good”. In the case of Grinder customers who felt “good” is exactly equal to those
who felt “bad” while receiving the after sales service from their suppliers. Except
customers of pressure cooker, (where only 13 percent) 20 percent more of the rural
customers of kitchen appliances were totally dissatisfied with the present after sale
service received from their suppliers. Chi square analysis made in this regard (its
results reported in Table T6.35) also found statistically significant difference at 1
percent level between the customers from different market segments in terms of their
level of satisfaction towards after sales service rendered by the manufacturers of their
products.
On the basis of this analysis, it can be said that the rural customers do not
relatively feel good or sometimes even feel bad in getting further service from their
suppliers once they have made their purchase. This might be attributed to the fact
that service centers of majority of the popular kitchen appliances manufacturing
companies in India are mainly situated in cities or towns which pose a problem to the
rural customers to go to these centers, which are far away from them, for getting their
products serviced.
Table T 6.35 Association between the Demographic Profile (Area of Residence)
of the Consumers of Kitchen Appliances and their Level of Satisfaction towards the After Sales Service
Kitchen Appliances Chi-Square Value P value
Mixer Grinder 301.778 0.001*
Grinder 192.000 0.001*
Refrigerator 280.333 0.001*
Gas Stove 296.444 0.001*
Pressure Cooker 520.000 0.001* *Significant at 1 per cent level Source: Survey Data

271
6.22 Incentives Offered for Referral
A customer takes a decision to buy a product after considering various facts
and factors. Once he has taken a decision to buy a product, he has become a proud
owner of that product. Incentives always motivate people to take instant decisions
and to refer and recommend the same product to others. Whether this natural instinct
of consumers are properly understood and implemented by the dealers of kitchen
appliances can be analyzed with the support of the Table T 6.36
Table T 6.36 Incentives Offered for Referral
Mixer Grinder
Grinder Refrigerator Gas
Stove Pressure Cooker
Total
Incentives Offered
40(7) 30(7.5) 40 (8) 80 (13) 70(12) 260(10)
Not Offered 560(93) 370(92.5) 480(92) 520(87) 530(88) 2460(90)
Total 600(100) 400(100) 520(100) 600(100) 600(100) 2720(100) Source: Survey Data Figures given in parentheses indicate the percentage
Majority of the consumers do not get any incentives for the referral made by
them. Only 10 percent of the customers get some form of incentives from their
dealers for referring the products to other people. However, the relative percentage of
customers who are getting such incentives is high in case of Gas Stove and Pressure
Cooker. This might be due to the fact that the volume of sale and profit margin on
these products are relatively high and its dealers are ready to sacrifice a portion of
their profit in favor of the customers for motivating them to influence the purchase
decision of their friends and relatives.

272
6.23 Incentives Offered for Referral - Location Wise Analysis
Generally there is a common belief that urban people are more educated and
rational than rural ones, on account of which they will have better bargaining power
and often in a position to avail of incentives for referrals and their future purchases
from their present suppliers of product. To know whether such belief is realistic in
the marketing of kitchen appliances also, location wise analysis of customers who
have received and who have not received incentives for recommending the brand of
their products to his friends and relatives. The result of the analysis is summarized in
Table T6.37
Table T 6.37
Whether Incentives Offered for Referral of Kitchen Appliances-Location Wise Analysis
Kitchen
Appliances
Area of residence Total
Urban Semi Urban Rural
Incentives
Offered
Not
Offered
Incentives
Offered
Not
Offered
Incentives
Offered
Not
Offered
Mixer
Grinder
25(10.5) 215(89.5) 10(5) 190(95) 5(3) 155(97) 600
Grinder 20(10) 180(90) 10(8) 110(92) - 80(100) 400
Refrigerator 30(12.5) 210(87.5) 10(5) 190(95) - 80(100) 520
Gas Stove 35(15) 205(85) 25(12.5) 175(87.5) 20(12.5) 140(87.5) 600
Pressure
Cooker
35(15) 205(85) 25(12.5) 175(87.5) 10(6) 150(94) 600
Total 145 1015 80 840 35 605 2720
Source: Survey Data Figures given in parentheses indicate the percentage

273
It can be known from the analysis that most of the dealers in kitchen
appliances do not offer any sort of incentives to the buyer for their recommendations
and referrals. However, when a product wise analysis is made on this aspect,
relatively more customers from urban and semi urban areas were able to persuade
their dealers to give them incentives for recommending the brand to their friends and
relatives. When not a single rural customer has received any incentive for their good
mouthing and reference of the name of the dealer and the name of the brand of
grinder and refrigerator, the number of rural customers who received motivation in
the form of incentives for recommending the name of the mixer grinder and pressure
cooker is very few in number. But in the case of gas stove, the percentage of
customers who got incentives for their referrals was more or less the same.
Inferential analysis made here for verifying the statistical validity of the market wise
differences among the consumers in various product segments of the Kitchen
appliances is also substantiate the findings of the descriptive analysis. The test results
summarized in Table T6.38 reveals that such differences among the consumers is
statistically significant at 1 percent level in respect of all the five products. So from
these results it can be inferred that urban customers were able to take hold of more
incentives than the rural for their referrals and recommendations due to the better
bargaining power and geographical nexus. If some sort of incentives are offered to
the buyers for their referrals, consumers will get motivated and they will act as the
sales team of the dealers.

274
Table T 6.38 Market wise Differences in Incentives Offered by the Dealers to
Consumers for their Referrals – Inferential Analysis
Kitchen Appliances Chi-Square Value P value
Mixer Grinder 64.286 0.001* Grinder 27.429 0.001*
Refrigerator 50.556 0.001*
Gas Stove 138.462 0.001* Pressure Cooker 64.286 0.001* *Significant at 1 per cent level Source: Survey Data
6.24 Types of Incentives Offered
Incentives are in many forms, offered by a dealer to his existing customers
for recommending him and also the name of the brand of the product which they
currently used. Such incentives may include cash incentives, free gifts, extended
guarantee or reduction in price for future purchases. Even though, only a minor
fraction of customers of kitchen appliances received such incentives, it is important
to know which form of incentives is more commonly received by them. Table T.6.39
summarizes the varied form of incentives received by the customers of different
kitchen appliances as a reward for their referrals.
Table T 6.39 Types of Incentives Offered
Types of Incentives
Mixer Grinder Grinder Refrigerator Gas
Stove Pressure Cooker
Total
Cash incentive 30(75) 20(66.66) 10(25) 50(62.5) 35(50) 145(56)
Free Gifts - 5 (16.67) - 20(25) 20(28.5) 45(17) Additional Extended Guarantee - - 25(62.5) 5(7) 30(12)
Cash Reduction for future Purchase 10(25) 5 (16.67) 5(12.5) 10(12.5) 10(14.5) 40(15)
Total 40(100) 30(100) 40(100) 80 (100) 70(100) 260(100) Source: Survey Data Figures given in parentheses indicates percent

275
Cash incentives were the most common form of incentives offered by the
dealers to their existing customers for their referrals. Out of the 210 customers who
have received incentives, 125 of them got cash incentives, 30 each received benefits
in the form of additional extended guarantee and cash reduction for future purchase
and 25 received free gifts for recommending the products to their friends and
relatives. When product wise analysis is made, it can be known that except customers
of refrigerator, majority of customers of kitchen appliances receive cash incentives.
For the customers of refrigerator dealers prefer to give additional extended warranty
to the products which they have already purchased from them. From this it can be
deduced that for the promotion of relatively small and cheaper kitchen appliances
among the group, dealers like to give cash incentives instead of additional extended
guarantee to the customers who have given referrals, which may relieve them from
the risk of liability to maintain their products when the guarantee is extended to the
already sold product.
6.25 Type of Incentives Offered to Customers - Location Wise Analysis
To find out whether there is any disparity in the form of incentives received
by the customers from different geographical locations, a location wise analysis has
been made. Such analysis is made for the customers of different kitchen appliances
separately and the results are discussed in Table T6.40

276
0
10
20
30
40
50
60
70
Cash incentive
Free Gifts Additional Extended Guarantee
Cash Reduction for future Purchase
Urban
Semi Urban
Rural
Table T 6.40 Types of Incentives for Mixer Grinder-Location Wise Analysis
Types of Incentives
Area of residence Total
Urban Semi Urban Rural
No. % No. % No. % No. % Cash incentive 15 60 7 70 3 60 25 62.5
Free Gifts - - - - - - - - Additional Extended Guarantee - - - - 2 40 2 5
Cash Reduction for future Purchase 10 40 3 30 - - 13 32.5
Total 25 100 10 100 5 100 40 100 Source: Survey Data
Figure F6.8 Types of Incentives for Mixer Grinder-Location Wise Analysis
Cash incentives are more popular among the mixer grinder customers
regardless of location they belong to. Of the 40 mixer grinder customers who receive
incentives from the dealers for the referrals made by them, 60 percent of both urban
and rural each and 70 percent of semi urban customers receive cash incentives. None
of the customers receive any free gifts for recommending the brand of the mixer
277
0
10
20
30
40
50
60
70
Cash incentive
Free Gifts Additional Extended Guarantee
Cash Reduction for
future Purchase
Urban
Semi Urban
Rural
grinder he uses and also the name of the dealer from which he has made his
purchase.
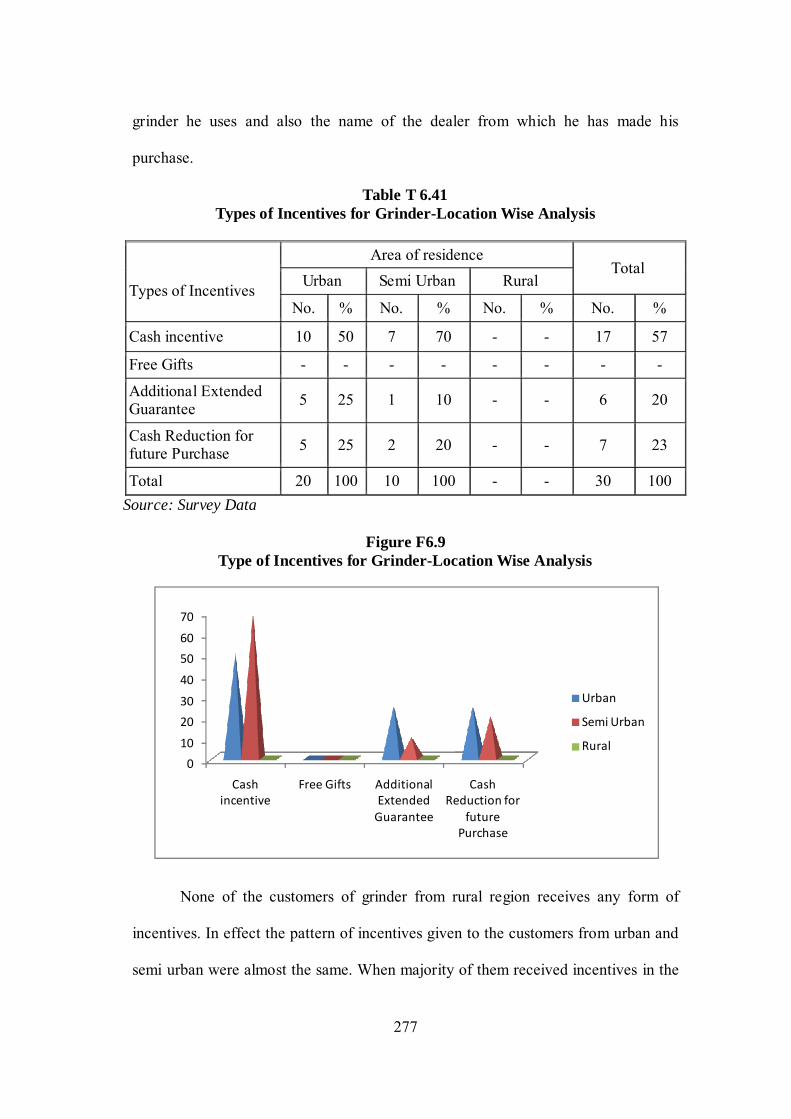
Table T 6.41 Types of Incentives for Grinder-Location Wise Analysis
Types of Incentives
Area of residence Total
Urban Semi Urban Rural
No. % No. % No. % No. %
Cash incentive 10 50 7 70 - - 17 57
Free Gifts - - - - - - - -
Additional Extended Guarantee 5 25 1 10 - - 6 20
Cash Reduction for future Purchase 5 25 2 20 - - 7 23
Total 20 100 10 100 - - 30 100 Source: Survey Data
Figure F6.9 Type of Incentives for Grinder-Location Wise Analysis
None of the customers of grinder from rural region receives any form of
incentives. In effect the pattern of incentives given to the customers from urban and
semi urban were almost the same. When majority of them received incentives in the
278
0
10
20
30
40
50
60
Cash incentive
Free Gifts Additional Extended Guarantee
Cash Reduction for future Purchase
Urban
Semi Urban
Rural
form of cash incentives, like customers of mixer grinder none of them receives any
free gift for their referrals.
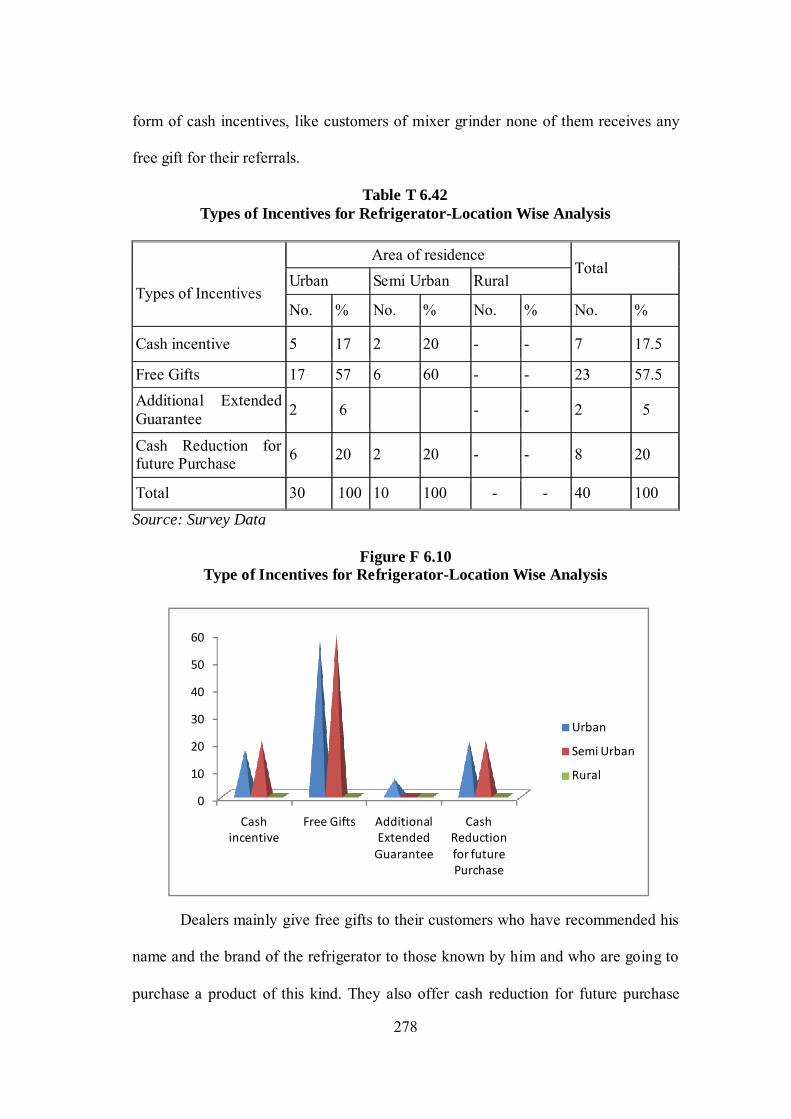
Table T 6.42 Types of Incentives for Refrigerator-Location Wise Analysis
Types of Incentives
Area of residence Total
Urban Semi Urban Rural
No. % No. % No. % No. %
Cash incentive 5 17 2 20 - - 7 17.5
Free Gifts 17 57 6 60 - - 23 57.5 Additional Extended Guarantee 2 6 - - 2 5
Cash Reduction for future Purchase 6 20 2 20 - - 8 20
Total 30 100 10 100 - - 40 100
Source: Survey Data
Figure F 6.10 Type of Incentives for Refrigerator-Location Wise Analysis
Dealers mainly give free gifts to their customers who have recommended his
name and the brand of the refrigerator to those known by him and who are going to
purchase a product of this kind. They also offer cash reduction for future purchase

279
0
10
20
30
40
50
60
70
Cash incentive
Free Gifts Additional Extended Guarantee
Cash Reduction for future Purchase
Urban
Semi Urban
Rural
and also cash incentives to such customers who give such referrals. As in the case of
grinders, none of the rural customers of refrigerators receive any such incentive from
their dealers.
Table T 6.43 Types of Incentives for Gas Stove-Location Wise Analysis
Types of Incentives
Area of residence Total
Urban Semi Urban Rural
No. % No. % No. % No. %
Cash incentive 15 43 10 40 14 70 39 49
Free Gifts 2 6 4 16 - - 6 7
Additional Extended Guarantee 5 14 6 24 4 20 15 19
Cash Reduction for future Purchase 13 37 5 20 2 10 20 25
Total 35 100 25 100 20 100 80 100 Source: Survey Data
Figure F6.11 Types of Incentives for Gas Stove-Location Wise Analysis
All forms of incentives are offered by the dealers in gas stove to customers
from all geographical regions. However, here also cash incentives are most popular

280
0
10
20
30
40
50
60
Cash incentive
Free Gifts Additional Extended Guarantee
Cash Reduction for
future Purchase
Urban
Semi Urban
Rural
among them. Apart from other products, more customers from rural region avail of
such offers from their dealers. Even though free gifts are also offered, it is lagging
behind other incentives. A considerable percent of customers from all regions was
also able to get cash reduction for their further purchase as a consideration for
introducing the dealer and the brand to their warm circle.
Table T 6.44 Types of Incentives for Pressure Cooker-Location Wise Analysis
Types of Incentives
Area of residence Total
Urban Semi Urban Rural
No. % No. % No. % No. %
Cash incentive 17 49 12 48 6 60 35 50
Free Gifts 3 9 3 12 - - 6 9
Additional Extended Guarantee 4 11 4 16 2 20 10 14
Cash Reduction for future Purchase 11 31 6 24 2 20 19 27
Total 35 100 25 100 10 100 70 100 Source: Survey Data
Figure F 6.12 Type of Incentives for Pressure Cooker-Location Wise Analysis

281
Similarly, in the case of other four kitchen appliances, cash incentives were
mainly received by customers irrespective of their location status. The pattern of
other incentives offered to them by their dealers was more or less the same as that of
Gas stove. Here also customers from rural regions were neglected by their dealers
while offering free gifts for referrals.
6.26 Association between Demographic Profile (Residential Location) and Types
of Incentives Offered by the Dealers
Chi square analysis is made for knowing whether the residential location of
the consumers is a significant factor in deciding the type of incentives offered to the
consumers by the dealers in Kitchen appliances and the results of the test are
reported in Table T6.45
Table T6.45 Association between Demographic Profile (Residential Location)
and Types of Incentives Offered by the Dealers
Kitchen Appliances Chi-Square Value P value
Mixer Grinder 0.000332 0.985
Grinder 0.00983 0.921
Refrigerator 0.0779 0.780
Gas Stove 3.020 0.554
Pressure Cooker 0.839 0.657
Source: Survey Data
From the inferential it is revealed that the area of residence or location of a
business is not a determinant of types of incentives offered to the customers of
kitchen appliances by its dealers. The analysis did not find any statistically

282
significant difference in this regard among the customers in any of the kitchen
appliances identified under study.
Location wise differences were visible in the pattern of ownership of the
kitchen appliances by the people of Kerala. Brand wise differences were also
observed in most of the product segments across the market and the consumers have
their own reasons for choosing a particular brand. Moreover, the consumers from the
three identified market segments perceived differently the performance of the kitchen
appliances. Retailers were not keen in extending after sales service to their
consumers, however the consumers were much satisfied with after sales service of
the manufacturers.