CHAPTER V SOCIO - ECONOMIC IMPACT OF TRADE...
45
CHAPTER V SOCIO - ECONOMIC IMPACT OF TRADE UNIONS. 5. 1 INTRODUCTION. 5.2 SOCIO - ECONOMIC IMPACT OF TRADE UNIONS AT MORMUGAO PORT TRUST. 5.3 SOCIO - ECONOMIC IMPACT OF TRADE UNIONS AT GOA SHIPYARD LIMITED. 5.4 SOCIO - ECONOMIC IMPACT OF TRADE UNIONS AT COLFAX PRIVATE LIMITED. 5.5 SOCIO - ECONOMIC IMPACT OF TRADE UNIONS AT CIBA SPECIALTY CHEMICALS ( INDIA) LIMITED. 5.6 COMPARISON OF IMPACT OF TRADE UNIONS . 5.7 CONCLUSIONS. 168
Transcript of CHAPTER V SOCIO - ECONOMIC IMPACT OF TRADE...
CHAPTER V
SOCIO - ECONOMIC IMPACT OF TRADE UNIONS.
5. 1 INTRODUCTION.
5.2 SOCIO - ECONOMIC IMPACT OF TRADE UNIONS AT
MORMUGAO PORT TRUST.
5.3 SOCIO - ECONOMIC IMPACT OF TRADE UNIONS AT
GOA SHIPYARD LIMITED.
5.4 SOCIO - ECONOMIC IMPACT OF TRADE UNIONS AT
COLFAX PRIVATE LIMITED.
5.5 SOCIO - ECONOMIC IMPACT OF TRADE UNIONS AT
CIBA SPECIALTY CHEMICALS ( INDIA) LIMITED.
5.6 COMPARISON OF IMPACT OF TRADE UNIONS .
5.7 CONCLUSIONS.
168

5.1 INTRODUCTION:
Trade unions affect both economic as well as the social life of the workers. The
impact of unions on wages has significant implications for economic growth and
stability as well as for the distribution of income between union and non-union
workers and between labour and other factors of production. Strong and healthy
trade unions can make substantial contribution to labour productivity and economic
development by organising and conducting educational programs, participation of
unions in the programs designed to improve productive efficiency, suggesting the
workers several practical ways to minimize wastage of raw materials and
improving efficiency through better distribution of workload and minor technical
readjustments, through labour participation in the form of works councils, helping
in the process of adjustment and integration of the workers in the industrial life.
Joshi, R. J. (2007) stated that although most of the work conditions existed mainly
due to management efforts, trade unions also have a special responsibility to take
up issues with the management. Equality of treatment at work or elimination of
discrimination in hiring, promotions, transfers, provision of maternity benefits,
transport, along with wider issues having implications for the entire workforce
were taken care of in their negotiations by the existing unions. Trade unions aim
to secure greater security for the workers — protect his job ( against other workers,
against redundancy ) protect him when unemployed, sick, injured at work, etc.
169

Tiwari, K (1995) opined that the duty of a trade union is i) to educate and
cooperate with the management to educate the employees regarding their duty
with respect to safety and health, ii) participate in management's efforts on
training and supervising employees to follow safe and healthy working procedures
and iii) cooperate with management in all bi-partite discussions on safety and
health of employees.
Socially too, unions have a more determinate role to play in the lives of vast
masses of working population and encompass more needs of the workers than
any other institution. Union, work and political loyalties were sufficiently powerful
as to considerably moderate the force of tradition in the social life of the
community. Trade unions play a very significant role in developing the labour
community. In the organized sectors, trade unions take interest in solving housing
problems of the workers, health — care improvements, family planning etc. In
many cases trade union pressures as also their constrictive cooperation have
helped employers in undertaking programs for improving working efficiency of
those units with benefits to employers, workers and the rest of the community.
Activities like running factory canteens, encouragement of small savings through
establishment of workers' banks, formation of mutual benefit societies, educating
the rank and file in personal, social and industrial hygiene, safety practices, child
welfare, ensuring effective use of labour welfare centers and finally dissemination
of general information to their members in order to create social awareness of
their present day surroundings and the role expected of them in the tasks of
170

national reconstruction and emotional integration have been undertaken by many
trade unions during recent years.
By bargaining for a better wage, the union aids the workers and their families to
improve their size and nature of consumption and thus attain greater position,
respect and dignity in society. The conventional role of the trade unions is to
advance the interest of their members and in so doing help the community to the
extent possible to reach higher levels of living. Trade unions have turned from
the question of wage and social security — employment related issues — to locality
based concerns such as health, habitation, sanitation, education and so on.
In the earlier chapters we have covered the militant function and the role they
play in industrial relations. Here, in this chapter, we will specifically deal with the
other economic and the social impact of trade unions under study. The economic
impact will be discussed with regard to Wages, Productivity, Work Conditions, Job
Security and Safety.
The social impact will be examined with reference to Health and Welfare Measures,
Standard of Living and Environment.
171

5. 2. SOCIO- ECONOMIC IMPACT OF TRADE UNIONS AT
MORMUGAO PORT TRUST:
I. Economic Impact
( a ) WAGES: Mormugao Port Trust comes under the National Wage Board.
Representatives of both Mormugao Port & Railway Workers Union ( MPRWU ) and
Goa Port & Dock Employees Union ( GPDEU ) at the national level federations
have an impact on the wages and not as an individual port or trade union. The
union office bearers actively participated during wage revision meetings with the
wage board negotiation committee. The unions favoured standardization of work
and wages and objected any wage reduction. They negotiated different schemes of
wage incentives to workers and were implemented by the management.
The schemes include Piece rate incentive scheme for Cargo handling labour,
Incentive scheme for MOHP, Incentive scheme for Railway workers etc. The
unions found that the nature of grievances of workers was to a greater extent
related to wage hike.
During the last wage revision, according to the President of GPDEU, 680 cases
were put forth before the administration out of which 652 cases were resolved,
28 cases were reopened again by the new Chairperson and were likely to be in
favour of the workers. He added that the union individually approached the
Ministry and got the issues settled.
172

According to the MPRWU, wages were negotiated by the core committee formed
by the Federation with due representation of the union. The President further
stated that the revision of pay scales were made at highest levels, framed the
Charter of demands demanding revision in wages and submitted to the Ministry of
Shipping and also saw that no employee was deprived and 99.9 % of the cases
related to wages were solved.
Table 5. 2. 1 Employees Views on Wages
Sr. No Item MPRWU GPDEU 1. Present Wage Rate
Satisfactory 72.3 66.7
Unsatisfactory 18.5 15.9
Satisfactory to some extent 1.5 -
No response 7.7 17.5 2. Present Emoluments
Satisfactory 87.7 77.8
Unsatisfactory 10.8 20.6
Satisfactory to some extent 1.5 -
No response - 1.6 Source: Based on Primary data collected through Employee Questionnaires.
Table 5. 2. 1 reveals that greater percent of MPRWU members were satisfied with
both wage rate and emoluments. Secondly, twenty percent members belonging to
GPDEU were unsatisfied with the present emoluments. But around 83.1 %
members belonging to MPRWU and 73 % belonging to GPDEU agreed that they
were content with the steps taken by the union for ensuring wages and job
security. Although the members were not satisfied with the wage rate and the
173

emoluments they still had faith in their leaders' ability to bargain a better wage
in future.
( b ) PRODUCTIVITY: Here we will try to relate the trends in productivity and
the labour relations or role played by the unions if any in improving productivity.
MPT has become the first port in the country and one among the few in the
world to achieve the prestigious quality certificate ISO 9002 on a comprehensive
basis for port facilities and related services for the sea borne trade. The following
parameters indicate the nature of the Port performance: 1 ) Average service time
and output per ship berth day. 2 ) Cargo ships handled. 3 ) Annual Traffic Trend
and 4 ) Average labour Productivity.
1 ) Average service time and output per ship berth day: MPT has achieved a
reduction with regard to average turn — round time as well as average service
time. Secondly, it has achieved an increase in both the average output as well as
total output per ship berth day and is shown in Table 5.2. 2 given below.
174

Table 5. 2. 2 Berth Occupancy at MPT
Year Items
1990 -91
1991 -92
1992 -93
54
14
1999 -2000
2900 -01
2002 -03
St;
A 2004
-05
Amp turn-mend Time
On days)
6.2 5.78 6.11 5.96 6.81 6.61 6.8 5.8 4.81 4.3 4.25 4.65 2.79 4.41 4.35
ik
10310 10203 8211 8346 9053 8878 8540 10446 11018 11162 12438 13576 14029 16746 11084
Pedernales 01 MOAN Amp tins 111111 Per ship At bertIV neap anise Time (in days)
1.61 1.31 1.50 1.33 1.61 1.45 1.12 1.32 2.57 3.14 2.86 2.12 1.06 1.15 1.09
Output Per dip berth day Oa tens)
37981 46611 41091 48552 36474 41120 37053 42716 41335 51584 53925 5386 56037 51489 55116
Source: Annual Academic Report 1990-91 to 2004-05.
2 ) Cargo ships handled: There was a decline in the number of cargo ships
handled by the Port during 1994 - 95 due to storm and power restrictions; in 1995
- 96 due to non working time of 24 hours due to strike / work stoppage and in
1998 - 99 due to go - slow tactics and one day strike adopted by the employees.
However from 1999 - 2000 onwards the Port has obtained rise in cargo ships
handled and are shown in the Table 5. 2. 3.
175

Table 5. 2. 3. Number of Cargo Ships Handled at MPT
Year Cargo Ships Handled
1990-91 445
1991-92 469
1992-93 633
1993-94 721
1994-95 636
1995-96 637
1996-97 Na
1997-98 608
1998-99 483
1999-2000 505
2000-2001 588
2001-2002 597
2002-2003 626
2003-2004 677
2004-2005 699 Source: Annual Administrative Report of MPT, 1990 — 1991 to 2004 - 2005.
As a part of modernization of the Port, Vessel Traffic Management System
(VTMS ) has been installed for safe maneuvering of ships inside the port.
3 ) Annual Traffic Trend: Table 5. 2. 4. depicts the trends in quantity of exports and
imports carried out through this Port.
176

Table 5. 2. 4 Annual Traffic Trend
(Quantity in Lakh Tonnes) Year Total Exports Total Imports
1990-91 131.89 12.77
1991-92 127.02 15.01
1992-93 139.20 16.44
1993-94 161.82 15.13
1994-95 161.49 19.40
1995-96 152.76 102.58*
1996-97 153.61 17.61
1997-98 192.06 19.58
1998-99 154.60 25.36
1999-2000 149.29 32.58
2000-2001 159.38 35.74
2001-2002 183.09 46.00
2002-2003 192.69 43.80
2003-2004 234.06 44.68
2004-2005 25028 56.31 NB: * includes 83.10 lakh tonnes iron ore unloaded at MOHP ( Berth No 9 ) Source: Annual Administrative Report of MPT, 1990 - 1991 to 2004 - 2005.
During the decade 1991 - 2001, according to the management, an all time record
traffic of 21.18 million tonnes and growth rate of 22.35 % over the previous year
and against the ministry target of 18 .00 million tones was achieved in 1997 - 98
due to clear objectives, proper planning, wholehearted cooperation and support
from the trade, labour and devotion and zeal of workers.
4) Average Labour Productivity: Rise in the labour productivity has been witnessed
by the Port as depicted in the Table 5. 2. 5.
177

Table 5. 2. 5 Labour Productivity: Average productivity ( tones)
Shore lab product-ivity
1990
-91
1991
-92
1992
-93
1993
-94
1994
-95
1995
-96
1996
-97
1997
-98
1998
-99
1999
-2000
2000
-01
2001
-02
2002
-03
2003
-04
1Break Bulk:
99 98 90 84 - Imp nil
Exp 117
(a) Metals, Iron & Steel, HR Coils
14.19
2.25
18.7 18.3 33.3 35.5 28.9 56.7
(b) Bagged Cargo
- - 4.5 5.0 5.2 5.8 5.1
2. Dry Bulk:
85 92 103 127 Imp 223
Exp 185
(a)
Food grains
- - - - - - -
(b) Ores - - - - - - -
(c) Fertilizers
0.75 0.4 - - - - -
(d) Fer.- Raw ms
- - - - - - -
(e) Coal/
Coke
- - - - - - -
3. Cont- ainers:
- 0.5 0.3 0.4 0.46 1.09 12
In terms of TOES
- 0.04 0.0 0.04 0.05 0.05 0.01
In terms of boxes
- 0.03 0.00 0.03 0.04 0.04 0.01
178
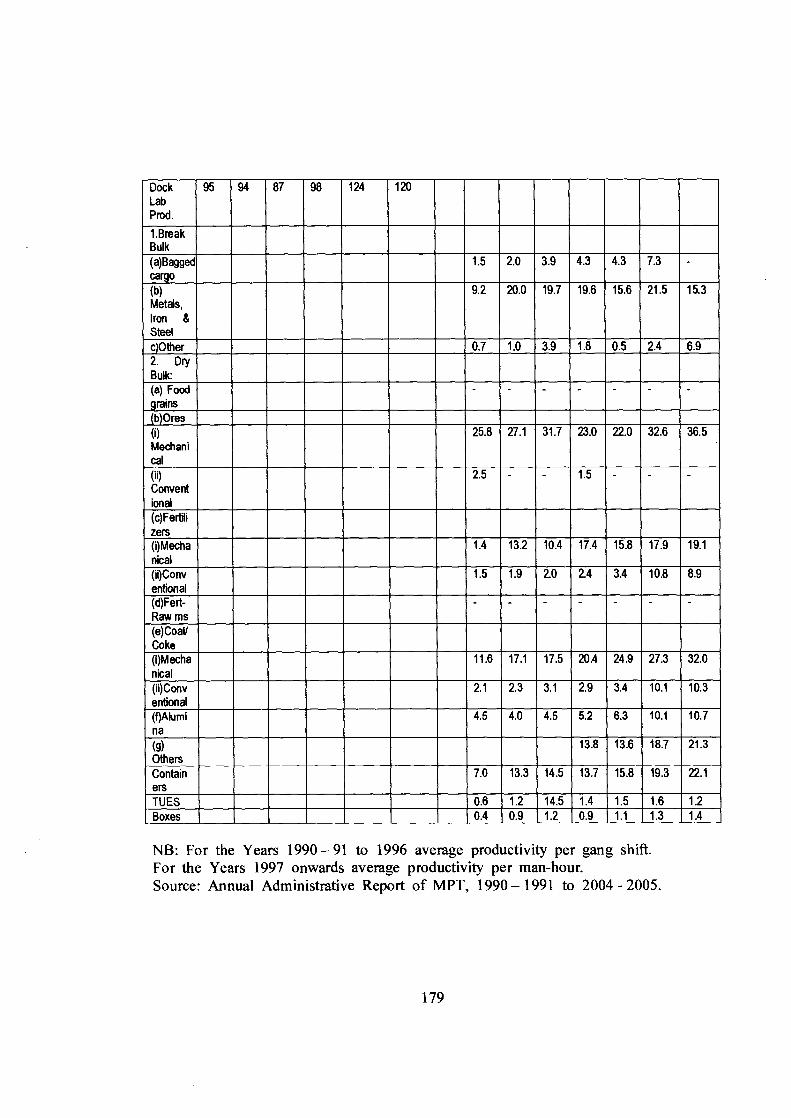
Dock Lab Prod.
95 94 87 98 124 120
1.Break Bulk (a)Bagged cargo
1.5 2.0 3.9 4.3 4.3 7.3 -
(b) Metals, Iron & Steel
9.2 20.0 19.7 19.6 15.6 21.5 15.3
c)Other 0.7 1.0 3.9 1.8 0.5 2.4 6.9 2. Dry Bulk: (a) Food grains
- - - - - - -
(b)Ores
(i) Mechani cal
25.8 27.1 31.7 23.0 22.0 32.6 36.5
(i) Convent Tonal
2.5 - - 1.5 - - -
(c)Fertili zers (i)Mecha nical
1.4 13.2 10.4 17.4 15.8 17.9 19.1
(ii)Conv entional
- 1.5 1.9 2.0 2.4 3.4 10.8 8.9
(d)Fert- Raw ms
- - - - - - -
(e)Coal/ Coke (i)Mecha nical
11.6 17.1 17.5 20.4 24.9 27.3 32.0
(ii)Conv entional
2.1 2.3 3.1 2.9 3.4 10.1 10.3
(f)Alumi na
4.5 4.0 4.5 5.2 6.3 10.1 10.7
(g) Others
13.8 13.6 18.7 21.3
Contain ers
7.0 13.3 14.5 13.7 15.8 19.3 22.1
TUES 0.6 1.2 14.5 1.4 1.5 1.6 1.2 Boxes 0.4 0.9 1.2 0.9 1.1 1.3 1.4
NB: For the Years 1990 - 91 to 1996 average productivity per gang shift. For the Years 1997 onwards average productivity per man-hour. Source: Annual Administrative Report of MPT, 1990 - 1991 to 2004 - 2005.
179

Both the unions at MPT agreed that cooperation with the management in its
efforts to enhance productive efficiency was an important function of the unions.
The management too applauded the labour and its unions for cooperative labour
relations orientation and its role in improving productivity.
With regard to MPRWU, the management recognized valuable services rendered
by the present President of the union, for offering valuable and constructive
suggestions for improving the productivity of dock labour, actively taking up issues
affecting the port employees and for readiness to sort out across the table in a
very amicable atmosphere. The dock labour earned only Rs.4000 to 5000 as wages
per month, which after taking over as Trustee and as union leader, he introduced
the incentive scheme based on productivity which now enables the workers to earn
up to Rs.20000 to 25000 per month. The union has taken following steps in
cooperation with the management in raising productivity: 1 ) No stoppage of work
even during non reporting of reliever in the subsequent shift. 2 ) In the cargo
handling department, management has to provide transport to report for duties
after booking of the staff. 3 ) Suggested that due to privatisation, transport has
been taken away and this causes decline in productivity. Recently the union
signed a settlement to bring down the cost of operation and to improve labour
productivity through training and updating knowledge of gang workers. The union
representatives to the production committee discuss shortfalls, causes, mal-
functioning / labour flaws, etc.
180
The union leaders encourage its members to participate in the training courses
conducted by the management. They also stress that its members participate in the
two training courses conducted every year by its Federation.
In addition, the union in cooperation with the management made efforts to reduce
absenteeism to improve productivity of its members. Sickness — own / family,
family problems and social and religious causes were the major causes of
absenteeism. The unions advised the members on the benefits of regularity at
work and the ill effects of absenteeism to the labour and its productivity through
Circulars and Gate Meetings. They also paid visits to the homes of the regular
absentees and convinced them to join work at the earliest. Union cooperation and
management efforts have enabled MPT in the lowering of absenteeism rate from
5 - 10 % during initial years of liberalization to 0.5 % in 2004 - 05. During
2004 - 05, 1177 sick certificates were issued which implied loss of 7503 days of
work and an average loss of 637 days per certificate as compared to 2592 sick
certificates with 22679 loss of days and an average of 8.75 days lost per
certificate in 1993 - 94.
( c ) WORK CONDITIONS: With regard to fixing the length of the work - day
and breaks, MPRWU favoured increasing daily working hours to meet the
required hours of work. At present they have settled for two five days week and
two six days week for clerical, one hour lunch break for office staff and sub-
181

sections while shift workers have built - in break timings. Improving service
conditions have always been one of its priorities. GPDEU was actively involved
with fixing the length of the workday and breaks as per the standing orders, shift
changes and improvements in the work conditions. It accepted additional workload
only if the workers were provided with incentives. The union is of the opinion
that the facilities provided for workers and the physical work-environment was
satisfactory and felt that the management was cooperative in nature.
( d ) OTHERS: i ) Job Security: GPDEU provides 100 % job security to its
members according to its President. The union was successful in reinstating three
termination cases. The union does not interfere with the employment policy of the
unit but takes up grievances on matters regarding compensatory appointments. It
objects transfers with low incentives but allows transfers only under malpractice.
The MPRWU also provides job security to regular employees except those
involved in disciplinary action, disobedience, thefts or other criminal cases. The
union deals with maintaining seniority, wrong fixation as well as cases arising
out of long absenteeism. Since 1991 — 2005 no worker has been retrenched at
MPT.
ii) Safety: Higher the number of accidents lower will be the safety of workers.
Table 5. 2. 6 depicts the picture regarding accidents at MPT during 1991 - 2005.
182

Table 5. 2. 6 Particulars of Accidents: Causation & Number:
Year Striking against objects
F NF PN PN
Falling of objects
F NF PN PN
Wrong movem ent
F NF PNPN
Caught in between
F NF PNPN
Person falling
F NF PN PN
Contact with electric Current
F NF PN PN
Run over
F NF PN PN
Others
F NF PN PN
Total
P N
1990- -- 3 1 - --4 - - - - - - 1 - - 1 - - - - - - - - - - - - - - 4 6 91
92 1992- - - 1 4 - - - 3 - - 1 - - - - 1 - - - 1 - - - - - - - - - - 1 - 3 9 93 1993- - - - 7 - - - 5 - - 1 4 - - - 3 - - 1 3 - - - 1 - - - - - - - 1 2 24 94 1994- - - 1 3 - - - 5 - - 3 3 - - - 1 - -4- - - 5 - - - - - - 2 - - 13 14 95 1995- -- 5 - -- 2- -- 4- -- 7- - 1 26 --10- - - - - - - 3 - 33 7 96 1996- - - 4 1 1 - 8 - - - 2 - 1 - 1 1 - - - 1 - - 7 - - - - - 1 - 1 - 26 3 97 1997- -- -- - - 1 - --24- - - 4- -- 1- - - - - - - 1 - -- 1 - 32 - 98 1998- - - 12 - - - 1 - - - - - - - 2 - - - 5 - - - - - 1 - - - - - 1 - 22 - 99 1999- - - 5 - - - 1 - - - 1 - - - 2 - 1 - 6 - - - 1 - - - - - - - - - 17 - 2000
01 2001- - - 2 - - - 3 - - - - - - - 1 - - - 6 - - - 1 - 1 - - - - - 2 - 16 - 02 2002- 1 - 4 - - - 1 - - - - - - - 4 - 1 - 4 - 1 - 2 - - - - - - - - - 18 - 03 2003- 1 - 8 - - - 2 - - - - - - - 1 - - - 2 - - - 1 - 1 - - - - - - - 16 - 04 2004 — - - 3 - - - 1 - - - - - - - 2 - - - 4 - - - 3 - - - - - - - - - 13 - 05
NB: F = Fatal NF = Non-Fatal P = Port Area N = Non-Port Area Source: 1. Annual Administrative Report of MPT, 1990 — 1991 to 2004 - 2005.
2. Primary data collected through Interview with the Safety Officer.
It is evident from the figures given in the Table 5. 2. 6 that from 1997 - 98
onwards there were no accidents reported at the Non Port Area. Striking against
objects, falling of objects, caught in between and persons falling are yet major
183

causes of accidents at the Port Area. Since 1998 — 99 onwards the number of
accidents at Port Area also have declined. According to both the unions, the
management was reasonable in its provision for accidents and prevention of
occupational diseases but many workers were not making use of the safety
devices and hence the unions took interest in educating the workers regarding
safety measures and by actively participating in the Safety Week, displaying
posters and deputing two of its members for safety training every year.
Two representatives from each union were appointed to the safety committee since
1980 and from 2005 five representatives were appointed.
Table 5. 2. 7 Employees' Views regarding Job Security and Safety Devices
Sr. No Item MPRWU GPDEU 1. Job Security
Present 96.9 96.8 Absent 3.1 3.2
No response - - 2. Safety Devices
Satisfactory 84.6 71.4 Unsatisfactory 1.5 11.1 No response 13.8 17.5
3. Met with an Accident Yes 15.4 14.3 No 84.6 85.7
4. Confidence in Leader Yes 55.4 100.0 No 30.8 -
Partly 7.6 - No Response 6.2 -
Source: Based on Primary data collected through Employee Questionnaires.
The Table 5. 2. 7 clearly shows that 96 % of the members of both the unions felt
their jobs to be secure. According to MPRWU, 84 % were satisfied with safety
184

devices and had never met with an accident at work but only 55 % had
confidence in the union leader. With reference to GPDEU, even though only
71 % were satisfied with safety devices and about 14 % had met with an accident
at work, all the members had confidence in their leader.
II. Social Impact:
The unions at MPT also performed the following social functions:
(a) HEALTH AND WELFARE: As a measure to promote health of the workers,
the management runs a 100 bedded hospital, a first aid center, a primary health
center, conducts periodic health check-ups, health camps, educative programmes,
medical benefits after retirement, counseling etc.
With reference to promotion of health, the role of the two unions at MPT can be
summarized as follows:
GPDEU contributed towards the promotion of health facilities in the following
ways:
taking up cases with referral to other hospitals for specialized treatment -
TATA, KAD Belgaum.
demanded amendment of medical regulations.
staged demonstrations for removal of garbage.
objected to the contributive medical benefits scheme for pensioners and
asked for free treatment.
185

While MPRWU
amended medical attendance regulations to enable patients to go for
specialized treatment outside the state.
extended the family benefits to in-laws as well.
disabled children of employees brought under medical benefits. ( until death)
demanded provision of medical benefits after retirement.
Secondly, The Port Administration continued its efforts to better welfare amenities
to the employees and extend assistance in promoting the all-round growth of
employees and their families. It runs primary, secondary and high secondary
schools, vocational center, provides scholarships, housing, canteens, transport
facilities; the expenses on which are shown in Table 5. 2. 8
186

Table 5. 2. 8 Break up of total expenses on welfare measures (in Rs. Crs)
Year Exp on Hospital
Bus trans
Transport re-
imburse ment
Welfare expenses
(from welfare Fund)
Scholarships/ eduatiowi
fees/welfare/ grants/sport]
small fly incentive/ welfare
buildings,etc.
Mainte nance of staff
quarters
LTC Subsidy to Canteen
TOTAL
1990- 270.53 91
1991- 332.70 92
1992- 431.436 93
1993- 495.704 94
1994- 45.40 11.74 63.49 57.35 9.46 1.98 189.42 95
1995- 48.27 9.41 69.67 68.74 6.30 2.19 204.58 96
1996- na na na na na na na na na 97
1997- 333.44 58.23 35.35 3.55 166.24 127.33 9.17 2.41 736.85 98
1998- 391.68 64.69 - 3.74 189.27 141.77 31.95 3.04 861.63 99
1999- 478.47 63.83 35.23 15.00 162.75 190.06 36.05 4.93 986.92 2000
2000- 620.60 89.93 73.42 3.88 148.83 141.53 15.08 7.32 1100.44 01
2001- 613.86 90.05 - 7.18 128.87 8.15 848.11 02
2002- 640.60 99.23 - 6.78 348.86 8.30 1103.77 03
2003- 648.73 94.39 - 8.05 311.56 7.74 1070.47 04
2004- 600.97 80.00 - 5.00 300.89 12.0 1100.83 05
Source: Annual Administrative Report of MPT, 1990-1991 to 2004-2005.
Regarding MPRWU, since 1990-95, three members were appointed as
representatives to the welfare committee but during 1995-2004 no representative
187

was appointed. However from 2005 one union representative was appointed to this
committee. In addition it tried to settle family problems, provided guidance on
loans and its payments, counseling services, visited families of its members and
conducted widow remarriages ( six members ).
GPDEU had no representation to the welfare committee and yet it tried to
promote welfare of its members. It brought award of scholarships from Jawaharlal
Nehru Port Trust and also introduced Tuition Fee Re-imbursement based on
Tuticorin Port Trust.
(b) STANDARD OF LIVING: The unions worked to improve the standards of
living of its members and their families by raising wages and allowances,
productivity linked incentives and demanding provision of better housing, health,
transport, education and recreational facilities by the management.
(c) ENVIRONMENT / AREA DEVELOPMENT PROGRAMME: The Port have
adopted several measures for the improvement of the environment within the
operational areas such as a) Creation of special Cell to monitor the level of
pollution. b) Plantation of 1000 samplings on the periphery of the Port Security
wall, to trap dust. c) Wet dust suppression system. d) Regular spraying of water on
roads. e) Mechanical road sweeper. f) Covering of all trucks and rail wagons during
transportation of cargo out of the port. g) Introduction of sprinkling towers.
188
The unions too showed an increasing interest in caring for the environment.
GPDEU held dhamas for environment cleaning while the leader of MPRWU was
appointed as a member of the Port Operating Group that discussed issues like
cleanliness, hygiene, environmental issues and suggested measures for its
improvement.
5.3 SOCIO-ECONOMIC IMPACT OF TRADE UNIONS AT GOA
SHIPYARD LIMITED:
I. Economic Impact
( a ) WAGES: Goa Shipyard Kamgar Sangh ( GSKS ) was represented in the
Wage Board and demanded that every allowance should be increased at least by
20 %. Goa Shipyard Kamgar Ekvott ( GSKE ) was not represented in the Wage
Board yet according to its President, it successfully pursued HRA / CCA issue
with the Central Government.
189

Table 5. 3. 1 Employees Views on Wages
Sr. No Item GSKS GSKE 1. Present Wage Rate
Satisfactory 8.7 45.5 Unsatisfactory 87.0 54.5 No response 4.3 -
2. Present Emoluments
Satisfactory 8.7 54.5 Unsatisfactory 87.0 45.5
No response 4.3 - Source: Based on Primary data collected through Employee Questionnaires.
Table 5. 3. 1 depicts that less than 10 % members of GSKS were satisfied with
the wage rate and emoluments earned. While around 45 % members belonging to
GSKE found the wage rate to be satisfactory and an equivalent percent found
emoluments to be unsatisfactory.
The employees however asserted that the respective unions were making efforts to
improve their wages. About 78.3 % members belonging to GSKS and 72.7 %
belonging to GSKE expressed satisfaction with the steps taken by the union for
ensuring wages and job security.
Majority of the members of both the unions felt that the wage rate and
emoluments were highly unsatisfactory but believed that their respective union
leaders would succeed in securing improvements in the same in the near future.
( b ) PRODUCTIVITY: A rising trend was found from 2000 onwards in terms of
productivity at GSL as shown in Table 5. 3.2.
190

Table 5. 3. 2 Productivity at GSL during 1991-2005.
Year Production (Rs in lakhs) 1991-92 8589 1992-93 10638 1993-94 13308 1994-95 15695 1995-96 16198 1996-97 17745 1997-98 11131 1998-99 7865
1999-2000 10928 2000-2001 19000 2001-2002 22043 2002-2003 23214 2003-2004 200.33 (crs) 2004-2005 141830 (crs)
Source: Primary data collected through Management Questionnaire.
The table shows that the productivity at GSL had decreased during 1997-2000.
One of the major reason was the strike and lockout. After 2000 onwards it
depicted an upward trend Although the figures for 2004-05 showed a downward
trend, it was because of non-completion of the work and not due to decline in
productivity. According to the management, high levels of productivity have been
achieved mainly due to absence of major industrial disputes like strikes and as a
result of cooperation of the unions with the management in achieving its targets.
GSKS was awarded " Special Commendation " Award in 2004 for helping in
increasing the speed of work. Earlier six plates were being cut, but with the
cooperation of the union and its members it managed to cut eight plates per day.
The union suggested increase in work / two shifts and avoidance of double work.
The union also supported technological change and improvement in quality and
191

productivity. The union was of the opinion that excess of family expenditure,
deductions, lack of overtime, heavy loans make workers take up alcoholism which
happens to be a common cause of absenteeism at GSL. To reduce absenteeism
and improve productivity of its members, if the worker continues to be absent in
the second week, the office bearers along with the management committee visit
the worker's residence, meet his family, discuss his grievances and try to
convince the worker to join work at the earliest.
GSKE cooperated with the Welfare Officer in the Employees' Assistance
Programme as a measure to check absenteeism. In the opinion of its President,
the union made efforts in co-operation with the management to raise productivity,
as it was considered to be one of its function as well.
( c ) WORK CONDITIONS: Even though one of the union expressed that the
management satisfactorily catered to the legitimate physical, medical and
psychological needs of the workers, the other union negated the same and
demanded improvement of working conditions at GSL, as majority of its
members found most of them to be unsatisfactory.
( d ) OTHERS: i) Job Security: GSKS gave first preference to promotion policy.
Secondly it suggested appointment of tradesmen / new employees to fill the 500
vacant posts caused by VRS, which at present are being filled by contract
workers. GSKE succeeded in reinstating a worker who was dismissed even though
192

the worker was not its member. No worker has been dismissed because of
absenteeism.
ii) Safety: GSKS demanded goggles, hand gloves, helmets, shoes and training of
batches of workers in first aid and safety.
GSKE got the management to appoint the Promotion Policy Review Committee.
The union opines that the management has not been reasonable in its provision
for accidents and prevention of occupational diseases. The union gave more
emphasis to provision of Safety training and First aid workshops.
Table 5. 3. 3 Number of Accidents, Workers involved and Man days lost
during 1991-2005.
Year No.of accidents No. of workers involved No. of man days lost 1991 5 5 59 1992 6 6 74 1993 8 7 132 1994 8 9 109 1995 27 26 662 1996 14 21 303 1997 10 6 69 1998 9 9 202 1999 27 21 411 2000 27 32 490 2001 23 26 399 2002 22 26 371 2003 8 9 160 2004 17 16 199 2005 25 (upto Oct) 25 290
Source: Primary data collected through Management Questionnaire.
It is evident from the Table 5. 3 .3 that there were greatest number of accidents recorded
during 1995 with a loss of 662 man days. Equivalent number of accidents were
reported in 1999 and 2000 ( but with less man days lost ) followed by a decline
in number but shows a rise from 2004 onwards.
193

Table 5. 3. 4 Employees' Views regarding Job Security and Safety Devices
Sr. No Item GSKS GSKE
1. Job Security Present 82.6 95.5
Absent 13.0 4.5
No response 4.3 -
2. Safety Devices Satisfactory 78.3 68.2
Unsatisfactory 21.7 31.8
3. Met with an Accident Yes 8.7 40.9
No 91.3 59.1
4. Confidence in Leader Yes 82.6 100.0
No 17.4 -
Source: Based on Primary data collected through Employee Questionnaires
Table 5. 3. 4 shows that 82 % members of GSKS were of the opinion that job
security was prevalent and had confidence in their leader while 21 % members
were unsatisfied with the safety devices although less than 10 % had met with an
accident at work place. Secondly, 95 % members of GSKE felt their jobs to be
secure. About 40 % members had met with an accident at work place and only
68 % were satisfied with the safety devices and hence felt unsafe but all
members had confidence in their leader.
194
II. Social Impact
( a ) HEALTH AND WELFARE: GSKS demanded a common Medical Scheme for
workers and supervisors. It advised its members on Aids and its preventive
measures. In addition it suggested health awareness programmes and reduction of
oily stuff served at the canteen as on an average the workers are above 40 yrs of
age and face cholesterol problem. Under the Death Benefit Welfare Fund, the
family of the deceased gets Rs. 20,000 for which the worker contributed Rs. 4/-
per month. The union suggested that it was ready to contribute Rs. 8/- and the
benefit should be raised to Rs. 40,000. The union also advised its members on the
provident fund and pension benefits.
The president of the union has worked as the Director of the Cooperative Store
and at present as its Vice-President. As a chief promoter of the Co-operative
Credit Society, he took the initiative to register the same in 1986 and has been
working continuously as its Secretary for the last 10 years.
Although GSKE did not conduct any welfare activity for the workers, its
President proudly asserts that most of the welfare measures present at GSL were
demanded by the union and got implemented by the management. Its demands
included Child education allowance, Dispensary, Workers' education programmes,
In-house training related to workers' trade.
( b ) STANDARD OF LIVING: In the opinion of GSKS, the standard of living
differed between workers due to the difference in skill, wages and consumption
levels.
195

Both the unions paid special attention to advising its members regarding reduction
in consumption, being regular to work, giving up alcoholism. It also demanded
improvement in wages, health and welfare amenities, educational facilities provided
by the management so as to improve the status of its members and their families
as well.
( c ) ENVIRONMENT / AREA DEVELOPMENT PROGRAMME: GSKE actively
participated in the Civic administration. It took up the clearing of the nullah and
also the initiative to sponsor the road divider at Swatantra path by the GSL was
initiated by SEU, its parent union.
5.4 SOCIO-ECONOMIC IMPACT OF TRADE UNIONS AT COLFAX
PRIVATE LIMITED:
I. Economic Impact
( a ) WAGES: The union signed the settlement every three and a half years with
improvement in basic wage and revision of allowances. The union leader opined
that the salary of the workers was pretty high compared to the skill of the
workers. He further stated that the increase in the average wages earned by the
workers were the result of union demand with the management.
196

Table 5. 4. 1 Employees' Views on Wages:
Sr. No Item GMS
1. Present Wage Rate
Satisfactory 100.0
Unsatisfactory -
2. Present Emoluments
Satisfactory 83.3
Unsatisfactory 16.7
Source: Based on Primary data collected through Employee Questionnaires.
Table 5. 4. 1 shows cent percent union members satisfied with the wages and over
80 % satisfied with emoluments earned.
In fact, all the members of Gomantak Mazdoor Sangh ( GMS) were content with
the steps taken by the union for ensuring wages and job security.
( b ) PRODUCTIVITY: The union's contribution towards increasing productivity
was by maintaining discipline and believed in survival of the firm as the utmost
concern of the union.
197

Table 5.4.2 Production at Colfax from 1991-92 to 2000-01. (in Units Product 91-92 92-93 93-94 94-95 95-96 96-91 91-98 98-99 99-00 00-01
OS ASL40m1 (0) 0 0 204383 119482
0 0 950766 72311 206519 0 0 0 OS ASL50m1 (0) 186099 214995 216245 130655 131948 754594 913204 1007304 961168 OS ASL50m1 (L) 91568 198659 204900 58143 0 0 0 0 0 OS ASL5001 (II) 149448 183402 195261 207758 70348 0 0 0 0 0 OS A525001 (0) 14351 0 0 0 0 0 0 0 0 0 OS ASA5001 (L) 49239 0 0 0 0 0 0 0 0 0 OS ASA5001 (M) 24539 0 0 0 0 0 0 11 0 0 OS ASAII0m1 (M) 5851 20980 0 0 0 0 0 0 0 0 OS A5A100m1 (0) 850984 606920 757819 1025656 1342236 1504912 491912 526578 281017 242429 OS AS11110m1 (0) CP-MVP 0 584354 0 0 0 0 0 0 0 146419
OS ASL1000 I (L) 269708 254093 281379 333215 843602 331624 269719 157854 175313 159174 OS ASL100.1 (L) CP-MMP 0 211104 0 0 0 0 0 0 0 79788 OS ASLMOml (M) 233512 286792 291752 292463 483037 388340 230231 157848 171037 99905 OS ASL10001 (Al) CP-MMO 0 183744 0 0 0 0 0 0 0 57366 OS ASL12001 (0) 1294114 51391 83908 88191 122929 21916 21596 0 0 0 OS A5L12001 (L) 81149 63645 42720 35271 0 0 0 0 0 0 OS ASL12001 (M) 90425 64769 61864 32687 0 0 0 0 0 0 OS ASL12001 (0) 41642 143313 82368 89635 47703 65340 46497 27387 23044 0 OS ASAl2001 (L) 54680 115600 32800 1800 0 0 0 0 0 0 OS 86Al20m1 (M) 11214 133187 67114 9698 0 0 0 0 0 0 OS Shampeo12001 30052 47041 5864 OS Shampse20001 57163 25842 31811 OS ASL15m1 (0) 192872 15600 0 0 0 0 0 0 0 0 OS Cologne 5041 (I) 39433 0 0 0 0 0 0 0 0 0 OS Mine 120m1(0) 0 3244 0 0 0 0 0 0 0 0 OS Cologne 120 ml (L) 0 555 0 0 0 0 0 0 0 0 OS Cologne 12001 (M) 0 484 0 0 0 0 0 0 0 0 OS Cologne Atomiser 5061(0) 0 15235 0 0 0 0 0 0 0 0 OS Wages Atomiser 5001(U 0 0 12496 0 0 0 0 0 0 0 OS Cologne Atomiser 5001(M) 0 11404 0 0 0 0 0 0 0 0 OS After Shave Metstudser 12001 132698 0 0 0 0 0 0 0 0 0 OS LSC 30 ps (0) 711536 680323 964450 784399 2083142 2151055 3127925 2230276 1987858 2162181 OS LSC 30 ps (I.) 561431 502800 664119 184167 433194 0 0 0 0 9 OS LSC 30 ps (M) 391186 361247 538319 0 0 0 0 0 0 0 OS LSC 70 ps (0) 2117032 1085188 2036505 1005566 2494596 3537190 2195570 1399952 2765808 1679137 OS LSC 70 ps (L) 107991 855025 880505 805029 1328941 1587470 1639244 954525 1767812 876763 OS LSC 70 pa (M) 571086 229373 619340 846180 445079 0 0 0 0 0 OS LSC 125 ps (0) 23283 87843 24929 9181 0 0 0 0 0 0 OS LSC 25 ps (0)CP 0 5760 0 0 0 0 0 0 0 0 OS LSC 25 ps (M)CP 0 63555 0 0 0 0 0 0 0 OSLSC 10 ps (0) 0 9114122 0 0 0 0 0 0 0 0 OS LSC Bulk (in Kg). 0 0 0 0 14850 27685 0 0 0 0 OS Nair Cream 30 ps 0 46089 48848 0 0 0 0 0 0 0 OS Hair Cream 100 ps 23443 4383 7 0 0 0 0 0 0 0 OS Hair Cream 140 Ems 51707 95266 109503 102207 7239 0 0 0 0 0
OS BT10 ps (0) 283872 0 0 0 0 0 0 0 0 0 OS BT 140 ps(0) 80781 0 0 0 0 0 0 0 0 0
OS BT 400 ps(0) 157022 0 0 0 0 0 0 0 0 0
OS 81 100 m(L) 10943 0 0 0 0 0 0 0 0 0 OS BT 400 ps(L) 155614 0 0 0 0 0 0 0 0 0 OS BT100ps(M) 120095 0 0 0 0 0 0 0 0 0
N.B: 0 = original, L = lime, M = musk, ASL = after shave lotion, ASA = after shave atomiser, LSC = lather shaving cream, WWS = white water shave Source: Primary data collected through Employer / Management Questionnaires.
198

Table 5. 4. 3 Production at Colfax from 2001-02 to 2005-06. in Units
Product 01-02 02-03 03-04 04-05 05-06 OS AS140m1 (0) 0 0 0 0 0 OS ASL50m1 (0) 803684 348917 333087 266101 169477 OS ASL50m1 (L) 0 101384 241544 211241 143921 OS ASL50m1 (I) 0 11330 210841 65328 109106 OS ASL100m1 (0) 203515 223848 338738 129810 24585 OS ASL100m1 (0) CP-MNP 13929 0 0 0 0 OS ASL100m1 (L) 88263 161644 103708 16668 1205 OS ASL100m1 (L) CP-MMP 38694 0 0 0 0 OS ASL100m1 (N) 85102 169311 93410 9039 1109 OS ASL100m1 (I) CP-MMO 38694 0 0 0 0 OS ASL150mI (0) 0 0 0 1450 2344 OS ASL150m1 (L) 0 0 0 1450 1116 OS ASL150m1 (II) 0 0 0 1450 1516 OS ASA150m1 (0) 0 0 0 8099 2880 OS ASA150m1 (L) 0 0 0 6913 1728 OS ASA160m1 (N) 0 0 0 6912 2261 OS Shampee120m1 0 0 0 0 0 OS Shampoo200m1 0 0 0 0 0 OS ASL 15ml (0) 0 0 0 0 0 OS Cologne 50m1 (N) 0 0 0 0 0 OS Cologne 120m1 (0) 0 0 0 0 0 OS Cologne 120 nil (L) 0 0 0 0 0 OS Cologne 120m1 (N) 0 0 0 0 0 OS Cologne Atomiser 50n1(0) 0 0 0 0 0 OS Cologne Atomiser 60m1 (L) 0 0 0 0 0 OS Cologne Atomiser 50m1 (N) 0 0 0 0 0 OS After Shave Moisturiser 120m1 0 0 0 0 0 OS Lather Shaving Cream 30 gins (0) 1519868 1255834 1254314 1610234 915086 OS Lather Shaving Cream 30 gins (L) 0 286543 619851 714191 798209 OS Lather Shaving Cream 30 gms (M) 0 219445 551122 121441 139345 OS Lather Shaving Cream 10 gms (0) 1129846 1386541 1130316 1782151 990581 OS Lather Shaving Cream70 gms (1) 198258 874082 112070 1081295 805205 OS Lather Shaving Cream 10 gins (1) 0 325367 321850 822166 642202 OS Lather Shaving Cream 70 gnu (0) Twin Pack
0 0 0 0 104662
OS Lather Shaving Cream 10 gins (L) Twin Pack
0 0 0 0 63621
OS Lather Shaving Cream 10 gms (M) Twin Pack
0 0 0 0 58212
XI Lather Shaving Cream 10 gins (N) 140008 338 0 0 0 XM ODIN Lather Shaving Cream 70 gms 77422 0 0 0 0 OS Lather Shaving Cream 5 gms (0) 0 0 0 226402 0 OS White Water Shave Gel 100 gins 0 0 0 381586 0 OS White Water Shave Gel 30 gins 0 0 0 0 403905 OS White Water Shave Gel 5 gms 0 0 0 0 208193 OS Shave Gel 60gms (0) 0 0 0 113980 80293 OS Shave Gel 60gms (L)
0 0 0 0 14438
OS Shave Gel 60gms (M)
0 0 0 0 104432
N.B: 0 = original, L = lime, M = musk, ASL = after shave lotion, ASA = after shave atomiser, LSC = lather shaving cream, WWS = white water shave Source: Primary data collected through Employer / Management Questionnaires.
199

It is evident from the Table 5. 4. 2 and Table 5. 4. 3 that only six products
namely: OS ASL 50 ml (0); OS ASL 100 ml (L); OS ASL 100 ml (M); OS LSC
30 gms (0); OS LSC 70 gms (0); OS LSC 70 ml (L) have been continuously
produced since 1991-92 to 2005-2006.
Secondly, it is evident that many products were stopped being produced after
1993-1994 and from 2005-2006 new products were produced. Thirdly, the
production of all the six continuously produced products declined during 2005-
2006 and that the decline was greater for Lather Shaving Creams compared to
After Shave Lotions as shown in Chart 5. 4. a.
Products showing continuous production (1991-2006)
4000000 3500000
S 3000000 2500000
5 2000000 3 1500000
1000000 500000
0
Froduct
—is-- OS ASL5Orri (0)
OS ASL100ni (L)
OS ASL100ni (M)
--is— OS Lather Shaving Cream 30 vs (0) OS Lather -Nlaving Cream 70 gms (0) OS Lather shaving Cream70 gms (L)
Year
Chart 5.4.a
200

According to the management, the decrease in production did not imply fall in
the productivity or efficiency of labour but was caused by severe competition and
lack of demand for the products.
( c ) WORK CONDITIONS: Sixty percent of the negotiations by the union were
related to the prevailing working conditions.
( d ) OTHERS: I) Job security: The union is presently representing two cases in
court. Secondly the union sees that after ten years of service the workers are
entitled for promotion and in cases where workers performed high quality work
are immediately promoted.
ii) Safety: The union was satisfied with the provision of measures regarding
accidents and occupational disease prevention by the management.
Table 5. 4. 4 Employees' Views regarding Job Security and Safety Devices
Sr. No Item GMS 1. Job Security
Present 100.0 Absent -
2. Safety Devices Satisfactory 95.8
Unsatisfactory 4.2 3. Met with an Accident
Yes 29.2 No 70.8
4. Confidence in Leader Yes 87.5 No 12.5
Source: Based on Primary data collected through Employee Questionnaires.
201

It is evident from Table 5. 4. 4 that 30 % of the members had met with an
accident during work, 95 % were satisfied with safety devices and 87 % had
confidence in their leader. During 1994 blast at the unit caused the death of 6
workers. The union attended the funeral by representation and kept the unit
functioning and paid one day extra payment to the deceased family. The union
saw that compensation as well as job to the deceased family member was
provided by the management.
II. Social Impact
According to the General Secretary of GMS, it restricted its functioning to the
economic aspects only, as the social measures were found to be satisfactory at the
unit and indirectly tried to improve the status of its members.
5.5 SOCIO - ECONOMIC IMPACT OF TRADE UNIONS AT
CIBA SPECIALTY CHEMICALS ( INDIA) LIMITED
I. Economic Impact
( a ) WAGES: The management refused to negotiate with the R. J. Mehta's union
and agreed to negotiate only with a new union. This led to the formation of
Kamgarancho Ekvott (KE) as the new union at Ciba in 2000, with which the
management signed an agreement of wage settlement for a period of nine years.
This settlement consisted of yearly wage increase of Rs.3000 during the first three
202

years, followed by another yearly wage increase of Rs.3000 during the next three
years and a further yearly wage increase of Rs.3000 during the last three years
against the management proposal of yearly settlement of wage increase of Rs.1500
every year. Thus the union have obtained Rs.9000 wage increase for the members
through its negotiations with the management.
Major settlements were signed by the union after every five years. The union
objected any wage reduction by the management.
Table 5. 5. 1 Employees Views on Wages
Sr. No Item KE
1. Present Wage Rate
Satisfactory 100.0
Unsatisfactory -
2. Present Emoluments
Satisfactory 35.7
Unsatisfactory 64.3
Source: Based on Primary data collected through Employee Questionnaires.
It is evident from Table 5. 5. 1 that although all the members were satisfied with
the wage rate , 64 % were unsatisfied with the emoluments .
However, 93 % of the members expressed that they were satisfied with the steps
taken by the union for ensuring wages and job security.
203

( b ) PRODUCTIVITY: Like all the other three units under study, improving
productivity is very much accepted as one of its important functions by this union
too. The union along with the management tried to reduce the prevailing 10 %
absenteeism problem during the recent years. Absenteeism was mainly caused due
to sickness —own / family, religious and social and personal causes. The union
leader tried to convince the members to avoid being absent at work. An incentive
scheme was introduced for the non-absentees.
Another step adopted by the union to cooperate with the management in raising
productivity was the introduction of multi-skill category of workmen.
( c ) WORK CONDITIONS: The union does not allow increase in workdays as
well as decrease in breaks. It was also against any change in service conditions
unless it is discussed and settled with the union. Improvements in facilities for
workers have been constantly demanded by the union. It kept a constant watch
on the physical work environment and worked to improve the same.
( d ) OTHERS: i) Job security: The union did not allow termination of services of
any of its members. It opposed labour saving technical change and approved
technical change that leads to progress provided workers interests were protected.
ii) Safety: The union was satisfied with the provision for accidents and prevention
of occupational diseases.
204

Table 5. 5. 2 Employees' Views regarding Job Security and Safety Devices
Sr. No Item KE
1. Job Security Present 100.0 Absent -
2. Safety Devices Satisfactory 92.9
Unsatisfactory 7.1
3. Met with an Accident Yes 0.0 No 100.0
4. Confidence in Leader Yes 92.9 No 7.1
Source: Based on Primary data collected through Employee Questionnaires.
Table 5. 5. 2 proves that majority of the workers felt safe, secure and had
confidence in their leader.
II. Social Impact:
According to the General Secretary of the union, it did not undertake any social
functions but aimed at improving the standard of living of its members indirectly.
He strongly believed that a rise in the earnings of the workers improves their
standard of living.
205

5.6 COMPARISONS
i ) The extent of impact of trade unions on wages can be evaluated from the
figures regarding wages as given in Table 5. 6. 1.
Table 5. 6. 1 Comparisons of earnings of different employee categories
Category MPT GSL COLFAX CIBA Lowest paid workman at min 3700 6800 4500 10406 Lowest paid workman at max 5830 8000 9000 13372 Highest paid workman at min 6170 7500 6500 13653.20 Highest paid workman at max. 11975 9500 15000 19117.20 Lowest paid management cadre at min
8600 10200 5000 Not disclosed
Lowest paid Management cadre at max
24000 13000 20000 Not disclosed
Highest paid management cadre at min
26500 22000 22000 Not disclosed
Highest paid management cadre at max
30950 28000 50000 Not disclosed
N. B: Regarding GSL figures are approximate and not true figures. All Figures are in Rupees per month and represent gross total earnings. Source: Based on Primary data collected through Employer / Management Questionnaires.
It is evident from Table 5. 6. 1 that: a) The wage structure differed for each unit
due to the difference in the nature of work. b) The wages paid to the workman's
category except for highest paid workman category at MPT, were less than those
paid at the other three units. c) The maximum wages paid to highest paid
workman was highest at Ciba and at Colfax, and lowest at GSL.
206

ii ) Table 5. 6. 2 Ratios of earnings between certain categories of employees
Ratios MPT GSL COLFAX CIBA
Min of lowest paid workman to highest paid workman 1 : 3.23 1 : 1.39 1 : 3.33 1 : 1.83
Min of lowest paid workman to highest paid management
cadre. 1 : 8.36 1 : 4.11 1 : 11.11 Na
Highest paid workman to highest paid management
cadre. 1 : 2.58 1 : 2.94 1 : 3.33 Na
Highest paid workman to lowest paid management cadre 1 : 0.71 1 : 1.27 1 : 0.33 Na
Lowest paid management cadre to highest paid management cadre.
1 : 3.59 1 : 2. 74 1 : 10 Na
Source: Primary data collected through Employer / Management Questionnaires.
Table 5. 6. 2 reveals that a) the difference in wages between the different
categories of workers was highest at Colfax except between highest paid workman
and lowest paid management cadre. b) MPT had second largest differences in the
wages between lowest and highest paid workman, between lowest paid workman
and highest paid management cadre and between lowest paid management cadre
and highest paid management cadre. c) GSL had greatest difference in the wages
of highest paid workman and lowest paid management cadre and second largest
differences in the wages of highest paid workman and highest paid management
cadre.
207

iii) According to the employees, improvements in work conditions is an important
function of every union. More satisfied the workers are with the inherent nature
of his job and with the job environment, more productive they will be. The level
of satisfaction with reference to the prevailing work conditions differed at the four
units and is shown in Table 5.6.3
208

Table 5. 6. 3 Employees' Perceptions of Work Conditions:
Items MPRWU GPDEU No % No %
GSKS GSKE No % No %
GMS No %
KE No %
Illumination Satisfactory 64 (98.5) 63(100.0) 11 (47.8) 16 (72.7) 24(100.0) 14 (100.0)
Unsatisfactory 0 (0.0) 0 (0.0) 12 (522) 6 (27.3) 0 (0.0) 0 (0.0) No response 1(1.5) 0 (0.0) 0 (0.0) 0 (0.0) 0 (0.0) 0 (0.0)
Ventilation Satisfactory 64 (98.5) 61(96.8) 12 (52.2) 14 (63.6) 24(100.0) 14 (100.0)
Unsatisfactory No 1 (1.5) 2 (32) 11 (47.8) 8 (36.4) 0 (0.0) 0 (0.0) response 0 (0.0) 0 (0.0) 0 (0.0) 0 (0.0) 0 (0.0) 0 (0.0)
Temperature Satisfactory 62 (95.4) 58 (92.1) 18 (78.3) 14(63.6) 24 (100.0) 14 (100.0)
Unsatisfactory 2 (3.1) 5 (7.9) 5 (21.7) 8 (36.4) 0 (0.0) 0 (0.0) No response 1 (1.5) 0 (0.0) 0 (0.0) 0 (0.0) 0 (0.0) 0 (0.0) Humidity
Satisfactory 63 (96.9) 58 (92.1) 14 (60.9) 14 (63.6) 0 (0.0) 0 (0.0) Unsatisfactory 1 (1.5) 5 (7.9) 9 (39.1) 8 (36.4) 24 (100.0) 14 (100.0) No response 1 (1.5) 0 (0.0) 0 (0.0) 0 (0.0) 0 (0.0) 0 (0.0)
Dust Satisfactory 55 (84.6) 48 (762) 9 (39.1) 7 (31.8) 24 (100.0) 14 (100.0)
Unsatisfactory 9 (13.8) 13 (20.6) 14 (60.9) 15 ( 68.2) 0 (0.0) 0 (0.0) No response 1 (1.5) 2 (32) 0 (0.0) 0 ( 0.0) 0 (0.0) 0 (0.0)
Smoke & fumes Satisfactory 57 (87.7) 51 (81.0) 7 (30.4) 9 (40.9) 24 (100.0) 14 (100.0)
Unsatisfactory No 7 (10.8) 9 (14.3)1 16 (69.6) 13 (59.1)0 0 (0.0) 0 (0.0) response (1.5) 3 (4.8) (0.0) 0 ( 0.0) 0 (0.0) 0 (0.0)
Noise Satisfactory 58 (892) 54 (85.7) 7 (30.4) 6 (273) 24 (100.0) 14 (100.0)
Unsatisfactory 6 (92) 7 (11.1) 16 (69.6) 16 (72.7) 0 (0.0) 0 (0.0) No response 1 (1.5) 2 (32) 0 (0.0) 0 (0.0) 0 (0.0) 0 (0.0) Cleanliness Satisfactory 64 (98.5) 51 (81.0) 18 (783) 14 (63.6) 24 (100.0) 14 (100.0)
Unsatisfactory 1 (1.5) 11(17.5) 5 (21.7) 8 (36.4) 0 (0.0) 0 (0.0) No response 0 (0.0) 1 (1.6) 0 (0.0) 0 (0.0) 0 (0.0) 0 (0.0)
Over-Crowding Satisfactory 58 (89.2) 55 (87.3) 13 (56.5) 15 (68.2) 24 (100.0) 14 (100.0)
Unsatisfactory 6 (92) 6 (9.5) 10 (43.5) 6 (27.3) 0 (0.0) 0 (0.0) No response 1 (1.5) 2 (32) 0 (0.0) 1 (4.5) 0 (0.0) 0 (0.0) Machinery Satisfactory 59 (90.8) 50 (79.4) 21 (91.3) 17 (773) 24 (100.0) 14 (100.0)
Unsatisfactory 5 (7.7) 10(15.9) 2 ( 8.7) 4 (18.2) 0 (0.0) 0 (0.0) No response 1 (15) 3 (4.8) 0 (0.0) 1 (4.5) 0 (0.0) 0 (0.0)
Others Satisfactory 58 (89.2) 51 (81.0) 11 ( 47.8) 15 (68.2) 24 (100.0) 14 (100.0)
Unsatisfactory 4 (6.2) 8 (12.7) 5 (21.7) 3 (13.6) 0 (0.0) 0 (0.0) No response 3 (4.6) 4 (63) 7 (30.4) 4 (182) 0 (0.0) 0 (0.0)
Source: Based on Primary data collected through Employees Questionnaires.
209

Table 5. 6. 3 shows that greater percent of the respondents at GSL were less
satisfied with most of the work conditions and also had high percent of them
dissatisfied with dust, smoke and fumes and noise at the work place. Majority of the
employees at the other three units were satisfied with the work conditions and
believed that their unions played an important role in improving the same.
iv) Role of trade unions as perceived by the members of the respective unions
differed at the four units and can be visualized as given in the Table 5.6. 4.
Table 5. 6. 4 Employees' Perception of Role of Trade Unions.
Sr No. Items AGREE PARTLY AGREE DISAGREE NO RESPONSE I. Unions have succeeded in securing
better wages and benefits through their efforts MPRWU 46.2 36.9 16.9 - GPDEU 33.3 55.6 95 1.6 GSKS 30.4 52.1 13.0 4.3 GSKE 40.9 31.8 22.7 4.5 GMS 100.0 - - - KE 78.6 14.3 - 7.1
2. Protection of unions has made the workers adopt a casual approach to
their work MPRWU 10.8 185 70.8 - GPDEU 20.6 173 603 1.6 GSKS 26.2 17.4 47.8 8.6 GSKE 18.1 13.6 59.1 9.1 GMS - - 100.0 _ KE 7.1 7.1 85.7 -
3. Unions have cooperated in improving efficiency
MPRWU 46.2 35.4 18.5 - GPDEU 31.7 49.2 17.5 1.6 GSKS 34.8 47.8 13.0 4.3 GSKE 27.3 545 9.1 9.1 GMS 91.7 - 8.3 - KE 78.6 7.1 7.1 7.1
4. Unions are sincere in furthering the interests of workers
MPRWU 43.1 385 18.5 - GPDEU 28.6 57.1 12.7 1.6 GSKS 39.1 34.8 17.4 8.6 GSKE 50.0 273 13.6 9.1 GMS 100.0 - - - KE 78.6 143 - 7.1
Source: Based on Primary data collected through Employees Questionnaires.
210

Table 5. 6. 4 highlights that over 40 percent of the members belonging to
MPRWU and GSKE agreed that their union secured better wages and benefits
while 50 percent and over members belonging to GPDEU and GSKS only partly
agreed to the same. Secondly, nearly 60 percent and above members belonging to
both the unions at MPT and GSL disagreed that unions make workers adopt a
casual attitude towards work while 80 percent agreed that unions cooperated in
improving productivity and were sincere in furthering workers interests. Thirdly,
78 percent of the KE members agreed that their union succeeded in improving
wages and benefits, cooperated in increasing productivity and was sincere in
furthering interests of workers. Fourthly, cent percent GMS members agreed that
the union succeeded in increasing wages, did not make workers adopt casual
attitude to work and was sincere in working for workers.
5.7 CONCLUSIONS:
From the findings in this chapter we can draw the following conclusions:
1. Unions have not been able to increase the wages of workmen to such a level
that the wage differentials between workers and the managerial cadre could be
lessened.
2. Unions have come to realise that rise in labour productivity can enable them
to have better wages, better health and welfare measures and the management
have realised that provision of better wages, better health and welfare measures
can make possible higher levels of productivity.
211

3. From the analysis of data, we conclude that the unions today are not only
performing economic functions but also social functions. The unions have
realised that their role is not only economic but also social in nature.
212