CHAPTER - V MAHARASHTRA EXPERIMENT 1....
45
CHAPTER - V MAHARASHTRA EXPERIMENT 1. Historical Perspective 5.1.1 Maharashtra was one of the states where farmers' participation in irrigation management had been going on for more than two hundred years. Farmers managed irrigation system could be divided in two broad groups i.e. i) Traditional and ii) Non - Traditional System. Traditional system known as Phad system consisted of those constructed, funded and maintained by the farmers on their own initiative prior to independence. The system entailed dividing the entire command in a number of blocks known as phads followed traditionally in Nasik and Dhule districts. Under this scheme bhandaras (weir) were constructed across the river to divert the flow of river to canals. The command area of each phad varied between 8 and 480 hect. The system was entirely managed by farmers themselves for operation and maintenance of head work and sluice gate. The system was useful upto a point of time when reservoirs on the upstream of the rivulets were not constructed and constant flow in rivulets was maintained. The system which was in operation for more than 200 years gradually lost its importance and the system started declining due to upstream water withdrawals by government as well as private users. Construction of reservoirs upstream marred the initiative of the people Another example of the traditional system was provided by Malgujari tanks in Chandrapur and Bhendara districts of Vidarbha region. The tanks were operated and maintained by a committee of eight to ten farmers. Later on these tanks were acquired by the government after which the earlier system came to an end. The non -traditional WUAs were of recent origin. These are described below. 5.1.2 Non - Traditional Irrigation System WUA 5.1.2.1 Cooperative societies on lift irrigation. A number of lift irrigation societies were formed mostly in Kolhapur, Satara and Sangli districts, for lifting from small storage weirs across small rivers for irrigation. Water charges were collected by Irrigation Deptt. on the area basis of sanctioned crops. 5.1.2.2 Cooperative societies in major, medium and minor projects where bulk water was supplied at the head of the minor on volumetric basis (TCM). Water distribution and management beyond minor level was done by farmers themselves. 5.1.2.3 The Maharashtra Irrigation Act. 1976 empowered the Irrigation Department to provide water on volumetric basis with the stipulations that, i) The holders or occupiers of not less 127
-
Upload
nguyendieu -
Category
Documents
-
view
217 -
download
0
Transcript of CHAPTER - V MAHARASHTRA EXPERIMENT 1....
CHAPTER - V
MAHARASHTRA EXPERIMENT
1. Historical Perspective
5.1.1 Maharashtra was one of the states where farmers' participation in irrigation management
had been going on for more than two hundred years. Farmers managed irrigation system
could be divided in two broad groups i.e. i) Traditional and ii) Non - Traditional System.
Traditional system known as Phad system consisted of those constructed, funded and
maintained by the farmers on their own initiative prior to independence. The system entailed
dividing the entire command in a number of blocks known as phads followed traditionally in
Nasik and Dhule districts. Under this scheme bhandaras (weir) were constructed across
the river to divert the flow of river to canals. The command area of each phad varied
between 8 and 480 hect. The system was entirely managed by farmers themselves for
operation and maintenance of head work and sluice gate. The system was useful upto a
point of time when reservoirs on the upstream of the rivulets were not constructed and
constant flow in rivulets was maintained. The system which was in operation for more than
200 years gradually lost its importance and the system started declining due to upstream
water withdrawals by government as well as private users. Construction of reservoirs
upstream marred the initiative of the people Another example of the traditional system was
provided by Malgujari tanks in Chandrapur and Bhendara districts of Vidarbha region. The
tanks were operated and maintained by a committee of eight to ten farmers. Later on these
tanks were acquired by the government after which the earlier system came to an end. The
non -traditional WUAs were of recent origin. These are described below.
5.1.2 Non - Traditional Irrigation System WUA
5.1.2.1 Cooperative societies on lift irrigation. A number of lift irrigation societies were formed
mostly in Kolhapur, Satara and Sangli districts, for lifting from small storage weirs across
small rivers for irrigation. Water charges were collected by Irrigation Deptt. on the area
basis of sanctioned crops.
5.1.2.2 Cooperative societies in major, medium and minor projects where bulk water was supplied
at the head of the minor on volumetric basis (TCM). Water distribution and management
beyond minor level was done by farmers themselves.
5.1.2.3 The Maharashtra Irrigation Act. 1976 empowered the Irrigation Department to provide
water on volumetric basis with the stipulations that, i) The holders or occupiers of not less
127
than 51 percent of the land in the command area or 51 percent of the holders or occupiers
of the land gave consent to take over on payment water on volumetric basis and ii) To form
a water committee of all such holders and occupiers of land. Section officer or his nominee
should also be a member of the water committee, covering all villages in the command area.
The functions of the water committee inter-alia included assisting the canal officer regarding
receiving complaints, preventing unauthorised use of water and assisting the canal officer in
discharge of his duties.
5.1.2.4 The progress of formation of Water Users Association (WUA) has been given in
Chapter II. A detailed study of 3 non-traditional experiments earlier was carried out. These
were (i) Veer Savarkar Water Users Society under Palkhed Project, (ii) Brahma Nath Pani
Watap Sanstha under Parunde Irrigation Project and (iii) Jaikisan Cooperative Water Users
Association under Loni Irrigation Project. The findings and conclusions are given below.
5.2 Veer Savarkar Water Users Society - Palkhed Project (Major)
5.2.1 Background
5.2.1.1 In the Palkhed Left Bank Canal System in Nasik district selected for the study, under
Upper Godavari Project, 31 water users associations (WUAs) having 11,332 hect. of
culturable command area (CCA) and 8331 hect. ICA were in operation, whereas another
21 WUAs with CCA of 7652 hect. and 5711 hect. ICA were in different stages of formation.
Out of operating 31 WUAs, Veer Savarkar Water Users Cooperative Society, Rui, in
Niphad Taluk in operation since october 1992 was selected for the study.
5.2.2 Formation of WUA
5.2.2.1 The selected WUA, Veer Savarkar Water Users Society limited, Rui, was formed in 1992.
The WUA drew water through sub-minor 26, known as Rui minor of 3.125 kms, out of
Darangoan Veer distributary number 19 of PLBC with total length of 7.280 km. The CCA
managed by the selected WUA was 250 hect. with ICA of 165 hect. After the MOU was
signed with Irrigation Department (ID), management of irrigation by the WUA commenced
in Nov. 1993.
5.2.2.2 River Kadwa was one of the major tributaries of the river Godavari which met river Godavari
after flowing for 64 kms with total drainage area of 1664 sq.kms. Contribution to river flow
was from its left side tributaries of rivers Unanda, Garashari and Wadali, whereas river
Knowan was the only tributary from its right side. The river Kadwa originated in inter-
montane terrain, forming the ridge portion between Tapi and Godavari valleys. Rainfall in
128
the catchment varied between 750 mm. to 2500 mm. In later part of the last century a small
storage tank (434 mcft) was constructed on the river. Water left into the river from this
storage was diverted at Palkhed weir on the Kadwa river for irrigation through the Palkhed
right bank canal (PRBC) constructed in Dintori and Niphad talukas of Nasik district. Since
available water potential of kadwa river was much, there was steady demand for irrigation
in low rainfall areas of Niphad Yeola and Chandwad talukas of Nasik district.Therefore, to
provide irrigation to rainfall scarcity areas project report of the Upper Godavari Project
was prepared in 1966. According to the project report, Palkhed left bank canal (PLBC) of
110 km. length was constructed.
Before handing over irrigation management to the WUA, ID carried out
joint management survey (walk-through survey) along with the farmers
to locate defects in the water distribution system with a view to repairing the same. It was,
however, observed that while some of the repair works including construction of outlets to
both left and right field channels, construction of standing water flume (masonry water channel
constructed with measuring gauge to calculate volume of water passing through) were
completed before handing over irrigation management, some of the defects were mentioned
in MOU itself, to be carried out by ID subsequently. The MOU signed in September 1993
would continue for 5 years and would be reviewed and new clauses, warranted, if any,
would be incorporated.
5.2.2.3 The WUA comprised 139 farmers, all of one village (Rui). Number of farmers whose land
fell in the ICA of the distributary was 212. The condition stipulated by ID for formation of
the association was that minimum 51 percent of farmers whose land was covered under the
canal sub - minor should be willing to form the association. The farmers were mostly marginal
and small in as much as 93 (66%) had land upto one hect. and 30 (22%) owned land of 1
to 2 hect each. Only 10 farmers (7%) owned land up to 5 hect. and only 6 (4%) had more
than 5 hect. each. Land holding pattern of the executive members of the Association was
almost in same proportion in so far as 7 (63%) of 11 members owned land upto 2 hect. and
3 (27%) had land upto 5 hect. each, whereas only one member owned land above 5 hect.
As regards social profile, all executive members belonged to high cast Maratha. In this
village there was no SC, ST farmer. In the whole command area of sub-minor also, no land
belonged to SC & ST.
5.2.3 Selection of Sample Households (Bold)
5.2.3.1 Impact of the farmers participation in irrigation management in the selected project were
129

assessed at the selected beneficiary level. As already explained in the sampling design, 40
farmer members whose land fell in the command area of the distributary channel were
selected at random. To facilitate observation as to availability of water from the adequacy
and timeliness from users points of view, equal number of farmers were selected from the
head, middle and tail end of the distribution channel. The socio-economic profile of the
farmer members has already been discussed.
5.2.3.2 Another village adjacent to the selected project where irrigation water was supplied direct
by ID through one outlet was selected as control area and 20 farmers who were non-
members of the WUA were selected for the study. The socio-economic profile of the
selected non members was as follows :
Holding size group No
upto 1 hect. 5
1 to 2 hect. 5
2 to 5 hect. 5
5 hect. and above 5
All belonged to the Maratha caste (other caste group)
5.2.4 Functioning of WUA
5.2.4.1 The executive committee took all decisions through consensus of all members at a joint
meeting. Executive committee members were elected unanimously at a meeting of all members.
No contest for that purpose was held. The commitee had been continuing for the last 5
years as per the constitution of the WUA and next election was scheduled in September
1998. The executive members commanded respect and confidence of ordinary members.
The question of caste dominance also did not arise since all members belonged to the same
caste.
5.2.4.2 No village level committee as such was formed. All members residing in the same village
decided by sitting together as to which crops were to be grown and acreage thereof and
what would be the irrigation charges per crop on area basis to be realised from members.
Non-members, who utilised water out of the system, were required to pay extra 30 percent
over the irrigation charges realised from members. After formation of the association, ID
ceased to enter into water supply contract with individual farmers whose land was covered
under the command area. It is to be noted that even 6 years after formation of association,
about one-third (74 out of 212) farmers whose land fell in the command area were non-
members. There was no provision in the constitution of the association to make membership
130

compulsory. A few of them were asked as to why they did not become members of the
association. They reported that with availability of water in the canal their wells got recharged
automatically which by and large met their irrigation requirements. As a result, they were
either unwilling to become member of the association on payment of about Rs. 250/- as
share money in addition to admission fee. It was, however, pointed out that whenever they
required extra water for irrigation they did not mind paying 30 percent extra charges.
Irrigation Aspect
5.2.4.3 Ensuring availability of assured water supply was one of the cardinal reasons for signing
MOU with ID so that given the assured quantum of water, farmers themselves decided on
crops to be grown in rabi and hot weather seasons. The eagerness of the farmers to ensure
assured quantam of water in rabi season was perceived in this water starved state. For
example, in the Kukadi irrigation project (Major) in Pune district where left bank canal was
under construction for extension upto Ahmednagar District (the project was in construction
stage and water not yet released) many water users associations had already been formed
and MOU signed with ID to reserve assured water at the earliest possible. Farmers knew
that the whole command area of the canal would not get full irrigation even after the project
was completed. Hence, they wanted to reserve their share of water in advance.
Water Charges
5.2.4.4 The water rates per TCM of water payable by WUA to ID which underwent several
revisions since the formation of the WUA, were as follows.
Season Water rate (Rs.) per TCM
1.7.92 1.7.93 1.7.94
onwards onwards onwards
Kharif 16/- 18/- 20/-
Rabi 24/- 27/- 30/-
Hot weather 48/- 54/- 60/-
5.2.4.5 In the 8 months irrigation system there was generally no scope of water supply during hot
weather. But farmers invariably tried to save as much rotation in rabi as possible for use in
hot weather season for growing high value crops like grapes, sugarcane etc. If the water
was available for irrigating field in hot weather, ID generally did not object to releasing
water for hot weather crops. As per normal practice followed, of the saved water 30
percent was deducted as evaporation and transmission loss and 70 percent was supplied
for raising high value crops in hot weather. Sugarcane, though annual crop, was also
131
considered for irrigation in hot weather season in relaxation of rules.
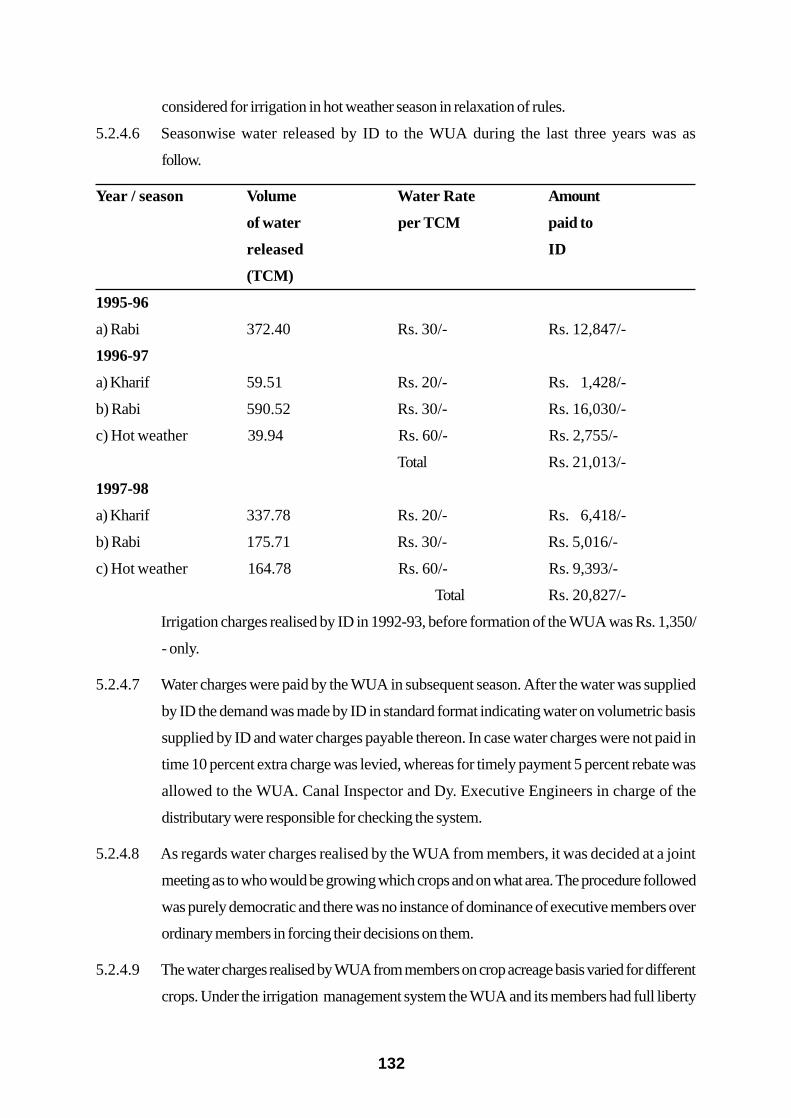
5.2.4.6 Seasonwise water released by ID to the WUA during the last three years was as
follow.
Year / season Volume Water Rate Amount
of water per TCM paid to
released ID
(TCM)
1995-96
a) Rabi 372.40 Rs. 30/- Rs. 12,847/-
1996-97
a) Kharif 59.51 Rs. 20/- Rs. 1,428/-
b) Rabi 590.52 Rs. 30/- Rs. 16,030/-
c) Hot weather 39.94 Rs. 60/- Rs. 2,755/-
Total Rs. 21,013/-
1997-98
a) Kharif 337.78 Rs. 20/- Rs. 6,418/-
b) Rabi 175.71 Rs. 30/- Rs. 5,016/-
c) Hot weather 164.78 Rs. 60/- Rs. 9,393/-
Total Rs. 20,827/-
Irrigation charges realised by ID in 1992-93, before formation of the WUA was Rs. 1,350/
- only.
5.2.4.7 Water charges were paid by the WUA in subsequent season. After the water was supplied
by ID the demand was made by ID in standard format indicating water on volumetric basis
supplied by ID and water charges payable thereon. In case water charges were not paid in
time 10 percent extra charge was levied, whereas for timely payment 5 percent rebate was
allowed to the WUA. Canal Inspector and Dy. Executive Engineers in charge of the
distributary were responsible for checking the system.
5.2.4.8 As regards water charges realised by the WUA from members, it was decided at a joint
meeting as to who would be growing which crops and on what area. The procedure followed
was purely democratic and there was no instance of dominance of executive members over
ordinary members in forcing their decisions on them.
5.2.4.9 The water charges realised by WUA from members on crop acreage basis varied for different
crops. Under the irrigation management system the WUA and its members had full liberty
132

about crops grown and area to be covered under each crop. ID would only ensure availability
of water as per quantum fixed in the agreement. An innovative feature of this experiment
was that a big pond was constructed nearby. Storage water in the pond helped raising
water level in nearby wells through seepage. In fact, some of the farmers who had not
become members of the WUA utilised raised water column in their wells for irrigating fields.
Since all the members of the association belonged to one particular village, the question of
distribution of water as between different reaches did not arise.
5.2.4.10 Generally no case of default in payment of water charges by members was reported,
However, in exceptional cases where water charges were not paid within the stipulated
time 10 percent penalty was realised.
5.2.4.11 As against the water charges paid to the Irrigation Department on volumetric basis
the WUA realised the following water charges from its members.
1995-96 Rs. 27,315/-
1996-97 Rs. 32,227/-
1997-98 Rs. 24,564/-
Maintenance of Field Channels and Main Channel
5.2.4.12 Regarding maintenance of field channels, the member farmers were responsible for maintaining
them alongside their respective plots. The sub-minor distributary no. 26 was not properly
maintained at the time of handing over irrigation management to the WUA. The work was
done after joint management survey was taken up which had revealed several deficiencies
like broken outlets to field channels, broken masonry outfits etc. Those were gradually set
right by ID after handing over irrigation management to the WUA.
5.2.4.13 The irrigation charges realised by WUA from individual members was on crop specific
acreage basis. The above data tended to show that after paying water dues to ID the
association was left with substantial excess fund for running its day to day activities.
5.2.4.14 For maintenance of main channel, ID provided funds at the rate of Rs. 20/- per hect. of ICA
every year to the association whose responsibility was to undertake repair work including
extraction of grass and sand. No other funds were provided to the association which had to
manage with this amount. Actual funds received from ID and expenditure incurred by WUA
on maintenance of distributary during last three years were as follows.
133
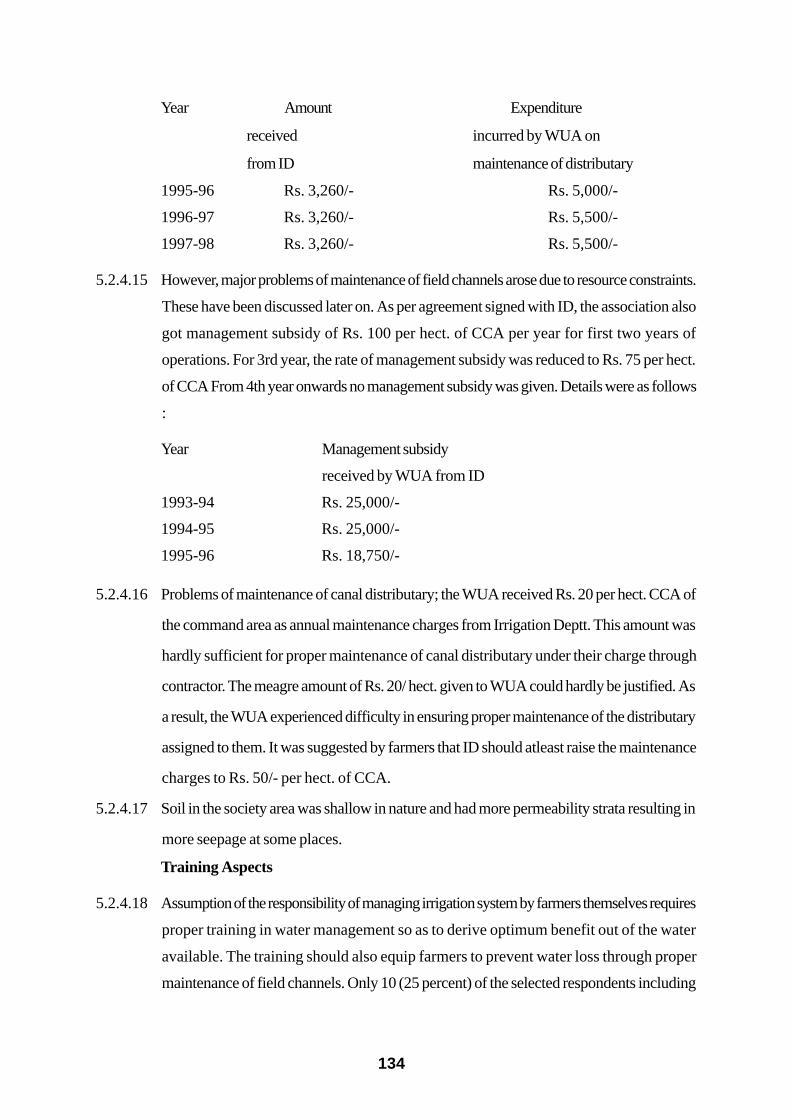
Year Amount Expenditure
received incurred by WUA on
from ID maintenance of distributary
1995-96 Rs. 3,260/- Rs. 5,000/-
1996-97 Rs. 3,260/- Rs. 5,500/-
1997-98 Rs. 3,260/- Rs. 5,500/-
5.2.4.15 However, major problems of maintenance of field channels arose due to resource constraints.
These have been discussed later on. As per agreement signed with ID, the association also
got management subsidy of Rs. 100 per hect. of CCA per year for first two years of
operations. For 3rd year, the rate of management subsidy was reduced to Rs. 75 per hect.
of CCA From 4th year onwards no management subsidy was given. Details were as follows
:
Year Management subsidy
received by WUA from ID
1993-94 Rs. 25,000/-
1994-95 Rs. 25,000/-
1995-96 Rs. 18,750/-
5.2.4.16 Problems of maintenance of canal distributary; the WUA received Rs. 20 per hect. CCA of
the command area as annual maintenance charges from Irrigation Deptt. This amount was
hardly sufficient for proper maintenance of canal distributary under their charge through
contractor. The meagre amount of Rs. 20/ hect. given to WUA could hardly be justified. As
a result, the WUA experienced difficulty in ensuring proper maintenance of the distributary
assigned to them. It was suggested by farmers that ID should atleast raise the maintenance
charges to Rs. 50/- per hect. of CCA.
5.2.4.17 Soil in the society area was shallow in nature and had more permeability strata resulting in
more seepage at some places.
Training Aspects
5.2.4.18 Assumption of the responsibility of managing irrigation system by farmers themselves requires
proper training in water management so as to derive optimum benefit out of the water
available. The training should also equip farmers to prevent water loss through proper
maintenance of field channels. Only 10 (25 percent) of the selected respondents including
134
chairman, vice chairman and secretary of the Association attended training at WALMI
Aurangabad on judicious use of water, better management of soil and water and timeliness
of irrigation. The training lasted for two days. The respondents who attended the training
course reportedly derived benefits such as increase in area of irrigation through optimal use
of water and better crop productivity. The information was as per perception of the farmers
trained. The actual data collected at the beneficiary level, however, did not indicate any
difference between the practices followed by farmers trained and those not trained.
Besides providing some technical knowledge, the training, however, did not provide the
necessary guidance for farmers participation in decision making, as stated by the respondents.
It was, however, observed that all members being resident of the same village and more or
less of the same socio-economic status, all decisions were amicably taken at joint meetings.
The members were not subjected to any class dominance. All the respondents also reported
no problem with regard to water management.
Maintenance of Accounts
5.2.4.19 The Association had a paid employee to keep record of all decisions taken and for proper
maintenance of accounts, both receipts and payments of the association. The bank account
was operated jointly by chairman and secretary of the association. The accounts prepared
by accountant of the association were audited by government auditors. The ac c o u n t s
were maintained annually.
Views on WUA's Functioning
5.2.4.20 None of the respondents cited any group dominance in the management committee. Every
body had adequate chance to participate in decision making. As already explained, the
whole farming community within the command area of the distributary belonged to one
particular caste group and the managing committee members did not take measures against
the interest of the general members. The distributary committee was working well as reported
by all respondents to ensure equitable distribution of water.
5.2.4.21 All the selected respondents expressed full satisfaction with management of irrigation system
by farmers themselves as it ensured timely irrigation as well as equitable distribution of
water amongst the members. The present system also resulted in less irrigation charges
being paid by member farmers to the WUA than what they used to pay to ID under earlier
dispensation. For example, farmers paid earlier to ID irrigation charges of Rs. 100 per hect.
135

for wheat, and Rs. 60/hect. for bajra for kharif. Crops like sugarcane, onion, grapes etc.
were not allowed to be irrigated by ID due to the reasons already stated. Management of
irrigation by farmers themselves rooted out or reduced to minimum the corrupt practices.
They were also happy that irrigation channel was properly maintained by the association
itself. Fair and equitable distribution of irrigation water minimised tension among the users
of water and fostered fellow feeling. Infact, not a single respondent disagreed with any of
the above opinion and reported any problem in irrigating crops.
5.2.5 Impact of the Programme
(A) Before and After Approach
Change in Area Under Irrigation
5.2.5.1 Crops grown 'before' and 'after' with average area per respondent under irrigation at two
points of time are given in the table below :
Table 5.2.1 : Average Irrigated Area per Respondent (0.00 hect.)
Before(1992-93) After (1997-98)
Crop No. Irrigated No. Irrigated area
reported area per reported per respondent
respondent
1 2 3 4 5
Bajra 37 0.95 35 0.60Wheat 25 0.82 36 0.56Onion – – 19 0.62Potato – – 8 0.33Grapes – – 18 0.57Sugarcane – – 30 0.27Total 39 1.44 40 2.17
(50.6)
Figs. in bracket are indices of growth
5.2.5.2 For a comparative study, data for the year immediately preceding formation of WUA (92-
93) and for latest year, 1997-98 were collected. Data for two years were collected to take
care of seasonal fluctuations. Bajra and wheat were the main crops grown before. Irrigated
area per respondent increased by 51 percent in 1997-98. In this project 27 (67%) out of
40 respondents reported increase in irrigated area from 25.7 hect. 'before' to 60 hect.
136
'after', net increase of 133 percent. For others irrigated area remained the same at both
points of time. After formation of the WUA several new and high value crops like onion,
potato, grapes and sugarcane were introduced. This resulted in a decline in area under
bajra and wheat.
Quality of Irrigation
5.2.5.3 All the respondents reported adequate and timely irrigation and no shortage of water was
reported at any level. While irrigation was adequate 'before', supply of water was erratic,
as reported by most of the respondents. Farmers were free to decide which crops to grow
and utilise available irrigation water according to their requirement, whether in rabi or hot
weather season. This option was not open to farmers before the formation of WUA.
Change in Crop Yield
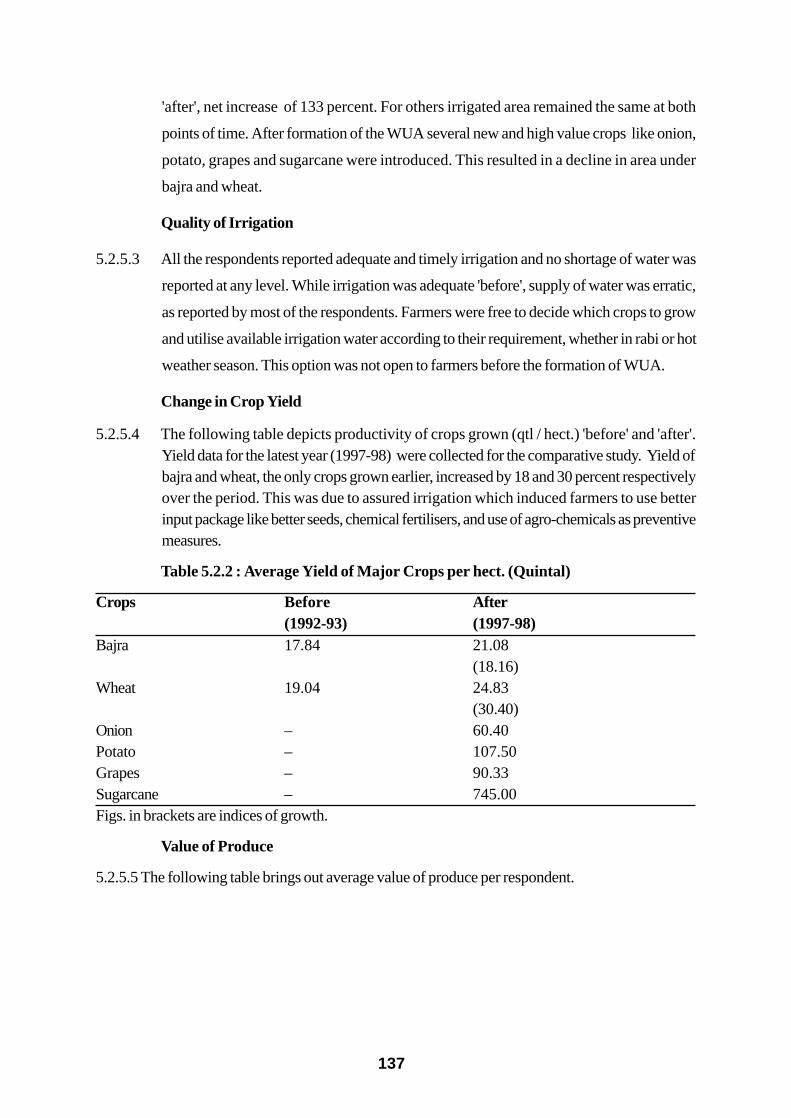
5.2.5.4 The following table depicts productivity of crops grown (qtl / hect.) 'before' and 'after'.Yield data for the latest year (1997-98) were collected for the comparative study. Yield ofbajra and wheat, the only crops grown earlier, increased by 18 and 30 percent respectivelyover the period. This was due to assured irrigation which induced farmers to use betterinput package like better seeds, chemical fertilisers, and use of agro-chemicals as preventivemeasures.
Table 5.2.2 : Average Yield of Major Crops per hect. (Quintal)
Crops Before After(1992-93) (1997-98)
Bajra 17.84 21.08(18.16)
Wheat 19.04 24.83(30.40)
Onion – 60.40Potato – 107.50Grapes – 90.33Sugarcane – 745.00Figs. in brackets are indices of growth.
Value of Produce
5.2.5.5 The following table brings out average value of produce per respondent.
137

Table 5.2.3 : Average Value of Produce per Respondent (Rs.)(at constant prices)
Before AfterCrops grown No. Average value No. Average value
reported of produce (Rs.) reported of produce (Rs.)Wheat 25 9,628 36 12,665
(31.54)Bajra 37 7,761 35 9,172
(18.18)Gram 10 9,52 42 7,275
(-23.61)Jowar 9 4,22 57 2,391
(-43.41)Onion – – 19 11,974Potato – – 8 8,580Grapes – – 18 19,333Sugarcane – – 30 39,862
Total value of produce per 39 14,754 40 65,253respondent (342.27)
Figs. in brackets are indices of growth
Data pertaining to 'before' was for 1992-93 and 'after' for 1997-98, the latest year for
which data were available. Value of producer was based on the current commodity prices
prevailing in 1997-98 for both points of time to take care of temporal fluctuations. In this
table value of all crops grown with or without irrigation (Jowar grown without irrigationboth 'before' and 'after') has been included. There was a galloping increase in value perrespondent, more than four fold, over the period mainly through growing of cash crops likeonion, potato, grapes and sugarcane, not grown earlier. As regards value of individualcrops, with the introduction of cash crops, cultivation of wheat and bajra, principal foodcrops grown 'before', lost their primacy as evident from diminution of irrigated area underwheat and bajra per respondent depicted in an earlier table, yielding places to moreeconomically profitable cash crops.Value of wheat and bajra increased by 32 and 18 percentrespectively over the period, whereas, average value of crops like gram and jowar, grownwithout irrigation decreased considerably, by 23 and 43 percent respectively.
5.2.6 Impact of the Programme
(B) With and Without Approach
Average Irrigated Area
5.2.6.1 Information on cropwise irrigated area per respondent was collected for two points of timewith a view to measuring change, if any, in the irrigated area. Data were collected for 1992-93 viz. the year immediately before formation of the corresponding association and for thelatest year 1997-98. Data are presented in the table below : -
138
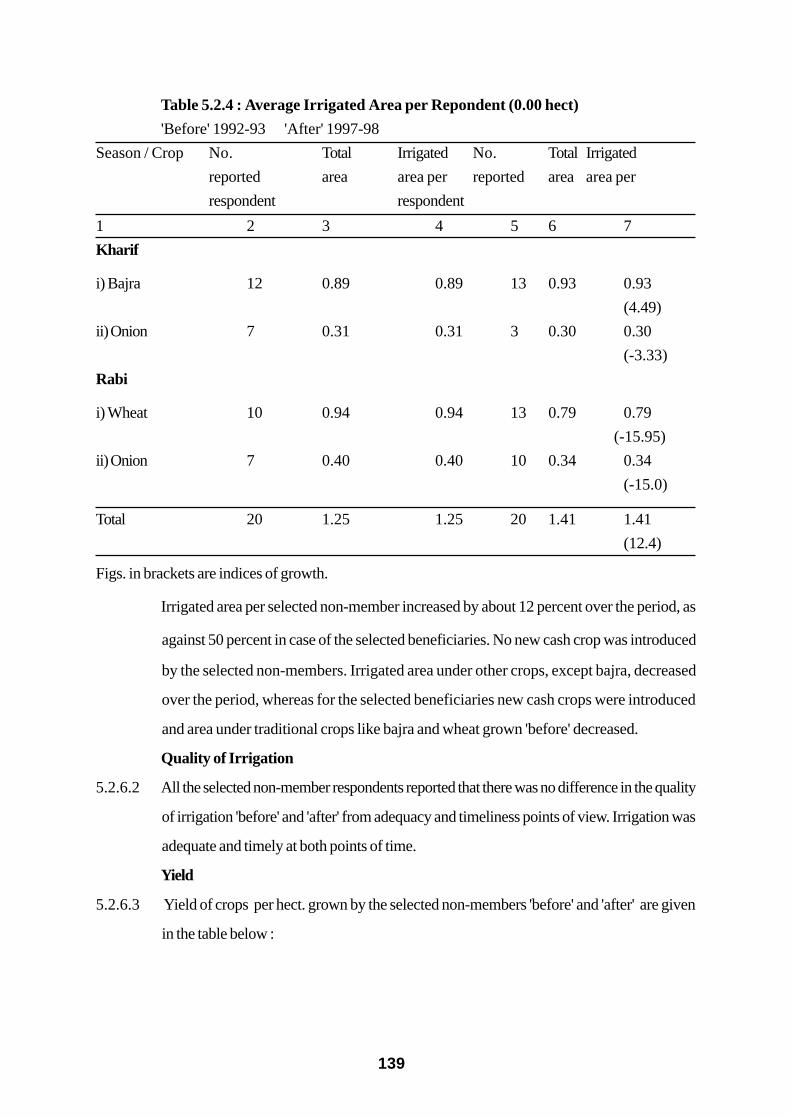
Table 5.2.4 : Average Irrigated Area per Repondent (0.00 hect)
'Before' 1992-93 'After' 1997-98
Season / Crop No. Total Irrigated No. Total Irrigated
reported area area per reported areaarea per
respondent respondent
1 2 3 4 5 6 7
Kharif
i) Bajra 12 0.89 0.89 13 0.93 0.93
(4.49)
ii) Onion 7 0.31 0.31 3 0.30 0.30
(-3.33)
Rabi
i) Wheat 10 0.94 0.94 13 0.79 0.79
(-15.95)
ii) Onion 7 0.40 0.40 10 0.34 0.34
(-15.0)
Total 20 1.25 1.25 20 1.41 1.41
(12.4)
Figs. in brackets are indices of growth.
Irrigated area per selected non-member increased by about 12 percent over the period, as
against 50 percent in case of the selected beneficiaries. No new cash crop was introduced
by the selected non-members. Irrigated area under other crops, except bajra, decreased
over the period, whereas for the selected beneficiaries new cash crops were introduced
and area under traditional crops like bajra and wheat grown 'before' decreased.
Quality of Irrigation
5.2.6.2 All the selected non-member respondents reported that there was no difference in the quality
of irrigation 'before' and 'after' from adequacy and timeliness points of view. Irrigation was
adequate and timely at both points of time.
Yield
5.2.6.3 Yield of crops per hect. grown by the selected non-members 'before' and 'after' are given
in the table below :
139
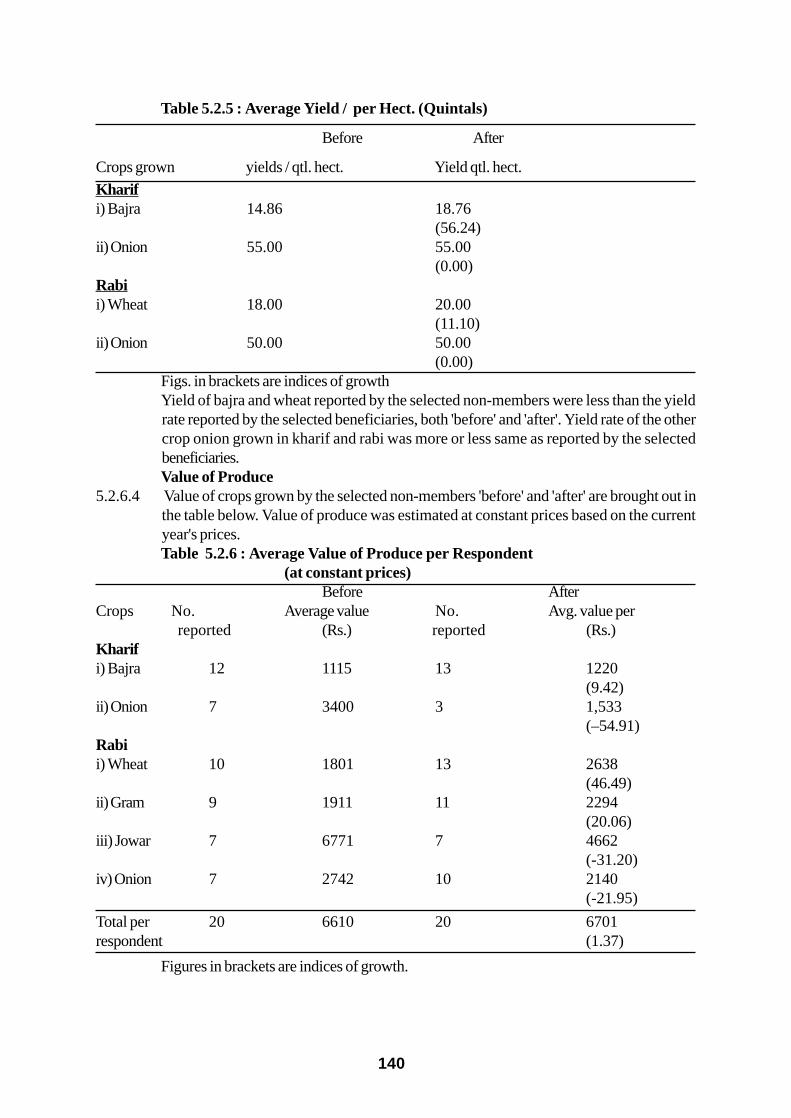
Table 5.2.5 : Average Yield / per Hect. (Quintals)
Before After
Crops grown yields / qtl. hect. Yield qtl. hect.
Kharifi) Bajra 14.86 18.76
(56.24)ii) Onion 55.00 55.00
(0.00)Rabii) Wheat 18.00 20.00
(11.10)ii) Onion 50.00 50.00
(0.00)Figs. in brackets are indices of growthYield of bajra and wheat reported by the selected non-members were less than the yieldrate reported by the selected beneficiaries, both 'before' and 'after'. Yield rate of the othercrop onion grown in kharif and rabi was more or less same as reported by the selectedbeneficiaries.Value of Produce
5.2.6.4 Value of crops grown by the selected non-members 'before' and 'after' are brought out inthe table below. Value of produce was estimated at constant prices based on the currentyear's prices.Table 5.2.6 : Average Value of Produce per Respondent
(at constant prices)Before After
Crops No. Average value No. Avg. value per reported (Rs.) reported (Rs.)
Kharifi) Bajra 12 1115 13 1220
(9.42)ii) Onion 7 3400 3 1,533
(–54.91)Rabii) Wheat 10 1801 13 2638
(46.49)ii) Gram 9 1911 11 2294
(20.06)iii) Jowar 7 6771 7 4662
(-31.20)iv) Onion 7 2742 10 2140
(-21.95)
Total per 20 6610 20 6701respondent (1.37)
Figures in brackets are indices of growth.
140

For the selected non-members increase in value of crops produced 'after' was almost the
same as against more than three fold increase in average value of crops grown by the
selected beneficiaries. The spectaular growth of crops produced by the latter group of
respondents was due to introduction of several high value cash crops, whereas selected
non-members did not introduce any new cash crop over the period.
Awareness of Non-Members
5.2.6.5 All the respondents were aware of the new experiment of irrigation management by farmers
themselves being carried out in a neighbouring village. They reportedly knew about the
benefits derived by WUA members with regard to the choice of crops being grown. Although
they were willing to from association they could not do so for want of required irrigated
area as prerequisite for formation of the association. This constraint was also reported by
the ID functionaries. As reasons for being willing to form the association they reported that
under the new system it would be easier to get irrigation to grow crops of their own choice.
Irrigation water given by ID on individual basis was essentially for raising food crops. Some
of the respondents grew cash and high value crops with the help of tubewell irrigation only,
whereas under the WUA farmers were left with the choice to grow crops with canal irrigation
as they liked.
5.2.6.6 As regards maintenance of canal by ID, no problem with consequent water loss was reported.
The existing system getting water direct from ID was also considered alright by the
respondents. Still, they preferred farmers own management of irrigation system as under
the new dispensation they would have their own choice of crops to be grown.
5.2.7 Influence of Panchayati Raj
5.2.7.1 The local Panchayat did not interfere in day to day activities of the association, nor had it
any role in its formation. Attitude of panchayat towards the WUA was congenial. Infact,
141

members of the association were all members of the Panchayat. Its attitude was not inimical
to the functioning of the WUA. After having discussed with ID officials and members of the
WUA there was no reason to infer that official attitude towards farmers participation in
irrigation management had worsened. Infact, local panchayat and the WUA had distinct
role to play in the betterment of village and their role was complementary to each other.
5.2.8 Factors Responsible for Successful Operation of the WUA
i) Influence of dedicated selfless leadership in the district was instrumental in motivating farmers
to form the WUA in this village as well as in other parts of the district also. The role of
Samaj Parivartan Kendra under leadership of Shri Bhau Sahab Upadhya was very important.
This kendra guided farmers to unite together to form the Water Users Association so that
availability of water for rabi cultivation would be ensured by entering into an agreement with
I.D. The farmers, especially at tail-end of the canal, as in case of Rui village, did not get
assured irrigation earlier. In their endeavour to get assured supply of water they formed the
association with an active cooperation and help from the Irrigation Deptt. The irrigation
functionaries helped and guided them in the formation of the WUA. It was also pointed out
by Irrigation Officials that formation of the farmers association had considerably reduced
their work load on distribution of water as they dealt with the association as a whole.
ii) After JMS the pending work pertaining to repair of field channels was done subsequently
by ID after handing over management to WUA.
iii) In this project all member farmers in the command area belonged to Maratha caste. About
two - thirds of them had land upto 1 hect. and 21 percent had 1 to 2 hect. Only 12 percent
had land between 2 and 10 hect. Since all of them belonged to the same caste the question
of caste dominance did not arise. The farmer members were by and large marginal and
small farmers and formed the socio - economic homogeneous group.
142
iv) Better scheduling of water distribution for irrigation and maintaining equitable distribution of
water from tail to head in the command area for growing various crops during different
seasons of kharif, rabi and hot weather.
v) Within the given quantum of water available, farmers were free to select crops to be grown
in different seasons. There was no restriction imposed by ID for selection of crops.
vi) Field channels as far as possible were maintained by the members of WUA and no problem
was encountered in this regard.
5.2.9 Overview of the Programme
5.2.9.1 The respondents were unanimous in reporting that the new system of management of irrigation
system by farmers themselves was much better than the earlier system of ID managing
distribution of water to individual farmers. The flexibility inherent in the new system, such as
choice of crops to be grown or quantum of irrigation water assured, some portion of which
was generally kept reserved for use afterwards, mainly for cultivation of high value crops
according to their own choice, was reported as principal benefits of the new system. Farmers
were responsible for maintenance of field channels alongside their respective plots and no
problems in this regard was faced. The WUA encountered financial constraints in maintaining
the main distribution channel for which charges @ Rs. 20 per hect. of CCA was given by
ID. The actual cost of maintenance of the distributary system was comparatively more than
the actual maintenance charges received from ID. However, the excess charges the WUA
could afford to incur was out of the marginal left of water charges after payment to ID. The
operation of the project as discerned did not appear to have been bristled with any significant
problem.
5.2.10 Suggestions
5.2.10.1 Several water users associations formed on the canal system in this area worked more or
143
less independently and there was practically no coordination among them. It is suggested
that steps be taken to from a federation comprising all water users associations for interface
with ID to sort out common problems likely to be faced in management of the irrigation
system. Federation of the water users associations would be in a better position to evolve
procedures and methodology for joint management survey (walk-through survey) by
representatives of the association on the one hand and ID officials on the other for correction
of defective canal structures before forming the association.
144

5.3 Brahma Nath Pani Watap Sanstha, Parunde Irrgation Project (Minor)
5.3.1 Background
5.3.1.1 The construction of Parunde Minor Irrigation Tank stituated in Junnar Taluka of Pune District
was started in the year 1986 and completed in the year 1989. This was one of the 90MI
schemes included in minor projects financed under "USAID". The gross storage capacity of
the dam was 0.939 Mcm3 (33.69 Mcft), whereas live storage was 0.869 Mcm3 (30.69Mcft).
There was only one canal on the right bank having a length of 2.5 km. irrigating 112 hect. of
land of Parunde village. Another 60 hect. of land of Bhuhckewadi village on the lake fringe
was irrigated by LI (Lift irrigation) schemes. The total area irrigated under the scheme was
172 hect. The gross annual utilisation was 1.094 Mcm3 (36 Mcft).
5.3.1.2 The Right Bank canal was served by 10 outlets directly from the canal. The entire command
was divided into 10 chaks, average number of beneficiaries on each chakwas 25 to
30 and command area of chak varied between 1.6 hect. and 22 hect.
5.3.1.3 The tank was handed over to management division of I.D. in September 1991. This being
"USAID" project, the outlet committees were already formed. In 1990-91 the irrigation
activities were carried out in traditional manner with little element of participation at the chak
level.
5.3.1.4 This MI tank project selected for study of WUA namely Bramha Nath Pani Watap Sanstha,
comprised 112 hect. of cultural command area (CCA). The entire CCA was irrigated and
formed irrigable command area (ICA). Based on the objectives laid down for water users
associations, a water users society was mooted in February 1991, and the association
subsequently took over the responsibility of distribution of water to the members and also the
entire administration of water management.
5.3.2 Formation of the WUA
5.3.2.1 The motivation of farmers in the command area served by the canal system at Parunde village
proved quite effective and most of the farmers willingly joined the association for judicious
use of water for irrigation. In 1992, due to close association of irrigation staff with farmers and
several joint meetings, a majority i.e. 125 out of 132 in the command area decided to join the
water users association. The society was finally registered in October 1992. And thus, the
Bramha Nath Pani Watap Sanstha was formed. The MOU was signed in October 1992.
After this, the irrigation system (i.e. main canal and field channels) was handed over to the
145
society.
5.3.2.2 The WUA consisted of 127 members who were mostly marginal and small farmers in as
much as 85 (67%) had upto 1 hect. land and 39 (30.7%) owned land from 1 to 2 hect. each.
Only 3 (2.3%) had 2 to 5 hect land. Land holding of executive committee members more or
less followed the same pattern.
5.3.3 Selection of Sample Households
5.3.3.1 As already explained in the sampling design, 40 member farmers whose land fell in the command
area of the distributary channel were selected at random. To facilitate observation as to
availability of water with respect to adequacy and timeliness from users point of view, equal
number of farmers from head, middle and tail end of the distribution channel serving the
command area in the village were selected.
5.3.3.2 From the control areas of the selected project where WUA was not formed, 10 cultivators
who received water direct from ID were contacted and data as to their irrigation status, crops
etc. were collected for two points of time, 'before' and 'after'. Year 'before' was construed as
1990-91 i.e. the year before the formation of the selected water users association and for the
latest year 1997-98 'after'. Data for these two years were collected for a comparative study
with the irrigation scenario of the selected beneficiaries of the selected project.
5.3.3.3 Of the ten selected non-beneficiaries 40 percent each were marginal and small farmers and
rest 20 percent had operational holdings between 2 and 5 hect. each. All of them belonged to
other backward castes.
5.3.4 Functioning of WUA
5.3.4.1 For each outlet, a sub-committee comprising farmers whose land was irrigated by the outlet
was formed. One or two members from each sub-committee were taken in the main executive
committee of the association. Formation of the executive committee was done on democratic
line without any class or caste dominance. Infact, the Secretary of the association was a small
farmer having 1.5 hect. of land and barring chairman and another executive member other
members were marginal and small farmers. As regards social profile of members, SC comprised
only 9%, ST 6.3%, OBC 15.7% and the rest were others (69%).
5.3.4.2 The executive committee took all decisions through consensus of all members present in a
146

meeting. As per MOU the same committee had been functioning since inception.
Irrigation Aspects
5.3.4.3 As per MOU, the society's entitlement for water for irrigation in different seasons was as
below.
i) Kharif - 1,14,000 Cubic M @ Rs. 16 per Thousand Cubic M
ii) Rabi - 4,56,000 Cubic M @ Rs. 24 per Thousand Cubic M
However, water saved in rabi could be utilised in hot weather at hot weather rates of Rs. 60/
- per TCM upto 70 percent of water saved in rabi, the rest was accounted for by evaporation
and transmission losses.
5.3.4.4 The method adopted for water distribution by the WUA was simple but needed strict
compliance. Water distribution to the users started from three outlets at tail end. After total
area covered by last three outlets were fully irrigated, the outlets were closed and preceding
three outlets were opened for releasing water. This way outlets at the beginning of the channel
received irrigation water at the last. This system was followed so as to ensure equitable
distribution of water. It was reported that in times of acute need water was also allowed to be
lifted by pump for irrigating fields of other villagers whose plots were located at higher levels
after the last outlet.
5.3.4.5 Water charges were paid by WUA in subsequent season after the water was supplied by ID.
The demand was made by ID in a standard format indicating water supplied on volumetric
basis and if water charges were not paid in time then 10% extra charges were to be levied.
For timely payment, however, 5% rebate was allowed to WUA.
5.3.4.6 Water charges were realised by WUA from its members on crop acerage basis. The rates
varied for different crops. Under the irrigation management system, the WUA and the members
had full liberty about the cropping pattern and area to be covered under each crop. Irrigation
Department would only ensure availability of water as per quantum fixed in the agreement.
The water charges realised by the WUA from its members for the last three years were as
under :
1995-96 - Rs. 16,863/-
1996-97 - Rs. 16,695/-
1997-98 - Rs. 19,897/-
147
5.3.4.7 All member farmers of the village decided by sitting together what would be the irrigation
charges to be realised on area basis of specified crops from all members. The non-members
who utilised water of the system were required to pay extra 30 percent over the irrigation
charges realised from the members.
Water charges paid by WUA on water realeased by ID on volumetric basis are given below
:
Water released Water charges paid to ID
(TCM) Rs.
1995-96
Kharif 29.4 1,059
Rabi 302.0 10,872
11,931
1996-97
Rabi 346.4 12,472
1997-98
Rabi 347.7 12,519
There was a margin of about 25 to 38 percent of water charges realised by WUA every year,
after payment to ID. The excess amount was utilised for running the affairs of the society. The
managerial subsidy which was paid at the rate of
Rs.100/- per acre of ICA as per MOU to the association for first three years of operation
was no longer payable from the fourth year.
5.3.4.8 The Irrigation Department provided funds for maintenance of channel at the rate of
Rs. 40/- per hect. of ICA every year to the association whose responsibility was to undertake
repair work of main canal including extraction of grass and sand.
Maintenance charges paid by ID to WUA for the last three years were as under :
1995-96 - Rs. 6,500
1996-97 - Rs. 6,800
1997-98 - Rs. 6,500
5.3.4.9 The amount paid as maintenance charges every year was less than the amount received by
ID. as water charges from the WUA namely Rs. 11,931, Rs. 12,472 and Rs. 12,519 during
1995-96, 1996-97 and 1997-98 respectively. As against the amount received as maintenance
charges the association incurred the following expenditure for maintenance of the canal
148
distributary.
1995-96 - Rs. 6,500
1996-97 - Rs. 7,000
1997-98 - Rs. 7,500
Training Aspect
5.3.4.10Of the selected farmers, 7 (17%) including the chairman were trained at Water and Land
Management Institute (WALMI) in Aurangabad. The training period was for 4 days and
individual farmers attended the courses in water management and judicious use of water
system. The training helped them in increasing irrigated area and promoting increase in
agricultural production.
Maintenance of Accounts
5.3.4.11 The association had a paid employee to keep record of decisions taken in various meetings
and maintenance of accounts related to both payments and receipts. The bank accounts were
jointly operated by chairman and secretary. The accounts prepared were audited by government
auditors.
Views on Functioning of the new Experiment
5.3.4.12All the selected respondents reported awareness of the new experimenet of irrigation
management with farmers participation which they learnt from fellow farmers. They also
considered the new system better than the management of irrigation system by ID. As reasons
as to why new experiment was better, it was reported that under the new experiment farmers
would have own choice of crops to be grown. Moreover, it would be convenient and easier
to sort out any internal disputes among farmers within the association, as far as irrigation of
crops was concerned. Under their present system getting irrigation direct from ID on individual
basis, such internal disputes continued to linger on as there was practically no effective grievance
redressal forum. On being asked as to why they were not taking steps to form the association,
it was reported that their total land holding was not sufficient as per the amended Irrigation
Act to form farmers association.
5.3.4.13The respondents also reported that as far as availability of water was concerned, they
considered their present system (individual farmers getting water from ID direct) to be more
or less the same as the other system. About 50 percent of them, however reported that
siltation and damaged structure caused water loss under their own system which could be
149
prevented under the new dispensation. For farmers themselves would take care of the
maintenance and upkeep of distributary and canal structure.
The interaction with the selected non-beneficiaries indicated their preference for the new
system which would enable them to grow crops of their own choice. They also considered
new system better since there was better possibility of water loss being prevented under
farmers own management.
5.3.4.14All the selected farmers appeared to be quite happy and fully satisfied after formation of the
WUA. The freedom to choose crops to be grown, better water scheduling and equitable
distribution of water without preference for any group of farmers, starting from tail to head
were mainly instrumental in increasing their agricultural production and generating substantial
increase in value of crops produced. The farmers maintained field channels in good condition
involving less expenditure. Disputes, if any, were amicably settled. Fair and equitable distribution
of irrigated water minimised tension. Not a single respondent disagreed with any of the above
opinions and reported any problem. Due to proper maintenance, condition of distrbutary did
not deteriorate and remained same as before, as reported by all respondents, while proper
upkeep of field channels was their responsibility. No water loss was reported by anybody.
5.3.4.15The selected farmers had no doubt about rectitude of the members of the management
committee. The farmers were happy with its functioning and no instance of corrupt practice
and caste dominance in water distribution was reported by any of them. The respondents
reported smooth working of the distributary committees at each outlet level to ensure equitable
distribution of water.
5.3.5 Impact of the Programme
(A) Before and After Approach
5.3.5.1 Impact of farmers participation in irrigation management in terms of i) increase in area under
irrigation, ii) introduction of new crops if any, and iii) change in productivity of crops and in
value of produce 'before' and 'after' were assessed at the selected beneficiaries level.
Change in Irrigated Area
5.3.5.2 For a comparative study, data for the year immediately preceding formation of WUA, 1990-
91 and for the latest yera 1997-98 were collected. Data are given in the table below.
150
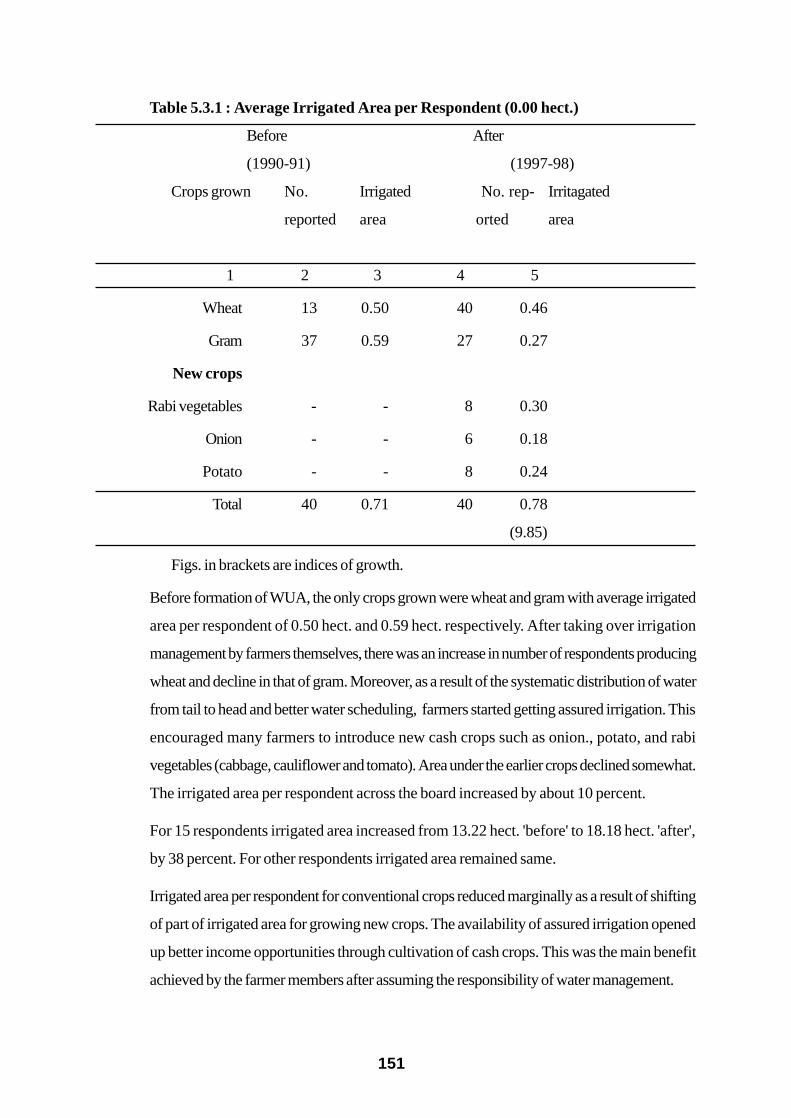
Table 5.3.1 : Average Irrigated Area per Respondent (0.00 hect.)
Before After
(1990-91) (1996-97) (1997-98)
Crops grown No. IrrigatedIrrgated No. rep- Irritagated
reported area- orted area
1 2 3 4 5
Wheat 13 0.50 40 0.46
Gram 37 0.59 27 0.27
New crops
Rabi vegetables - - 8 0.30
Onion - - 6 0.18
Potato - - 8 0.24
Total 40 0.71 40 0.78
(9.85)
Figs. in brackets are indices of growth.
Before formation of WUA, the only crops grown were wheat and gram with average irrigated
area per respondent of 0.50 hect. and 0.59 hect. respectively. After taking over irrigation
management by farmers themselves, there was an increase in number of respondents producing
wheat and decline in that of gram. Moreover, as a result of the systematic distribution of water
from tail to head and better water scheduling, farmers started getting assured irrigation. This
encouraged many farmers to introduce new cash crops such as onion., potato, and rabi
vegetables (cabbage, cauliflower and tomato). Area under the earlier crops declined somewhat.
The irrigated area per respondent across the board increased by about 10 percent.
For 15 respondents irrigated area increased from 13.22 hect. 'before' to 18.18 hect. 'after',
by 38 percent. For other respondents irrigated area remained same.
Irrigated area per respondent for conventional crops reduced marginally as a result of shifting
of part of irrigated area for growing new crops. The availability of assured irrigation opened
up better income opportunities through cultivation of cash crops. This was the main benefit
achieved by the farmer members after assuming the responsibility of water management.
151

Quality of Irrigation
5.3.5.3 Before formation of the Association, availability of water was erratic. Only 53 percent of the
respondents reported that irrigation was adequate while the rest reported that it was inadequte.
Supply of water was timely for 50% of them while for the rest it was untimely. After formation
of the Association quality of irrigation improved as all the respondents reported that irrigation
was adequate and timely.
Change in Crop Yield
5.3.5.4 The inception of farmers participation in irrgation management had resulted in increasing
productivity of crops. Table given below depicts productivity of the crops grown (qtl. / hect.)
'before' and 'after'.
Table 5.3.2 : Average Yield of Major Crops per / hect. (Quintals)
Before After
Yield / hect. Yield / hect.
Crops
Wheat 12.38 25.17 (103.31)
Gram 7.54 12.70 (68.43)
New crops
Rabi vegetabls – 120.00
Onion – 80.83
Potato – 121.87
Figs. in brackets are indices of growth.
The yield data for 90-91 and latest year were collected for the comparative study. Yields for
wheat and gram, only crops grown earlier, increased by 103 and 68 percent over the period.
This was possible because assured irrigation encouraged farmers to go in for better input
package like better seeds, fertiliser and agro-chemicals after formation of the WUA.
Value of Produce
5.3.5.5 That formation of the WUA providing better irrigation facilities, both timely and adequate,
had benefited farmers in the form of manifold increase in value of produce, is reflected in the
following table which depicts average value of produce per respondent from crop production
'before' and 'after'. This includes value of produce from non-irrigated crops also.
152

Table 5.3.3 : Average Value of Produce per Respondent (Rs.)
(at constant prices)
Before After
Crop No. repor- Value of No. reported Value of produce
ted. produce per respondent
(Rs.) (Rs.)
Wheat 13 3,704 40 6,300
(70.08)
Gram 37 5,929 27 5,419
(-8.60)
New crops
Rabi vegetables - 8 25,750
Onion 6 11,418
Potato - 8 8,925
Flori culture 3 15,333
Total respondent 40 6,438 40 19,967
(210.14)
Figs. in brackets are indices of growth.
5.3.5.6 Average value of produce of different crops per respondent as calculated for both the periods
was compared at constrant prices based on current year's prices to neutralise seasonal
fluctuations in prices between two points of time. Data on ruling market prices were collected
through consensus of opinon of the villagers.
5.3.5.7 Comparing 'before' and 'after' situations, average value of produce increased by more that
three fold over the period mainly through introduction of new cash crops. As regards traditional
crop of wheat, increase in value of produce 'after' was derived mainly due to increase in yield
per hect. as a result of better irrigation. For gram, however, average value decreased by
about 8 percent, albeit increase in yield by two-thirds, mainly due to shrinkage in area under
the crop 'after'. With availability of assured water supply an innovation in crop production
was introduction of floriculture by a few respondents with annual average value of produce
15000/- per respondent.
153

5.3.6 Impact of the Programme
(B) With and Without Approach
Average Irrigated Area
5.3.6.1 Cropwise average area irrigated per respondent is given in the table below.
Table 5.3.4 : Average Irrigated Area per Respondent (0.00 hect.)
Before After
(1990-91) (1997-98)
Season / No. Total area Irrigated No. Total Irrigated
Crop reported (hect.) area reported area (hect.)
(hect.)
Kharif
i) Bajra 3 0.47 0.47 - - -
ii) Groundnut 1 0.40 0.40 - - -
Rabi
i) Jowar 1 0.20 0.20 - - -
ii) Wheat 3 0.60 0.60 - - -
iii) Gram 1 0.20 0.20 - - -
Hot weater
Sugarcane 5 0.60 0.60 10 0.86 0.86 (43.33)
Total
per respondent 10 0.70 0.70 10 0.86 0.86
(22.85)
Figs. in brackets are indices of growth.
5.3.6.2 The remarkable feature of the crops grown by the selected respondents was that in 1997-98,
with availability of adequate irrigation, all had switched over to sugarcane cultivation in place
of food crops like bajra, jowar, wheat and gram grown 'before'. Average area under sugarcane
per respondent increased by 43 percent over the period. This is in contrast to the cropping
pattern of the selected beneficiaries of the WUA where after formation of the WUA, besides,
growing food crops 'after' cash crops like onion, potato and rabi vegetables were also
introduced. Surprisingly, none of the selected beneficiaries grew sugarcane. Perhaps because
sugarcane is an water intensive crop and adequate water was not available for the purpose.
154

Quality of Irrigation
5.3.6.3 For all the respondents irrigation was adequate and timely 'after', as against 40% of them
who had adequate and timely irrigation 'before'.
Yield
5.3.6.3 Average yield per hect. of major crops grown 'before' and 'after' are given in the table
below :
Table 5.3.5: Average Yield of Major Crops per Hectares (Quintals)
Before (1990-91) After (1997-98)
Season / Yield . Yield
crops grown
Kharif
i) Bajra 20.83 -
ii) Groundnut 8.00 -
Rabi
i) Jowar 20.00 -
ii) Wheat 23.66 -
iii) Gram 10.00 -
iv) Sugarcane 1246 1213 (-3.4)
Figs. in brackets are indices of growth
Average yield 'before' of crops like wheat and gram was reportedly more than the yield of
such crops grown by the selected beneficiaries. For example, yield of wheat per hect. was
23.66 qtl. vis-a-vis 12.38 qtl./hect. 'before' reported by the selected beneficiaries; this was
higher by about 90 percent. However, yield rate of wheat reported by them 'after' was
comparatively more. Yield of gram per hect., 'before' 10.00 hect./qtl. reported by the selected
non - members was about 33 percent higher than 7.54 qtls/hect. reported by the selected
beneficiaries. For subsequent year, 1997-98 yield rate between two sets of respondents was
not comparable. For, the selected non-members did not grow such crops 'after' they switched
over to sugarcane crops, whereas the selected beneficiaties did not grow sugarcane in either
of the years.
Value of Produce
5.3.6.5 The study revealed that after switching over to sugarcane cultivation average value of produce
per respondent increased by 138 percent over the period. This increase was, however, less
155
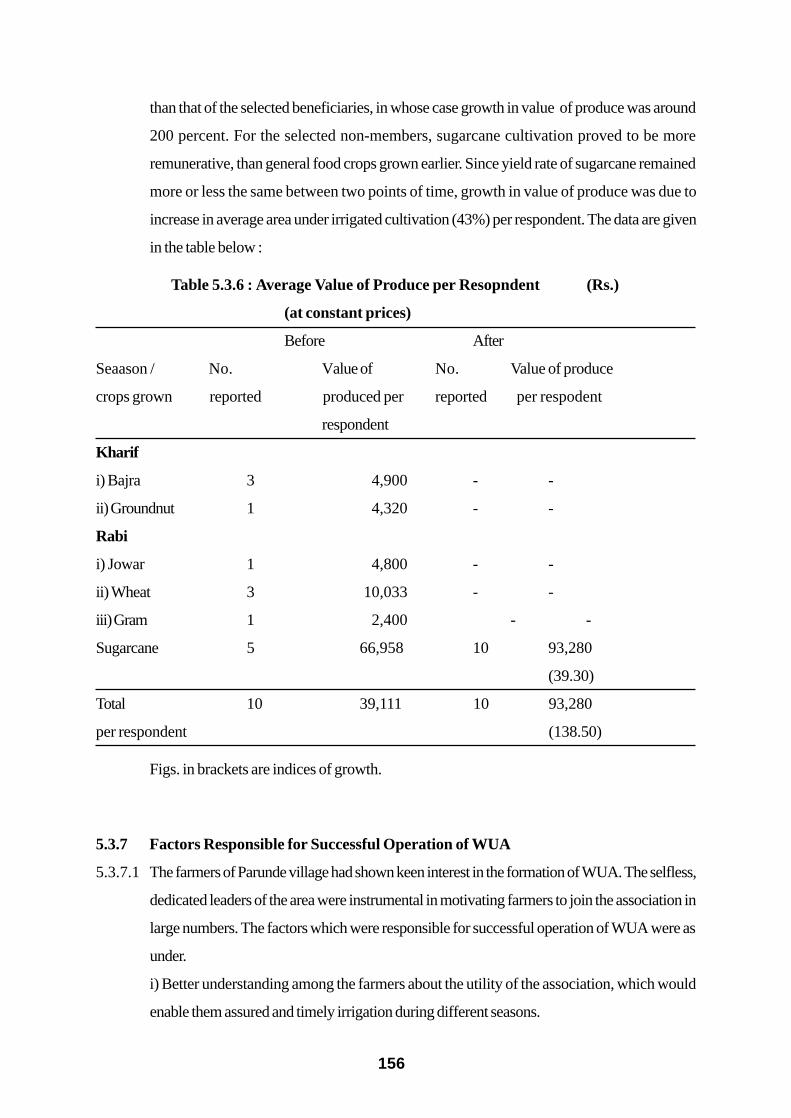
than that of the selected beneficiaries, in whose case growth in value of produce was around
200 percent. For the selected non-members, sugarcane cultivation proved to be more
remunerative, than general food crops grown earlier. Since yield rate of sugarcane remained
more or less the same between two points of time, growth in value of produce was due to
increase in average area under irrigated cultivation (43%) per respondent. The data are given
in the table below :
Table 5.3.6 : Average Value of Produce per Resopndent (Rs.)
(at constant prices)
Before After
Seaason / No. Value of No. Value of produce
crops grown reported produced per reported per respodent
respondent
Kharif
i) Bajra 3 4,900 - -
ii) Groundnut 1 4,320 - -
Rabi
i) Jowar 1 4,800 - -
ii) Wheat 3 10,033 - -
iii) Gram 1 2,400 - -
Sugarcane 5 66,958 10 93,280
(39.30)
Total 10 39,111 10 93,280
per respondent (138.50)
Figs. in brackets are indices of growth.
5.3.7 Factors Responsible for Successful Operation of WUA
5.3.7.1 The farmers of Parunde village had shown keen interest in the formation of WUA. The selfless,
dedicated leaders of the area were instrumental in motivating farmers to join the association in
large numbers. The factors which were responsible for successful operation of WUA were as
under.
i) Better understanding among the farmers about the utility of the association, which would
enable them assured and timely irrigation during different seasons.
156

ii) The dam had assured irrigation potential for the whole command area covered by the
WUA. In addition, several lift irrigation schemes were also in operation under cooperative
managements which drew water from the storage tank. Availability of assured irrigation was
the prime motive for the formation of the association. The cooperation and support provided
by the ID officials in forming the association was no less important.
iii) There was incentive for farmers to save water in rabi season which would be utilised for
raising high value crops in summer season. Although under minor irrigation scheme there was
no provision for releasing water in hot weather, generally ID officials did not object to releasing
saved water in hot weather (upto 70 percent of water saved in rabi season) provided there
was adequate water in the storage tank required for its upkeep and maintenance.
iv) Proper maintenance of field channels involving less expenditure.
v) Better cohesiveness, interaction and understanding between chairman, farmer members
and ID in amicably sorting out disputes, if any, and providing best water distribution
management.
vi) Farming activities were better organised by collective decisions so as to get better yield.
5.3.8 Overview of the Project
5.3.8.1 After taking over water distribution management, the farmers appeared to be holding unanimous
opinion that the new system was much better than the earlier system of ID managing distribution
of water to individual farmers. The independence of choice of crops to be grown and quantum
of irrigation each member farmer got enabled them to introduce HYV cash oriented crops.
These were the principal benefits achieved by the farmers. The system devised to ensure
equitable distribution of water by supplying water first to tail enders and subsequently to other
farmers gradually was worth emulating by other user associations. This would lead to smooth
and harmonious management of irrigation system.
157
5.4 Jaikisan Co-operative Water Users Associations, Loni Minor Irrigation Project
5.4.1 Background
5.4.1.1Situated in Aurangabad district, Loni was a minor tank irrigation project providing irrigation
since the last four years. It had a gross storage capacity of 0.8583 mm of which dead storage
capacity was .0064 mm3 and live storage capacity was 0.8519 mm3. The earthen dam was
376 m in length and in 16 m height. The project had culturable command area (CCA) of 281
hect. of which irrigable command area (ICA) was 170 hect. Supply of water for irrigation was
available through left bank canal of 2.52 km length. Irrigation availability depended upon tank
inflow and planned withdrawal for the canal, whereas requirements of irrigation were influenced
by crop mix and crop water requirement. The rainfall pattern analysis implied assured irrigation
only for 4 months, i.e. June to September, but that too could not be adhered to every year due
to dearth of water. Situation became critical in 1996-97 when rainfall in Aurangabad district
suffered a great set back. As a result, ID could not supply any water for irrigation to the
cultivators in that year.
5.4.2 Formation of WUA
5.4.2.1Farmers in Loni village were initially reluctant or indifferent to form WUA because they were
doubtful of getting assured irrigation from water storage tanks. Other impediments were dearth
of suitable ID officials with dedication to motivate farmers to form WUA and lack of local
leadership which could act as catalytic force to organise WUA. However, due to minimal
motivation and possible persuation by the extension officials of WALMI, Aurangabad, Shri
Jaikisan Cooperative Water Users Association comprising 281 hect. of cultural command
area (CCA) and 170 hect. of irrigable command area (ICA) started functioning in 1993-94.
MOU was signed in September 1994. Subsequently, irrigation system consisting of the main
canal and field channels were handed over to WUA, to handle water distribution among
farmers.
5.4.2.2The Water Users Association comprised 244 farmers most of whom were marginal and small
farmers. Their land holding pattern showed that 115 (47%) had land upto one hect. 66 (27%)
owned land 1 to 2 hect. and the rest 63 (25.8%) had 2 to 5 hect each. The social profile of
members was SC & ST 16.4% and OBC and others 83.6%.
5.4.3 Selection of Sample Households
5.4.3.1For the study in Loni project, 40 farmers, whose land fell in the command area of the distributary
channel, were selected at random in order to find out adequacy and timeliness of water from
158
users point of view. Equal number of farmers were selected from head, middle, and tail end of
the distributary channel.
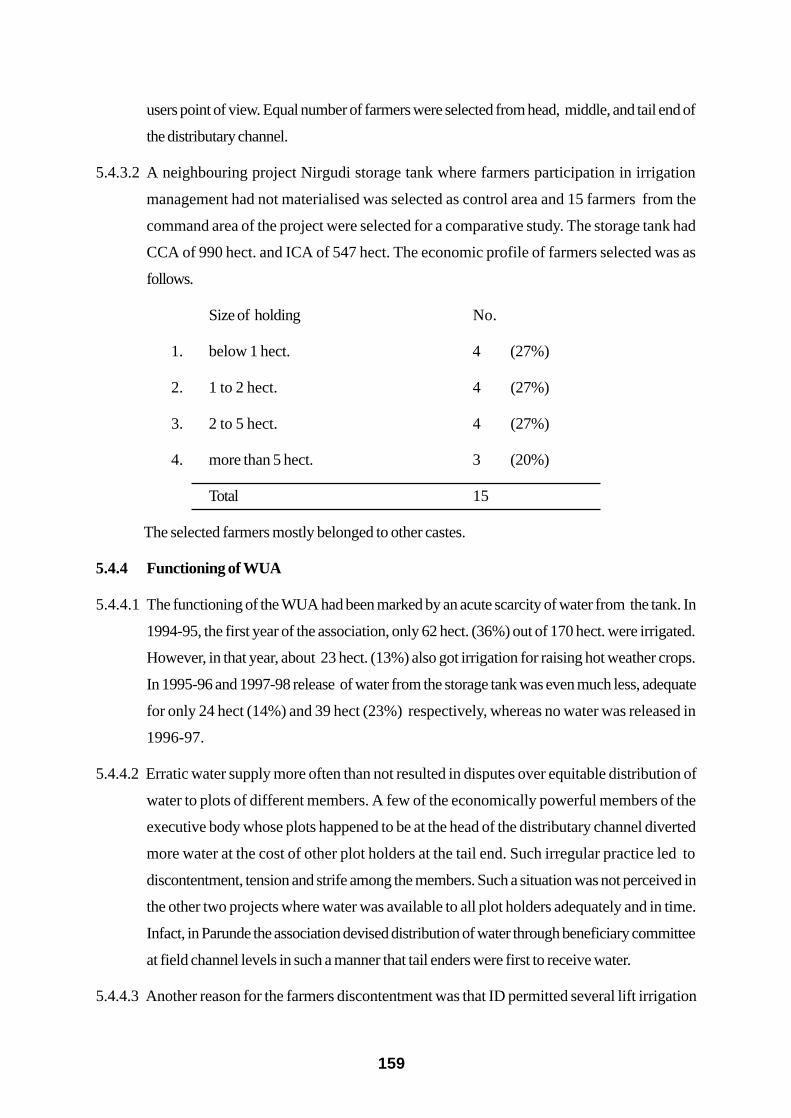
5.4.3.2 A neighbouring project Nirgudi storage tank where farmers participation in irrigation
management had not materialised was selected as control area and 15 farmers from the
command area of the project were selected for a comparative study. The storage tank had
CCA of 990 hect. and ICA of 547 hect. The economic profile of farmers selected was as
follows.
Size of holding No.
1. below 1 hect. 4 (27%)
2. 1 to 2 hect. 4 (27%)
3. 2 to 5 hect. 4 (27%)
4. more than 5 hect. 3 (20%)
Total 15
The selected farmers mostly belonged to other castes.
5.4.4 Functioning of WUA
5.4.4.1The functioning of the WUA had been marked by an acute scarcity of water from the tank. In
1994-95, the first year of the association, only 62 hect. (36%) out of 170 hect. were irrigated.
However, in that year, about 23 hect. (13%) also got irrigation for raising hot weather crops.
In 1995-96 and 1997-98 release of water from the storage tank was even much less, adequate
for only 24 hect (14%) and 39 hect (23%) respectively, whereas no water was released in
1996-97.
5.4.4.2 Erratic water supply more often than not resulted in disputes over equitable distribution of
water to plots of different members. A few of the economically powerful members of the
executive body whose plots happened to be at the head of the distributary channel diverted
more water at the cost of other plot holders at the tail end. Such irregular practice led to
discontentment, tension and strife among the members. Such a situation was not perceived in
the other two projects where water was available to all plot holders adequately and in time.
Infact, in Parunde the association devised distribution of water through beneficiary committee
at field channel levels in such a manner that tail enders were first to receive water.
5.4.4.3 Another reason for the farmers discontentment was that ID permitted several lift irrigation
159
projects on the same storage tank outside the command area of the selected project. Although
at each outlet level (there were 13 outlets on the canal distributary) one distributary level
committee was set up to coordinate flow of water to the field, the committee could not be of
much use mainly due to scanty water accumulation in the storage dam.
5.4.4.4 It was also reported by the ID officials that with meagre resources at their disposal, they
could not take up desilting operation, and other maintenance work on storage tanks, especially
from where no water was released for irrigation for whatsoever reason and consequently no
revenue earned. Naturally, with limited resources at their disposal they took up proper upkeep
of such irrigation structures which earned revenue. Postponement of maintenance work for a
year made subsequent maintenance even more daunting. Under this scenario, it was quite
natural that influential members tried to grab as much water as possible specially when water
was so vital for crop production in this semi-arid region.
5.4.4.5 The Executive Committee members were elected by members and the same committee
continued. The land holding pattern of executive members varied between 18 hect. to less
than one hect. including Chairman and Secretary who were having lands 18 hect. and 1.2 hect
respectively.
Irrigation Aspect
5.4.4.6The WUA in Loni village was formed on the same guidelines and pattern as other associations
were constituted in different parts of Maharashtra State. The society started functioning well
but after a lapse of one year it was realised that it would not be possible to distribute water for
irrigation to all farmer members as per schedule. The main hurdle was acute shortage of water
in the catchment and consequently descending water level in the storage tank. Although social
dominance by any group in the executive committee was not discernible, economic dominance
by certain influential wealthy farmers over other farmers, especially having much less land
holding was visible. Since water was not always available in adequate quantity there was a
tendency on the part of influential executive committee members whose land was situated at
the head of the distribution channel to take more water at the cost of farmers whose plots
were at lower reaches of the channel. This caused tension and disturbed harmony among
farmers. This situation was not perceived in the other two selected projects where sufficient
water was available for meeting full requirements of members of the WUA.
Irrigation Charges
5.4.4.7 Volume of water received from ID, irrigation charges paid thereon and irrigation charges
160
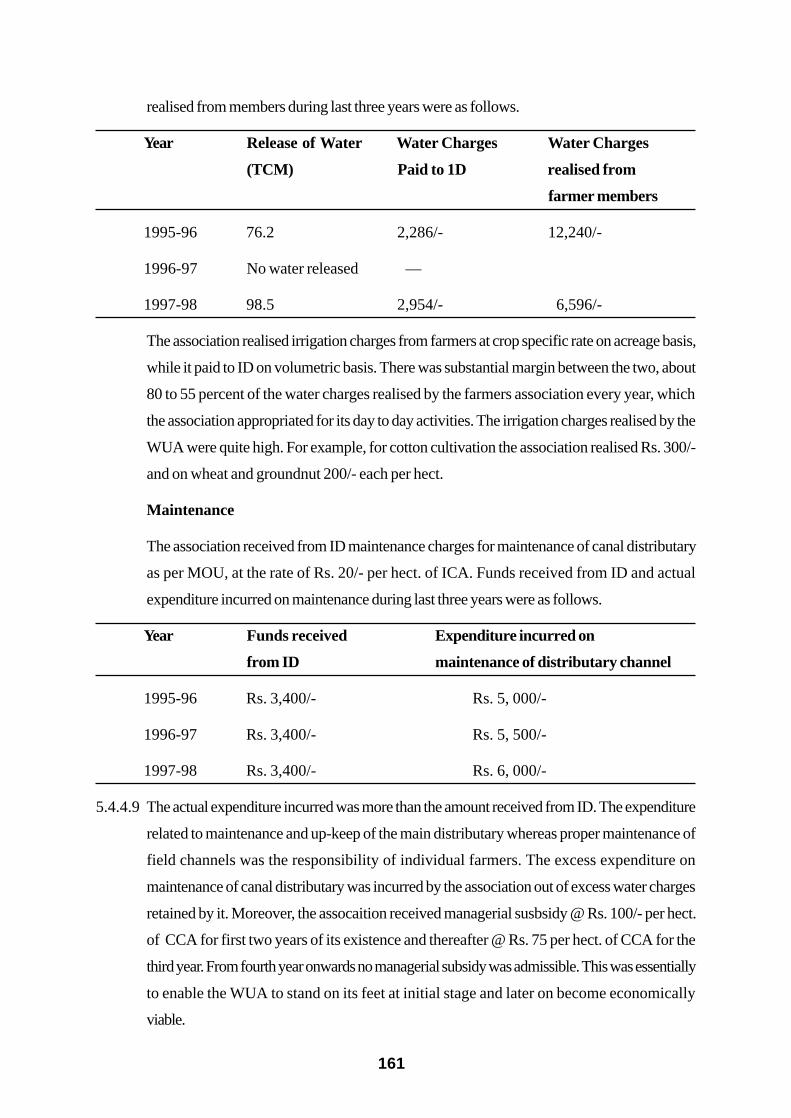
realised from members during last three years were as follows.
Year Release of Water Water Charges Water Charges
(TCM) Paid to 1D realised from
farmer members
1995-96 76.2 2,286/- 12,240/-
1996-97 No water released —
1997-98 98.5 2,954/- 6,596/-
The association realised irrigation charges from farmers at crop specific rate on acreage basis,
while it paid to ID on volumetric basis. There was substantial margin between the two, about
80 to 55 percent of the water charges realised by the farmers association every year, which
the association appropriated for its day to day activities. The irrigation charges realised by the
WUA were quite high. For example, for cotton cultivation the association realised Rs. 300/-
and on wheat and groundnut 200/- each per hect.
Maintenance
The association received from ID maintenance charges for maintenance of canal distributary
as per MOU, at the rate of Rs. 20/- per hect. of ICA. Funds received from ID and actual
expenditure incurred on maintenance during last three years were as follows.
Year Funds received Expenditure incurred on
from ID maintenance of distributary channel
1995-96 Rs. 3,400/- Rs. 5, 000/-
1996-97 Rs. 3,400/- Rs. 5, 500/-
1997-98 Rs. 3,400/- Rs. 6, 000/-
5.4.4.9The actual expenditure incurred was more than the amount received from ID. The expenditure
related to maintenance and up-keep of the main distributary whereas proper maintenance of
field channels was the responsibility of individual farmers. The excess expenditure on
maintenance of canal distributary was incurred by the association out of excess water charges
retained by it. Moreover, the assocaition received managerial susbsidy @ Rs. 100/- per hect.
of CCA for first two years of its existence and thereafter @ Rs. 75 per hect. of CCA for the
third year. From fourth year onwards no managerial subsidy was admissible. This was essentially
to enable the WUA to stand on its feet at initial stage and later on become economically
viable.
161

Training
5.4.4.10 A few selected farmer members were sent to WALMI, Aurangabad, for 2 to 4 days to
receive training in water management and judicious use of water for irrigation. However, for
lack of adequate water for irrigating fields, it was not possible to put into practice the methods
learnt through the training for optimum water management.
Views on Management Committee
5.4.4.11 The management committee of WUA invited many critisms from themembes for its failure
to sort out problems on
i) Management of equitable distribution of water and proper scheduling.
ii) Adequate and timely availability of water among users, especially tail end farmers.
iii) Dominance of powerful executive committee members in water distribution system of
the society.
iv) Sorting out inequitable water distribution related disputes among the farmers, and
v) Ensuring proper maintenance and repair to field channels which was the responsibility
of individual farmers.
5.4.5 Impact of the Programme
(A) Before and After Approach
Irrigated Area
5.4.5.1 Yearwise data on non availability of adequate water in the storage tank which was the bane
of this project has been given earlier. A similar picture emerged after analysis of beneficiary
level data collected by us during this study. Irrigated area per respondent was calculated for
the year 1993-94, as 'before', the year immediately preceding formation of the association
and for year 1997-98 as 'after' being the latest year for which full cropping pattern data were
available. Average irrigated area per respondent at two points of time are given in the following
table.
162

Table 5.4.1 : Average Irrigated Area per Respondent (0.00 hect.)
Before After
(1993-94) (1997-98)
Crops Grown No. reported Irrigated area No. reported Irrigated area
1 2 3 4 5
Sugarcane 1 1.00 5 0.55
(– 45.0)
Cotton 7 1.92 35 0.25
(– 86.4)
Wheat 9 1.58 24 0.26
(– 83.5)
Gram 9 0.97 14 0.13
(– 85.0)
Jowar 3 0.86 NIL NIL
Total 24 1.67 40 0.49
(– 70.6)
Figs. in brackets are indices of growth
5.4.5.2 In 1993-94 only 24 (60%) out of 40 respondents reported irrigation on their field, while the
rest reported no irrigation..Each of such respondents reported irrigated area of about 1.67
hect. under different crops. Although more respondents reported irrigation on different crops
'after', the actual irrigated area per respondent decelerated by 70 percent in 1997-98, taking
1993-94 as the base year. For 24 (60%) sample beneficiaries who had reported irrigation
'before' for as many as 19 (80%), their total irrigated area dwindled by 40 percent 'after', from
31.3 hec. to 18.7 hect. Only for 4 (16%) beneficiaries, who weilded dominance over others
becuase of their standing in the village and whose plots were located near head of the distributory
channel, reported increase in irrigated area by about 30 percent, from 7.0 hect. 'before' to 9.2
hect. 'after', while for another respondent irrigated area remained static over the period. As
regards individual crops irrigated, area under different crops receded every year after formation
of the association. That inadequate irrigation every year after formation of the association
unlike the other two selected projects had badly affected total crop yield will be evident from
subsequent paras.
It was perceived in the field that whenever water was released in the distribution channel that
163

invariably recharged the nearby wells which facilitated irrigation of crops along with canal
irrigation. With less quantum of water available for release, water in the nearby wells also
dried up and thereby further reduced the scope of irrigation.
Quality of Irrigation
5.4.5.3Before formation of the WUA irrigation was scanty. But unlike other associations studied in
this report the situation did not improve evenafter formation of WUA. Instead, it
deterioted as can be seen figures given below.
5.4.5.4 The data collected from the selected beneficiaries indicated that about 60 percent of them
reported adequate irrigation available before formation of the association, while for another
40 percent it was either inadequate or very inadequate. About one-third of them did not
receive timely irrigation. After formation of the association, the scenario presented a gloomier
picture in so far as 80 percent reported inadequate and untimely irrigation due to extreme
shortage of water.
Yield
5.4.5.5 Productivity of crops increased after formation of the association. This was mainly due to
better management of irrigation and judicious use of inputs. While productivity per hect.
increased, value of agricultural produce dwindled considerably, as we shall presently see as
comparatively lesser irrigated area was sown with crops for want of adequate irrigation for the
whole command area. Data are given in the table below :
Table 5.4.2 : Average Yield of Major Crops Grown per Hectare (Qtl. )
Before (1993-94) After (1997-98)
Crops Yield (Qtl. / hect.) Yield (Qtl. / hect)
Sugarcane 448.0 562.90
(25.64)
Cotton 5.42 11.34
(109.22)
Wheat 16.86 22.45
(33.15)
Gram 7.62 12.64
(65.87)
Jowar 13.93 NIL
Figs in brackets are indices of growth
164

Value of Produce
5.4.5.6 Although productivity of crops showed an uptrend 'after', average value of produce per
respondent in 1997-98 was less by one-third of value of produce grown in the year 1993-94.
Value of produce was computed at current year's prices. This was mainly due to shrinkage in
irrigated area for want of assured irrigation. One redeeming feature of the scenario was that
number of growers of crops like sugarcane, wheat, gram, and cotton increased with the prospect
of getting assured irrigation. But their hope was ultimately belied and for lack of adequate
irrigation they had to be content with lesser area under the crops.Data are brought out in table
below :
Table 5.4.3 : Average Value of Agricultural Produce per Respondent (Rs.)
(at constant prices)
Before After
Crops No. reported Average value No. reported Average value
Sugarcane 1 32,256 5 22,291
(–30.89)
Cotton 7 21,870 35 6,248
(–71.43)
Wheat 9 12,256 24 2,731
(–77.71)
Gram 9 8,132 14 1,808
(–77.76)
Jowar 3 4,200 NIL NIL
Total 24 15, 893 40 10,525
Average value (– 33.77)
per respondent
Figs in brackets are indices of growth
5.4.6 Impact of the Programme
(B) With and Without Approach
Average Irrigated Area
5.4.6.1 Average irrigated areas per respondent 'before' and 'after' were as follows. For comparison
'before' was recokoned as year 1993-94, i.e. before formation of the selected association
and 'after' as 1997-98.
165

Table 5.4.4 : Average Irrigated Area Per Respondent (0.00 hect.)
Before After
__________________________ __________________________
Crop grown No. Total Irrigated No. Total Irrigated
reported area(hec.) area (hec.) reported area(hec.) area (hec.)
1 2 3 4 5 6 7
i) Jowar 15 1.65 1.65 15 1.68 1.68
(1.8)
ii) Cotton 15 1.06 1.06 15 1.02 1.02
(– 3.00)
iii) Tur 1 1.00 1.00 1 1.00 1.00
(0.0)
Total per 15 2.78 2.78 15 2.76 2.76
respondent (– 0.7)
Figures in brackets are indices of growth
Average area was calculated on the basis of number reported. While all farmers cultivated
jowar and cotton under irrigated condition, only one of them cultivated tur (arhar) both 'before'
and 'after'.
5.4.6.2 Average irrigated area per respondent under cotton slightly decelerated 'after'. Total irrigated
area per respondent remained more or less the same over the period. Average irrigated area
per respondent was more than the corresponding figures for the selected beneficiaries, especially
'after' due to non-availability of adequate irrigation for the earlier group of farmers. About 60
percent of the respondents received adequate and timely irrigation both 'before' and 'after'.
Yield of Crops
5.4.6.3 Yield of major crops per hect. reported by the selected non-members was more than that
reported by the selected beneficiaries. For them jowar yield increased from 21 Qtl. / hect. to
22 Qtl. hect., an increase of about 5 percent over the period. For selected beneficiaries who
166

reported severe constraints of adequate irrigation, average cotton yield before formation of
the assocaition was around 5.42 Qtl. / hect. which however increased to 11.34 Qtl. / hect. in
1997-98 showing a growth of more than 100 percent. The yield position improved with
increasing availability of irrigation after formation of the association, albeit yield rate was no
where near the yield rate reported by the selected non-members, who reported consistent
supply of irrigation water by ID at two points of time. For other crops grown by the selected
respondents there was no commonality as far as crops grown by two groups of the selected
respondents were concerned. Hence no comparison in yield data was possible. The data are
given below.
Table 5.4.5 : Average of Yield Major Crops Grown per hectare (Qtls.)
Before After
Crops Yield Qtl./hect. Yield Qtl./hect
grown.
Rabi
i) Jowar 20.92 22.26
(6.40)
ii) Cotton 15.66 22.63
(44.5)
iii) Tur (arhar) 8.00 10.00
(25.0)
(Figures in brackets are indices of growth)
Value of Produce
5.4.6.4For reasons stated above i.e. availability of assured irrigation at both points of time 'before'
and 'after', value of produce per selected non-members was comparatively much higher in the
year 'before' around Rs. 38,000/- on an average per respondent, vis-a-vis Rs. 16,000/- per
selected beneficiary. While for the selected beneficiaries, average value of produce per
respondent decreased by more than one third 'after', for the selected non-members growth in
average value of produce 'after' was in inverse proportion. The value of produce was computed
at constant prices based on current year's prices to take care of temporal fluctuations in
prices. The data are given in the table below :-
167
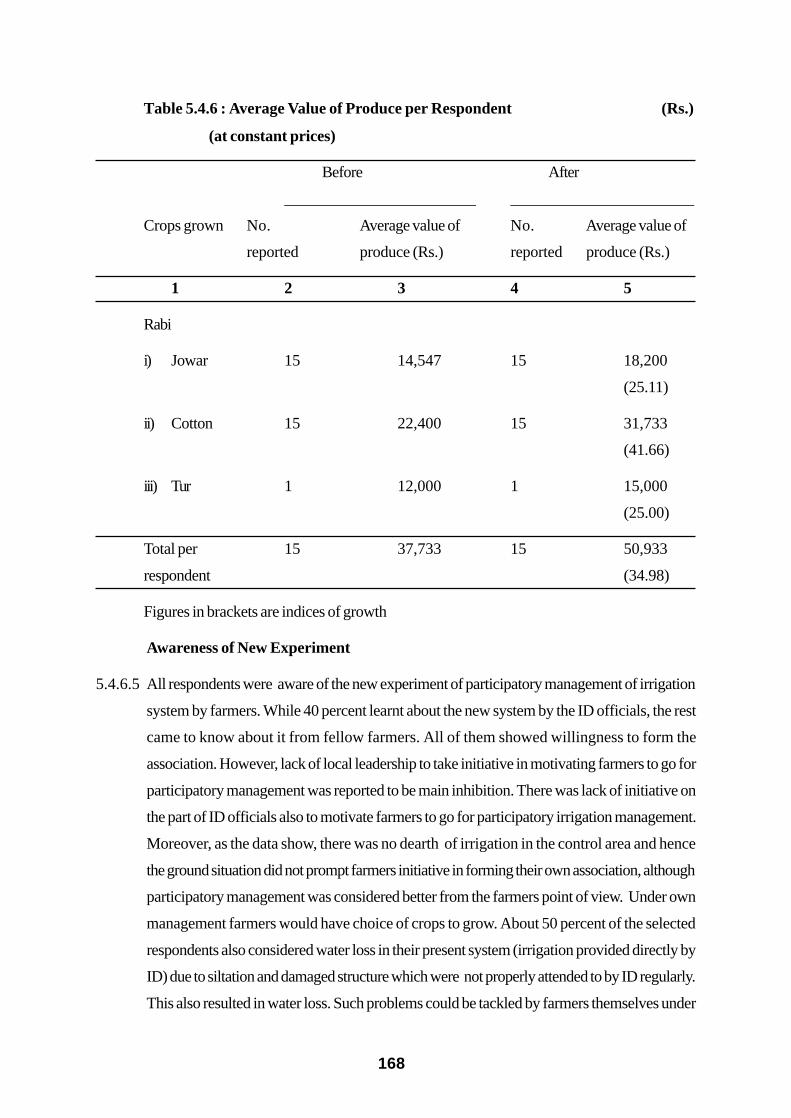
Table 5.4.6 : Average Value of Produce per Respondent (Rs.)
(at constant prices)
Before After
________________________ _______________________
Crops grown No. Average value of No. Average value of
reported produce (Rs.) reported produce (Rs.)
1 2 3 4 5
Rabi
i) Jowar 15 14,547 15 18,200
(25.11)
ii) Cotton 15 22,400 15 31,733
(41.66)
iii) Tur 1 12,000 1 15,000
(25.00)
Total per 15 37,733 15 50,933
respondent (34.98)
Figures in brackets are indices of growth
Awareness of New Experiment
5.4.6.5All respondents were aware of the new experiment of participatory management of irrigation
system by farmers. While 40 percent learnt about the new system by the ID officials, the rest
came to know about it from fellow farmers. All of them showed willingness to form the
association. However, lack of local leadership to take initiative in motivating farmers to go for
participatory management was reported to be main inhibition. There was lack of initiative on
the part of ID officials also to motivate farmers to go for participatory irrigation management.
Moreover, as the data show, there was no dearth of irrigation in the control area and hence
the ground situation did not prompt farmers initiative in forming their own association, although
participatory management was considered better from the farmers point of view. Under own
management farmers would have choice of crops to grow. About 50 percent of the selected
respondents also considered water loss in their present system (irrigation provided directly by
ID) due to siltation and damaged structure which were not properly attended to by ID regularly.
This also resulted in water loss. Such problems could be tackled by farmers themselves under
168

their own management of irrigation system.
5.4.7 Overview of the Programme
5.4.7.1 The factors primarily responsible for successful operation of the new experiment of farmers
participation in irrigation management unfettered from departmental shackles and control, such
as (i) dedicated local leadership to motivate farmers to go for such experiments, ii) availability
of adequate water for irrigation, and iii) helpful attitude of local irrigation officials to promote
management of irrigation system by farmers themselves were not discernible in this area. The
selected project therefore could not achieve success due to such factors.
5.4.7.2There was disinclination on the part of the farmers to go in for such experiments. They were
initially apathetic to the idea of taking over the irrigation management by themselves. For, they
were not hopeful of the prospects of adequate water accumulation in the storage tank. It was
through the extension efforts of WALMI officials that they were ultimately persuaded to form
the association.
5.4.7.3The attitude of the irrigation officials was, by and large, lukewarm towards the new experiment.
No effort was made by them at initial stage to help farmers in forming the association.
Afterwards, when the association was formed, they could not put forth better efforts towards
its successful operation for want of adequate water. This was the picture of almost all medium
and minor irrigation projects in this region as the whole area was stricken with drought conditions
and inadequate rainfall. This was a unique scenario which affected successful operation of
farmers' participation in irrigation management, not perceived in other regions of the state.
5.4.7.4The farmer members also held the view that executive committee members having land at the
head of the channel grabed more water for irrigation whenever water was released at high
pressure by I.D. Farmers at tail end could not get required quantum of water for irrigation. It
is, therefore, suggested that the same experiment of water distribution system as tried at Parunde
and Rui (Palkhed) should also be implemented at Loni village.
169

5.5 An Overview of the selected Projects in the State (Maharashtra)
5.5.1 In Maharashtra the farmers association selected under the major irrigation project had a command
area of about 212 hect. CCA within the sub-minor distributary. In other two selected projects
also total command area of the distributary on which the farmers associations were formed for
participatory irrigation management was also not very large, around 300 to 100 hect. each.
Though the area under operation of each selected project was not very large, the study brought
to light some of the conspicious benefits derived by the farmers out of the new dispensation. The
main benefit derived by them was the choice of crops grown by them with the available water in
each season as per MOU signed by the farmers' association with the Irrigation Department.
Infact, uncertainty of availability of water, especially at the tail end of the canal system impelled
farmers to unite together and form the association to ensure quantum of assured water from
Irrigation Department. The new experiment was also preferred by ID officials as farmers own
management relieved them of the onerous task of entering into agreement with individual farmer
for supply of water so that they could devote more time and energy to the maintenance of the
main canal system. The new experiment also proved economically beneficial to the farmers in so
far as it was within their choice to save water through judicious use in rabi season for utilisation
in hot weather season for raising high value crops and thereby increase their income.
5.5.2 The study further revealed that successful implementation of farmers participation in irrigation
management depended on several factors, such as supply of assured water in each season as
per agreement signed with ID, local leadership to inspire farmers especially in water starved
areas to form water users society to ensure assured availability of water by entering in to agreement
with ID, and dedicated and cooperative ID officials to encourage farmers to go for such
experiments. Wherever these factors were absent, the new experiment could not make much
headway.
5.5.3 Each of the selected projects in Maharashtra covered a compact command area comprising a
single village. This also helped successful operation of the project as all farmers belonged to a
homogenous social group where everybody knew others and no problem in taking joint decision
on the management of irrigation system was encountered.
5.5.4 A study of the irrigation system being followed in control areas of the selected projects where
irrigation was provided by ID direct to individual farmers showed that whenever assured irrigation
was available there was not much difference in economic and irrigation status between two
170

groups of farmers. Nevertheless, the selected non-members in control areas preferred
participatory management in irrigation system by themselves due to its inherent merits, such as
option to choice crops to be grown and the advantage of saving water in one season for use
afterwards for raising high value crops. However, despite their best intentions they could not go
for new experiment due to certain inhbiting factors such as area of land not being within the
prescribed limit to form the association as per amended Irrigation Act or lack of local leadership
for motivation.
171