CHAPTER TREND AND GROWTH OF STATE EXPENDITURE OF...
60
CHAPTER I11 TREND AND GROWTH OF STATE EXPENDITURE OF INDIAN STATES The public sector has been assigned a key role in the economic development of underdeveloped countries and hence there has been a rapid expansion of the publlc sector 1 in a developing economy like India. As Flicks aptly points out, "The rapid expansion of public sector is now a universal phenomenon. " Adolf wagner2 has established a functional relationship between industrialisation and the relative importance of public sector activities. According to Wagner's law, the expansion of public expenditure is in proportion to the growth of the Gross National Product. According to Wagner, an increase in state activity is accompanied by an increase in government expenditure as a proportion of National Income. This is due to the fact that the government has to perform a number of functions more efficiently, which has led to an intensive growth in public activity thereby increasing government expenditure. According to Peacock and Wiseman, public expenditure grows over time, not at a constant rate, but on an ascending spiral. Social emergencies like war and
Transcript of CHAPTER TREND AND GROWTH OF STATE EXPENDITURE OF...

CHAPTER I11
TREND AND GROWTH OF STATE EXPENDITURE
OF INDIAN STATES
The public sector has been assigned a key role in
the economic development of underdeveloped countries and
hence there has been a rapid expansion of the publlc sector 1
in a developing economy like India. As Flicks aptly
points out, "The rapid expansion of public sector is now a
universal phenomenon. " Adolf wagner2 has established a
functional relationship between industrialisation and the
relative importance of public sector activities. According
to Wagner's law, the expansion of public expenditure is in
proportion to the growth of the Gross National Product.
According to Wagner, an increase in state activity is
accompanied by an increase in government expenditure as a
proportion of National Income. This is due to the fact
that the government has to perform a number of functions
more efficiently, which has led to an intensive growth in
public activity thereby increasing government expenditure.
According to Peacock and Wiseman, public
expenditure grows over time, not at a constant rate, but on
an ascending spiral. Social emergencies like war and

depression require a sizeable increase in their relative 3
share of public expenditure. Peacock and Wiseman relate
the growth of public expenditure to external forces like war
and displacement effect.
"One of the characteristics of economic
development and the course of industrialisation is the urban
movement and with it disappears the informal security of the
family and village. Urban population must be supplied with
formal social security, unemployment insurance and formal
community protection to replace the family and village
functions. This would support the hypothesis of an
increasing government' share In national inc~me."~ Thus
industrialisation, urbanisation and economic development
necessitate the rapid growth of public expenditure in an
economy. In addition, the expansion of the public sector
may also be owing to the growth of population, rise in
prices and economic growth.
Against this background, an attempt has been made
in this chapter to trace the growth of expenditure of twenty
two Indian states in nominal and real terms. Further,
p3pulation is considered as a permanent factor influencing
the growth of expenditure, as the rise in population leads
to a rapid rise in the demand for governmental services. A
given level of services may no longer be sufficient for an
increased level of population.

The. State D,omestic Product is also equally
important in influencing the growth of state government's
expenditure. As the level of State Domesti-c Product rises,
the proportion of different governmental services like
education, health, and transport to the State Domestic
Product will also grow. Therefore, in this chapter, an
analysis has also been made in terms of expenditure per head
of population and expenditure as percentage of the State
Domestic Product for 1969-70, 1980-81 and 1988-89.
The growth of expenditure may also be owing to
rise in prices. In order to eliminate the effect of price
change^,^ the growth of states' expend~ture in real terms is also examined. Thus, this chapter elucidates the trend and
pattern of states' expenditure in aggregate terms, the ratio
of expenditure to the State Domestic Product, and the
expenditure per head, both in nominal and real terms, during
1969-70 to 1988-89.
In order to analyse the trend, pattern and growth
of states' expenditure, public expenditure has been divided
into two main categories. They are Capital and Revenue
expenditure. It is also classified as development and non-
development expenditure. Development capital expenditure is
again divided into expenditure on Agriculture, Industries
and Public Health. Similarly, revenue expenditure is

divided into development and non-development revenue
expenditure. Development revenue expenditure comprises
expenditure on education, public health,-agriculture and
industry. Under non-development revenue expenditure,
expenditure on administrative services is also considered.
The following chart gives a clear picture of the
classification of expenditure of state governments.
( CHART - I I STRUCTURE OF STATE GOVERNMENT'S EXPENDITURE
I I
CAPITAL EXPENDITURE
I- I
I REVENUE EXPENDITURE
I-- I DEVELOPMENT NON-DE~~EIQPMENT DEVELOPMENT NOS-DEV~LOPMENT EXPENYITURE EXPENDITURE EXP~NOI'I'L'Hb EXPEYDITURI:
I
AGR~CULTUHE INDUSTRY PUBLIC HEALTH
1-'-1 I PUBLIC EDUCATION AGRICULTURE INDUSTRY 1 HEALTH
3.2 CAPITAL EXPENDITURE
I ADMINISTRATIVE SERVICES
Capital expenditure depends on various
imponderables like the floating of debt in the open market,
mobilisation of small savings, availability of credit, flow

71mE 3.11 U P l T M EXPUDITURE DF I lOIW STATES WIllN6 1969-70, 19W-81 AND 198D-89
(Rs. i n Lakhrl
Verr 81. Strtmr ........................................................ lo. 1969-70 1980-81 1988-89
1 Andhrr Praderh
2 A r r r r
3 l i h r r
4 Guj r ra t
5 Hrryma
6 H l r r c h r l Praderh
7 Jrrmu & K a r h i r
8 Krrnr t rka
9 X e r r l r
10 Iladhya Prrdesh
I1 Naharrshtrr
I1 Nmipur
13 h q h a l y a
I4 I l apr lmd
I5 O r i r s r
I6 Punjab
17 RrJrs thrn
18 Gikk i8
I9 T a 8 i l l r d u
20 T r l p u r r
21 U t t r r Praderh
22 Yer t B8no.l

of grants-in-aid, loans and advances from the Government of
India.
Table 3.1 indicates the broad &ends in capital
expenditure of the Indian states and its percentage share in
State Domestic Product at factor cost. The overall states'
expenditure has increased from Ks. 51,131 lakhs in 1969-70
to Rs. 7,28,428 lakhs in 1988-89, showing an increase of
fourteen times. Maharashtra shows the highest capital
expenditure of Rs. 8,789 lakhs in 1969-70, which has
increased to Rs. 34,258 lakhs in 1980-81, further went up to
Rs. 86,390 lakhs in 1988-89. Haryana shows the lowest
capital expenditure in 1969-70 and 1988-89 while in 1980-81,
Assam shows the lowest capital expenditure. The special
category states6 indicate a lower amount of capital
expenditure than the other states.
But the percentage share of capital expenditure in
the State Domestic Product of Indian states is higher in the
case of Special Category States ranging from 14.5 per cent
(Tripura) to 33.5 per cent (Sikkim) in 1988-89. Among the
other states, the overall percentage share of capital
expenditure in the State Domestic Product ranges from 1.1
per cent to 4.7 per cent in 1988-89, because the capital
expenditure is financed by central government resources
other than the resources of the state government. The
60 TALE 3.21 ~ I H F w 1 1 n EP~OINE m IEM F WIU srhm E~RIP isbv-n, I- l l ~ I-
(in rwnl
j lPb?-70 I 1m-m l9m-m 01. Strk ,-I YP. IRr @ b I At Dvmt R h I At lbntmt Rica I At h t k i a I At h t m t R h
I (In Ll : I 9u cwitr 1nhx OfI 9u CIpitr lnhx Of : FN Wltr I*: Of I 9u Wltr 1-x ol : Iln Ll Emth j lh Ll Emth I [ in hl Bmd : lln Ll Bmth
0-0 a -

percentage share of capital expenditure in the State
Domestic Product is the highest in Karnataka, Madhya
Pradesh, and Kerala in 1969-70, 198&81 and 1988-89
respectively. The lowest share of capital expenditure in
the State Domestic Product is shown by Tamil Nadu in all the
years selected.
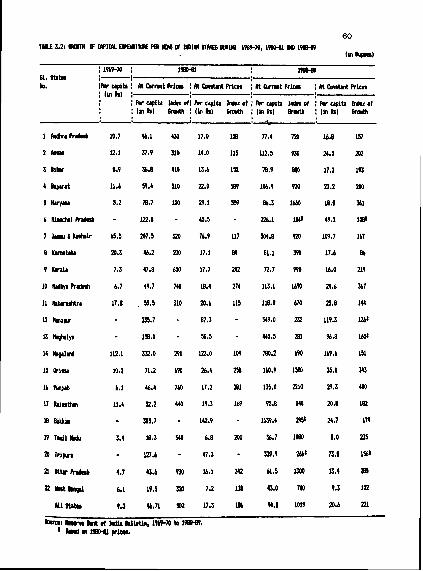
Table 3.2 depicts the growth of capital
expenditure per head of Indian states during 1969-70, 1980-
81, and 1988-89. In 1969-70, at constant prices, states
such as Andhra Pradesh, Assam, Gujarat, Jammu and Kashmir,
Karnataka, Maharashtra, Nagaland, Orissa, and Hajasthan were
higher than all states per capita expenditure of Rs. 9.30.
But in 1980-81, Gujarat, Haryana, Himachal Pradesh, Jammu
and Kashmir, Kerala, Madhya Pradesh, Mahnrashtra, Manipur,
Meghalaya, Nagaland, Orissa, Rajasthan, Sikkim and Tripura,
were above all states per capita expenditure of Rs. 17.30.
The states such as Assam, Gujarat, Himachal Pradesh, Jammu
and Kashmir, Madhya Pradesh, Maharashtra, Manipur,
Meghalaya, Nagaland, Orissa, Punjab, RajaSthan, Sikkim and
Tripura were above all states per capita expenditure of Rs.
20.60 in 1988-89. All States average index of growth of
expenditure in nominal terms has increased from 502 per cent
to 1,019 per cent while in real terms it has increased from
186 per cent to 221 per cent during 1980-81 to 1988-89.
Gujarat, Haryana, Kerala, Madhya Pradesh, Orissa, Punjab,

Tamil Nadu, and Uttar Pradesh show a higher index of growth
than the all states' average index of 186 and 221 in 1980-81
and 1988-89 respectively.
3.3 CAPITAL DEVELOPYENT EXPENDITURE
Capital development expenditure consists of items
such as education, public health, agriculture, industries
and miscellaneous items which are productive in nature.
Table 3.3 indicates the trend in capital development
expenditure of Indian states and its percentage share in the
State Domestic Product. There is a rising trend in the
aggregate capital development expenditure which has
increased from Rs. 50,050 lakhs in 1969-70 to Rs. 7,03,451
lakhs in 1988-89 showing nearly an increase of fourteen
times. The highest expenditure is shown by Maharashtra,
i.e., Rs. 6,766 lakhs in 1969-70, Rs. 47,079 lakhs by Uttar
Pradesh in 1980-81, and again by Mal~arashtra with Hs. 84,202
lakhs in 1988-89. The lowest capital development
expenditure among the special category states is shown by
Nagaland in 1969-70 and Sikkim in 1980-81 and 1988-89. The
percentage share of this item of expenditure in the State
Domestic Product is higher in the case of Special Category
States ranging from 14.1 (Tripura) to 31.9 (Sikkim) in 1988-
89. Among the other states, Assam and Orissa have recorded
the highest share in the State Domestic Product, i.e., 2.2

1Rup.m~ i n Lakhs)
Verr 81. Btatms Yo. 1969-70 1780-81 1989-89
1 bndhrr Pradmsh 4,152 (1.7111 24,523 13.4111 46,106 (2.9111 ( 90.511 (98.811 -. 196.711
2 Assan 6 4 2 . 2 1 7,428 i3.05111 16,267 10.4111 I 96.011 I98.311 (96.011
3 Dihar 4 7 2 . 1 1 1 1 25,648 I 3 . 9 ) I I 62,490 (3.8111 ( 95.811 (99.611 (90.011
4 Bu la r r t 3,396 (1.6111 19,708 13.0111 41,568 (2.7111 1112.711 197.251 199.3\1
I k r y a n a 730 (0.9111 9,997 13.3111 1i,856' (1.9111 l145.311 (97.811 (97.011
6 Himachrl Pradmsh 5,056 17.6111 10,688 (6.1111 196.11 I 195.711
7 Jammu I Kwhmir 5 4 7 . 5 1 12,064 (13.8111 35,228 (19.1111 ( 63.111 (97.111 (98.611
8 Karnataka 6,171 17.5111 16,271 12.4111 33,937 ( 2 . b l I I (106.511 (94.811 (96.311
9 Kerala 7 7 1 . 4 1 1 1 , 8 1 5 3 . 4 1 1 20,400 (2.7111 (111.8) I 0 7 . 0 1 1 191.1I I
10 Radhya Pradesh 2,763 (1.4111 25,857 (4.18111 62 ,460 14.0111 i100.511 (99.511 (91.011
I 1 Mahararhtra 6 7 6 6 1 . 7 1 1 3 , 0 4 9 (2.4111 84,202 (2.4181 (77.0 I 1 199.418 197.511
I 2 Ranipur 3,177 I l b . l I I 1 8,7bO 117.7111 (97.01 I (93.911
13 Ileghalya 2,036 (13.8111 6,339 116.3111 (96.5) I (92.0):
14 Yagaland 525 i21.8111 2,477 123.6111 7,111 120.8) I I (95.5 11 196.411 193.011
17 Rrjasthsn
I B Bitkim
19 Tamil Madu
20 Tripura
21 U t t a r Prrdlsh 4,722 11.2111 47,079 13.3111 77,643 (1.5188 (120.911 197.811 (97.811
22 k s t L n o a l - 2.BO 10.711: 10,208 (1.1111 23,328 ( 1 . 2 ) I I
A l l Btatms 30,050 3,12,870 7,0S,451
h r c m t Rmsmrw Bank at Ind ia Bul lmtin, 1969-70-19BB-89 h t m I O 8hw th. p r c m t r g . of Cap i ta l i tevelopent Erpmditurm i n Stat.
D m m t I c PrO*Kt. : Oho* th. pwemtagm of Cap l ta l Dmwlnpmmnt Expmdl tu re I n To ta l
C q l t a l E q n d l t u n

: 1w-m I Imc-oI ;-I
1- 81. 6 t h lb. :hr u p i b I M k t Rlm I M Cprntmt Rks : Y Pvmt Rlm I lt Pmtmt Rlm
I lin Ibl : L Pa capita lrdn ot: Pa capita lndn ot I Rr u p i b lrdn ot I Pa upita lnOlx ot j lin lbl earth j (in Ibl BrorUl I (in b! BlPlUl I (in bl earth
0-1 I
19 lull m 3.9 17.6 m 6.3 110 s.8 no 7.3 IZ

per cent in 1969-70, Orissa with 5.9 per cent and 7.5 per
cent in 1980-81 and 1988-89 respectively. The lowest
percentage share in the State Domestic Product is shown by
West Bengal both in 1969-70 and 1980-81, and by Tamil Nadu
in 1988-89.
Table 3.4 presents the growth of per capita
capital development expenditure of Indian states during
1969-70, 1980-81 and 1988-89. Andhra Pradesh, Assam,
Gujarat, Himachal Pradesh, Jammu and Kashmir, Karnataka,
Maharashtra, Nagaland, Orissa, and Rajasthan show a higher
capital development expenditure than all states' per capita
Of Rs.9.10 in 1969-70. But in 1980-81, Andhra Pradesh,
Gujarat, Haryana, Himachal Pradesh, Jammu and Kashmir,
Kerala, Madhya Pradesh, Maharashtra, Manipur, Meghalaya,
Nagaland, Orissa, Rajasthan, Sikkim and Tripura show a
higher per capita capital development expenditure than the
all States' per capita of Rs. 16.90. In 1988-89, Assam,
Gujarat, Himachal Pradesh, Jammu and kashmir, Madhya
Pradesh, Maharashtra, Manipur, Meghalaya, Nagaland, Orissa,
Punjab, Rajasthan, Sikkim and Tripura show higher than all
States per capita expenditure of Rs. 19.93. Further,
Haryana, Kerala, Madhya Pradesh, Orissa, Punjab and Uttar
Pradesh have shown a higher index of growth than the all
states' average index of 185 per cent in 1980-81, and
Haryana, Jammu and Kashmir, Madhya Pradesh, Orissa, Punjab

and Uttar Pradesh show above all States average index of 219
in 1988-89. The all-state average index of growth in
nominal terms has increased from 501 per ceiit in 1980-81 to
1,007 per cent in 1988-89, while in constant terms it has
increased from 185 per cent in 1980-81 to 219 per cent in
1988-89.
3.4 CAPITAL EXPENDITURE ON AGRICULTURE
Agricultural expenditure on capital account
includes water and power development, and other allied
services. The higher priority given to agriculture in the
five-year plans and the transformation of traditional
agriculture into modern agriculture have resulted in vast
changes in the expenditure on agriculture. Table 3.5
represents the capital expenditure on agriculture of Indian
states and its percentage share In the State Domestic
Product at factor cost and the percentage share in the total
capital expenditure. The overall states' aggregate
expenditure on agriculture was negative with Its. 52 lnkhs in
1969-70 and rose to Rs. 45,588 lakhs in 1988-89, owing to
the creation of infrastructure in agriculture and allied
services. The highest capital expenditure on agriculture is
incurred by Bihar (Rs. 334 lakhs in 1969-70), Uttar Pradesh
(Rs. 9,699 lakhs in 1980-81) and Maharashtra (Rs. 9,397
lakhs in 1988-89). The lowest expenditure is incurred by

67 TLslE 3.51 W I T P EXPENDITURE O* MRICUTURE ff I W I U 81hTES W R I M 1769-10, IPm-PI
#I0 178s-09 (Rupees i n Laths1
Year 01. 8t.t.S ................................................... Yo. 1969-70 1980-81 1980-09
1 h d h r a Pradesh 24 10.0)I I 1,474 (0.2)I I 1,424 (0.08111 ( 0.518 1 6.011 - ( 3.011
2 Assam 1632 (0.7188 648 (0.10111
3 BLhar 334 10.1111 5,322 (0.8)I I 4,548 10.3111 ( 6.818 (20.711 ( 7.118
4 Bularat 5 (0.0111 364 (0.03):: 4,445 (0.3111 ( 0.211 1 1.811 (10.611
3 Uaryanr 20 10.02)11 - 490 10.15)11 1,301 10.2)II 1 3.418 I 4.011 I 9.811
6 Hinachal Pradesh 607 (0 .9 ) I I 655 (0.4111 (11.511 1 3.911
7 Jansu L K a r b i r - (0.0710 2,467 (2.8111 2,222 11.2)11 8 (19.811 ( 6.211
8 Karnrtrka - (0.0111 1,660 (0.3111 560 (0.04118 I ( 9.711 ( 1.611
9 Kerala 9 (0.06111 963 (0.3):: 1,466 (0.2):: 1 0.6): ( 7.9): ( 7.011
10 lladhva Pradesh 180 10.04)II 7 4 1.14111 3.191 10.2)tI
15 Orirsa
16 Punjab
17 Rajasthm
18 S ikk ie
19 Tani l Nadu
20 Tr ipura
21 Ut ta r Pradesh
22 Yest h n q a l
611 stat..
k r c e l h s e r v e k n k of Ind ia Bu l le t in , 1969-70 to 1986-89 hta I I1 Bha tin percentage of Capi ta l Expmditure on. I )pr lcul tum i n
l t a t a Damstic h d u c t . 8 IhR1 tk. percentage of Capi ta l E x p a d l t u r e on h g r i c u l t u r e i n
l e t r l C a p l t r l Expmditure

68 TW 3.b: BIW IF WIT# UPDDIW m ~ I M W m I ~ W IF IBIW SIATES IU~IS IWN, IM m I-
lln mwml
I l W N : I M I _ _ (
Isages 61. 9bta 10. :Far @b I At hrmt Ricn I At lm l tn t Rlnr I At U m t Prlnr I At Cmstnt Rita
I lln Ibl I I : Far capih lndn o i l hr ciplb lndrx d I Rr c@b lndn of I Rr @b Ir&z ot
I lin Ibl %arm I lin Rrl h t h j lin ihl h t h l lin Rrl h t h I 0 , -

Gujarat with Rs.4 lakhs and again Gujarat Rs.364 lakhs and
Karnataka Rs.560 lakhs in 1969-70, 1980-81 and 1988-89
respectively. Among the special categwy states, the
highest expenditure is incurred by Jammu & Kashmir Rs.2,467
in 1980-81 and Rs.2,222 in 1988-89. The lowest expenditure
is incurred by Meghalaya Rs.2 lakhs and 114 lakhs in 1980-81
and 1988-89 respectively. The ratio of capital expenditure
on agriculture to the State Domestic Product is very small
in the case of all states, i.e., ranging from 0.04 per cent
(Karnataka) to 1.2 per cent (Manipur and Sikkim) in 1988-89.
Table 3.6 presents growth of capital expenditure
per head on agriculture of Indian states during 1969-70,
1980-81 and 1988-89 at current and constant prices. At
constant prices, Bihar, Haryana, Jammu and Kashmir, Madhya
Pradesh, Maharashtra, Orissa, Rajasthan, and West Bengal
were above all States' per capita of Rs. 0.09 in 1969-70
while Assam, Bihar, Himachal Pradesh, Jammu and Kashmir,
Madhya Pradesh, Maharashtra, Manipur, Nagaland, Orissa,
Sikkim, Tripura and Uttar Pradesh were above all States per
capita of Rs. 2.40 in 1980-81; Gujarat, Haryana, Himachal
Pradesh, Jammu and Kashmir, Maharashtra, Manipur. Meghalaya,
Nagaland, Punjab, Sikkim and Tripura were above all States
per cdpita of Rs. 1.29 in 1988-89. In addition, the per
capita capital expenditure on agriculture on all Indian
states shows a decliiiing trend, i.e., from Rs. 2.4 to

Rs.1.29 during 1980-81 to 1988-89. At current prices, the
index of growth was 7,266 per cent in 1980-81 and declined
to 661 per cent in 1988-89 and at consta& terms, it was
2,666 per cent in 1980-81 and 1,433 per cent in 1988-89.
3.5 CAPITAL EXPENDITURE ON INDUSTRIES
The significance of industrialisation in the
process of economic development has been realised in India
and consequently the expenditure on industries has increased
considerably. The rapid expansion of the public sector and
significant progress in the field of science and technology
have resulted in enormous expenditure on industries in the
Indian states. But the concentration of industrial
development leads to regional imbalances, where this
expenditure is higher only in a few states.
Table 3.7 shows the capital expenditure on
industries and its share in the State Domestic Product and
the total capital expenditure during the years 1969-70,
1980-81 and 1988-89. The expenditure of all tho States has
increased nearly eight times, i. e., from Rs. 6,710 lakhs in
1969-70 to Rs. 46,618 lakhs in 1988-89. The highest
expenditure is recorded by Uttar Pradesh - Hs.915 lakhs in 1969-70, Rs.2,677 lakhs in 1980-81, and Rs. 11,007 lakhs in
1988-89. The lowest expenditure is incurred by the special

i l u p a r I n Lakhsl
Vrar 91. Btates #a. 1969-70 1980-81 1988-89
1 Andhra Pradrsh 784 i0.3111 1,452 10.3111 4,U5 (0.3111 i17.111 i 5.918 -r i 9.111
2 Arram 232 10.3111 178 10.1111 3,202 (0.3111 (13.511 i 2.411 111.011
3 Bihar 180 (0.07111 606 (0.1111 2,663 (0.01111 ( 3.711 1 2.411 1 4.211
4 Bujarat 413 iO.2111 136 i0.01111 1,591 ~ 0 . 1 ~ 1 1 (13.711 1 0.711 ( 3.811
5 Haryma I50 10.2118 125 (0.03111 209 10.04111 i31.111 i 1.211 1 2.211
6 Himachal Praderh - 102 i0.14111 475 (0.3111
8 Karnataka 527- iO.03111 1 2 7 10.23111 1,904' IO.14111 ( 9.111 ( 7.411 ( 5.41:
9 Krrala IS5 (0.111: 1,452 iO.41111 1,835 iO.2111 ( 3.811 (11.911 I 8.818
10 Iladhvr Pradcrh 522 10.24l11 436 (0.06III 1.632 10.1111 .- .
11 Lhararht ra BPO (0.2111 . 791' IO.OSIII i , z 7 1 10.0b111 (10.1lI i 2.311 i 2.611
12 L n i o u r 94 10.5111 456 (0.9111
.- - . 20 Tripurs 92 i0.36111 252 (0.4111
( 3.511 1 3.011 21 Uttar Pradrsh 915 (0.2111 2,677 i0.2111 11,007 iO.2111
122.3l: 1 5.711 113.911 22 West Ikngal 169 (0.04111 670 (0.07111 2,710 10.12111
l b.318 I 6-31 1 (10.01 I
Al l S t a b s 6,710 12,348 46,618
h r c n l h r e r v r )mk of India Bulletin, 1969-70 to 1980-B9 btr I I8 8ha tk p r c a n b p . of Capital Erpndi tvr r a Induntr in i n State
h n t & trodltct. 8 Iko* tk rrcantage of Capital Eapnditure n Agriculture i n

TME S.81 m LF RR wnh wnn ~ W P I ~ ~ R E w ~ I E S IF IIOM SIAW URIS lwm, 1- m I- (in Ryrnl
I I w m I 1W-m 1- PI. Bbh 1-8
Ib. I k cwib I At Pmnt Rlca I At h t n t R h I ht lumnt Prlm I At &tat Rlcn I lln bl I
I Rr cwtr lrdn pl: k rrplta Indmx of I Rr rrplta In&" pl : Rr capltr lndlx pl
: lln bl h i t h j lin Ll Grmth l lln Ll &with I lin lbl h t h I t I -. :

category states Nagaland (Rs. 67 lakhs) in 1969-70 and
Sikkim (Rs.40 lakhs) in 1980-81, and again Sikkim (Hs. 141 - lakhs) in 1988-89. The percentage share of this item of
expenditure to the State Domestic Product is very low, below
1 per cent in all the states. Besides, it remained stable
during 1969-70 and 1988-89.
Table 3.8 presents the growth of per capita
capital expenditure on industries both at current and
constant prices of twenty two Indian states during 1069-70,
1980-81 and 1988-89. Andhra Pradesh, Assam, Gujarat,
Haryana, Jammu and Kashmir, Karnataka, Maharashtra,
Nagaland, Orissa and Punjab were above the all States per
capita capital expenditure on industries of Rs. 1.22 in
1969-70 while Andhra Pradesh, Himachal Pradesh, Jammu and
Kashmir, Karnataka, Kerala, Manipur, Meghalaya, Nagaland,
Orissa, Punjab, RajaSthan, Sikkim, Tripura and Uttar Pradesh
were above the all States' per capita expenditure of Rs.
0.68 in 1980-81; Andhra Pradesh, Assam, Himachal Pradesh,
Jammu and Kashmir, Kerala, Manipur Meghalaya, Nagaland,
Orissa, Punjab, Rajasthan, Sikkim, Tripura and Uttar Pradesh
were above all States' per capita expenditure of Rs. 1.30 in
1988-89. The growth index of expenditure on industries in
Bihar, Jammu and Kashmir, Karnataka, Kerala, Rajasthan,
Uttar Pradesh and West Bengal shows a higher index than that
of the all states average of 55 per cent, and Assam, Kerala,

Meghalaya, Orissa, ~a~asthan, Sikkim, Tripura, Uttar Pradesh
and West Bengal show a higher index of growth than the all
states average index of 106 in 1980-31 and 1988-89
respectively at constant prices. At current price, the
index of growth was 151 per cent and 490 per cent in 1980-81
and 1988-89 respectively.
3.6 CAPITAL EXPENDITURE ON PUBLIC HEALTH
Public Health expenditure is wealth-producing as
well as health-producing. Among social services, health
stands second to education in India. As a welfare State, the
state governments spend a large amount in the provision of
medical health services such as construction of hospitals,
promotion of medical education, establishment of primary
health centres and sub-centres in the villages, etc.
The continuous rise in expenditure on medical and
public health services of all the states in India can be
seen from the Table 3.9. There is not much growth in this
item of expenditure during 1969-70 and 1988-89. The
aggregate expenditure on health has increased from Rs.
21,766 lakhs in 1980-81 to Rs. 20,764 lakhs in 1988-89.
Rajasthan shows the highest expenditure of Rs. 3,466 lakhs
in 1980-81 and Uttar Pradesh Rs. 2,858 lakhs in 1988-89.
The expenditure has shown a decline in 1988-89 in almost

75
TAKE 3.91 WITAL EIPENDITW(E I R4LTH ff IWDIM STATES DW)IY6 1969-70, 1980-81 MD 1963-89
L R u ~ e s I n Lakhsl
Year 61. 8 ta te r ............................................................... lo. 1969-70 1980-81 1988-89
kndhra Pradash
Assaa
Dlhar
Bularat
Haryana
Hi.achal Pradesh
Jaaeu & Karhair
Krrnataka
Kerala
Hadhya Praderh
13 L g h r l y a
14 Yaqr lmd
15 Orisra
I b Punlab
17 Ra ja r thm
18 Slkki.
19 l a a l l Nadu . .
20 Tr ipura 245 10.9111 100 L0.2111 ( 9.311 ( 1.311
21 U t t a r Pradash 789 i0.05111 2 , 8 1 i0.05111 1 1.611 I 3.611
22 Mast Banpal 645 ( 0 . l l l I I 1,587 (0.07111 1 6.011 1 5.91 I
A11 8 t a t n 21,766 20,764
B o l l r n r L u r v a Dank ~f Ind ia Bu l le t in , 1PbP-70 to I?@-89. b t a I I 1 skpl tk p n r c n t r g o of Capital E x p m d l t u n m l n d u r t r l n in State
h s t l c P r d u c t . I Ika th p r c m t a g o of l h p i t a l Erpnndl ture on Agricul turm I n
rota1 c . ~ i t r l Exe# l i tun

IlWrn I 1W-u 19m-m B. s t a t 6 1-1
h. IR caplta I Y brmt R i c n : :It Cmstmt R i r a I At brmt R u m I M Cmstmt Ricn I lln bl I
I Pa c w t a lndrx of: Pa u p i t . 1tdwd.x of : R capita lnbr of : R u p i t a l n h x of :Ilnbl 8mth I l i n b l bpUl I l i nb l - 8mth : l i n b ) 8mth
(-0 , 1
I M h r r Pr* - 2.0 0.7 0.5 W 0.1 I 4
2 km - 2.0 0.7 7.0 M) 1.5 214
S B i k - 4.5 1.7 2.2 10 0.3 21
4 W u r t - 4.1 1.5 0.3 10 0.1 6
3 wm - 2.2 0.8 2.9 130 0.6 75
6 Whl R M - 27.8 10.3 5.1 ?O 1.1 10
1 J u L X I l h i r - 91.4 14.6 8.9 ?O I.? 13
8 KwMU - 0.2 0.07 3.4 170 0.7 1WO
9 W a l l - 6.8 2.5 b.5 W 1.4 !4
10 *a R M - 0.5 0.8 2.5 D 0.5 Al
11 I lrhrashtrr - 1.4 0.5 2.8 200 0.6 M
12 nmip~r - M-7 20.3 8.9 20 1,s 9
I S kphrlyl - 6.3 24.5 14.2 20 3.1 12
I4 h l m d - 65.3 24.2 $4.1 YI 7.4 50
15 bllv - 1.4 0.5 0.5 4b 0.1 ?O
lb hiah - 2.6 0.7 4.1 IbO 0.9 100
I1 birth - 10.1 3.7 1.1 10 0.2 5
18 Bikth - 28.1 10.4 18.2 M 4.0 JB
19 T r i l kdu - 1.2 0.4 2.8 250 0.6 II
10 Tr ipar - 11.9 4.4 4.4 4b 0.9 225
21 Utbkdah - 0.7 0.3 2.2 310 0.5 16b
n kt- - 1.9 0.4 2.5 210 0.1 m
411 Sbta 3.17 1.17 2.93 IS 0.6 3l
hmm u # MI, ~ l l t l n , 1~9-70 to l9m-m.

fourteen of the states. The lowest expenditure is shown by.
Sikkim Rs.89 lakhs in 1980-81 and Rs.73 lakhs in 1888-89.
The percentage share of this expenditus in the State
Domestic Product of all the states is very low, below 1 per
cent in 1988-89.
Table 3.10 presents the growth of expenditure on
health per head of Indian states during 1980-81 and 1988-89
both at current and constant prices. Per capita expenditure
on health of Bihar, Gujarat, Ilimachal Pradesh, Jammu and
Kashmir, Kerala, Manlpur, Meghalaya, Nagaland, RajaSthan,
Sikkim and Tripura was higher than the all states per capita
of Rs.1.17 in 1980-81, and Assam, Himachal Pradesh, Jammu
and Kashmir, Karnataka, Kerala, Maharashtra, Manipur,
Meghalaya, ~a~aiand, Punjab, Sikkim, Tamil Nadu, Tripura
showed a higher expenditure than the all states average per
capita expenditure of Rs. 0.60 in 1988-89 at constant
prices. Assam, Haryana, Karnataka, Kerala, Madhya Pradesh,
Maharashtra, Punjab, Tamil Nadu, Tripura, Uttar Pradesh and
West Bengal showed per capita expenditure on health higher
than the all states average index of 51 in 1988-89.
3.7 NON-DEVELD- CAPITAL EXPEXDITURE
The rise in non-development services is mainly due
to population growth and the emergence of planning, which

78
TABLE 3.11: NiiI-DEVELOFiENT UPITPL E?PEWDITLRE OF INDINI nATE6 MI18 1969-70, 1980-81 awe l9ea-BP
I R u p r r i n Laths)
Ymar 81. Stater Yo. 1969-70 1980-81 1988-W
1 Lndhra Pradesh 436 10.17111 279 (0.03):: 1,564 iO.09)II ( 9.511 1 1.1): ( 3.318
2 A r r u (B i0.07111 122 i0.04111 869 10.1111 1 4.0)I ( 1.611 i 3.2):
3 Bihar 209 (0.07)I I 94 i0.03111 1,237 (0.07):: 1 4.211 1 0.411 I 1.911
4 6ularat -382 -(0.16)11 556 (0.08111 311 (0.01111 (13.011 ( 2.7): ( 0.71t
5 Haryana -213 -~O.Zb I I I 229 (0.07)I I 402 (0.05111 (42.011 1 2.211 1 3.011
6 Hiaachal Pradrsh - 203 (0.3):: 176 10.3)II ( 3.911 1 4.311
7 Jammu 4 Kashnir 1,083 14.3):: 365 10.41111 531 10.3)11 (36.911 1 2.9): ( 1.5):
8 Karmataka -374 - 10.2111 897 (0.16)I I 1,303 (0.1)I I ( 6.511 ( 5.211 ( 3.711
9 Kerala -181 -iO.13111 371 (O. l I I1 495 10.1111 (11.81t ( 3.011 2.411
10 llrdhya Pradrch -13 -i0.00111 118 (0.01)I I 6,107 (0.4114 1 0.511 1 0.511 ( 8.911
I f Iaharashtra 2023 10.12111 809 (0.05111 2,186 10.1111 (23.0): ( 2.411 i 2.511
12 Ian ipur 100 10.5)II 569 12.9111 I S.111 L 6.O)I
13 k g h a l y r 74 i0.5111 553 (1.4111 ( 3.511 1 8.011
I 4 Nagaland 23 (1.0181 q3 (0.88111 389 (1.1)I: 1 4.5)) i 3.611 ( 5.111
I S Orisra 32 IO.OZlI1 294 iO.09)I l 1,231 10.2)11 I i Q 5 I 1 ( 1.611 I 2.511
16 Punjab - 6 ( 0 . 0 ) I I 246 (0.01111 715 (0.1)11 I-1.0): ( 3.211 ( 2.711
17 RaJarthrn -136 -(0.07)11 337 (0.01)I I 657 10.1)11 (-4.01 ( 1.911 1 1.711
18 S i k t i r b9 (2.67)II 206 11.7)II ( 5.711 I 4.511
I 9 Tamil Yadu -999 IO.4111 318 (0.04)I I 1,552 iO . l I I1 (-71.61) 1 3.7): i 7.811
20 Tr ipura 61 10.24)11 218 10.4)It ( 2.311 ( 2.6):
21 U t t a r Pradrrh -852 (0.18l I I 1,054 10.07)tI 1,748 (0.03181 (-20.91) 1 2.211 1 2.711
22 Yust Bmqa l 382 (0.11l11 461 10.04)II 1,522 10.071tI 114.3)I 1 4.311 ( 5.6):
I)11 States 1,100 7,lSZ 24,843
Sourer: b s r r r r L n k o f Ind ia B u l l r t i n , 1969-70-I988-BP lot8 11: Shall tk p r c r n t a g r a t n m - d 8 v 8 l o p m t capital e x p m d i t u r r i n 6 t r t r
k w s t l c rrduct. I M tk w r c m t a g r of n o n - d 8 v ~ l o p r n t c a p i t a l r r p n d i t u r s i n Total
Cap i ta l E:#ndIturr.
79
IYL 3.121 m F mwmman WIIN UPBOITUE RR EW ff tmtw S T A ~ ILRUG Iwm, ~ s s ~ YO I- Iln Rpnl
: 1 9 ~ m I IsBS%L IW-8 51. Bbtn b. Ihr wlb I At D r m t P r h I Ilt Lnslnt Prlcn : Lt Ovmt Rim : A t Lnstat Prim
I lln kl I I Plr cqih Ir&r all R cqlb Indm of I hr upib lndn of I R cqdb lndtr of I l i n kl Bmth I [in FsI h t h I lin Rrl Bmth I lin lbl %aN,

lead to the rise of non-developmental expenditure such as
general administration, police, ~ustice, jails and convict
settlements. The non-developmental expendichre is grouped
under 1) administrative services, ii) cost of collection of
taxes, iii) debt servicing, iv) famine relief, and
v) others.
The non-developmental outlay on capital account
and its percentage share in the State Domestic Product and
in the total capital expenditure is represented in Table
3.11. The aggregate non-developmental outlay of all the
Indian States has increased 23 times, i.e., from Rs.1,100
lakhs in 1969-70 to Rs.24,843 lakhs in 1988-89. Maharashtra
incurred the highest expenditure of Rs.2,023 lakhs in 1969-
70, Uttar pradesh Rs.1,054 in 1980-81, and Madhya Pradesh
Rs. 6,107 in 1988-89. The lowest expenditure incurred by
Tamil Nadu was Rs.999 lakhs in 1969-70, Tripura Rs.61 lakhs
in 1980-81, and Sikkim Rs.206 lakhs In 1988-89. The
percentage share of this expenditure in the State Domestic
Product of all states is very low, below 2.9 per cent in
1988-89.
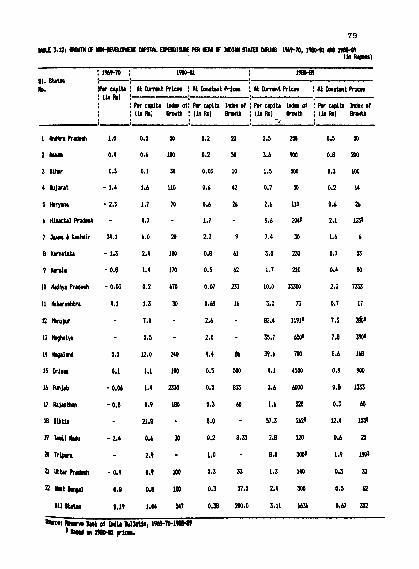
Table 3.12 shows the growth of non-developmental
capital expenditure per head of Indian states during
1969-70, 1980-81 and 1988-89 at current and constant prices.
Andhra Pradesh, Jammu and Kashmir, Maharashtra and Nagaland

showed higher per capita non-development cnpital expenditure
than the all states average of Rs. 0.19 at constant prices, -
and Karnataka, Gujarat, Haryana, Kerala, fiadhya Pradesh,
Punjab, Rajasthan, Tamil Nadu and Uttar Pradesh showed a
negative expenditure in 1969-70. In 1980-81, Gujarat,
Haryana, Himachal Pradesh, Jammu and Kashmir, Karnataka,
Kerala, Maharashtra, Manipur, Meghalaya, Nagaland, Orissa,
Punjab, Rajasthan, Sikkim and Tripura showed higher per
capita non-development expenditure than the all states
average of Rs. 0.38 at constant prices. In 1988-89, Assam,
Himachal Pradesh, Jammu and Kashmir, Karnataka, Kerala,
Maharashtra, Manipur, Meghalaya, Nagaland, Orissa, Punjab,
Rajasthan, Sikkim and Tripura showed a higher than all
States per capita expenditure of Rs. 0.67 at constant
prices. Further, Madhya Pradesh, Meghalaya, Orissa and
Punjab showed a higher index of growth than the all States
average index of 352 in 1988-89 at constant prices. The
index of growth increased from 547 per cent in 1980-81 to
1,636 per cent in 1988-89 at current prices, while it went
up from 200 per cent in 1980-81 to 352 per cent in 1988-89
in constant terms.
3.8 REVF,NUE EXPENDITURE
Revenue expenditure has a dominant role in the
Structure of expenditure of the state governments due to the

Year 61. states ------------------------------------------------------- Yo. 1969-70 1980-81 1988-09
I Andhra Praderh
2 Assre
3 Uihar
4 Eu ja r r t
5 Haryma
6 Himachrl Pradesh
7 Jranu t K r s M i r
8 Karnatrkr
9 Kerala
10 I l~dhya Prrdesh
11 Rrhrrarhtra
12 Manipur
13 llcphrlya
14 Nrprland
I 5 Orlsra
16 Punjab
17 Rajasthan
18 Sikkim
19 Tamil Yadu
20 Tr ipu r r
21 U t ta r Pradesh
22 Hest Urnpa1
A l l 8tat.s 3,10,18 14,80,781 40,%,003
b u r c e l Reserve Bmk of Ind la Bu l le t in , 19b9-70 to 1980-09 Rate I 8 Bko* tk percentaqe of Revenue Expenditure I n Str tm
*tlC Prodwt.

I l w m I 1w-U ; _ _ I
1W-W 8. 0 tata Ib. :hr c@tr I M Prmt Rim l At Cmht R u n l kt Dvnnt P r i m I M h t m t R i c n
I l in Rrl : : Rr capita lnda of: hr capita lndsr of I hr o p i b Indrx of : Rr raplta b x of I l in lbl PlDlth I l ln lbl hth : ( in fml 6 m M : I ln fml 6mL
8-0 I -.

increase in programmes of social and economic development.
Revenue expenditure comprises development expenditure which
further consists of expenditure on heal*, education,
agriculture, and industry. Non-development expenditure
which comprises administrative services is also included
under revenue expenditure. This item of expenditure has
been represented by Table 3.13. The aggregate expenditure
of all the states was Rs. 3,10,138 lakhs in 1969-70, which
increased to Rs. 14,80,780 lakhs in 1980-81, and further to
Rs. 48,56,003 in 1988-89. During 1969-70 and 1988-89, the
increment of this expenditure was 17 times. The highest
revenue expenditure was incurred by Maharashtra in all the
three periods Rs. 37,548 lakhs, Rs. 1,91,704 lakhs and Us.
6,23,977 lakhs respectively. During the same year the
lowest revenue expenditure was incurred by Nagaland (Rs.
2,002 lakhs), Sikkim (Rs. 2,982 lakhs), and again by the
same state (Rs. 10,348 lakhs). The percentage of revenue
expenditure to the State Domestic Product expenditure is
also higher than all other items of expenditure. Among the
special category states, the highest per cent of 83.4 is
shown by Nagaland, 113.0 by Sikkim and 90 again by Nagaland
in all the three periods respectively. The percentage share
in other states ranged from 11.4 (Uttar Pradesh) to 26
(Andhra Pradesh) in 1988-89.

Table 3.14 shows the growth of per capita revenue
expenditure of Indian states during 1969-70, 1980-81 and
1988-89 at constant and current prices. Andhra Pradesh,
Assam, Gujarat, Haryana, Jammu and Kashmir, Karnataka,
Kerala, Maharashtra, Nagaland, Punjab, Rajasthan, Tamil Nadu
and West Bengal showed a higher per capita revenue
expenditure than the all states per capita revenue
expenditure of Rs. 56.59 in 1969-70; Andhra Pradesh,
Gujarat, Haryana, Himachal Pradesh, Jammu and Kashmir,
Karnataka, Kerala, Maharashtra, Manipur, Meghalaya,
Nagaland, Punjab, Sikkim, Tamil Nadu and Tripura showed a
higher per capita revenue expenditure than the all states
average of Rs.80 in 1980-81; Andhra Pradesh, Gujarat,
Haryana, Himachal Pradesh, Jammu and Kashmir, Karnataka,
Kerala, Maharashtra, Manipur, Meghalaya, Nagaland, Punjab,
Sikkim and Tripura showed a higher per capita revenue
expenditure than ~s.145.20 in 1988-89. At current prices
the index of growth went up from 381 per cent in 1980-81 to
1,180 in 1988-89, while it went up from 141 per cent to 256
Per cent during the same period at constant prices.
3.9 REVENUE DEVELOPMENT EXPENDITURE
Revenue Development Expenditure comprises
expenditure on Social Services such as Education, Public
Health and other services and economic services like

86 InSLE S3.51 MVELDPllEWT REVENUE EIPENDITUN ff INDIAN SThlES DURIW 1969-70, 1900-81 WD
I9W-crr (Rupees I n L r k h r l
Verr 61. B t r t e s ................................................................ No. l9b9-70 1980-81 1988-89
5 Haryma 3,486 ( 4.0111 30,227 (IO.0111 95,788 111.2111 152.111 175.411 171.011
6 H i e r c h r l Prrdesh - 14,449 (21.8111 42,44b (26.0111
9 Ke ra l r 10,081 1 8.0111 50,454 4 S I l 1,25,723 ( I b . 5 I I I (68.711 175.511 lb4.711
10 Hadhyr Prrdesh 11,253 1 5.7111 75,334 (12.2111 2,24,542 (14 .5 I I l 1bO.BII 175.114 1bb.811
11 t laharrshtra 18,160 1 4.7111 1,27,787 19.11111 3,01,791 ~ l ~ . O l I I 148.311 l bb .6 l I Lbl.211
12 Hanipur 5,151 12b.2111 15,897 122.2111 173.011 168.511
21 U t t r r P r r d s l h 17,158 1 4.0111 1,19,882 18.5111 3,48,177 1 6.9111 (51.811 (69.811 (60.711
22 k s t k n o r l 4 4 1 4 b 78.355 1 8.7111 2,22,95b 110.4111
BOUrcel R e n r w Bank at I n d l r B u l l e t i n , 1969-70 t o 1960-89 Not@ I I1 8 h a the percentage of develop.ent revenue Expendi ture i n S ta te
' B o w t i c Product. I Ohmu t h e pa remtape of dsvs lopnent revenue Expendi ture i n To ta l
Rmvnw E a m d i t u r e

87 rm 3.161 emw s wc wra marpl~ raw mrm F m l m nnm URIK iw-m, i w am im-m
(in Wl
I wm-m I IW I-4
I W 81. 6btU #I. IRr capita I At hrrmt Ricn : 4t h t m t Mu I At k n n t Ricn I At h t n t R k n
I Iin Ibl I I Pu clplta lndn of! Rr clpita ln&x of I Rr uplta It&x of I Pu capita l&r d I (M ibl BmL I (in lhl h t h I [in Rl -. h t h I (in Rrl h t h
4-1

Agriculture and Industries. Table 3.15 illustrates the
trend in the revenue development expenditure of all the
Indian states and its percentage share in th? State Domestic
Product and in the total revenue expenditure. The aggregate
revenue development expenditure of all the states increased
from Rs. 1,62,970 lakhs in 1969-70 to Rs. 10,51,470 lakhs in
1980-81 and further to Rs.32,20,955 lakhs in 1988-89.
Maharashtra incurred the largest revenue development
expenditure of Rs. 18,160 lakhs, Rs. 1,27,787 lakhs and Rs.
3,81,791 lakhs in 1969-70, 1980-81 and 1988-89 respectively.
During the same period, the lowest revenue development
expenditure was incurred by Nagaland (Hs. 1,061 lakhs),
Sikkim (Rs. 2,477 lakhs), and again Sikkim (Rs. 8,321
lakhs). The percentage share of this item of expenditure in
the State Domestic Product is higher in the case of special
category states, which ranged from 60.9 per cent (Sikkim) to
22.2 per cent (Manipur) in 1988-89. Among the other states,
this percentage share in the SDP ranged from 6.9 per cent
(Uttar Pradesh) and 19.1 per cent (Andhra Pradesh) in
1988-89.
Table 3.16 depicts the growth of per capita
revenue development expenditure of Indian states during
1969-70, 1980-81, 1988-89, both at current and constant
prices. In real terms, Assam, Gujarat, Haryana, Jammu and
Kashmir, Karnataka, Kerala, Maharashtra, Punjab, Rajasthan,
Tamil Nadu and West Bengal showed a higher per capita
development revenue expenditure than the all states per
capita expenditure of Rs. 29.73 in 1969-70;-Andhra Pradesh,
Gujarat, Haryana, Himachal Pradesh, Jammu and Kashmir,
Karnataka, Kerala, Maharashtra, Manipur, Meghalaya,
Nagaland, Punjab, Sikkim, Tamil Nadu, and Tripura showed a
higher per capita revenue development expenditure than the
all states per capita expenditure of Rs. 56.84 in 1980-81;
and Andhra Pradesh, Gujarat, Ilaryana, llimachal Pradesh,
Jammu and Kashmir, Karnataka, Maharashtra, Manipur,
Meghalaya, Nagaland, Punjab, Sikkim and Tripura showed a
higher per capita development revenue expenditure than the
all states average of Rs. 100.77 in 1988-89 at constant
prices. Further, the index of growth of per capita revenue
development expenditure ranged from 516 per cent to 1,559
per cent at current prices, whiie it went up from 191 per
cent to 338 per cent during the same period at constant
prices.
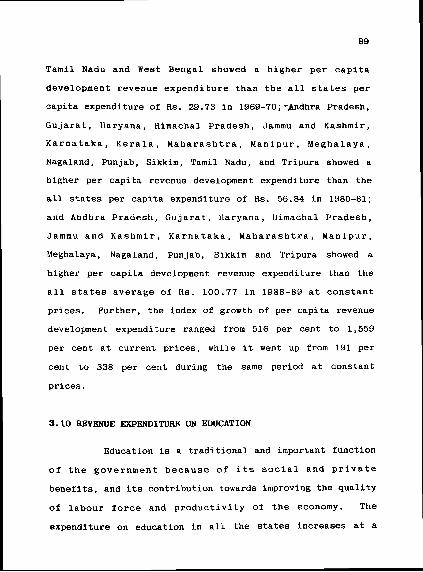
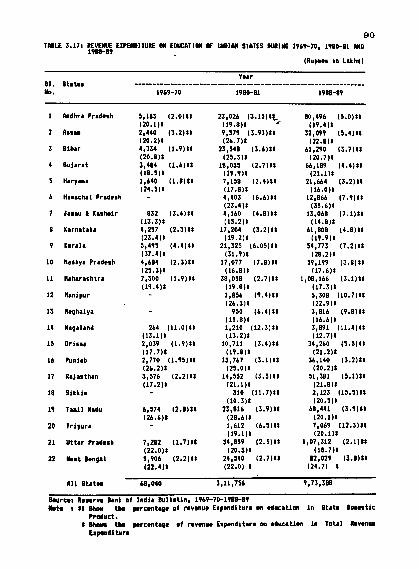
3.10 REVENUE EXPENDITURE ON EDUCATION
Education is a traditional and important function
of the government because of its social and private
benefits, and its contribution towards improving the quality
of labour force and productivity of the economy. The
expenditure on education in all the states increases at a
so TABLE 5.171 REVENUE EIPEYDllUlE CU EDUCATlOll DF IMDlM STAVES WRIYG 1969-70, 1980-81 Y(D
I9W-09
Year 81. States ................................................................ Yo. 1969-70 1980-81 1988-89
I Andhra Pradrsh 5,163 12.0111 23,026 13.1511L 80,496 0.0111 120.111 139.811 ' 111.411
.- -. 8 Karnataka 4,217 12.3111 17,204 13.2)II 61,808 (4.8111
123.411 119.211 119.911 9 Karalr 5,495 14.4111 21,325 (6.05111 54,773 17.2111
137.411 131.911 128.211 10 tlrdhyr Pradrsh 4,684 (2.3111 17,077 (7.8111 59,199 13.8111
(25.311 116.811 117.611 I 1 tlaharashtra 7,300 Il.9111 38,058 12.7111 1,08,166 (5.1111
(19.411 119.811 117.311 12 l l rn ipur 1,856 (9.4111 5,308 110.7111
126.311 122.911 Ilrphalya
Nagaland
Orissa
Punjab
Rajasthan
Sikki.
l a a i l l adu
Tr ipura
21 Ut ta r Pradesh 7,282 (1.7111 34,859' (2.5111 1,07,512 (2.1111 (22.011 (20.311 118.711
22 Yest Bengal 3,906 12.2111 24,540 12.7111 82,029 13.8111 122.411 122.01 I 124.71 I
A l l 8tat-s 68,040 3,11,756 9,73,388
Bourcnl Rmsarva Bank of Ind ia Bu l la t in , 1969-70-19BB-89 kt. I I: 8ha the percentage of ravmue Eapmdi t r ra m education i n Stat* Dommstlc
C r d r c t . I Bhon the percentage of revenue Expenditure m mducatlon I n Total hvenum
E x p m d l t u n

la 3 . ~ 1 mum F ~EWLE MDOINE m ~ C R I I U m HW w lmwn slam lsaem, 1w-u m I- lln bras1
1 1 w m 1 l9ab-W ;-,
1m-W 8. Gbtn Ir. IRr upib : M k m t Ricn I M Cumtmt Pricn : M k t Rim I M Emrtmt Ricn
I lln lbl I I Rr upib I*: 011 Rr CWitl Indtx Of I Rr twit1 I*, Of I Plr uplb Indt" of 1 lln lbl I lln h) 6rmith I lln bl -,, h t h 1 Iln hl h t h
I-3

rapid rate because of the following factors: i) faster rate
of growth of population, ii) income elasticity demand for - education, iii) education as an important'instrument of
achieving political, social, and occupational status and
modernisation. Hence, the expenditure of state governments
on primary and higher education has led to the vast increase
in this item of expenditure. The phenomenal growth of
expenditure on education and its percentage share in the
State Domestic Product and in the total revenue expenditure
are clearly shown in Tables 3.17 and 3.18. In Table 3.17,
the aggregate expenditure of all the states has moved from
Rs. 68,040 lakhs in 1969-70 to Rs. 3,11,756 lakhs in 1980-
81 and lts.9,73,388 laktls in 19118-89, an increase 01 nearly
18 times. The largest expenditure on education was
incurred by Maharashtra - Rs. 7,300 lakhs, Rs. 38,058 lakhs, and Rs. 1,08,166 lakhs during 1969-70, 1980-81 and 1988-89
respectively. The lowest expenditure was seen in Nagaland
Rs. 264 lakhs, Sikkim Rs. 310 lakhs and again Sikkim RS.
2,123 lakhs in 1969-70, 1980-81 and 1988-89 respectively.
The percentage share of revenue expenditure on education in
the State Domestic Product is the highest among the special
category states, in Sikkim (15.5 per cent) and the lowest in
Jammu & Kashmir (7.1 per cent). Among the other states, the
highest share is shown by Kerala (7.2 per cent) and the
lowest by Uttar Pradesh (2.1 per cent) in 1988-89.

Table 3.18 presents the growth of expenditure on
education per head of Indian states during 1969-70, 1980-81
and 1988-89 both in nominal and real terms. '~ssam, Gujarat,
Haryana, Jammu and Kashmir, Karnataka, Kerala, Maharashtra,
Nagaland, Punjab, Rajasthan, Tamil Nadu and West Bengal
showed a higher expenditure on education per head than the
all states per capita of 11s. 12.41 in 1969-70; Assam,
Gujarat, Haryana, Himachal Pradesh, Jammu and Kashmir,
Madhya Pradesh, Karnataka, Kerala, Maharashtra, Manipur,
Meghalaya, Nagaland, Punjab and Sikkim showed a higher
revenue expenditure per head than the all-states per capita
of Rs. 16.85 in 1980-81; and Gujarat, Haryana, Himachal
Pradesh, Jammu and Kashmir, Karnntaka, Manipur, Meghalaya,
Kerala, Maharashtra, Nagaland, Punjab, Sikkim, and Tripura
showed a higher revenue expenditure per head than the all-
states per capita of Rs. 30.27 in 1988-89 at constant
prices. The index of growth ranged from 366 to 1,122 per
cent, while it went up from 135 to 242 per cent at constant
prices during 1980-81 and 1988-89.
3.11 REVENUE EXPENDITURE ON PUBLIC HEALTH
In a Welfare State, it is the prime duty of the
government to provide adequate health facilities which are
preventive and curative in nature. Among the social
services, health stands second to education. In India,

Year 81, 8t1t.S no. 1969-70 1980-81 1988-89
Andhrr Prrderh
A5r.a
B ih r r
Gujarr t
Hrryrnr
Miwachai Pradrsh
Jraau I Karhair
K r rn r t rk r
K r r r l r
l lrdhyr Pradcrh
l l r h r r r r h t r r
l l rn ipur
tlaphrlyr
Naqrlrnd
O r i r r r
Punirb
Rrj1sth.n
Sikki.
Tamil Nrdu
Tr ipu r r
U t t r r Prrderh
Y r r t h n p r l
A l l S t r t r r 27,435 1,39,445 3,26,454
Bwrcn: Rasmrva Bank of Ind ia l u l l a t i n , 1969-70-1988-89 b t a i t t Bhor t b ~ p rc4n taqr of ravanun Expnd i tu rc oa publ ic M r l t h i n
Strtw b w r t i c Product. 1 8 h a tb prcwntaqa of ravmua Eapmditura a publ ic h a l t h i n
ro ta1 hvmw t w d i t u r w

95 MYLE 3.20: 1F IIW(E EIPWlITUE U RalC K4.W FfR it30 ff IIBIM STATES [IRIS 1969-70, 1- n0 1-
tin Wl
1 196WC I 1 W I 198P-W 5. 8tata 1-1
lp. lRr uplta : At P r m t R i c n l Y Cmstat Pricn 1 M Pmmt Rku 1 At h h t Rinr I (In bl :
: Pr capita It-&# dl hr capita lndrx of I Rr capita I*# of : Pr capita I M r $
I lin bl Emth I lln bl Wmth l lin bl Emth l lin bl Emth

where the health conditions are generally poor it is
necessary to have a large expenditure on this item, although
even this large amount is inadequate to meet the health
requirements of the people, which can be understood from
Table 3.19. The table shows that the aggregate revenue
expenditure on Public Health Services increased from Rs.
27,435 lakhs in 1969-70 to Rs. 1,39,445 lakhs in 1980-81 and
further to Rs. 3,26,454 lakhs in 1988-89. Among the 22
states, the highest revenue expenditure on public health was
incurred by Maharashtra (Rs.3,520 lakhs) in 1969-70 and Rs.
16,155 lakhs in 1980-81, but in 1988-89, Uttar Pradesh
incurred the highest (Rs.39,970 lakhs). Nagaland incurred
the lowest (Rs.181 lakhs) in 1969-70, Rs.154 lakhs (Sikkim)
in 1980-81 and again Sikkim Rs.562 lakhs in 1988-89. In
1988-89, the percentage share of revenue expenditure on
public health in the State Domestic Product is very low in
all the states, ranging from 5.7 per cent (Nagaland) to 2.5
per cent (Himachal Pradesh) among the special category
states and 2.2 per cent (Kerala) to 0.8 per cent (Uttar
Pradesh) in other than special category States.
Table 3.20 presents the growth of Revenue
Expenditure on Public Health per head of Indian States
during 1969-70, 1980-81 and 1988-89 at current and constant
prices. In real terms, Andhra Pradesh, Assam, Gujarat,
Haryana, Jammu and Kashmir, Kerala, Maharashtra, Nagaland,
Punjab, Rajasthan, Tamil Nadu and West Bengal showed a
higher per capita expenditure on public health than the all-
states per capita of Rs.5 in 1969-70; Andhra Pradesh,
Gujarat, Haryana, Himachal Pradesh, Jammu and Kashmir,
Kerala, Madhya Pradesh, Maharashtra, Manipur, Meghalaya,
Nagaland, Orissa, Punjab, Rajasthan, Sikkim, Tamil Nadu and
West Bengal also showed a higher per capita expenditure on
public health than the all-states per capita of Rs.7.50 in
1980-81; and GUjarat, Haryana, Himachal Pradesh, Jammu and
Kashmir, Karnataka, Kerala, Maharashtra, Manipur, Meghalaya,
Nagaland, Punjab, Rajasthan, Sikkim, Tamil Nadu, and Tripura
showed a higher expenditure than the all-states per capita
of Rs. 9.40 in 1988-89. At current prices, the index of
growth of this expenditure ranged from 405 per cent to 866
per cent, while it ranged from 150 per cent to 188 per cent
at constant prices during 1980-81 to 1988-89.
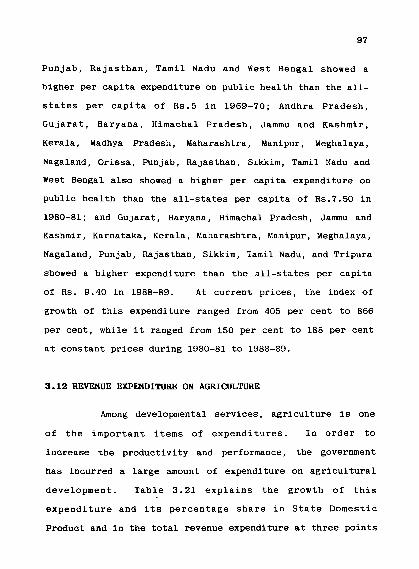
3.12 REVENUE EXPENDITURE ON AGRICULTURE
Among developmental services, agriculture is one
of the important items of expenditures. In order to
increase the productivity and performance, the government
has incurred a large amount of expenditure on agricultural
development. Table 3.21 explains the growth of this
expenditure and its percentage share in State Domestic
Product and in the total revenue expenditure at three points

Yaar 61. Stattm .............................................................. Yo. 1969-70 1980-81 1988-89
16 Punlrb
17 Rrjarthrn
18 Sikki.
MI Statas 13,861 2,36,866 4,23,270
Bourcrt Rssarve Bank of India Bullet in, 1969-70 to 1988-89. lot. I 11 Show tk pwcmtaga * b r a of rnvmue exp.nditurr on aqrlcultura i n
s ta t# D w n t i c Product. 8 Ohon tk prcantage s b r a of ravanue axpendihra n lur icu l tura i n
Total &VM Lxpmdlturr.

: 19-70 1 1 w 1W-m 8. B b t n I__# b. Ihr c w i b : Rt k t R i c n I At h t n t P r i c n : Y O w m t Rlcn I At b s t n t Rirn
I lln bl I I Rr capita 1nd.x of: hr capita 1nd.x of : Rr caplta I r k of : hr c w i t a 1nd.r of l [ i n bl %or& I ( i n bl Errnth : ( i n kl b d h : ( i n bl h t h
11 hhua&trhtn
U llnipx
1s kq ta lya
I4 kqa1Ud
I5 Orilia
i h blab
17 b a n t t m
I8 Sikki l
19 T r i l W
m I r i p u a
21 Uttrr R u h h
P k t anprl
R11 btn

of time, viz., 1969-70, 1980-81 and 1988-89. The aggregate
expenditure of all the states has increased from Rs. 13,864
lakhs in 1969-70, to Rs. 2,36,866 lakhs in ,.1980-81 and Rs.
4,23,270 lakhs in 1988-89, nearly, an increase of 30 times.
The highest expenditure was incurred by Maharashtra Rs.
2,354 lakhs in 1969-70, Rs. 32,223 lakhs in 1980-81 and Rs.
76,203 lakhs in 1988-89. The lowest expenditure was
incurred by Nagaland (Rs. 11 lakhs), Sikkim (877 lakhs), and
(Rs. 178 lakhs) in 1969-70. Among the special category
states, the percentage share in the SDP ranged from 5
(Sikkim) to 13 (Jammu and Kashmir) in 1988-89. Among the
other states it ranged from 2.9 per cent (Madhya Pradesh) to
0.6 per cent (Uttar Pradesh) in 1988-89.
Table 3.22 presents the growth of expenditure on
Agriculture per head of Indian States during 1969-70, 1980-
81 and 1988-89 both at current and constant prices. At
constant prices, Assam, Haryana, Jammu and Kashmir,
Maharashtra, Nagaland, Orissa, Punjab, Tamil Nadu and West
Bengal incurred expenditure above the all-states per capita
of Rs. 2.53 in 1969-70; Gujarat, Haryana, Himachal Pradesh,
Jammu and Kashmir, Karnataka, Kerala, Madhya Pradesh,
Maharashtra, Manipur, Meghalaya, Nagaland, Orissa, Sikkim
and Tripura incurred a higher expenditure than the all-
states per capita expenditure of Rs.12.80 in 1980-81; and
Assam, Gujarat, Haryana, Himachal Pradesh, Jammu and

T I L E 3.23, REVENUE EXPEIDlTlRE 01 INDUSTRIES P lNDlW STRTES WR116 19hP-70, IM RYD 1N8-89
(Rupees i n L-I m
Smlr SI. S ta tes -...-.----.---------------....----.--..--------.---~-~-~-~-- No. I969 70 1980-81 1988-89
I bndhrr Pr rd rsh I 9 3 10.0611l 1,203 10.2011l _ 7,494 lO.5Ol l l 10.7811 11.0011 l I . 8 O l t
2 Assre 113 10.2011l 701 10.30111 1,288 10.70111 11.1011 l l . 9 O l l (3.0511
3 B i h r r 250 10.09111 1.646 10.201Il 8.145 10.30111 VAQ 1 S u j r r i t 179 10.08111 1,985 10.301l l ;1223' 1b.30111
11.0011 12.1011 ( I . h b l l 5 Hr ryanr 85 IO.OPll1 576 10.2011l 1,259 10.201l l
11.2011 11.4011 10.931t h H i s r c h r l Prrdesh 439 10.70111 2,654 11.6OIl8
15 O r i s s r ' 9 0 10.08)11 621 10.2011l 4,083 10.60111 10.8011 11.10l l 12.5311
Lh Punjab 237 10,15111 I 9 5 1O. lO i I t 1,573 10.10111 12.2011 10.9011 10.8811
I 7 R r j a s t h r n 40 ( 0 . O i ) I l 1,741 10.40111 3,295 10.30111 (0.2011 12.5011 11.4011
19 S i k k i e 101 (3 .801I l 173 11.30111 13.3011 11.6711
I 9 T r a i l Nrdu 380 (0.15111 2,060 (O.3OlI l b,213 10.301l l 11.30Il l l . l O l 1 (1.8011
20 T r i p u r a 212 10.80111 8,263 11.40111 12.0011 123.518
21 U t t r r Prrdesh 297 10.0611l 2,135 10.20111 7,289 10.10111 10 .VO~l (1.0018 11.2711
22 Y l s t k n q r l 452 10.13111 15,072 10.30111 4,8M 10.20111 11.7018 113.5011 11.401
AIL S t a t e r 3,224 37,284 89,826
Source8 Reserve Bank o f I n d i a Bulletin, 19h9-70 t o 19BB-89 Ibb I 81 Bhar U* percentage share of rav*nue expend i tu re an' i n d u s t r i e s i n
8 t r t a b u s t i c Product. I 8 h a th percent rqe share o f revenue * x p m d l t u r e on i n d u s t r i e s i n
lot11 L w w f r p m d i t u r e .

102
TW 3.241 arm o RWLF mec~m a m l e m KW (F IY)IMI DPKS w i t s 1969-10, i~ RO 1wa-m lin hlpn)
1 19610 1 1 W {-8
1wa-m 8. S t r k Y1. IRr cwltr I Pt DITrnt R l c n I Rt Cmstmt Pricn I Pit b rmt R k n : Rt Cm~lnt R i r n
I Iln bl I I Rr capih 1-x dl Rr capitr Ir&r of : Rr w i t r Ird~x d I Rr capltr lndn of I lln bl h d / (in bl hl : (in bl kmih I lin bl kmih
6-3

Kashmir, Madhya Pradesh, Maharashtra, Manipur, Meghalaya,
Nagaland, Punjab, Sikkim and Tripura incurred a higher
expenditure than the all-states per capitkexpenditure of
Rs.12 in 1988-89. In real terms, the index of growth,
ranged from 1,366 per cent to 2,192 per cent at current
prices while it declined from 505 per cent to 474 per cent
at constant prices during 1980-81 and 1988-89.
3.13 REVENUE EXPENDITURE ON INDUSTRIES
The government realised the significance of
industrialisation in the promotion of economic development.
Therefore, a programme of industrialisation was launched as
a deliberate policy of the government, which led to the
increase in the 'revenue expenditure on industries in all the
states. This process of industrialisation and the growth of
expenditure are explained by Tables 3.23 and 3.24.
Table 3.23 gives an account of the growth of this
aggregate expenditure of all the states from Rs.3,224 lakhs
to Rs.37,284 lakhs and Rs.89,826 lakhs in 1969-70, 1980-81
and 1988-89 respectively, an increase of nearly thirty
times. The lowest expenditure was incurred by Nagaland Rs.16
lakhs in 1969-70, and by Sikkim Rs.101 lakhs and Rs.173
lakhs in 1980-81 and 1988-89 respectively. In absolute
terms, West Bengal ranked first in revenue expenditure on

industries with (Rs.452 lakhs) in 1969-70, Karnataka,
(Rs.3,981 lakhs) in 1980-81, and Madhya Pradesh Hs. 9,359
lakhs in 1988-89. The percentage share in the State -
Domestic Product was very low, ranging Prom 0.2 (West
Bengal) to 3.1 (Nagaland) in 1988-89.
Table 3.24 shows the growth of revenue expenditure
on industries per head of Indian states during 1969-70,
1980-81 and 1988-89 both at current and constant prices. In
real terms, Assam, Gujarat, Haryana, Jammu and Kashmir,
Karnataka, Kerala, Nagaland, Punjab, Tamil Nadu and West
Bengal incurred a higher expenditure on industries than the
all-States per capita of Rs. 0.58 in 1969-70; Assam,
Gujarat, Himachal Pradesh, Jammu and Kashmir, Karnataka,
Madhya Pradesh,, Manipur, Meghalaya, Nagaland, Rajasthan,
Sikkim, Tamil Nadu and Tripura incurred a higher expenditure
than the all-states per capita cf Rs. 1.28 in 1980-81; and
Andhra Pradesh, Assam, Bihar, Gujarat, Haryana, Himachal
Pradesh, Jammu and Kashmir, Karnataka, Madhya Pradesh,
Maharashtra, Manipur, Meghalaya, Nagaland, Orissa, Sikkim
and Tripura incurred a higher expenditure than the all-
states per capita of Rs. 2.53 in 1988-89. At current
prices, the all-states index of growth increased from 596
per cent to 2,000 per cent, while it went up from 220 per
cent to 436 at constant prices during 1980-81 and 1988-89
respectively.

3.14 NON-DEVFLOWWT REVENUE EXPENDITURE
Non-development revenue expenditure comprises
expenditure on administrative services, maintenance of law
and order, interest payments and repayment of debt. There
was marked rise in the non-development expenditure due to
the increasing welfare and developmental activities of the
states, upward revision of pay scales and dearness
allowances and increasing law and order problems in the
states. Table 3.25 illustrates the trend in non-
developmental revenue expenditure and its percentage share
in the State Domestic Product and the total revenue
expenditure. The aggregate expenditure of all the states
increased from Rs.1,56,888 lakhs to Rs.4,08,814 lakhs and
Rs. 15,78,241 lakhs in 1969-70, 1980-81 and 1988-89
respectively (an increase of nearly 11 times). The highest
non-developmental expenditure was incurred by Maharashtra
Rs. 19,138 lakhs in 1969-70, Rs. 63,096 lakhs in 1980-81 and
Rs. 2,37,181 lakhs in 1988-89. The lowest expenditure was
incurred by Nagaland Rs.941 lakhs in 1969-70 and by Sikkim
Rs.505 lakhs in 1980-81 and Rs.2,027 lakhs in 1988-89. The
percentage share in the State Domestic Product ranged from
4.4 per cent (Uttar Pradesh) to 31 per cent (Nagaland) in
1988-89.
Table 3.26 presents the growth of non-development
revenue expenditure per head of Indian states during

106 TPPLE 3.25: II(1 -DEEIOPIEYT llEKYT E I W l D l l W IF I N D I Y STATES DURIffi 1949-70, lm-U
RUB 1988-89
Vaar 61. States ................................................................ b. 1969-70 1980-81 1988-89
1 Pndhra Prrdesh 12,597 (5.0111 27,993 13.9111 10,141 (6.2111 151.111 124.111 1 2.511
A11 6tat.s 1,U,808 4,08,814 15,78,241
BAlrce: Reserve Bank of India Bullet in, 1969-70 to 1988-89. lbtm I 11 5hoa tk p w c a t r q e share of n m developent e rpndl ture in State
DDuat ic Product. I 8hor th. yrcantape share of nan developent exp.ndlture i n Total
b v w w f x p m d i t u n .

- I I%?-70 I 1- I f
lW-8 8. 8htn k. IRl upltr : M k m t Rlcn I M Cmstnt R i c s : M Dumt P r h I RL Cmrtat R & a
: Iln k l : I Pu capltr lndlx d : Pw capita Indlx of : Pu capit. Indm of I Rr upiC I*x of : lln kl h t h : (m k l Umth I lln Rr) 6mth I lln Ql h t h
8-0 I-'
18 Sikkim - 139.8 - W.1 - 1 5 . 4 31P IW.8 .

1969-70, 1980-81 and 1988-89 both at current and constant
Prices. At constant prices, Andhra Pradesh, Assam, Gujarat,
llaryana, Jammu and Kashmir, Karnataka, Maharashtra,
Nagaland, Punjab, Rajasthan, Tamil Nadu Pnd West Bengal
showed a higher expenditure than the all-states per capita
Of Rs. 26.85 in 1969-70; Gujarat, Haryana, Himachal Pradesh,
Jammu and Kashmir, Karnataka, Kerala, Maharashtra, Manipur,
Meghalaya, Nagaland, Orissa, Punjab, Sikkim, Tamil Nadu and
Tripura showed a higher expenditure than the all-states per
capita of Rs. 22.10 in 1980-81; and Gujarat, Haryana,
Himachal Pradesh, Jammu and Kashmir, Karnataka, Kerala,
Maharashtra, Manipur, Meghalaya, Nagaland, Punjab, Sikkim
and Tripura showed a higher expenditure than the all-States
per capita of Rs. 42.90 in 1988-89. The index of growth
increased from. 222 per cent to 735 per cent at current
prices, while at constant prices it declined from 821 per
cent to 159 per cent during 1980-81 and 1988-89.
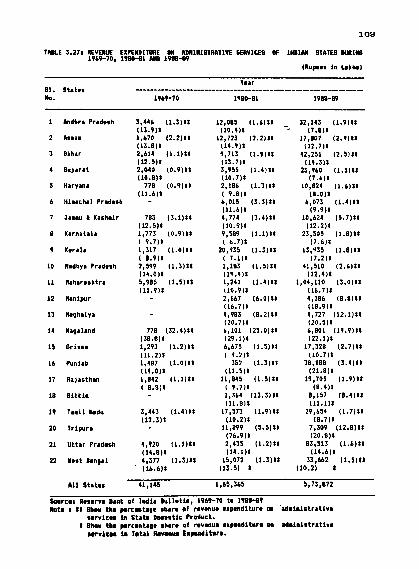
3.15 REVENUE EXPENDITURE ON ADMINISTRATIVE SERVICES
These services include the functions of the State
and different departments of the government. This
expenditure includes expenditure on general administration,
police, administration of Justice, Jail, Audit, External
affairs, etc. The expenditure on this item has increased
owing to the role of the government in maintaining law and
TAslE 3.271 REVUUE EXPEWITUIE O* IIDI(III8TRbTIVE SERVICES OF IYDllU STLTES MRIm 1969-70, 1980-81 AM# 19W-89
(Rupees i n Laths1 --
Year 61. States ............................................................... Yo. 1969-70 1980-81 1988-09
Pndhra Praderh
Asram
Bihar
8ujar.t
- . .-- - . 19 Tamil Nrdu 3,443 1 . 4 1 1 17,573 11.9111 29,654 11.7111
(12.311 (10.211 (8.711 20 Tr ipura 11,819 13.5111 7,301 (12.8111
(76.911 (20.811 21 U t t a r Pradesh 4,920 1 . 1 1 1 2,435 11.2111 83,513 (1.611:
114.814 (14.111 (14.611 22 Yrst Benqal , 3 7 7 1 . 3 1 15,072 (1.3111 33,662 (1.5111
' (16.611 113.51 1 (10.21 1
A l l States 41,143 1,65,365 5,73,872
h r c e : R n s r v e Bank of Ind ia Bu l le t in , 1969-70 t o 1988-89 h i e I I1 Shw the parcmt rqe s lu r * of revenue expenditure m ade in in t ra t i ve
s e r v i c n i n State Bamestir Product. 1 Show tM prcen tape share of revmue erpendi ture m a d e i n i s t r r t i v e
u r v i r . r la lotrl Wvnw Ex@iture.

110 TRSLE 3.28: SRWTH OF PER CbPlTb REVEWE EXPENDITURE 01 ADI(IY1SlRATIVE SERVICES OF I N D I M SIRIES
WRIYG 1969-70, l W - 8 1 AND IPW-89 ( I n R u p e s l
1980-01 1988-80 .................................. .................................... At c u r r e n t A t constant I t c u r r e n t I t constant
81. S ta tes 1969-70 p r i c e s p r i c e s p r i c t r p r i c e s no. ------- ---------------- ---------------- ---------------- ------------------
P l r Per Indea Per Index PC lndmx P t r Index c a p i t a c a p i t a of c a p i t a o f capit#' o f c a p i t a o f
( i n Rs.1 ( i n Rs.1 G r w t h ( i n Rs.1 Growth ( i n Rs.1 Bronth ( i n Rt.1 Browth
1 . A n d h r a P r a d e t h 8.1 22.5 277 8.3 102 52.1 643 11.3 130
2. b s ~ a t 11.8 26.9 228 9.9 84 73.8 625 16.0 135
3. B ihar 4.7 18.1 385 6.7 143 52.3 1112 11.4 242
4. W a r a t 7.8 28.4 364 10.5 135 61.1 783 13.3 170
5. Haryana 7.9 30.4 384 11.3 143 70.4 891 15.3 I 9 3
6. H i#acha l Pradesh - 51.0 - 18.9 - 123.0 - 26.7 - 7 J a t y l K a s h 1 I r 7 50.0 287 18.5 106 149.9 861 32.6 187
8. K a r n i t a k i 6.2 16.1 260 5.9 95 54.1 873 11.8 I 9 0
9. Kera la 6.2 10.7 301 7.5 121 48.4 780 10.5 169
lO.Nadhya Praderh 4 18.3 286 6.8 106 18.5 1070 14.9 232
1 l . l l rhararh t ra 12.1 33.3 275 12.3 102 113.2 1183 51.1 257
12.l(mipur - 83.3 - 30.9 - 238.1 - 56.1 -
13.Neqhrlaya - 92.5 - 34.3 - 305.5 - 66.4 - 14.laqaltnd 158.7 344.5 217 127.6 80 693.2 436 150.7 94
15.Or i t ra 6.0 10.8 313 6.9 110 57.8 965 12.6 210
16.PunJab 11.2 36.3 324 3 4 120 200.6 1791 43.6 389
I7.RaJasthm 7.3 19.4 266 7.2 78 47.9 656 10.4 142
18.8lkkIa - 111.3 - 41.2 - 288.5 - 62.7 - 19.Trm11 Yadu 8.5 23.3 300 9.4 110 54.7 643 11.9 140
2O.Tripura - 6b.4 - 24.6 - 298.3 - 64.8 - 2 1 , U t t a r P r a d r r h 5.7 13.8 277 5.9 104 64.8 1136 14.1 247
Z Z . k r t h n ( l t l 10.1 21.8 216 8.1 80 53.6 530 11.7 115
A11 B t a t e s 7.4 22.8 308 8.4 113 63.7 860 13.8 180
L u r e s : b n r w h k of I n d i a B u l l r t l n , V a r i w r isru@s, lY70-lPs9.

order, and the establishment of new departments and the
revision of pay scales. Table 3.27 shows the trend in this
item of expenditure and its percentage share in the State - Domestic Product and the total revenue expenditure. The
aggregate expenditure increased from Rs. 41,145 lakhs in
1969-70 to Rs. 1,65,365 lakhs In 1980-81 and to Rs.5,73,872
lakhs in 1988-89, an increase of nearly 12 times. The
highest administrative expenditure was shown by Maharashtra
(Rs. 5,985 lakhs) in 1969-70, Kerala (Rs.20,935 lakhs) in
1980-81 and again Maharashtra (Rs. 1,04,110 lakhs) in 1988-
89. The proportion of this expenditure to the State
Domestic Product was also rising in all the states.
Table 3.28 presents the growth of expenditure on
administrative services per head of Indian states during
1969-70, 1980-81 and 1988-89 both at current and constant
prices. At constant prices all the states except Nagaland
were below the all-states average. At constant prices,
Andhra Pradesh, Assam, Gujarat, Haryana, Jammu and Kashmir,
Maharashtra, Nagaland, Punjab, Tamil Nadu and West Bengal
showed a higher expenditure on administrative services than
the all-states average of Hs.7.40 in 1969-70; Assam,
Gujarat, Haryana, Himachal Pradesh, Jammu and Kashmir,
Maharashtra, Manipur, Meghalaya, Nagaland, Punjab, Sikkim,
Tamil Nadu and Tripura showed a higher expenditure than the
all-states average of Rs.8.40 in 1980-81; and Assam,

Haryana, Himachal Pradesh, Jammu and Kashmir, Maharashtra,
Manipur, Nagaland, Meghalaya, Madhya Pradesh, Punjab,
Sikkim, Tripura and Uttar Pradesh showed a higher
expenditure of Rs. 13.80 in 1988-89. The inhex of growth of
administrative expenditure of all the states increased from
308 per cent in 1980-81 to 860 per cent in 1988-89, while at
constant prices it went up from 113 per cent in 1980-81 to
186 per cent in 1988-89.
From the above analysis of the trend and growth of
state expenditure , it can be inferred that expenditure on
various items has shown an abnormal increase in nominal
terms, while the growth in real terms is slower than the
nominal growth. This may be attributed to the rising trend
in prices and growth of population.
The revenue expenditure of the state government
has shown a rapid increase than the capital expenditure,
because of the low capital formation. The socio-economic
expenditure on education, health and other services shows an
irregular pattern due to the change in the activity of the
government, change in the policies of political parties in
power, industrial changes, urbanisation, and finally
economic development.

EWl'ES AND REFWENCES
1. Hicks, U.K., Develo ment Finance Plannin and Control Clarendon Press, 0x:ord university , 196?, 'p.18.-'
2. Wagner Adolf, Three extracts on Public Finance Classics in t h a e , d T ~ ; ~ c k ~ f A ~ u b l i ~ a n ~ s . , - - - - - - - - Musgrave. F;A.--- ----- - Macmillan Co. Ltd.. London, 1958, p. 8.
3. Peacock, A.T. and Wiseman, J . , g:o_wm of Public Expenditure in United Kingdom, Oxford ~niverCi%~-FFe6S; London, 1961, p. 6.
4 . Williamson, G., "Public Expenditure and Revenue - An International Comparison," Manchester School of Economics and Social Studies, 1961, p. 47.
5. The expenditure figure is deflated by wholesale price index.
6. Special categary states conslsts of Ilimachal Pradesh. Jammu and Kashmir, Manipur, Maghalaya, Nagaland, Sikkim and Tripura.