CHAPTER THREE CTC PERFORMANCE REVIEW - CUTR · Chapter Three CTC Performance Review iv CHAPTER...
80
SARASOTA TRANSPORTATION ENHANCEMENT PLAN Chapter Three CTC Performance Review iv CHAPTER THREE CTC PERFORMANCE REVIEW INTRODUCTION......................................................................................................... 147 DESCRIPTION AND HISTORY OF CTC COORDINATED SERVICES ........................... 147 Florida Transportation Disadvantaged Program................................................... 147 History of the Sarasota County Transportation Disadvantaged Program........... 148 SARASOTA COUNTY CTC COORDINATED SERVICES................................................ 149 Types, Hours, and Days of Service ........................................................................ 149 Accessing Services ................................................................................................. 153 Sarasota County CTC Paratransit Eligibility Requirements ................................. 157 TD Non-sponsored Paratransit Service ....................................................................... 157 Americans with Disabilities (ADA) Complementary Paratransit Service........................... 158 Medicaid Non-Emergency Medical Transportation........................................................ 159 Transportation Operators and Coordination Contractors .................................... 159 CTC Vehicle Inventory ........................................................................................... 162 School Bus Utilization ............................................................................................ 162 Intercounty Services.............................................................................................. 162 Natural Disaster/Emergency Preparedness ......................................................... 166 Marketing ............................................................................................................... 167 Acceptable Alternatives ......................................................................................... 167 CTC Quality Assurance ........................................................................................... 167 Service Standards .................................................................................................... 168 Local Grievance Procedure ........................................................................................ 170 CTC Evaluation Process ............................................................................................ 171 PERFORMANCE EVALUATION OF CTC COORDINATED SERVICES ........................... 172 Performance Review Data ..................................................................................... 172 Sarasota County CTC Trend Analysis .................................................................... 173 Performance Measures ............................................................................................. 173 Effectiveness Measures............................................................................................. 178 Efficiency Measures .................................................................................................. 182 Conclusions ............................................................................................................. 185 CTC Peer Group Analysis........................................................................................ 186 Descriptions of CTC Peer Systems.............................................................................. 187 Charlotte County .................................................................................................. 187 Escambia County .................................................................................................. 188 Lee County........................................................................................................... 188 Manatee County ................................................................................................... 188 Pasco County ....................................................................................................... 188 Performance Measures ............................................................................................. 189 Effectiveness Measures............................................................................................. 194 Efficiency Measures .................................................................................................. 198 Conclusions ............................................................................................................. 199 CTC OPERATOR SURVEY ........................................................................................... 202 SENIOR FRIENDSHIP CENTER ON-BOARD SURVEY ................................................ 207 Survey Methodology .............................................................................................. 207 SFC On-Board Survey Analysis .............................................................................. 207
Transcript of CHAPTER THREE CTC PERFORMANCE REVIEW - CUTR · Chapter Three CTC Performance Review iv CHAPTER...

SARASOTA TRANSPORTATION ENHANCEMENT PLAN
Chapter Three CTC Performance Review
iv
CHAPTER THREECTC PERFORMANCE REVIEW
INTRODUCTION......................................................................................................... 147DESCRIPTION AND HISTORY OF CTC COORDINATED SERVICES........................... 147
Florida Transportation Disadvantaged Program................................................... 147History of the Sarasota County Transportation Disadvantaged Program........... 148
SARASOTA COUNTY CTC COORDINATED SERVICES................................................ 149Types, Hours, and Days of Service ........................................................................ 149Accessing Services ................................................................................................. 153Sarasota County CTC Paratransit Eligibility Requirements ................................. 157
TD Non-sponsored Paratransit Service ....................................................................... 157Americans with Disabilities (ADA) Complementary Paratransit Service........................... 158Medicaid Non-Emergency Medical Transportation........................................................ 159
Transportation Operators and Coordination Contractors .................................... 159CTC Vehicle Inventory ........................................................................................... 162School Bus Utilization ............................................................................................ 162Intercounty Services.............................................................................................. 162Natural Disaster/Emergency Preparedness ......................................................... 166Marketing ............................................................................................................... 167Acceptable Alternatives......................................................................................... 167CTC Quality Assurance........................................................................................... 167
Service Standards .................................................................................................... 168Local Grievance Procedure ........................................................................................ 170CTC Evaluation Process ............................................................................................ 171
PERFORMANCE EVALUATION OF CTC COORDINATED SERVICES........................... 172Performance Review Data ..................................................................................... 172Sarasota County CTC Trend Analysis .................................................................... 173
Performance Measures ............................................................................................. 173Effectiveness Measures............................................................................................. 178Efficiency Measures.................................................................................................. 182Conclusions ............................................................................................................. 185
CTC Peer Group Analysis........................................................................................ 186Descriptions of CTC Peer Systems.............................................................................. 187
Charlotte County .................................................................................................. 187Escambia County .................................................................................................. 188Lee County........................................................................................................... 188Manatee County ................................................................................................... 188Pasco County ....................................................................................................... 188
Performance Measures ............................................................................................. 189Effectiveness Measures............................................................................................. 194Efficiency Measures.................................................................................................. 198Conclusions ............................................................................................................. 199
CTC OPERATOR SURVEY ........................................................................................... 202SENIOR FRIENDSHIP CENTER ON-BOARD SURVEY................................................ 207
Survey Methodology .............................................................................................. 207SFC On-Board Survey Analysis .............................................................................. 207

SARASOTA TRANSPORTATION ENHANCEMENT PLAN
Chapter Three CTC Performance Review
v
SFC Rider Demographic Information .................................................................... 208SFC Rider Travel Behavior Information ................................................................ 209CTC Rider Satisfaction Information ...................................................................... 215Ridership of CTC Clients on Sarasota County Area Transit.................................. 218Rider Comments and Suggestions ........................................................................ 220Conclusions............................................................................................................. 221
CTC PERFORMANCE REVIEW: SUMMARY................................................................. 223
SARASOTA TRANSPORTATION ENHANCEMENT PLAN
Chapter Three CTC Performance Review
147
Chapter ThreeCTC Performance Review
INTRODUCTION
This chapter presents a history and description of the Transportation Disadvantaged (TD)services coordinated by Senior Friendship Centers Transportation, Inc. as the communitytransportation coordinator (CTC) for Sarasota County. The chapter includes descriptions of theCTC operational characteristics as well as service parameters for the TD program. A detailedperformance assessment comprised of trend and peer group analyses is provided for CTCservices. In addition, discussion and results from a survey of CTC bus operators and an on-board passenger survey of CTC paratransit users are also provided.
DESCRIPTION AND HISTORY OF CTC COORDINATED SERVICES
This section provides an introduction to Senior Friendships Center’s (SFC) role as the communitytransportation coordinator (CTC) for the Sarasota County TD program. The history of SarasotaCounty’s TD program is also provided. This section also summarizes the results of theperformance evaluation of SFC’s paratransit program. The performance evaluation wasconducted in two parts: a CTC trend analysis and a CTC peer review analysis. The CTC trendanalysis was completed to compare the performance of the Sarasota County CTC over time. ACTC peer review analysis was also conducted to compare the performance of the SarasotaCounty CTC to other peer CTCs within Florida. Finally, results from surveys conducted with busoperators and paratransit users are provided.
Florida Transportation Disadvantaged Program
As discussed in Chapter One, the Florida Transportation Disadvantaged (TD) Program wascreated in 1979 with the enactment of Chapter 427, Florida Statutes, which definestransportation disadvantaged as:
"...those persons who because of physical or mental disability, income status, orage are unable to transport themselves or to purchase transportation and are,therefore, dependent upon others to obtain access to health care, employment,education, shopping, social activities, or children who are handicapped or high-risk or at-risk as defined in Section 411.202, Florida Statutes."
SARASOTA TRANSPORTATION ENHANCEMENT PLAN
Chapter Three CTC Performance Review
148
The statewide TD program was developed to better coordinate existing transportationdisadvantaged services sponsored by social and human service agencies. The purpose ofcoordination is to reduce duplication of services and maximize the use of existing resources.The 1979 legislation created the Coordinating Council for the Transportation Disadvantaged inthe Department of Transportation and gave it the responsibility to coordinate TD transportationservices throughout the state.
Legislative revisions to Chapter 427 in 1989 created the Florida Commission for theTransportation Disadvantaged (FCTD) to accomplish the coordination of transportation servicesprovided to the transportation disadvantaged in the State of Florida. The FCTD is anindependent commission reporting directly to the Governor and the legislature. The 1989revisions also assigned the Commission to the Department of Transportation for administrativeand fiscal accountability purposes. The legislation also established the TD Trust Fund, whichprovided a dedicated funding source, and gave the Commission authority to allocate moniesfrom the Trust Fund. The 1989 revisions to Chapter 427, F.S. established communitytransportation coordinators (CTCs) and local coordinating boards (LCBs) to administer andmonitor the TD program at the local level. Therefore, CTCs and LCBs took over the roles andresponsibilities of the Coordinated Community Transportation Provider and the CoordinatedCommunity Transportation Provider Council that were provided for in the initial 1979 legislation.There are an estimated 5.4 million transportation disadvantaged individuals residing in Florida.
Florida's transportation disadvantaged program serves two populations groups: PotentialTransportation Disadvantaged (also referred to as "TD Category I") and the TransportationDisadvantaged (also referred to as "TD Category II"). The Potential TransportationDisadvantaged population includes persons who are eligible for agency-sponsored trips. TheTransportation Disadvantaged population group is a subset of the Potential TransportationDisadvantaged population group. While the individuals in this population group are eligible toreceive agency-sponsored trips through the Florida coordinated system, they are also eligible toreceive trips subsidized by the TD Trust Fund monies allocated to local CTCs by the FloridaCommission for the Transportation Disadvantaged (FCTD).
History of the Sarasota County Transportation Disadvantaged Program
The Sarasota-Manatee Metropolitan Planning Organization (MPO) has been working to addressthe needs of the transportation disadvantaged population in Sarasota County for some time. In1982 the MPO contracted with Kimley-Horn and Associates, Inc. to complete theSarasota/Manatee Area Elderly and Handicapped Transportation Disadvantaged TransportationNeeds Study. This document analyzed the needs of the transportation disadvantagedpopulation within Sarasota and Manatee Counties. Several recommendations were made to
SARASOTA TRANSPORTATION ENHANCEMENT PLAN
Chapter Three CTC Performance Review
149
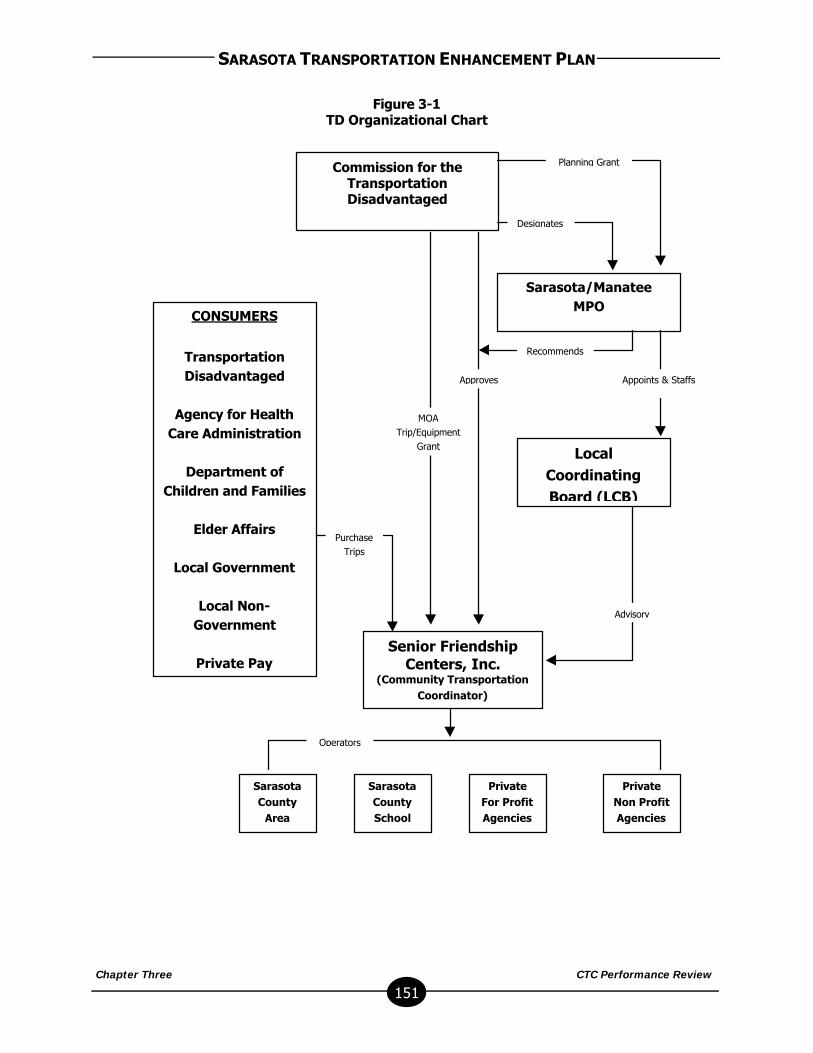
address the unmet needs of potential public transportation users. Within Sarasota County, therecommendation was made to designate the Senior Friendship Centers, Inc. (SFC) as theCoordinated Community Transportation Provider for Sarasota County. Figure 3-1 illustrates theorganizational structure of the TD program
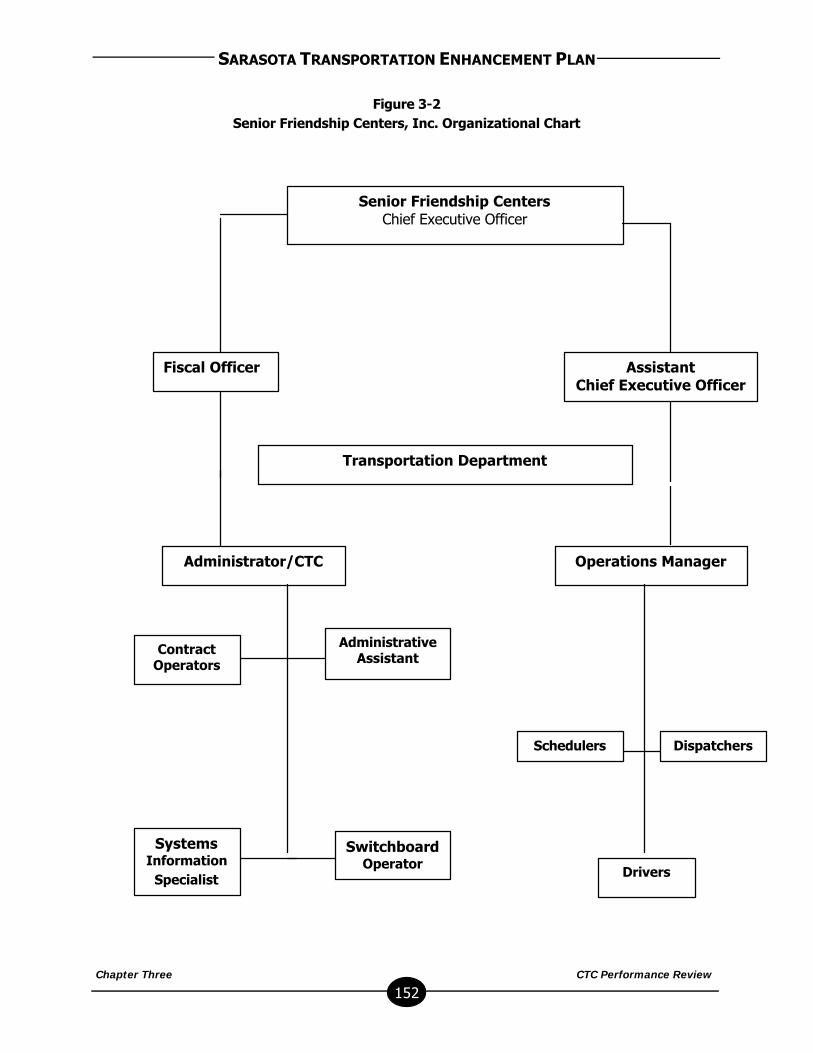
SFC is a private, not-for-profit organization incorporated in 1973 to provide services to peopleover the age of sixty in Sarasota County. SFC has provided transportation services to seniorsunder the Older Americans Act since 1970. In 1983, SFC became the designated Provider ofCoordinated Transportation for the Disadvantaged in Sarasota County. The CoordinationCouncil for the Transportation Disadvantaged approved a Memorandum of Agreement (MOA)with SFC in 1986. Figure 3-2 presents the organizational structure of SFC, Inc.
The Florida Commission for the Transportation Disadvantaged (FCTD) formally recommendedSFC as the CTC on July 13, 1990 along with the organization and establishment of the SarasotaCounty Local Coordinating Board (LCB). On July 23, 1990, the Sarasota/Manatee MPO officiallyendorsed SFC as the CTC for Sarasota County. SFC also executed a contract with the SarasotaCounty Board of County Commissioners in 1990 to provide Americans with Disabilities Act of1990 (ADA) complementary paratransit trips for Sarasota County Area Transit (SCAT).
SARASOTA COUNTY CTC COORDINATED SERVICES
The CTC in Sarasota County works very closely with the transit agency (SCAT). The CTC ishoused within the SCAT administrative offices and all CTC vehicle maintenance is provided bySCAT. In addition, SCAT contracts with the CTC to provide ADA complementary paratransitservice to eligible individuals and the agencies work together to determine eligibility for ADAparatransit services. Because of the unique relationship between the CTC and the transitagency in Sarasota County, all modes of public transportation in Sarasota County explicitly servethe transportation disadvantaged (TD) population. The following section will provide generalinformation about the umbrella of coordinated transportation services currently availablethrough the Sarasota County TD program.
Types, Hours, and Days of Service
The CTC provides ambulatory and wheelchair paratransit service to all eligible TD clients. Inspecial circumstances, the CTC provides service to non-county residents. In addition, the CTC isresponsible for the coordination of Medicaid stretcher service. The transportation serviceprovided by the CTC is door-to-door, demand-responsive, paratransit service requiring 24 hour
SARASOTA TRANSPORTATION ENHANCEMENT PLAN
Chapter Three CTC Performance Review
150
advance reservations. It is the policy of the CTC to provide passenger assistance from the origindoor to the vehicle, in boarding, seating, and exiting the vehicle, and to the door of the
SARASOTA TRANSPORTATION ENHANCEMENT PLAN
Chapter Three CTC Performance Review
151
Figure 3-1TD Organizational Chart
Sarasota/ManateeMPO
Commission for theTransportationDisadvantaged
CONSUMERS
TransportationDisadvantaged
Agency for HealthCare Administration
Department ofChildren and Families
Elder Affairs
Local Government
Local Non-Government
Private PaySenior Friendship
Centers, Inc.(Community Transportation
Coordinator)
SarasotaCounty
Area
SarasotaCountySchool
PrivateFor ProfitAgencies
PrivateNon ProfitAgencies
LocalCoordinatingBoard (LCB)
Planning Grant
Designates
Recommends
Appoints & StaffsApproves
MOATrip/Equipment
Grant
PurchaseTrips
Operators
Advisory
SARASOTA TRANSPORTATION ENHANCEMENT PLAN
Chapter Three CTC Performance Review
152
Figure 3-2Senior Friendship Centers, Inc. Organizational Chart
Senior Friendship CentersChief Executive Officer
Fiscal Officer AssistantChief Executive Officer
Transportation Department
Administrator/CTC Operations Manager
ContractOperators
AdministrativeAssistant
SystemsInformation
Specialist
SwitchboardOperator
DispatchersSchedulers
Drivers
SARASOTA TRANSPORTATION ENHANCEMENT PLAN
Chapter Three CTC Performance Review
153
destination. The CTC’s service area includes all of Sarasota County. Clients desiring out-of-service area transportation may call the CTC for special trip arrangements. Alternate areasserved include Manatee, Pinellas, Hillsborough, DeSoto, Charlotte, and Lee Counties. Medicaidtransportation is provided to Gainesville when necessary.
TD service is available 24 hours per day, seven days per week. Regular operational hours areMonday through Saturday, from 7:00 a.m. to 7:00 p.m. Private providers under contract withthe CTC provide TD service for the CTC after regular business hours, holidays, and on weekendswith advance notification. The CTC also provides same-day service to passengers on a space-and vehicle-available basis.
The CTC provides individual reservation trips, group trips, and subscription service to clients.Group trips are provided at a reduced rate and are defined as three or more passengerstraveling together either from one common origin or to one common destination. Subscriptiontrips are trips that recur from week to week, at the same time with the same origin anddestination. The CTC stores the information for these trips in a permanent computer file wherethe trips are automatically scheduled each service day prior to accepting individual reservationtrip requests. The CTC’s computer software also allows for the service to be placed on holdtemporarily without requiring the passenger to reestablish subscription service. Subscriptiontrips currently comprise approximately 45 percent of all trips provided by the CTC.
Accessing Services
Clients typically request trip reservations one day in advance, thus providing the CTC anopportunity to schedule drivers and vehicles cost-effectively. Telephone reservations areaccepted from 7:00 a.m. to 7:00 p.m. However, reservations for the next day of service are notaccepted after 2:00 p.m. unless adequate capacity and vehicle availability exist. Same dayreservations are accepted based on seating and schedule availability. The CTC acceptsreservations for service up to two weeks in advance of the desired travel date. The CTC can bereached by calling (941) 926-0135 or toll free at 475-3390.
Trip cancellations are accepted up to ten minutes before the scheduled pick-up time. Thesecancellations are documented as “late cancels.” If a passenger demonstrates a history of “latecancels,” a letter is generated and delivered which outlines service policies and costs involved asa result of late cancellations. Cancellations at the door or cancellations received less than tenminutes before the scheduled pick-up time are considered no-shows. Clients are not chargedfor canceled trips or no-shows. However, in response to escalating occurrences of cancellationsreceived at the door, the CTC has implemented a policy of suspending service for multiple no-
SARASOTA TRANSPORTATION ENHANCEMENT PLAN
Chapter Three CTC Performance Review
154
shows. After three no-shows, CTC staff advise the passenger that suspension is possibility withthe next occurrence. The suspension of service policy for excessive no-shows is as follows:
• Fourth occurrence: 30 day suspension of service• Fifth occurrence: 60 day suspension of service• Sixth occurrence: 90 day suspension of service• Seventh occurrence: 6 month suspension of service
Back-up service is available during all operational hours. Two vehicles are designated as back-up vehicles for the TD program. If vehicles from the regular fleet are out of service for repairs, aback-up vehicle is placed into service to maintain the same level service. In addition, severalCTC administrative staff members maintain valid commercial driving licenses (CDLs), and CPRand first aid certification and are used as replacement drivers, as needed.
The CTC employs an Operational Supervisor who has the responsibility to coordinate repairs,preventive maintenance, and driver training activities. SFC has a Safety Review Committee thatmeets regularly to review all incidents and accidents, make recommendations or modify policyand/or training procedures.
After-hours transportation service is provided through special arrangements and/or advancenotice. The CTC has eleven contract operators who provide TD door-to-door paratransit service24 hours per day, seven days per week and assist the CTC in providing after-hours service.These providers have ambulatory, wheelchair and stretcher vehicles, received supervised drivertraining, meet all FDOT safety regulations, comply with drug and alcohol testing, vehicleinspections and passenger sensitivity/passenger relations standards.
Five types of public transportation services are offered to meet the mobility needs oftransportation disadvantaged individuals in Sarasota County. These services include: TD non-sponsored paratransit, Medicaid non-emergency transportation, Americans with Disabilities Actcomplementary paratransit, agency-sponsored paratransit, and traditional fixed route transit.Each is discussed in the following sections.
TD Non-sponsored Door-to-Door Services
SFC began to provide, as well as coordinate, TD non-sponsored trips in FY 1990. Althoughthere are eleven transportation operators under contract to the CTC to provide TD trips withinthe coordinated system, SFC is currently the primary provider of TD non-sponsored trips inSarasota County. TD non-sponsored trips are general purpose trips that are not subsidized by agovernmental or social service agency. Non-sponsored trips are paid for with funding from the
SARASOTA TRANSPORTATION ENHANCEMENT PLAN
Chapter Three CTC Performance Review
155
State of Florida TD Trust Fund, which is administered by the FCTD. Individuals must becertified as TD eligible to receive these trips. These individuals are classified as TransportationDisadvantaged. The service is available to persons who, because of physical or mentaldisability, income status, age or for other reasons, are unable to transport themselves orpurchase transportation.
TD eligible individuals whose trips are not subsidized by an agency or another funding sourcemust request transportation at least 24 hours in advance and are provided door-to-doortransportation service. TD clients pay $2.00 per one-way trip. The remainder of the trip costsare paid by the Florida Commission for the Transportation Disadvantaged (FCTD) according to abase plus mileage formula. Because the demand for TD non-sponsored, general purposetransportation service is greater than the funds available, a set of trip priorities have beenestablished for the Sarasota County TD program. Trip purpose determines prioritization for non-sponsored trips. Medical, employment, education, and life-sustaining trip requests receive toppriority. Trip requests for other purposes, such as shopping, nutritional, and recreational arescheduled as funding allows. Prioritization of trip purposes applies to TD non-sponsored tripsonly. To date, the CTC has not had to deny any trip requests due to limited funding.
Medicaid Non-Emergency Medical Transportation
Three forms of transportation are provided to Medicaid clients requiring transportation toMedicaid-approved medical appointments. Eligible Medicaid clients may be provided door-to-door paratransit service, fixed-route bus service, or stretcher service. Currently, door-to-doorparatransit service is the primary mode of transportation provided to eligible Medicaid clients.The CTC uses a software program to validate Medicaid coverage for each client requestingtransportation service and to determine if door-to-door service is appropriate for each client. AMedicaid transportation application is employed to determine each Medicaid client’s ability touse the fixed-route bus service available, the existence of physical and mental disabilities, aswell as whether the client’s transportation needs can be met through the utilization of family,friends, or other community resources. Beginning in FY 1999, SFC and SCAT jointly establishedand implemented a Medicaid Bus Pass Program wherein eligible Medicaid clients are given a buspass entitling them to unlimited SCAT fixed-route bus trips for one month, while relinquishingparatransit privileges during that month. Medicaid clients participating in the Bus Pass Programmay use the fixed-route system in Sarasota County for all Medicaid-approved medicalappointment trips, as well as any personal trips that clients wish to make on the fixed-route bussystem. Finally, the CTC has also begun coordinating Medicaid-approved stretchertransportation, as needed.
Americans with Disabilities Act (ADA) Complementary Paratransit Service
SARASOTA TRANSPORTATION ENHANCEMENT PLAN
Chapter Three CTC Performance Review
156
The Americans with Disabilities Act (ADA) of 1990 requires that complementary paratransitservices be provided by agencies that provide fixed-route bus service. The paratransit servicemust "shadow" the fixed-route service area and a comparable level of service must be providedfor persons who cannot use the fixed-route service. Currently, the CTC is contracted by SCAT tocoordinate the provision of complementary paratransit services to persons that are ADA-eligible.Complementary paratransit service in Sarasota County is provided for trips anywhere within thecounty during fixed route service hours, rather than being limited to the ADA service area to the¾-mile buffer (see Figure 2-3). The demand for ADA complementary paratransit has beenincreasing each year in Sarasota County. As a result, SCAT and the CTC have developed a morethorough eligibility determination process for ADA complementary paratransit to help managedemand for this service. Currently, ADA-eligible passengers receive door-to-door transportationand pay a fare of $1.00 per one-way trip.
Agency-sponsored Paratransit Service
Paratransit service is purchased from the CTC by agencies to transport agency clients to andfrom agency services or to provide general purpose trips for clients. Agency-sponsored tripsinclude such destinations as training centers, sheltered workshops, congregate meal sites, andadult day care. Any group sponsored (and paid for) by the county, a municipality, school board,senior citizen group, or social service agency may purchase transportation through thecoordinated system. Agency-sponsored transportation may take the form of subscription trips(regular and recurring trips), reservation service (individual trip, not regularly scheduled orrecurring), or specialized service (trips which serve clients on an individual basis and requirespecial lift equipment, additional loading and unloading time, and/or trips out of the servicearea). Agencies that purchase transportation services from the CTC are charged a base fareand applicable zonal charges ($2.00 for each zone). These rates are included in Appendix H.Client fares vary according to the funding agency. Typically, agency clients pay a $1.00 fare perone-way trip.
Traditional Fixed Route Transit
Transportation disadvantaged individuals in Sarasota County can also use the fixed routesoperated by SCAT. Currently, 20 routes are operating throughout the county and providecountywide geographic coverage. In general, the fixed route service focuses on the urbanizedarea within and near the City of Sarasota. However, bus routes also serve South Sarasota,including the Venice area, North Port, and Englewood. In addition, limited connection servicewith Manatee County Area Transit (MCAT) is also available in North Sarasota. The CTC currentlyhas a Medicaid bus pass program wherein clients who have been determined to be able to use
SARASOTA TRANSPORTATION ENHANCEMENT PLAN
Chapter Three CTC Performance Review
157
the fixed-route bus system may purchase a monthly SCAT bus pass for $2.00. This pass can beused on the SCAT bus system for an unlimited number of trips. Clients who are given a buspass may not use paratransit service for that month. In conjunction with the Medicaid bus passprogram already in place, the CTC plans to implement an ADA bus pass program during fiscalyear 2000. This program will target individuals who are unconditionally or conditionally eligiblefor ADA complementary paratransit services. These individuals will be given free monthly buspasses to encourage their use of the fixed-route system. In addition, TD clients are alsoencouraged to use the fixed-route bus system for travel. During FY 1998, 39,327 trips on theSCAT system were made by transportation disadvantaged persons in Sarasota County.
Sarasota County CTC Paratransit Eligibility Requirements
SFC paratransit services are available for individuals classified as transportation disadvantagedbecause they are unable to transport themselves or to purchase transportation due to physicalor mental disability, age, income status, or because they are children at-risk. Paratransitservices are also available to persons who have been certified as eligible to receive ADAcomplementary paratransit service because they are unable to use SCAT's fixed-route busservice. ADA complementary paratransit services are coordinated through the Sarasota CountyCTC. Finally, door-to-door paratransit service is provided to eligible Medicaid clients for non-emergency medical purposes. The processes used to determine eligibility for each of theprograms are described below.
TD Non-sponsored Paratransit Service
The issue of eligibility for paratransit trips funded through TD non-sponsored funds has been atopic of much discussion throughout Florida for several years. The catalyst for these discussionshas been the acknowledgment that the demand for TD service exceeds the available supplyand/or funding for non-sponsored TD trips. The Florida Commission for the TransportationDisadvantaged (FCTD) has recently proposed changes to the TD Implementing Rule thatinclude specific requirements for a TD non-sponsored paratransit eligibility process. Theproposed rule changes include draft criteria designed for CTC use to determine eligibility fornon-sponsored trips subsidized with TD Trust Fund dollars. The eight criteria that have beenset forth by the FCTD include the following:
• No other funding is available to pay for the requested trip.• No other means of transportation is available. Applicants must demonstrate that
they cannot drive themselves or do not have ready access to family, friends, orneighbors who can transport them.
• If public transit is available, applicants must show why it cannot be used.

SARASOTA TRANSPORTATION ENHANCEMENT PLAN
Chapter Three CTC Performance Review
158
• Physical or mental disability, as outlined in the Americans with Disabilities Act of1990 (ADA).
• Age. (As specified by the LCB and CTC.)• Individual and household income status must be 150 percent of the federal poverty
level or less.• No self-declarations allowed. CTCs must use a formal eligibility process that
substantiates applicants’ ability to meet eligibility criteria.• Ability to pay. (As specified by the LCB and CTC.)
The CTC in Sarasota County currently determines eligibility for non-sponsored TD paratransitservices through a written application process which address each of the eligibility criteria listedabove. TD eligibility is awarded to those persons who are over the age of 60, have physical ormental disabilities that prevent the use of public transit, have income levels which do notexceed 1-½ times the poverty level, have no other means of transportation, cannot afford topurchase transportation or are children at risk.
Americans with Disabilities (ADA) Complementary Paratransit Service
Persons with disabilities in Sarasota County may be eligible to receive ADA complementaryparatransit service. These individuals must be certified as ADA-eligible in order to receiveparatransit service. Eligibility is conferred to persons with disabilities who are able todemonstrate that they are unable to use SCAT fixed-routes due to the nature and extent oftheir disability or because the fixed-route bus service is not fully accessible. ADAcomplementary paratransit services are only provided during the fixed-route days and hours ofservice.
ADA eligibility is determined through a written application process that requires certification by alicensed professional. Eligibility can be conferred as unconditional (status assigned to personswho are determined unable to ever independently navigate the public transit system, even withtraining) or conditional (status assigned to persons who are able to use public transit for sometrips, but under certain circumstances, and for certain trips, are not able to use fixed-route busservice).
A committee composed of both SCAT and SFC staff reviews applications. If an applicant isdetermined to be unconditionally eligible, a Silver Card number is assigned to the individual andtheir eligibility status is noted in the CTC client database. Persons who are certified asunconditionally eligible may access ADA paratransit service at will. Persons who are certified asconditionally eligible may only use ADA paratransit service under specified circumstances and/orconditions.
SARASOTA TRANSPORTATION ENHANCEMENT PLAN
Chapter Three CTC Performance Review
159
If the committee is not able to determine an applicant’s eligibility, a functional assessment ofthe applicant’s abilities is required. Functional assessments are provided by Easter Seals.Transportation to and from the evaluation is provided by the CTC. A physical functionalassessment consists of a simulated bus travel experience, including boarding a bus, negotiatinga curb and curb cut, and crossing a street. Skills evaluated include balance, strength,coordination and range of motion. Cognitive functional assessments consist of certainstandardized tests designed to measure skills such as memory, attention span and route-findingability. Variables in the environment, as well as the applicant's ability to perform the tasksrequired to use the bus, are also considered. Travel training is offered to persons who needassistance in learning to negotiate the public transit system.
Because the demand for ADA paratransit services has been growing faster than availablefunding, SCAT is now working with SFC to develop a more thorough approach to ADA eligibilitydetermination. The goal of the new eligibility determination process will be to ensure that onlyindividuals who meet the specific eligibility criteria outlined in the Americans with Disabilities Actof 1990 are provided ADA complementary paratransit service.
Medicaid Non-Emergency Medical Transportation
Medicaid-sponsored transportation is only offered to clients who are eligible recipients, when thetrip is medically necessary and reasonable, and they are traveling to locations to receiveMedicaid-covered service. Currently, Medicaid clients who would like to request transportationto medical appointments contact the CTC. The CTC verifies that the client is requestingtransportation for a Medicaid-eligible medical appointment, that the client does not have accessto family or friends that can provide a ride to the client, and that the client cannot utilize SCAT'sfixed-route bus system to complete the trip. Those Medicaid clients who are unable to accessSCAT fixed-route bus service due to proximity to the route, availability of service, or because ofa physical or mental disability prevents use of fixed-route transit are provided door-to-doorparatransit service. Medicaid passengers who can use the public transit system are offered amonthly Medicaid bus pass that is good for unlimited use of the system throughout that month.However, purchase of the monthly pass prohibits the use of door-to-door paratransit services forthat month.
Transportation Operators and Coordination Contractors
Sarasota County's CTC is the primary provider of coordinated, transportation disadvantaged,door-to-door services. The CTC contracts with private providers to provide services if the CTC is
SARASOTA TRANSPORTATION ENHANCEMENT PLAN
Chapter Three CTC Performance Review
160
at capacity, as well as for after hours, weekend and holiday service. SFC, with the goal ofachieving 100 percent coordination, remains receptive to all inquiries from potential operatorsand agencies interested in purchasing services. When approached, the CTC presents thepotential operators with a complete packet of all requirements, regulations, safety and operatingstandards, a trip rate summary, and a copy of the standardized contract. If the provider cancomply with all of the above, SFC then negotiates the contract with the provider. The CTCconducts annual on-site reviews of the contract providers to ensure compliance with adoptedstandards and regulations.
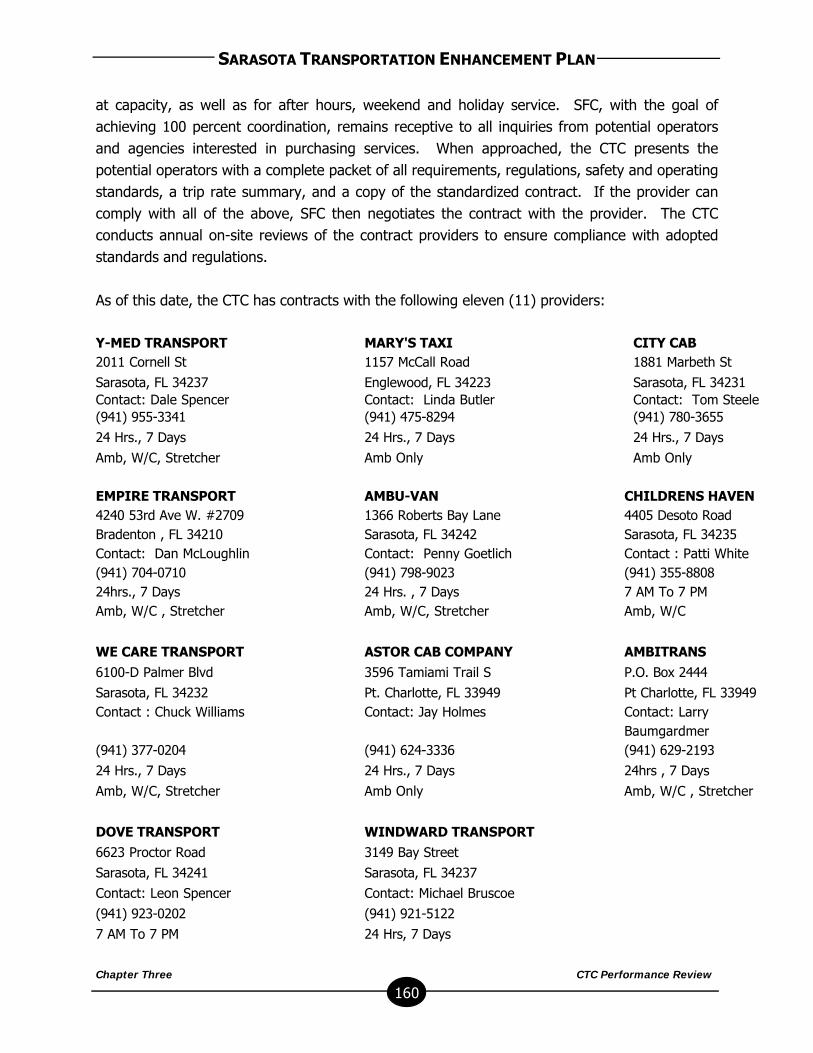
As of this date, the CTC has contracts with the following eleven (11) providers:
Y-MED TRANSPORT MARY'S TAXI CITY CAB2011 Cornell St 1157 McCall Road 1881 Marbeth St
Sarasota, FL 34237 Englewood, FL 34223 Sarasota, FL 34231Contact: Dale Spencer Contact: Linda Butler Contact: Tom Steele(941) 955-3341 (941) 475-8294 (941) 780-3655
24 Hrs., 7 Days 24 Hrs., 7 Days 24 Hrs., 7 Days
Amb, W/C, Stretcher Amb Only Amb Only
EMPIRE TRANSPORT AMBU-VAN CHILDRENS HAVEN4240 53rd Ave W. #2709 1366 Roberts Bay Lane 4405 Desoto RoadBradenton , FL 34210 Sarasota, FL 34242 Sarasota, FL 34235Contact: Dan McLoughlin Contact: Penny Goetlich Contact : Patti White(941) 704-0710 (941) 798-9023 (941) 355-880824hrs., 7 Days 24 Hrs. , 7 Days 7 AM To 7 PMAmb, W/C , Stretcher Amb, W/C, Stretcher Amb, W/C
WE CARE TRANSPORT ASTOR CAB COMPANY AMBITRANS6100-D Palmer Blvd 3596 Tamiami Trail S P.O. Box 2444
Sarasota, FL 34232 Pt. Charlotte, FL 33949 Pt Charlotte, FL 33949Contact : Chuck Williams Contact: Jay Holmes Contact: Larry
Baumgardmer(941) 377-0204 (941) 624-3336 (941) 629-2193
24 Hrs., 7 Days 24 Hrs., 7 Days 24hrs , 7 Days
Amb, W/C, Stretcher Amb Only Amb, W/C , Stretcher
DOVE TRANSPORT WINDWARD TRANSPORT6623 Proctor Road 3149 Bay Street
Sarasota, FL 34241 Sarasota, FL 34237
Contact: Leon Spencer Contact: Michael Bruscoe
(941) 923-0202 (941) 921-5122
7 AM To 7 PM 24 Hrs, 7 Days

SARASOTA TRANSPORTATION ENHANCEMENT PLAN
Chapter Three CTC Performance Review
161
Amb, W/C, Stretcher Amb, W/C, Stretcher
The CTC ensures that all providers comply with the following:
• Vehicles must meet all safety specifications for ADA and Rule 14-90, F.A.C.• System Safety Program Plan• Drug-Free Workplace Policy / Substance Abuse Policy• Employee Training Program• Providing mandatory reports to the CTC• Certification of Compliance with Chapter 427, Florida Statutes
All trips are coordinated by the CTC with assignment to the providers. Providers must submitdocumentation of having performed the trip with times and odometer readings. The CTCreimburses the provider within 30 days. The CTC monitors all trips for accuracy and quality ofservice.
In addition, the CTC maintains coordinated agreements with six (6) private non-profit agenciesthat are recipients of publicly funded vehicles under the Section 5310 grant process. The CTCreceives monthly reports from all agencies and conducts periodic on-site system safety reviews.Coordinated contractors provide service for their own agency clients in vehicles purchasedthrough the Section 5310 program. These services are justified by the provision of relevantfinancial data during the application review process. Although these agencies cover joint useand cost provisions for transportation services in the contract, the CTC is not assigning trips tothese contractors. These agencies have clients with unique transportation needs, occurringduring peak operational hours or on off-days. The agencies absorb the costs of the services intheir agency budgets.
The CTC currently has coordinated agreements with the following agencies:
CHILD DEVELOPMENTCENTERS
UNITED CEREBRAL PALSY THE PINES OF SARASOTA
4620 17th Street 1227 S Tamiami Trail 1501 N Orange AvenueSarasota, FL 34235 Sarasota, FL 34236 Sarasota, FL 34234
Contact: Mary Lou Jackson Contact: John Byrd Contact: Elaine Boyer(941) 371-8820 (941) 957-3599 (941) 365-0250Mon-Fri, 8 AM To 5 PM Mon-Fri, 8 AM-5 PM Mon-Fri , 8 AM To 5 PMAgency Clients Only Agency Clients Only Agency Clients Only
J H FLOYD SUNSHINE MANOR LOVELAND CENTER FIRST STEP OF SARASOTA1755 18th Street 4002 S. Tamiami Trail 2800 Bahia VistaSarasota, FL 34234 Venice, FL 34293 Sarasota, FL 34239
SARASOTA TRANSPORTATION ENHANCEMENT PLAN
Chapter Three CTC Performance Review
162
Contact: Kelly Bolger Contact: Carl Penxa, Jr Contact: Alan Johnson(941) 955-4915 (941) 493-0016 (941) 366-5333Mon-Fri , 8 AM To 5 PM Mon-Fri, 8 AM To 5 PM Mon-Fri, UnlimitedAgency Clients Only Agency Clients Only Agency Clients Only
The CTC maintains an ongoing interest in incorporating all transportation entities into thecoordinated system. Both District 8 Medicaid and the Florida Department of Transportationdirect inquiries to SFC for contract consideration.
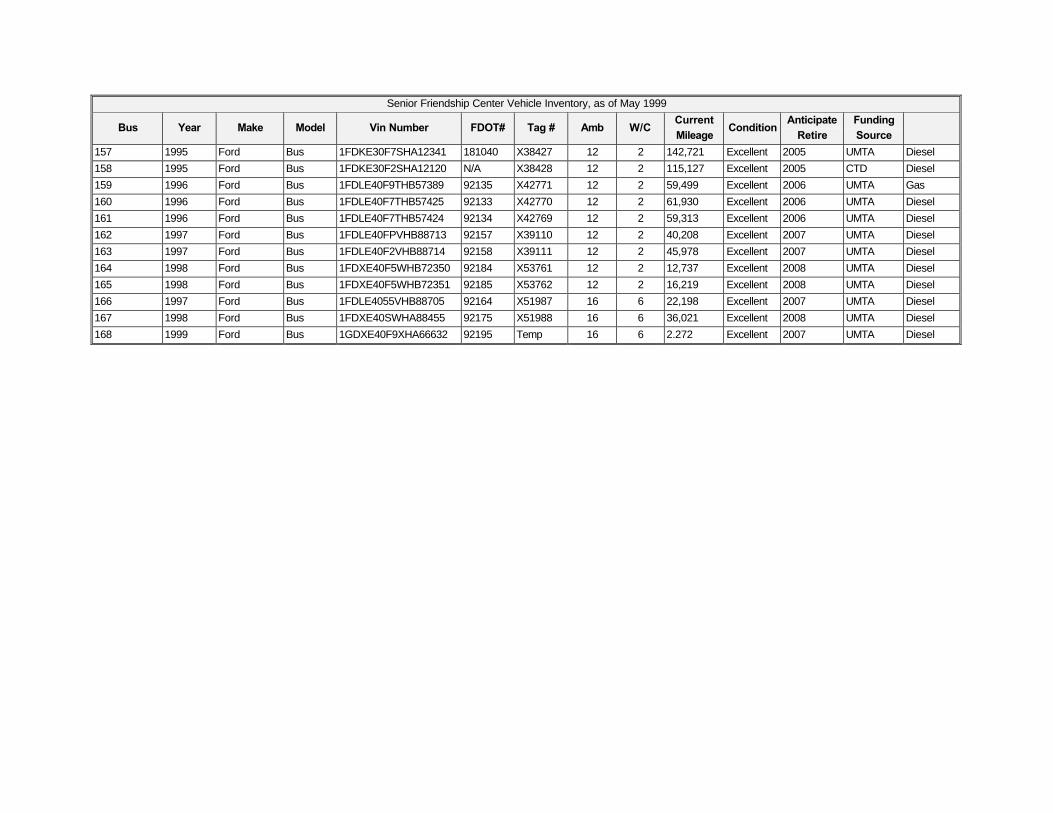
CTC Vehicle Inventory
The fleet of vehicles used to serve the transportation disadvantaged population in SarasotaCounty consists of regular and lift-equipped vans and lift equipped minibuses. The CTC currentvehicle inventory is contained in Table 3-1. The inventory includes information on vehicle typeand make, the number of seats and securement positions for wheelchairs, current mileage, ageof vehicle, and the anticipated replacement date. It is estimated that the CTC will need toreplace 19 vehicles between 2000 and 2004 to maintain the current level of service.
School Bus Utilization
The CTC has investigated the possibility of utilizing the Local School Bus System to accomplishTD trips. However, it has been determined that this service is not cost effective with thepresent rate of $15.00 per hour, ten day lead time and the lack of available vehicles.Throughout the development of the STEP, considerable attention has been paid to the issue ofutilizing school buses for community transportation. Future coordination of school bus resourcesmay be accomplished through the implementation the STEP initiatives discussed in ChapterNine. The CTC will continue to work with representatives in the community to facilitate andencourage maximization of existing transportation resources, including school buses.
Intercounty Services
The CTC does not currently have any written cooperative agreements with other CTC's in the
state. However, Senior Friendship Centers Transportation does have informal cooperative
agreements with Charlotte, Manatee, DeSoto, Hillsborough and Pinellas counties. Under these
informal agreements, if a trip request is received that can best be coordinated utilizing another
CTC, SFC contacts the CTC and arranges the transportation. In many cases, this arrangement
may only apply to the return portion of the trip or the continuation of the trip that is arranged
relative to the CTC's location and previously scheduled trips. In this way, the CTC strives to
provide the most efficient and cost-effective service possible for clients.

SARASOTA TRANSPORTATION ENHANCEMENT PLAN
Chapter Three CTC Performance Review
163
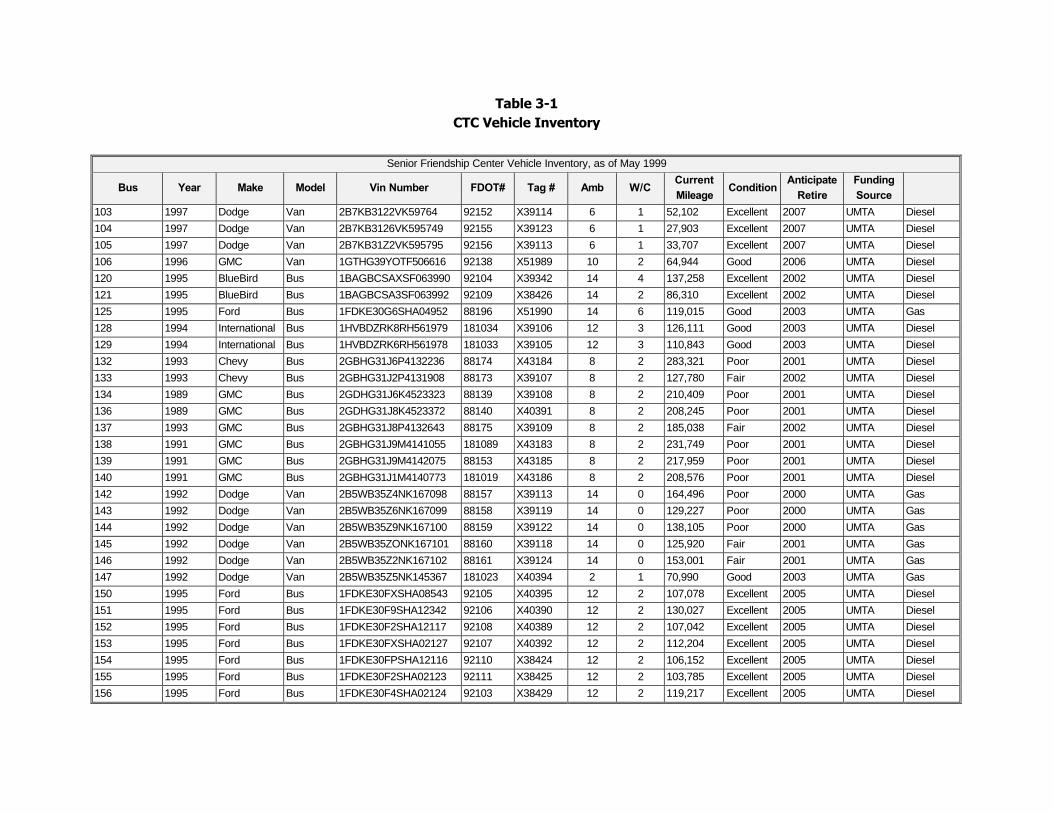
Table 3-1CTC Vehicle Inventory
Senior Friendship Center Vehicle Inventory, as of May 1999
Bus Year Make Model Vin Number FDOT# Tag # Amb W/CCurrent
MileageCondition
Anticipate
Retire
Funding
Source
103 1997 Dodge Van 2B7KB3122VK59764 92152 X39114 6 1 52,102 Excellent 2007 UMTA Diesel
104 1997 Dodge Van 2B7KB3126VK595749 92155 X39123 6 1 27,903 Excellent 2007 UMTA Diesel
105 1997 Dodge Van 2B7KB31Z2VK595795 92156 X39113 6 1 33,707 Excellent 2007 UMTA Diesel
106 1996 GMC Van 1GTHG39YOTF506616 92138 X51989 10 2 64,944 Good 2006 UMTA Diesel
120 1995 BlueBird Bus 1BAGBCSAXSF063990 92104 X39342 14 4 137,258 Excellent 2002 UMTA Diesel
121 1995 BlueBird Bus 1BAGBCSA3SF063992 92109 X38426 14 2 86,310 Excellent 2002 UMTA Diesel
125 1995 Ford Bus 1FDKE30G6SHA04952 88196 X51990 14 6 119,015 Good 2003 UMTA Gas
128 1994 International Bus 1HVBDZRK8RH561979 181034 X39106 12 3 126,111 Good 2003 UMTA Diesel
129 1994 International Bus 1HVBDZRK6RH561978 181033 X39105 12 3 110,843 Good 2003 UMTA Diesel
132 1993 Chevy Bus 2GBHG31J6P4132236 88174 X43184 8 2 283,321 Poor 2001 UMTA Diesel
133 1993 Chevy Bus 2GBHG31J2P4131908 88173 X39107 8 2 127,780 Fair 2002 UMTA Diesel
134 1989 GMC Bus 2GDHG31J6K4523323 88139 X39108 8 2 210,409 Poor 2001 UMTA Diesel
136 1989 GMC Bus 2GDHG31J8K4523372 88140 X40391 8 2 208,245 Poor 2001 UMTA Diesel
137 1993 GMC Bus 2GBHG31J8P4132643 88175 X39109 8 2 185,038 Fair 2002 UMTA Diesel
138 1991 GMC Bus 2GBHG31J9M4141055 181089 X43183 8 2 231,749 Poor 2001 UMTA Diesel
139 1991 GMC Bus 2GBHG31J9M4142075 88153 X43185 8 2 217,959 Poor 2001 UMTA Diesel
140 1991 GMC Bus 2GBHG31J1M4140773 181019 X43186 8 2 208,576 Poor 2001 UMTA Diesel
142 1992 Dodge Van 2B5WB35Z4NK167098 88157 X39113 14 0 164,496 Poor 2000 UMTA Gas
143 1992 Dodge Van 2B5WB35Z6NK167099 88158 X39119 14 0 129,227 Poor 2000 UMTA Gas
144 1992 Dodge Van 2B5WB35Z9NK167100 88159 X39122 14 0 138,105 Poor 2000 UMTA Gas
145 1992 Dodge Van 2B5WB35ZONK167101 88160 X39118 14 0 125,920 Fair 2001 UMTA Gas
146 1992 Dodge Van 2B5WB35Z2NK167102 88161 X39124 14 0 153,001 Fair 2001 UMTA Gas
147 1992 Dodge Van 2B5WB35Z5NK145367 181023 X40394 2 1 70,990 Good 2003 UMTA Gas
150 1995 Ford Bus 1FDKE30FXSHA08543 92105 X40395 12 2 107,078 Excellent 2005 UMTA Diesel
151 1995 Ford Bus 1FDKE30F9SHA12342 92106 X40390 12 2 130,027 Excellent 2005 UMTA Diesel
152 1995 Ford Bus 1FDKE30F2SHA12117 92108 X40389 12 2 107,042 Excellent 2005 UMTA Diesel
153 1995 Ford Bus 1FDKE30FXSHA02127 92107 X40392 12 2 112,204 Excellent 2005 UMTA Diesel
154 1995 Ford Bus 1FDKE30FPSHA12116 92110 X38424 12 2 106,152 Excellent 2005 UMTA Diesel
155 1995 Ford Bus 1FDKE30F2SHA02123 92111 X38425 12 2 103,785 Excellent 2005 UMTA Diesel
156 1995 Ford Bus 1FDKE30F4SHA02124 92103 X38429 12 2 119,217 Excellent 2005 UMTA Diesel
Senior Friendship Center Vehicle Inventory, as of May 1999
Bus Year Make Model Vin Number FDOT# Tag # Amb W/CCurrent
MileageCondition
Anticipate
Retire
Funding
Source
157 1995 Ford Bus 1FDKE30F7SHA12341 181040 X38427 12 2 142,721 Excellent 2005 UMTA Diesel
158 1995 Ford Bus 1FDKE30F2SHA12120 N/A X38428 12 2 115,127 Excellent 2005 CTD Diesel
159 1996 Ford Bus 1FDLE40F9THB57389 92135 X42771 12 2 59,499 Excellent 2006 UMTA Gas
160 1996 Ford Bus 1FDLE40F7THB57425 92133 X42770 12 2 61,930 Excellent 2006 UMTA Diesel
161 1996 Ford Bus 1FDLE40F7THB57424 92134 X42769 12 2 59,313 Excellent 2006 UMTA Diesel
162 1997 Ford Bus 1FDLE40FPVHB88713 92157 X39110 12 2 40,208 Excellent 2007 UMTA Diesel
163 1997 Ford Bus 1FDLE40F2VHB88714 92158 X39111 12 2 45,978 Excellent 2007 UMTA Diesel
164 1998 Ford Bus 1FDXE40F5WHB72350 92184 X53761 12 2 12,737 Excellent 2008 UMTA Diesel
165 1998 Ford Bus 1FDXE40F5WHB72351 92185 X53762 12 2 16,219 Excellent 2008 UMTA Diesel
166 1997 Ford Bus 1FDLE4055VHB88705 92164 X51987 16 6 22,198 Excellent 2007 UMTA Diesel
167 1998 Ford Bus 1FDXE40SWHA88455 92175 X51988 16 6 36,021 Excellent 2008 UMTA Diesel
168 1999 Ford Bus 1GDXE40F9XHA66632 92195 Temp 16 6 2.272 Excellent 2007 UMTA Diesel

SARASOTA TRANSPORTATION ENHANCEMENT PLAN
Chapter Three CTC Performance Review
166
Barriers to cooperative agreements have included farebox collection (10% match for TD funds),
client eligibility determination issues, and trip prioritization structures. The need for intercounty
travel has also been identified through the STEP process (see Chapter Seven). Several
recommendations included in Chapter Nine have been designed to provide intercounty
connectivity for all residents and visitors in Sarasota County, including the transportation
disadvantaged population.
Natural Disaster/Emergency Preparedness
FEMA involvement and SFC's designated role, Senior Friendship Centers serves as both a
staging area and vehicle for evacuation of persons with special needs under the leadership of
the Department of Emergency Management, Sarasota County Government. The County
anticipates the needs of persons requiring special medical sheltering and/or transportation
during a declared State of Emergency through the People with Special Needs program, as
stipulated in Florida State Statute 252.355. As of October 1993, there were approximately
1500 registered people. One of the most important aspects in evacuating the special needs
population segment is determining and securing the appropriate types of vehicles to use.
County vehicle resources that have been committed to augment the Program are buses, lift gate
vehicles, school buses and ambulances. Both Sarasota County Area Transit and Senior
Friendship Centers will provide buses to transport able-bodied people without their own means
of transportation to the area shelters. Run sheets with information are created from the
database and assigned to transportation resources for advanced planning.
In the event of a natural disaster, the Transportation Department of Senior Friendship Centers
will enact the following procedures:
a. All personnel will be notified in advance that they will be paid for driving during an
evacuation, but it is voluntary.
b. A list of volunteers, if any, will be maintained with methods to contact them.
c. Vehicles will be fueled and marked as mechanically available.
d. Keys will be left in vehicles and odometer readings recorded.
e. Warnings will be posted at least 48 hours prior to evacuation
f. Transportation Director will be notified by Sarasota County Disaster Preparedness, if
evacuation is necessary.
g. Transportation Director will notify SFC Senior Staff and key transportation personnel,
including all supervisors.
h. Supervisors will notify volunteer drivers.
SARASOTA TRANSPORTATION ENHANCEMENT PLAN
Chapter Three CTC Performance Review
167
i. Transportation Director will keep Disaster Preparedness advised as to readiness status of
SFC Main Center and vehicles, to include drivers, vehicle capabilities and capacities.
j. Transportation Director will be stationed in the transportation office and will maintain
contact with Sarasota and Venice based vehicles via radio and the main SFC center via
telephone and/or radio depending on availability of communication.
k. Senior supervisor will assume the duties outlined above for director is out of town or for
some reason cannot assume these duties.
l. An update of volunteer drivers and other key staff will be conducted annually. A
telephone tree will be maintained with Transportation Emergency Management
Procedures.
Marketing
Senior Friendship Centers utilizes several market media. A brochure which defines service and
explains service delivery is available on the SFC vehicles and is distributed to agencies whose
clients use the service. An infomercial is installed on the telephone system, which educates
callers about the TD program, operating hours, how to make a reservation, the one-hour
window, and the costs of transportation. SFC publishes a quarterly newspaper, "TODAY'S
SENIOR" which features articles about transportation. The local newspaper includes this
publication in the Sunday edition twice per year. Outreach efforts are ongoing. Transportation
staff speak at nursing homes, congregate living facilities, and to agencies whose clients use the
service.
Acceptable Alternatives
Currently, no economically feasible transportation alternatives to the coordinated system have
been identified. However, the STEP is recommending the formation of a Community
Transportation Pool (see Chapter Eight for a full description) designed to accomplish the
coordination of existing transportation resources that are not required, under F.S. 427, to
participate in the Florida coordinated system. Formation of this pool may result in a mechanism
that increases the mobility of the transportation disadvantaged population in Sarasota County at
a lower cost than the coordinated TD system.
CTC Quality Assurance
The CTC and Local Coordinating Board have developed a thorough quality assurance program to
ensure that the TD program in Sarasota County provides quality, safe, and efficient service for
SARASOTA TRANSPORTATION ENHANCEMENT PLAN
Chapter Three CTC Performance Review
168
TD clients. The following sections describe two components of the quality assurance program
for the Sarasota County TD program – adopted service standards and the adopted grievance
procedures.
Service Standards
The Community Transportation Coordinator and any Transportation Operator form whom service
is purchased or arranged by the CTC shall adhere to Commission approved standards. These
standards, as outlined in Rule 41-2.006 (4), Florida Administrative Code, include:
1. Drug and Alcohol Testing - All safety sensitive job positions shall comply with the pre-
employment, randomization, post-accident and reasonable suspicion testing
requirements of the Federal Transit Administration.
2. Transport of Escorts and Dependent Children - Children under age 16 and
individuals requiring special loading assistance will be required to be accompanied by an
escort. Escorts must be provided by the passenger. The escorts must be able to
provide the necessary assistance to the passenger. Escorts shall be transported with
Medicaid and Title III passengers at no cost. All other sponsored trips requiring escorts
are billed at one-half the cost of the trip.
3. Use, Responsibility and Cost of Child Restraint Devices - All passengers under
the age of 4 and/or under 45 pounds shall be required to use a child restraint device.
This device shall be provided by the passenger.
4. Passenger Property - Passengers shall be allowed to have unlimited pieces of personal
property which they can stow in the rear of the vehicle. Passengers must be able to
independently carry all items brought onto the vehicle. Drivers shall be allowed to carry
packages as individually needed by the passenger. Passenger property does not include
wheelchairs, child seats, secured oxygen, personal assistance devices, or intravenous
devices. Groceries shall be limited to 4 plastic bags or 2 paper bags.
5. Vehicle Transfer Points - Vehicle transfer points shall be located in a safe, and secure
place that provides shelter.
6. Local Toll Free Telephone Number - A local toll free telephone number shall be
posted in all vehicles within the transportation system. This telephone number shall be
included in the complaint process.
7. Out-of-Service Area Trips - The CTC will provide out-of-service area trips Monday -
Friday based on availability and capacity.
8. Vehicle Cleanliness - Interior of all vehicles shall be free of dirt, oil, trash, torn
upholstery, damaged or broken seats, protruding metal or other objects or
SARASOTA TRANSPORTATION ENHANCEMENT PLAN
Chapter Three CTC Performance Review
169
materials which could soil items placed in the vehicle or provide discomfort for the
passenger. All vehicles shall be cleaned (interior and exterior) on a regular schedule.
9. Billing Requirements - The CTC shall pay all bills within 15 days to subcontractors
after receipt of said payment by the CTC.
10. Passenger/Trip Database - The CTC shall collect and maintain the name, telephone
number, address, funding source eligibility and special requirements in a database on
each passenger.
11. Adequate Seating - Vehicle seating shall not exceed the manufacturer's recommended
capacity.
12. Driver Identification - Drivers for the CTC shall be attired in uniforms with their
names and the CTC logo displayed on the uniform. Contracted operators shall be
required to announce and identify themselves by name and company in a manner that is
conducive to communications with the specific passenger upon pickup. Contracted
operators shall wear a name tag with the CTC logo and a picture ID. at all times when
transporting passengers.
13. Passenger Assistance - All drivers shall assist all passengers on and off the vehicles, if
necessary or requested to the seating area of vehicles. This assistance shall include:
opening the vehicle door, fastening the seat belt or wheelchair securement devices,
storage of mobility devices and closing the door. Drivers may not assist wheelchairs up
or down more than one (1) step.
14. Smoking, Drinking and Eating - There shall be no smoking or the use of tobacco
products on any vehicle in the transportation system. Eating and drinking on board the
vehicle will not be allowed. Stops will be made to accommodate the needs of the
passengers as determined by the dispatcher. Comfort stops will be determined by the
driver.
15. Passenger No-Shows - Passenger no-shows are defined as trips not canceled prior to
dispatch of the vehicle. The CTC will enforce the Medicaid No-Show Policy for all
passengers. Third occurrence: letter from the CTC, fourth occurrence: 30 day
suspension, fifth occurrence: 60 day suspension, sixth occurrence: 90 day suspension.
16. Two-Way Communications - All vehicles shall be equipped with two-way radios in
good working order and be audible to drivers at all times to the base.
17. Air Conditioning / Heating - All vehicles in the coordinated system shall have working
air conditioning and heating. Vehicles that do not have a working air conditioner or
heater shall be scheduled for repair or replacement as soon as possible.
18. CPR / First Aid - All drivers shall be certified in CPR and Community First Aid.
19. Driver Criminal Background Screening - All drivers in the coordinated system must
have a criminal background screening prior to employment.

SARASOTA TRANSPORTATION ENHANCEMENT PLAN
Chapter Three CTC Performance Review
170
20. Service Effectiveness - Service effectiveness shall be evaluated based on the
following information: percentage of TD passengers transported, passenger trips/vehicle
mile, cost/vehicle mile, cost/passenger trip, vehicle miles/passenger and a customer
satisfaction survey and client focus groups.
21. Public Transit Ridership – The number of TD trips provided by the public transit
system is growing; approximately, 39,000 trips were reported during the last MOA year.
22. Contract Monitoring - The CTC shall perform an annual evaluation of the contracted
operators using applicable portions of the TDCB evaluation process and the FDOT
System Safety Program Plan Inspection.
23. Pick-up Window - There is a one hour pick-up window in place for all trips within the
service area. Out-of-service area trips may require additional time.
24. On-time Performance - The CTC shall have an 95% on-time performance rate for all
completed trips.
25. Advance Reservation Requirement - There shall be a 24 hour notice requirement
for all trips scheduled within the coordinated system, except under special
circumstances.
26. Accidents - 1.2 accidents per 100,000 miles shall be the maximum allowable number
of accidents for the evaluation period.
27. Roadcalls - There should be no less than 10,000 miles between each roadcall.
28. Call Hold Time - Hold time shall not exceed two (2) minutes for any caller.
29. Standard for Written Complaints - The CTC sets 20 written complaints as the
standard of measure for annual performance.
Local Grievance Procedure
The following bullet points outline the adopted grievance process that is followed in theSarasota County TD program in order to facilitate the quick resolution of passenger and clientcomplaints related to service.
• The grievance rights of the user shall be posted in a location that is generally visible tosighted clients and be made available, upon request, in a format accessible to personswith disabilities.
• Complaints which emanate from continued lateness, driver behavior, passengerdiscomfort, irregularities in the system of delivery or decisions made to deny, reduce orterminate services constitute grievances for users or funding agencies. Complaintsabout charges or billing constitute grievances by a funding agency or transportationoperator. Other complaints can be heard at the discretion of the Grievance Board. The

SARASOTA TRANSPORTATION ENHANCEMENT PLAN
Chapter Three CTC Performance Review
171
CTC will record, maintain and report all complaints and problems to the CoordinatingBoard.
• A letter stating the problem shall be sent to the Community Transportation Coordinator(CTC) outlining the nature of the alleged grievance, and where applicable the date, timeand place of the incident constituting the grievance. The Community TransportationCoordinator (CTC) will make every effort to resolve the grievance following theprocedures of his/her agency.
• If this effort is not successful, the grievant may present their grievance to the chairmanof the Grievance Committee by written notice.
• Upon receipt of the grievance form, the chairperson shall have ten (10) working days tocontact Grievance Committee members and set a grievance hearing date. The hearingdate must be within twenty (20) days of receipt of written grievance.
• The grievant and all parties involved shall be notified at least seven (7) working daysprior to the hearing date by certified mail, return receipt requested. The GrievanceCommittee shall review the material presented and issue a decision to all parties involvedwithin ten (10) working days. The said notice shall be sent to all parties by certifiedmail, return receipt requested.
• If the grievance cannot be resolved by the Grievance Committee, the grievant may notifythe Coordinating Board.
• If the grievance is not resolved at the level of the Local Coordinating Board, the grievantmay notify the full body of the Metropolitan Planning Organization (MPO).
CTC Evaluation Process
A copy of the most recent evaluation of the Sarasota County CTC is contained in Appendix I.
SARASOTA TRANSPORTATION ENHANCEMENT PLAN
Chapter Three CTC Performance Review
172
PERFORMANCE EVALUATION OF CTC COORDINATED SERVICES
Performance Review Data
The substantial amount of data available from the Annual Operating Reports (AORs) submitted
to the FCTD by each CTC in the state of Florida provide an opportunity to develop a large
assortment of measures for CTC service. Sets of performance, effectiveness, and efficiency
measures that have been known to provide a good representation of overall CTC system
performance have been selected and included in the following performance evaluations of the
CTC for Sarasota County. Table 3-2 lists the measures used in this section. The tables and
figures provided throughout the following trend and peer group analyses present selected
performance, effectiveness, and efficiency measures that are available from AORs submitted by
CTCs throughout Florida. These figures may be overstated or understated, due to various
accounting practices at SFC, contract providers, the agencies that have entered into
coordination agreements with the CTC, as well as the other CTCs included in the peer group
analysis. Results from the CTC trend analysis performed for the Sarasota County CTC are
provided in the following paragraphs.
Table 3-2Performance Review Measures
Paratransit Analysis
Performance Measures Effectiveness Measures Efficiency Measures
County Population Vehicle Miles per TD Capita Operating Expense per Passenger Trip
Potential TD Population Passenger Trips per TD Capita Operating Exp per Paratransit Pass Trip
Passenger Trips Paratransit Pass Trips per TD Capita Operating Expense per Vehicle Mile
Paratransit Pass Trips Passenger Trips per Vehicle Mile Farebox Ratio
Vehicle Miles Average Age of Fleet (in years) Local Government Revenue Ratio
Revenue Miles Accidents per 100,000 Vehicle Miles
Operating Expense Vehicle Miles Between Roadcalls
Total Revenue
Total Fleet
In order to completely understand the data used in a performance evaluation of this type, it is
important to have an understanding of the definitions of the terms. In many instances, these
definitions differ from initial perceptions and, therefore, may be contingent upon subjective
interpretation. Appendix B provides a detailed list of definitions for the terms used in the trend
and peer analyses. Despite these definitions and continuous efforts to refine them, some
discrepancies remain as to how terms are defined and how information is collected.

SARASOTA TRANSPORTATION ENHANCEMENT PLAN
Chapter Three CTC Performance Review
173
Consequently, some caution should be exercised when interpreting the findings, especially for
those variables that are more likely to be subject to variation in definition.
Sarasota County CTC Trend Analysis
In addition to the SCAT fixed-route trend analysis presented in an earlier section of this report,
CUTR conducted a CTC trend analysis for FY 1992 through FY 1998 to examine the
performance of the Sarasota County TD paratransit program, operated by Senior Friendship
Centers, Inc (SFC), over time. SFC serves as the Community Transportation Coordinator (CTC)
for all transportation services provided through the County’s TD program, as well as providing
and coordinating ADA complementary paratransit service in Sarasota County under contract to
SCAT. This trend analysis represents a combined set of statistics for all TD transportation
services coordinated through the CTC, including ADA, TD and Medicaid paratransit, fixed-route
(unless otherwise specified), and agency-sponsored services. Service statistics are included for
all providers of service, including SFC, eight CTC contract providers, and seven agencies that
have coordination agreements with the CTC. The tables and figures provided throughout the
trend analysis present selected performance, effectiveness, and efficiency measures that are
available from SFC’s AORs.
Performance Measures
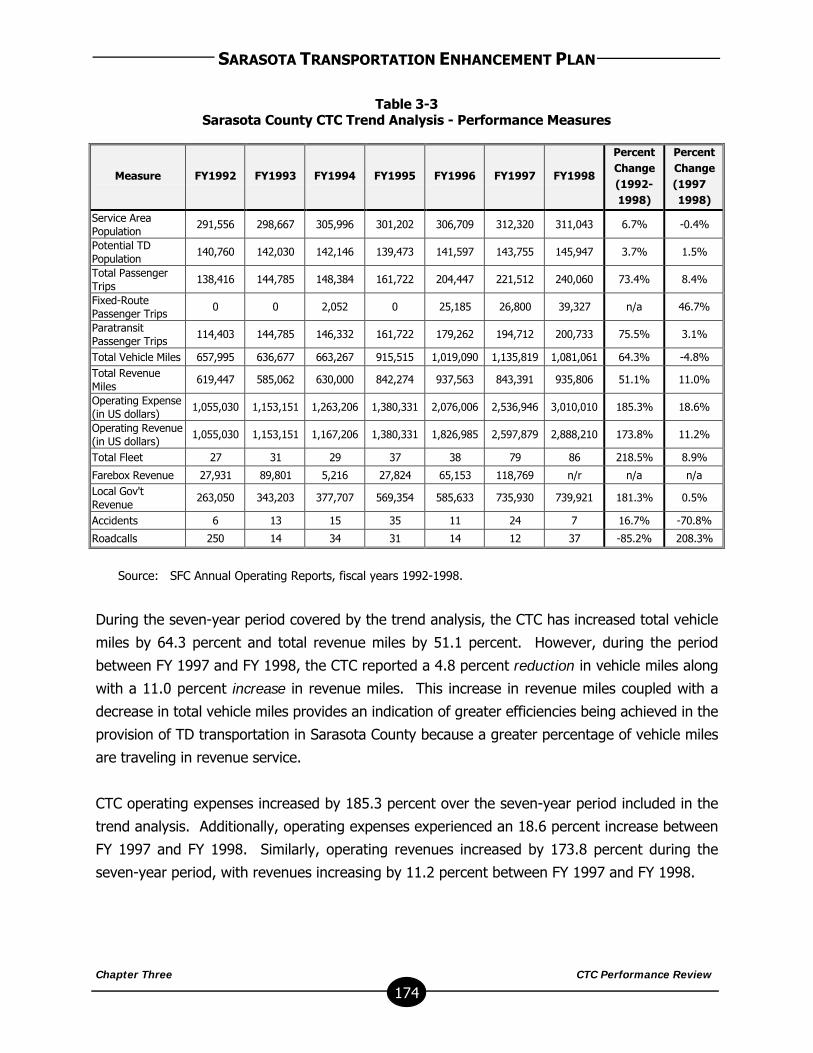
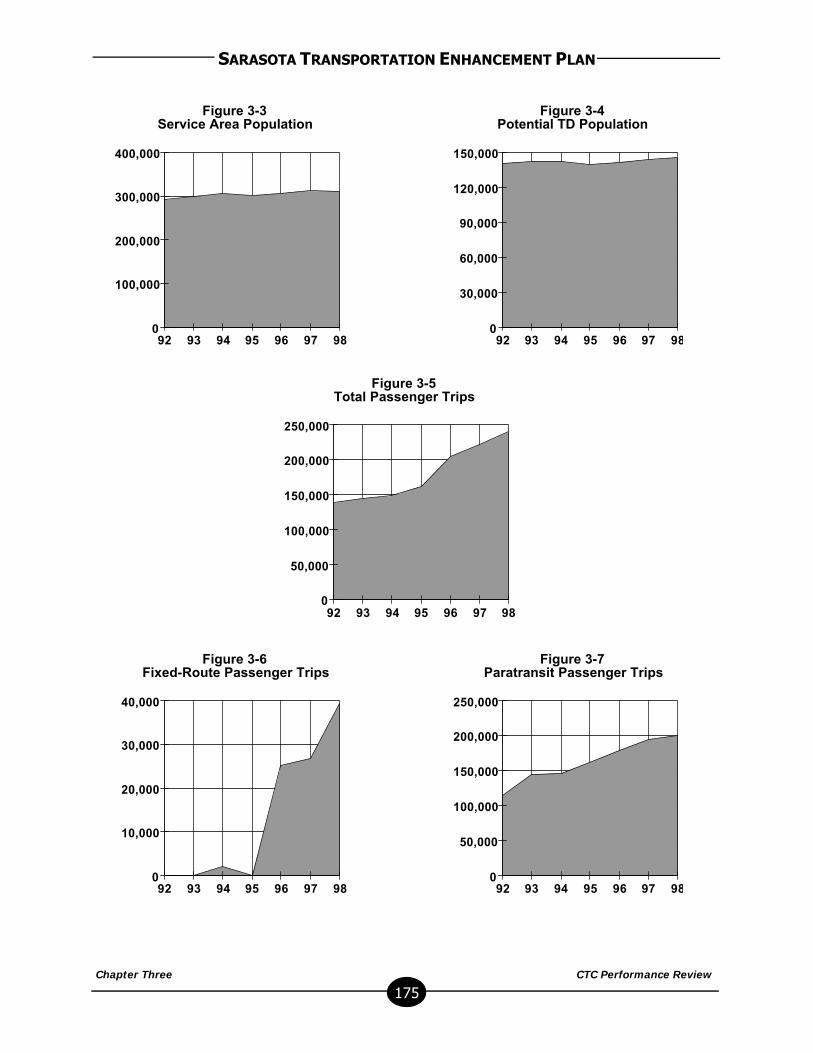
Shown in Table 3-3 and Figures 3-3 through 3-16 are 14 performance measures for SFC in its
capacity of CTC for Sarasota County. The results of the trend analysis indicate that the Sarasota
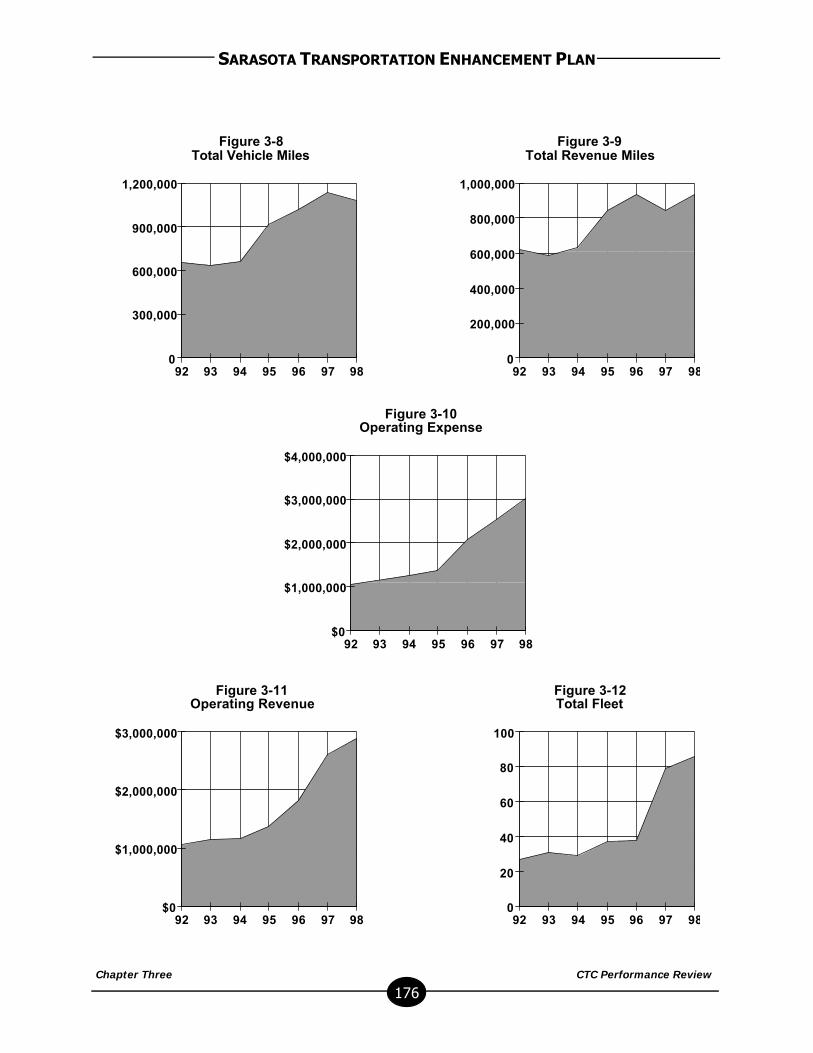
County CTC has experienced significant growth over the past seven years. During the seven-
year period covered by the trend analysis, the CTC increased the size of the available vehicle
fleet for the TD program by 218.5 percent, from 27 vehicles to 86 vehicles. The CTC has also
consistently increased the number of passenger trips delivered to TD customers, with a 73.4
percent growth over the past seven years. However, growth has slowed somewhat during
recent years with an 8.4 percent increase in total passenger trips between FY 1997 and FY
1998. Total paratransit trips also experienced an overall increase of 75.5 percent during the
seven-year period, as well as a 3.1 percent increase between FY 1997 and FY 1998. SFC has
successfully increased the number of TD trips that are provided on the SCAT fixed-route system.
Between FY 1997 and FY 1998, the number of fixed-route trips provided to TD passengers
increased by 46.7 percent.
SARASOTA TRANSPORTATION ENHANCEMENT PLAN
Chapter Three CTC Performance Review
174
Table 3-3Sarasota County CTC Trend Analysis - Performance Measures
Measure FY1992 FY1993 FY1994 FY1995 FY1996 FY1997 FY1998
PercentChange(1992-1998)
PercentChange(1997 –1998)
Service AreaPopulation
291,556 298,667 305,996 301,202 306,709 312,320 311,043 6.7% -0.4%
Potential TDPopulation
140,760 142,030 142,146 139,473 141,597 143,755 145,947 3.7% 1.5%
Total PassengerTrips
138,416 144,785 148,384 161,722 204,447 221,512 240,060 73.4% 8.4%
Fixed-RoutePassenger Trips
0 0 2,052 0 25,185 26,800 39,327 n/a 46.7%
ParatransitPassenger Trips
114,403 144,785 146,332 161,722 179,262 194,712 200,733 75.5% 3.1%
Total Vehicle Miles 657,995 636,677 663,267 915,515 1,019,090 1,135,819 1,081,061 64.3% -4.8%Total RevenueMiles
619,447 585,062 630,000 842,274 937,563 843,391 935,806 51.1% 11.0%
Operating Expense(in US dollars)
1,055,030 1,153,151 1,263,206 1,380,331 2,076,006 2,536,946 3,010,010 185.3% 18.6%
Operating Revenue(in US dollars)
1,055,030 1,153,151 1,167,206 1,380,331 1,826,985 2,597,879 2,888,210 173.8% 11.2%
Total Fleet 27 31 29 37 38 79 86 218.5% 8.9%
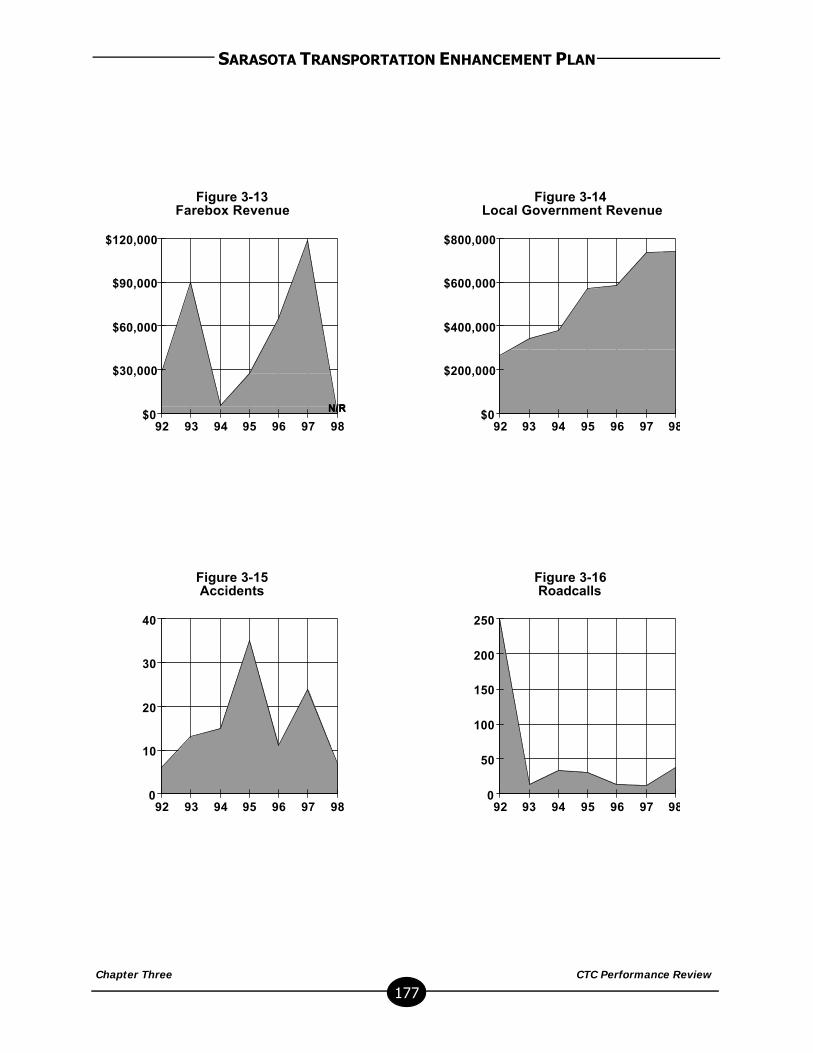
Farebox Revenue 27,931 89,801 5,216 27,824 65,153 118,769 n/r n/a n/aLocal Gov'tRevenue
263,050 343,203 377,707 569,354 585,633 735,930 739,921 181.3% 0.5%
Accidents 6 13 15 35 11 24 7 16.7% -70.8%
Roadcalls 250 14 34 31 14 12 37 -85.2% 208.3%
Source: SFC Annual Operating Reports, fiscal years 1992-1998.
During the seven-year period covered by the trend analysis, the CTC has increased total vehicle
miles by 64.3 percent and total revenue miles by 51.1 percent. However, during the period
between FY 1997 and FY 1998, the CTC reported a 4.8 percent reduction in vehicle miles along
with a 11.0 percent increase in revenue miles. This increase in revenue miles coupled with a
decrease in total vehicle miles provides an indication of greater efficiencies being achieved in the
provision of TD transportation in Sarasota County because a greater percentage of vehicle miles
are traveling in revenue service.
CTC operating expenses increased by 185.3 percent over the seven-year period included in the
trend analysis. Additionally, operating expenses experienced an 18.6 percent increase between
FY 1997 and FY 1998. Similarly, operating revenues increased by 173.8 percent during the
seven-year period, with revenues increasing by 11.2 percent between FY 1997 and FY 1998.
SARASOTA TRANSPORTATION ENHANCEMENT PLAN
Chapter Three CTC Performance Review
175
92 93 94 95 96 97 980
100,000
200,000
300,000
400,000
92 93 94 95 96 97 980
30,000
60,000
90,000
120,000
150,000
92 93 94 95 96 97 980
10,000
20,000
30,000
40,000
92 93 94 95 96 97 980
50,000
100,000
150,000
200,000
250,000
92 93 94 95 96 97 980
50,000
100,000
150,000
200,000
250,000
Figure 3-3Service Area Population
Figure 3-4Potential TD Population
Figure 3-5Total Passenger Trips
Figure 3-6Fixed-Route Passenger Trips
Figure 3-7Paratransit Passenger Trips
SARASOTA TRANSPORTATION ENHANCEMENT PLAN
Chapter Three CTC Performance Review
176
92 93 94 95 96 97 980
300,000
600,000
900,000
1,200,000
92 93 94 95 96 97 980
200,000
400,000
600,000
800,000
1,000,000
92 93 94 95 96 97 98$0
$1,000,000
$2,000,000
$3,000,000
92 93 94 95 96 97 980
20
40
60
80
100
92 93 94 95 96 97 98$0
$1,000,000
$2,000,000
$3,000,000
$4,000,000
Figure 3-8Total Vehicle Miles
Figure 3-9Total Revenue Miles
Figure 3-10Operating Expense
Figure 3-11Operating Revenue
Figure 3-12Total Fleet
SARASOTA TRANSPORTATION ENHANCEMENT PLAN
Chapter Three CTC Performance Review
177
92 93 94 95 96 97 98$0
$30,000
$60,000
$90,000
$120,000
92 93 94 95 96 97 98$0
$200,000
$400,000
$600,000
$800,000
92 93 94 95 96 97 980
10
20
30
40
92 93 94 95 96 97 980
50
100
150
200
250
N/RN/R
Figure 3-13Farebox Revenue
Figure 3-14Local Government Revenue
Figure 3-15Accidents
Figure 3-16Roadcalls

SARASOTA TRANSPORTATION ENHANCEMENT PLAN
Chapter Three CTC Performance Review
178
Effectiveness Measures
Table 3-4 and Figures 3-17 through 3-26 contain trend information for ten effectiveness
measures calculated for the Sarasota County CTC. The data show significant growth over the
seven-year period (58.5 percent) for the average number of vehicle miles traveled per PotentialTD customer (from 4.67 miles to 7.41 miles). However, a review of the data contained in Table3-4 and Figure 3-17 reveal that the number of vehicle miles traveled per TD customer actuallydecreased between FY 1997 and FY 1998 by 6.3 percent. The number of total passenger tripsper Potential TD customers increased during the seven-year period by 67.3 percent, and thenumber of paratransit trips per Potential TD customers also increased by 69.2 percent. Theserelationships are illustrated in Figures 3-20 and 3-21. Both the number of passenger trips perTD customer and paratransit passenger trips per TD customer show increases (6.7 percent and1.5 percent, respectively) between FY 1997 and FY 1998. Slow growth in terms of the numberof paratransit trips per TD customer may be related to a steady increase in the number of TDtrips provided on the SCAT fixed-route system (see Table 3-3 and Figure 3-6).
Table 3-4CTC Trend Analysis - Effectiveness Measures
Measure FY1992 FY1993 FY1994 FY1995 FY1996 FY1997 FY1998
PercentChange(1992-1998)
PercentChange(1997 –1998)
Vehicle Miles perTD Capita
4.67 4.48 4.67 6.56 7.20 7.90 7.41 58.5% -6.3%
Vehicle Miles perParatransitPassenger Trip
5.75 4.40 4.53 5.66 5.68 5.83 5.39 -6.4% -7.7%
Vehicle Miles perPass Trip
4.75 4.40 4.47 5.66 4.98 5.13 4.50 -5.3% -12.2%
Pass Trips perTD Capita
0.98 1.02 1.04 1.16 1.44 1.54 1.64 67.3% 6.7%
Paratransit PassTrip per TDCapita
0.81 1.02 1.03 1.16 1.27 1.35 1.38 69.2% 1.5%
Pass Trips perVehicle Mile
0.21 0.23 0.22 0.18 0.20 0.20 0.22 5.6% 13.9%
Paratransit PassTrips per Veh.Mile
0.17 0.23 0.22 0.18 0.18 0.17 0.19 6.8% 8.3%
Average Age ofFleet
7.5 6.0 4.5 6.0 5.0 n/r n/r n/a n/a
Accidents per100,000 Vehiclemiles
0.91 2.04 2.26 4.00 1.08 2.11 0.64 -29.7% -69.7%
Vehicle MilesbetweenRoadcalls
2,632 45,477 19,508 29,533 72,792 94,652 29,218 1010.1% -69.1%
Source: SFC Annual Operating Reports, fiscal years 1992-1998.

SARASOTA TRANSPORTATION ENHANCEMENT PLAN
Chapter Three CTC Performance Review
179

SARASOTA TRANSPORTATION ENHANCEMENT PLAN
Chapter Three CTC Performance Review
180
92 93 94 95 96 97 980.0
2.0
4.0
6.0
8.0
92 93 94 95 96 97 980.0
2.0
4.0
6.0
92 93 94 95 96 97 980.0
0.4
0.8
1.2
1.6
2.0
92 93 94 95 96 97 980.0
0.3
0.6
0.9
1.2
1.5
92 93 94 95 96 97 980.0
2.0
4.0
6.0
Figure 3-17Vehicle Miles per TD Capita
Figure 3-18Vehicle Miles per Paratransit
Passenger Trip
Figure 3-19Vehicle Miles per Passenger Trip
Figure 3-20Passenger Trips per TD Capita
Figure 3-21Paratransit Passenger Trips per
TD Capita
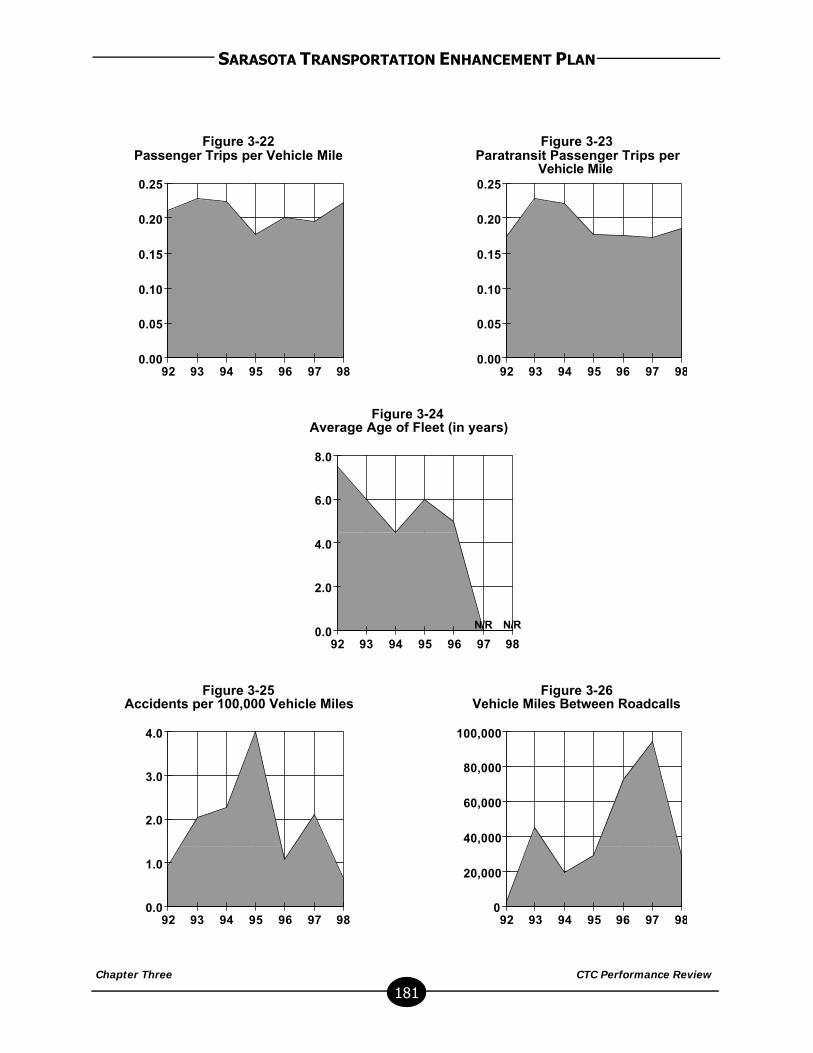
SARASOTA TRANSPORTATION ENHANCEMENT PLAN
Chapter Three CTC Performance Review
181
92 93 94 95 96 97 980.00
0.05
0.10
0.15
0.20
0.25
92 93 94 95 96 97 980.00
0.05
0.10
0.15
0.20
0.25
92 93 94 95 96 97 980.0
1.0
2.0
3.0
4.0
92 93 94 95 96 97 980
20,000
40,000
60,000
80,000
100,000
92 93 94 95 96 97 980.0
2.0
4.0
6.0
8.0
N/R N/R
Figure 3-22Passenger Trips per Vehicle Mile
Figure 3-23Paratransit Passenger Trips per
Vehicle Mile
Figure 3-24Average Age of Fleet (in years)
Figure 3-25Accidents per 100,000 Vehicle Miles
Figure 3-26Vehicle Miles Between Roadcalls
SARASOTA TRANSPORTATION ENHANCEMENT PLAN
Chapter Three CTC Performance Review
182
As illustrated in Figure 3-22 and Figure 3-23, both total passenger trips per vehicle mile and
total paratransit passenger trips per vehicle mile have increased over the seven-year period (5.6
percent and 6.8 percent, respectively). Between FY 1997 and FY 1998, total passenger trips
per vehicle mile increased by 13.9 percent and total paratransit passenger trips per vehicle
mile increased by 8.3 percent. The increases experienced in these measures have been rathersignificant and may be attributed, in part, to decreases in the average length of passenger tripsin Sarasota County, increased use of the fixed-route system by TD customers, and increasedmulti-loading of paratransit trips. This is also suggested by the measures related to vehiclemiles per total passenger trip and vehicle miles per paratransit passenger trip. As shown inFigures 3-19 and 3-18, these effectiveness measures decreased over the seven-year period (5.3percent and 6.4 percent, respectively). Between FY 1997 and FY 1998, vehicle miles perpassenger trip decreased by 12.2 percent and vehicle miles per paratransit passenger tripdeclined by 7.7 percent.
The average number of vehicle miles traveled between roadcalls experienced a significant
increase of 1010.1 percent over the seven-year period, as shown in Figure 3-26. However, this
measure decreased by nearly 70 percent between FY 1997 and FY 1998. The CTC reports that
this measure is being reported more accurately now than in the past. The change in reporting
suggested by the CTC is consistent with the experiences of CTCs throughout the state that have
reported differing interpretations of what is considered a “roadcall” by CTCs and the Florida
Commission for the Transportation Disadvantaged (FCTD). However, this measure does
suggest the need for further analysis to definitively determine the cause(s) for the decrease in
the number of miles traveled between roadcalls in the last fiscal year. The CTC has experienced
a significant decrease of 29.7 percent in the number of accidents per 100,000 vehicle miles
traveled between FY 1992 and FY 1998 (see Figure 3-25). This measure also decreased by
69.7 percent between FY 1997 and FY 1998. The cause of this dramatic decrease in accident
occurrences is most likely the result of clarification regarding the type of incident the FCTD
defines as an accident. SFC has indicated that all incidents have been reported as accidents in
the past. According to FCTD Annual Operating Report definitions, only accidents resulting in
over $1000.00 damages should be reported as an accident. Given this definition, the number of
“accidents” experienced by the CTC in FY 1998 experienced a dramatic decline from previous
years.
Efficiency Measures
The final area examined in the trend analysis for the CTC is the area of system efficiency. The
measures included in Table 3-5 and illustrated graphically in Figures 3-27 through 3-31 are
intended to provide a picture of how efficiently SFC, in its role as CTC, is providing service to the

SARASOTA TRANSPORTATION ENHANCEMENT PLAN
Chapter Three CTC Performance Review
183
TD population in Sarasota County. Most of the efficiency measures related to operating
expenses show modest increases during the analysis period. As shown in Figure 3-27,
operating expenses per total passenger trips increased by 64.5 percent during the seven-year
period and by 9.5 percent between FY 1997 and FY 1998. The data pertaining to operating
expense per paratransit passenger trip (see Figure 3-28) show a similar increase of 62.6 percent
between FY 1992 and FY 1998. This measure increased by 15.1 percent between FY 1997 and
FY 1998. Finally, operating expense per vehicle mile traveled grew by nearly 74 percent over
the seven-year period included in the trend analysis. More significantly, this measure increased
by 24.7 percent between FY 1997 and FY 1998. This relationship is illustrated in Figure 3-29.
Table 3-5CTC Trend Analysis -Efficiency Measures
Measure FY1992 FY1993 FY1994 FY1995 FY1996 FY1997 FY1998
PercentChange(1992-1998)
PercentChange(1997 –1998)
Op Expense perPass Trip
7.62 7.96 8.51 8.54 10.15 11.45 12.54 64.5% 9.5%
Op Expense perParatransitPass Trip
9.22 7.96 8.63 8.54 11.58 13.03 15.00 62.6% 15.1%
Op Expense perVehicle Mile
1.60 1.81 1.90 1.51 2.04 2.23 2.78 73.7% 24.7%
Farebox Ratio 2.6% 7.8% 0.4% 2.0% 3.1% 4.7% n/a n/a n/a
LocalGovernmentRevenue Ratio
24.9% 29.8% 29.9% 41.2% 28.2% 29.0% 24.6% -1.4% -15.3%
Source: SFC Annual Operating Reports, fiscal years 1992-1998.
The increases in operating expenses experienced by the CTC may be partially explained by
several operational changes that have occurred as a result of the growth and centralization of
Senior Friendship Center, Inc. in its role as the Sarasota County CTC. The CTC recently moved
into the SCAT operations building in order to increase the level of integration between fixed-
route bus service and paratransit services in terms of planning, scheduling, and service delivery.
However, the CTC’s operational costs have risen as a result of increased expenses associated
with the move. In addition, the CTC reports that more TD trips were purchased through
contract providers during the past fiscal year than in previous years. Trips purchased through
contract providers, rather than provided in SFC vehicles, have raised operational costs because
most of the contract providers do not have large vehicles capable of multi-loading passengers.
As a result, more individual trips than group trips were provided to TD customers. In addition,
the CTC began providing stretcher trips during the last fiscal year, which tend to be particularly

SARASOTA TRANSPORTATION ENHANCEMENT PLAN
Chapter Three CTC Performance Review
184
92 93 94 95 96 97 98$0.00
$3.00
$6.00
$9.00
$12.00
$15.00
92 93 94 95 96 97 98$0.00
$3.00
$6.00
$9.00
$12.00
$15.00
92 93 94 95 96 97 980%
2%
4%
6%
8%
92 93 94 95 96 97 980%
10%
20%
30%
40%
50%
92 93 94 95 96 97 98$0.00
$1.00
$2.00
$3.00
N/R
Figure 3-27Operating Expense per
Passenger Trip
Figure 3-28Operating Expense per Paratransit
Passenger Trip
Figure 3-29Operating Expense per
Vehicle Mile
Figure 3-30Farebox Ratio
Figure 3-31Local Government Revenue Ratio

SARASOTA TRANSPORTATION ENHANCEMENT PLAN
Chapter Three CTC Performance Review
185
expensive due to the high level of care required in the provision of service. Finally, the increase
in operational costs illustrated in Table 3-5 and Figures 3-27 through 3-29 may be related to
inaccurate reporting by contract providers and agencies with coordination agreements with the
CTC. These data represent system-wide data and may be skewed by agencies that are unable
to accurately delineate transportation costs from overall agency operational costs.
The final measures evaluated in the CTC trend analysis relate to revenue sources for the
Sarasota TD program. The CTC has increased the amount of revenue collected in the form of
passenger fares. As illustrated in Figure 3-30, the portion of operating expenses recovered from
the collection of passenger fares increased by 325.2 percent between FY 1992 and FY 1997
(this measure was not reported for FY 1998). The percentage of operating expenses covered
by revenues collected from local government contributions to the system decreased by 1.4
percent over the seven-year trend analysis period, as shown in Figure 3-31. However, that
percentage decreased by a full 15.3 percent between FY 1997 and FY 1998. As illustrated in
Table 3-5, although the amount of revenue contributed to the Sarasota TD program by local
government sources increased by only 0.5 percent between FY 1997 and FY 1998, CTC
operating expenses increased by a full 18.6 percent during the same reporting period.
Conclusions
This concluding section summarizes the results of the CTC trend analysis for SFC. A summary of
SFC’s performance strengths and weaknesses based on effectiveness and efficiency measures
are provided in Table 3-6. The intent of showing this information is not to suggest the extent of
the strength or weakness but to identify those performance areas where SFC’s performance has
improved or declined from FY 1992 through FY 1998. With regard to the trend analysis, a
performance strength is defined as any performance area that improved or was maintained over
the trend analysis time period and a performance weakness is defined as a trend that declined
over the trend analysis time period.
Table 3-6SFC Performance Strengths and Weaknesses, Trend Analysis
Performance Strengths Performance Weaknesses
Vehicle Miles per TD Capita Vehicle Miles between RoadcallsPassenger trips per TD Capita Operating Expense per Passenger Trip
Paratransit Passenger Trips per TD Capita Operating Expense per Paratransit Pass.Trip
Passenger Trips per Vehicle Mile Operating Expense per Vehicle MileParatransit Passenger Trips per Vehicle Local Government Revenue Ratio

SARASOTA TRANSPORTATION ENHANCEMENT PLAN
Chapter Three CTC Performance Review
186
MileAccidents per 100,000 Vehicle Miles
As illustrated in Table 3-6, SFC has experienced significant improvements in most effectiveness
measures related to the number of trips provided through the Sarasota TD program. The CTC
has consistently increased the number of trips provided to TD customers, as well as improving
efficiencies through effective multi-loading of paratransit trips. However, the cost of providing
TD trips has consistently increased over the past seven fiscal years. Escalating costs may be
partially related to operational changes experienced by the CTC during previous fiscal years. In
addition, reporting inconsistencies among agencies that have coordination agreements with the
CTC may contribute to the appearance of inflated operating costs. However, the CTC should
continue to monitor expenses, while also pursuing strategies that will help encourage more
accurate reporting practices among agencies. Finally, the CTC should conduct further analysis
into the areas of vehicle miles traveled between roadcalls. The data for these performance
measures suggest that the CTC’s system safety and reliability may be declining.
This section has presented a trend analysis of the Sarasota County CTC covering fiscal years
1992 through 1998. A CTC peer group analysis was also completed as part of the performance
evaluation of the Sarasota County CTC in order to compare SFC’s performance with the
performances of similar CTCs throughout the State. The CTC peer group analysis is presented
in the following sections.
CTC Peer Group Analysis
In addition to the required fixed-route peer review performed as part of the Sarasota
Transportation Enhancement Plan (STEP), a paratransit service peer review analysis for FY 1998
was also conducted to compare the performance of Sarasota’s TD paratransit program against
that of similar CTCs in Florida. A paratransit peer group analysis is important because it
provides a comparison of how well the CTC in Sarasota County (Senior Friendship Centers, Inc.)
is performing relative to similar CTCs within Florida and, second, it helps to establish realistic
performance standards for the evaluation process. The five Florida peer CTCs included in the
analysis are shown in Table 3-7 and include Charlotte, Escambia, Lee, Manatee, and Pasco
counties. Each system is described in further detail in the following section. The five systems
were chosen because they are somewhat similar to the Sarasota County CTC1 in terms of the
1 The Charlotte County CTC does not represent a typical peer CTC for Sarasota County. Both total countypopulation (131,307) and Potential TD population (74, 813) are significantly smaller than Sarasota County. Inaddition, the Charlotte County CTC provided over 100,000 fewer TD trips in FY 1998 than the CTC in Sarasota
SARASOTA TRANSPORTATION ENHANCEMENT PLAN
Chapter Three CTC Performance Review
187
following five key elements: demographic characteristics, system size (measured in terms of
annual TD ridership), operating environment (urban or rural service area designation),
organization type (transit agency, government, private non-profit, or private for-profit), and
network type (sole provider, partial brokerage, or complete brokerage).
The charts presented in this section summarize selected performance measures, effectiveness
measures, and efficiency measures for the various CTCs considered for this review. Each
performance measure is depicted in a bar chart to enhance the overall comparison. Detailed
information for each of the peer CTCs is included in Appendix K. All performance statistics for
the CTC peer group systems were obtained from the FCTD’s 1998 DRAFT Annual Performance
Report, which contains a compilation of the Annual Operating Reports submitted to the FCTD
for FY 1998 by each local CTC.
According to the Evaluation Workbook for Community Transportation Coordinators and Providers
in Florida, prepared by CUTR, the Sarasota County CTC is categorized as a "size 5" system
(200,000 - 749,999 annual one-way passenger trips) that operates in an urban service area
(contains an urbanized area, with a population of more than 50,000), is organized as a private
non-profit entity, and coordinates TD trips as a partial brokerage (provides some TD trips and
brokers out the remainder to contract providers within the coordinated system).
Table 3-7Sarasota County CTC System Peers
Service Area Community Transportation Coordinator
Charlotte County Charlotte County Transit Department
Escambia County Intelitran
Lee County COMSIS Mobility Services, Inc.
Manatee County Manatee Board of County Commissioners
Pasco County Pasco County Public Transportation Department
Descriptions of CTC Peer Systems
Charlotte County
Charlotte County is located in West Central Florida, south of adjacent to Sarasota County, and
has a population of 131,307. The 1998 Potential TD Population was estimated to be 74,813.
The Charlotte County Transit Department serves as the CTC for this urban operating
County. However, the Charlotte County CTC has been included in the peer group analysis in order to better

SARASOTA TRANSPORTATION ENHANCEMENT PLAN
Chapter Three CTC Performance Review
188
environment. The CTC is a government entity and acts as a partial broker of TD transportation.
The CTC provided 124,745 trips during FY 1998.
Escambia County
Escambia County is located in the far western coastal area of Florida’s Panhandle. This urban
operating environment has a total population of 291,135 persons and a 1998 Potential TD
Population of 105,277. Intelitran, Inc. serves as the CTC for Escambia County. The CTC is a
private for-profit agency and acts as a complete brokerage of TD transportation. The CTC
provided 495,676 trips during FY 1998.
Lee County
Lee County is located in Southwest Florida, adjacent to Charlotte County. The County has a
total population of 394,344 and a 1998 estimated Potential TD Population of 171,490. COMSIS
Mobility Services, Inc., a private for-profit agency, serves as the CTC for this urban operating
environment and acts as a complete brokerage of TD transportation. The CTC provided
205,483 trips in FY 1998.
Manatee County
Manatee County is located in West Central Florida, north of and adjacent to Sarasota County.
The County has a total population of 241,422 persons and an estimated 1998 Potential TD
population of 111,062. The Manatee Board of County Commissioners serves as the CTC for this
urban operating environment and acts as a partial brokerage of TD transportation. The CTC
provided 426,981 trips during FY 1998.
Pasco County
Pasco County is located in Central Florida and has a total population of 315,785 persons. The
1998 Potential TD Population was estimated to be 168,877 persons. Pasco County Public
Transportation serves as the CTC for Pasco County. The government entity operates a partial
brokerage of TD transportation in this urban operating environment. The CTC provided 255,330
trips during FY 1998.
understand the characteristics of the areas that surround Sarasota County.
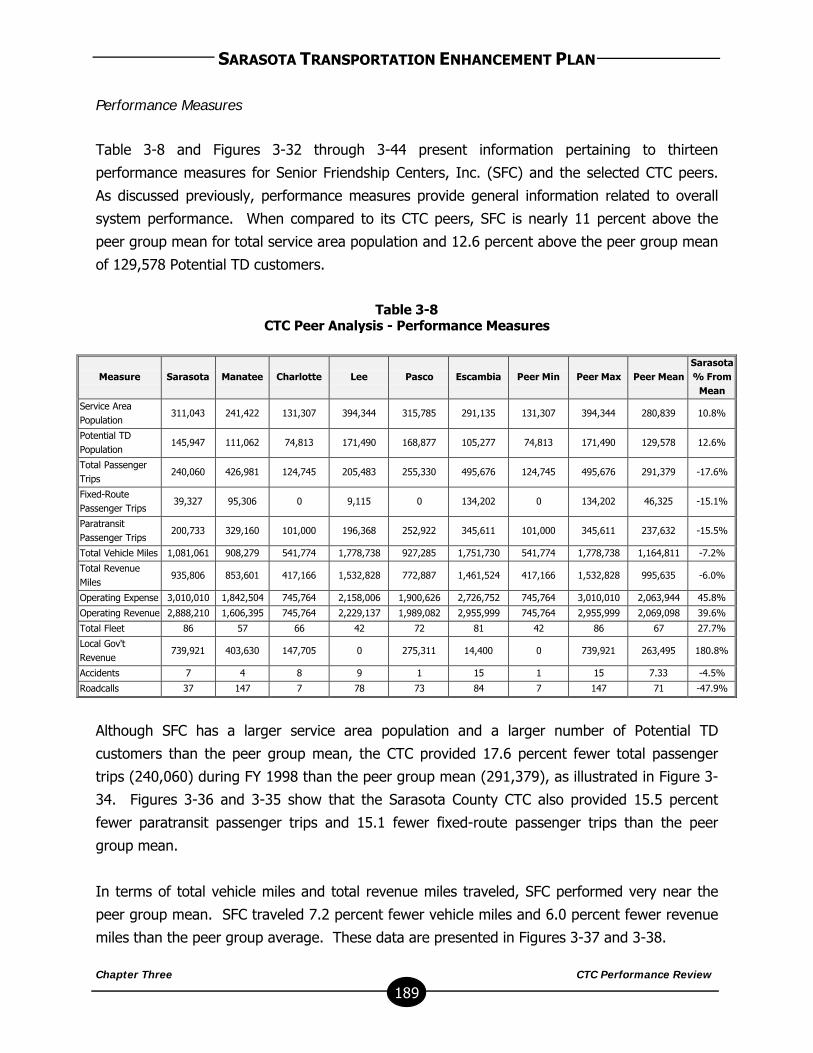
SARASOTA TRANSPORTATION ENHANCEMENT PLAN
Chapter Three CTC Performance Review
189
Performance Measures
Table 3-8 and Figures 3-32 through 3-44 present information pertaining to thirteen
performance measures for Senior Friendship Centers, Inc. (SFC) and the selected CTC peers.
As discussed previously, performance measures provide general information related to overall
system performance. When compared to its CTC peers, SFC is nearly 11 percent above the
peer group mean for total service area population and 12.6 percent above the peer group mean
of 129,578 Potential TD customers.
Table 3-8CTC Peer Analysis - Performance Measures
Measure Sarasota Manatee Charlotte Lee Pasco Escambia Peer Min Peer Max Peer MeanSarasota% From
Mean
Service AreaPopulation
311,043 241,422 131,307 394,344 315,785 291,135 131,307 394,344 280,839 10.8%
Potential TDPopulation
145,947 111,062 74,813 171,490 168,877 105,277 74,813 171,490 129,578 12.6%
Total PassengerTrips
240,060 426,981 124,745 205,483 255,330 495,676 124,745 495,676 291,379 -17.6%
Fixed-RoutePassenger Trips
39,327 95,306 0 9,115 0 134,202 0 134,202 46,325 -15.1%
ParatransitPassenger Trips
200,733 329,160 101,000 196,368 252,922 345,611 101,000 345,611 237,632 -15.5%
Total Vehicle Miles 1,081,061 908,279 541,774 1,778,738 927,285 1,751,730 541,774 1,778,738 1,164,811 -7.2%
Total RevenueMiles
935,806 853,601 417,166 1,532,828 772,887 1,461,524 417,166 1,532,828 995,635 -6.0%
Operating Expense 3,010,010 1,842,504 745,764 2,158,006 1,900,626 2,726,752 745,764 3,010,010 2,063,944 45.8%
Operating Revenue 2,888,210 1,606,395 745,764 2,229,137 1,989,082 2,955,999 745,764 2,955,999 2,069,098 39.6%
Total Fleet 86 57 66 42 72 81 42 86 67 27.7%
Local Gov'tRevenue
739,921 403,630 147,705 0 275,311 14,400 0 739,921 263,495 180.8%
Accidents 7 4 8 9 1 15 1 15 7.33 -4.5%
Roadcalls 37 147 7 78 73 84 7 147 71 -47.9%
Although SFC has a larger service area population and a larger number of Potential TD
customers than the peer group mean, the CTC provided 17.6 percent fewer total passenger
trips (240,060) during FY 1998 than the peer group mean (291,379), as illustrated in Figure 3-
34. Figures 3-36 and 3-35 show that the Sarasota County CTC also provided 15.5 percent
fewer paratransit passenger trips and 15.1 fewer fixed-route passenger trips than the peer
group mean.
In terms of total vehicle miles and total revenue miles traveled, SFC performed very near the
peer group mean. SFC traveled 7.2 percent fewer vehicle miles and 6.0 percent fewer revenue
miles than the peer group average. These data are presented in Figures 3-37 and 3-38.
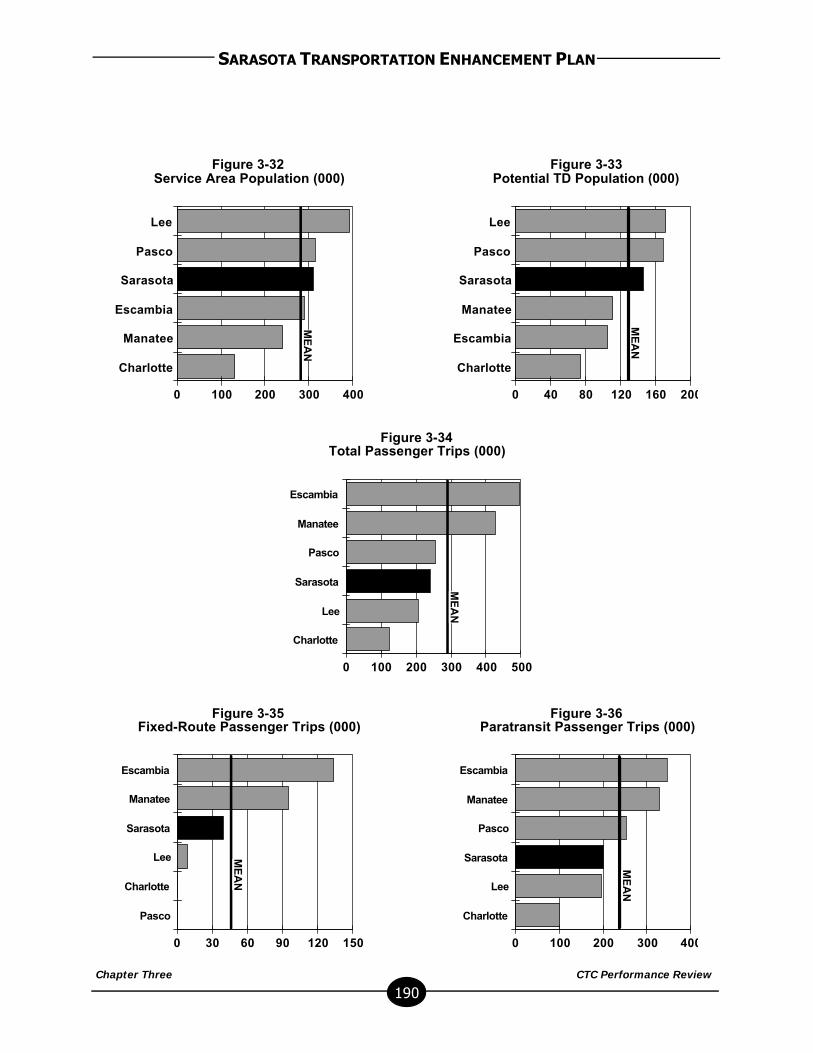
SARASOTA TRANSPORTATION ENHANCEMENT PLAN
Chapter Three CTC Performance Review
190
Lee
Pasco
Sarasota
Escambia
Manatee
Charlotte
0 100 200 300 400
Lee
Pasco
Sarasota
Manatee
Escambia
Charlotte
0 40 80 120 160 200
Escambia
Manatee
Sarasota
Lee
Charlotte
Pasco
0 30 60 90 120 150
Escambia
Manatee
Pasco
Sarasota
Lee
Charlotte
0 100 200 300 400
Escambia
Manatee
Pasco
Sarasota
Lee
Charlotte
0 100 200 300 400 500
ME
AN
ME
AN
ME
AN
ME
AN
ME
AN
Figure 3-32Service Area Population (000)
Figure 3-33Potential TD Population (000)
Figure 3-34Total Passenger Trips (000)
Figure 3-35Fixed-Route Passenger Trips (000)
Figure 3-36Paratransit Passenger Trips (000)

SARASOTA TRANSPORTATION ENHANCEMENT PLAN
Chapter Three CTC Performance Review
191
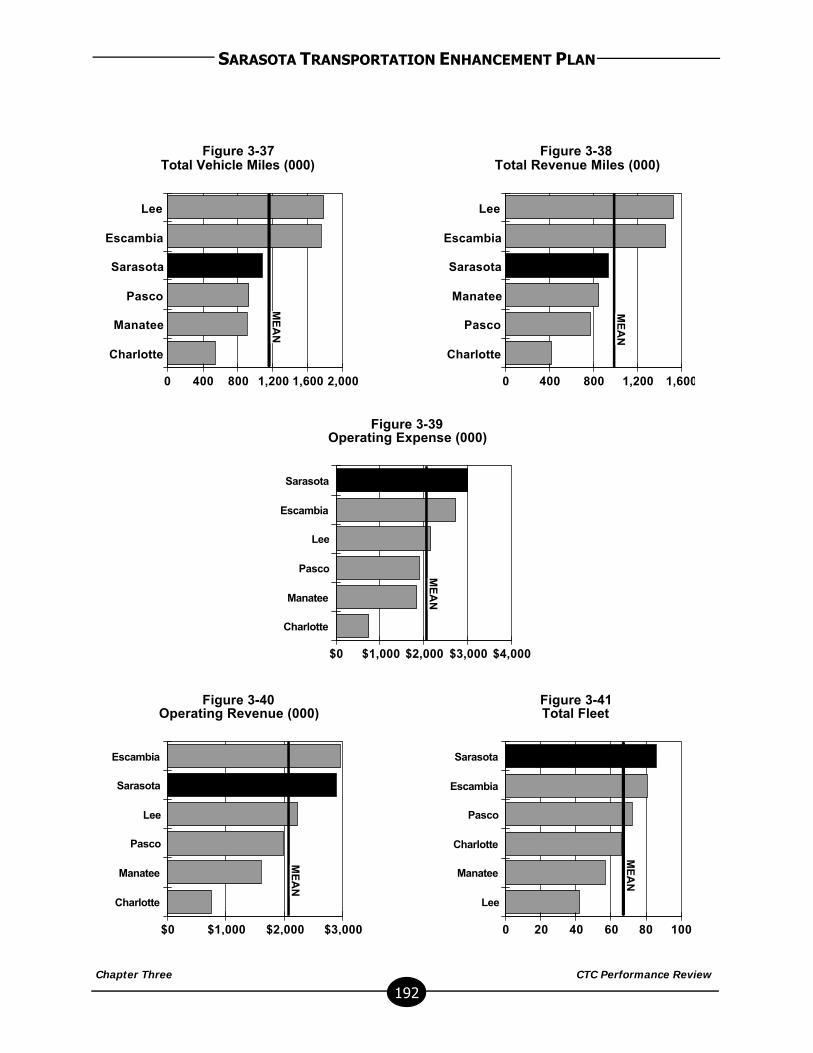
SARASOTA TRANSPORTATION ENHANCEMENT PLAN
Chapter Three CTC Performance Review
192
Lee
Escambia
Sarasota
Pasco
Manatee
Charlotte
0 400 800 1,200 1,600 2,000
Lee
Escambia
Sarasota
Manatee
Pasco
Charlotte
0 400 800 1,200 1,600
Escambia
Sarasota
Lee
Pasco
Manatee
Charlotte
$0 $1,000 $2,000 $3,000
Sarasota
Escambia
Pasco
Charlotte
Manatee
Lee
0 20 40 60 80 100
Sarasota
Escambia
Lee
Pasco
Manatee
Charlotte
$0 $1,000 $2,000 $3,000 $4,000
ME
AN
ME
AN
ME
AN
ME
AN
ME
AN
Figure 3-37Total Vehicle Miles (000)
Figure 3-38Total Revenue Miles (000)
Figure 3-39Operating Expense (000)
Figure 3-40Operating Revenue (000)
Figure 3-41Total Fleet
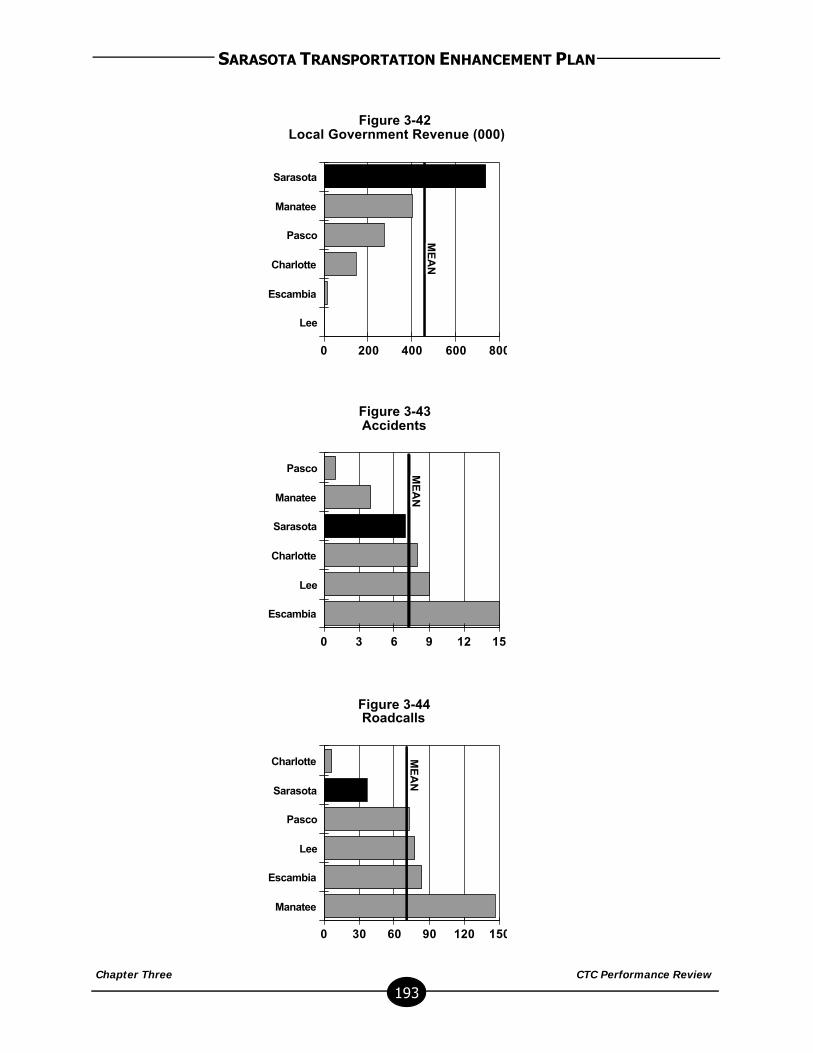
SARASOTA TRANSPORTATION ENHANCEMENT PLAN
Chapter Three CTC Performance Review
193
Sarasota
Manatee
Pasco
Charlotte
Escambia
Lee
0 200 400 600 800
Charlotte
Sarasota
Pasco
Lee
Escambia
Manatee
0 30 60 90 120 150
Pasco
Manatee
Sarasota
Charlotte
Lee
Escambia
0 3 6 9 12 15
ME
AN
ME
AN
ME
AN
Figure 3-42Local Government Revenue (000)
Figure 3-43Accidents
Figure 3-44Roadcalls
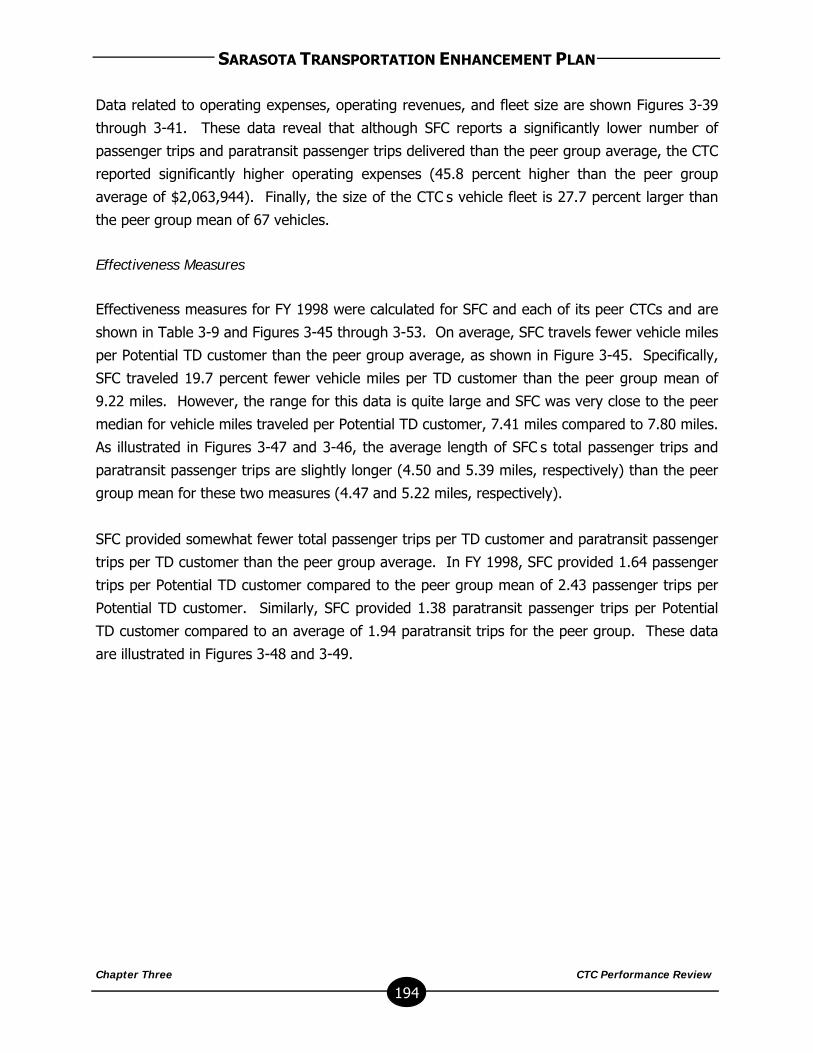
SARASOTA TRANSPORTATION ENHANCEMENT PLAN
Chapter Three CTC Performance Review
194
Data related to operating expenses, operating revenues, and fleet size are shown Figures 3-39
through 3-41. These data reveal that although SFC reports a significantly lower number of
passenger trips and paratransit passenger trips delivered than the peer group average, the CTC
reported significantly higher operating expenses (45.8 percent higher than the peer group
average of $2,063,944). Finally, the size of the CTC’s vehicle fleet is 27.7 percent larger than
the peer group mean of 67 vehicles.
Effectiveness Measures
Effectiveness measures for FY 1998 were calculated for SFC and each of its peer CTCs and are
shown in Table 3-9 and Figures 3-45 through 3-53. On average, SFC travels fewer vehicle miles
per Potential TD customer than the peer group average, as shown in Figure 3-45. Specifically,
SFC traveled 19.7 percent fewer vehicle miles per TD customer than the peer group mean of
9.22 miles. However, the range for this data is quite large and SFC was very close to the peer
median for vehicle miles traveled per Potential TD customer, 7.41 miles compared to 7.80 miles.
As illustrated in Figures 3-47 and 3-46, the average length of SFC’s total passenger trips and
paratransit passenger trips are slightly longer (4.50 and 5.39 miles, respectively) than the peer
group mean for these two measures (4.47 and 5.22 miles, respectively).
SFC provided somewhat fewer total passenger trips per TD customer and paratransit passenger
trips per TD customer than the peer group average. In FY 1998, SFC provided 1.64 passenger
trips per Potential TD customer compared to the peer group mean of 2.43 passenger trips per
Potential TD customer. Similarly, SFC provided 1.38 paratransit passenger trips per Potential
TD customer compared to an average of 1.94 paratransit trips for the peer group. These data
are illustrated in Figures 3-48 and 3-49.

SARASOTA TRANSPORTATION ENHANCEMENT PLAN
Chapter Three CTC Performance Review
195
Table 3-9CTC Peer Analysis -Effectiveness Measures
Measure Sarasota Manatee Charlotte Lee Pasco Escambia Peer Min Peer Max Peer MeanSarasota% From
Mean
Vehicle Miles per TDCapita
7.41 8.18 7.24 10.37 5.49 16.64 5.49 16.64 9.22 -19.7%
Vehicle Miles perParatransit Pass Trip
5.39 2.76 5.36 9.06 3.67 5.07 2.76 9.06 5.22 3.2%
Vehicle Miles per PassTrip
4.50 2.13 4.34 8.66 3.63 3.53 2.13 8.66 4.47 0.8%
Pass Trips per TDCapita
1.64 3.84 1.67 1.20 1.51 4.71 1.20 4.71 2.43 -32.3%
Paratransit Pass Tripsper TD Capita
1.38 2.96 1.35 1.15 1.50 3.28 1.15 3.28 1.94 -29.0%
Pass Trips per VehicleMile
0.22 0.47 0.23 0.12 0.28 0.28 0.12 0.47 0.27 -16.5%
Paratransit Pass Tripsper Vehicle Mile
0.19 0.36 0.19 0.11 0.27 0.20 0.11 0.36 0.22 -15.3%
Accidents per 100,000Vehicle miles
0.64 0.44 1.48 0.51 0.11 0.86 0.11 1.48 0.67 -5.0%
Vehicle Miles betweenRoadcalls
29,218 6,179 77,396 22,797 12,703 20,854 6,179 77,396 28,191 3.6%
In the areas of passenger trips per vehicle mile (0.22) and paratransit passenger trips per
vehicle mile (0.19), SFC’s data was slightly lower than the means reported for the peer group,
0.27 and 0.22 trips, respectively. The relationship of SFC to its peers for these two
effectiveness measures are illustrated in Figures 3-50 and 3-51.
The final two effectiveness measures compare SFC to its peer CTCs in terms of system safetyand service quality, as shown in Figures 3-52 and Figure 3-53. SFC reports fewer accidents per100,000 vehicle miles traveled than the mean for the CTC peer group, 0.64 as compared to thepeer group average of 0.67. Finally, the number of miles traveled between roadcalls reportedfor the Sarasota County CTC is very close to the peer group average, 29,218 versus 28,191miles respectively. These measures together suggest that the CTC in Sarasota County isperforming adequately in the areas of system safety and reliability when compared with similarCTCs in the state of Florida. However, as noted in the CTC trend analysis, the number of milestraveled between roadcalls declined significantly over the past fiscal year, thus suggesting theneed for additional monitoring and further analysis.
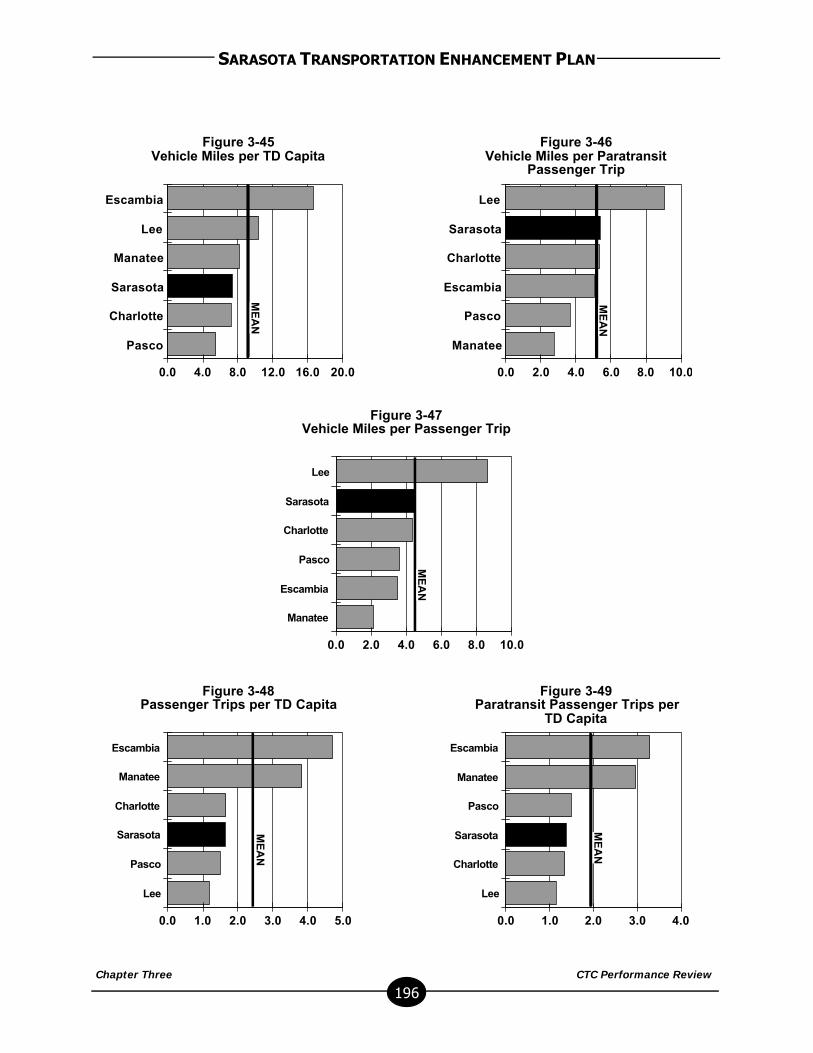
SARASOTA TRANSPORTATION ENHANCEMENT PLAN
Chapter Three CTC Performance Review
196
Escambia
Lee
Manatee
Sarasota
Charlotte
Pasco
0.0 4.0 8.0 12.0 16.0 20.0
Lee
Sarasota
Charlotte
Escambia
Pasco
Manatee
0.0 2.0 4.0 6.0 8.0 10.0
Escambia
Manatee
Charlotte
Sarasota
Pasco
Lee
0.0 1.0 2.0 3.0 4.0 5.0
Escambia
Manatee
Pasco
Sarasota
Charlotte
Lee
0.0 1.0 2.0 3.0 4.0
Lee
Sarasota
Charlotte
Pasco
Escambia
Manatee
0.0 2.0 4.0 6.0 8.0 10.0
ME
AN
ME
AN
ME
AN
ME
AN
ME
AN
Figure 3-45Vehicle Miles per TD Capita
Figure 3-46Vehicle Miles per Paratransit
Passenger Trip
Figure 3-47Vehicle Miles per Passenger Trip
Figure 3-48Passenger Trips per TD Capita
Figure 3-49Paratransit Passenger Trips per
TD Capita
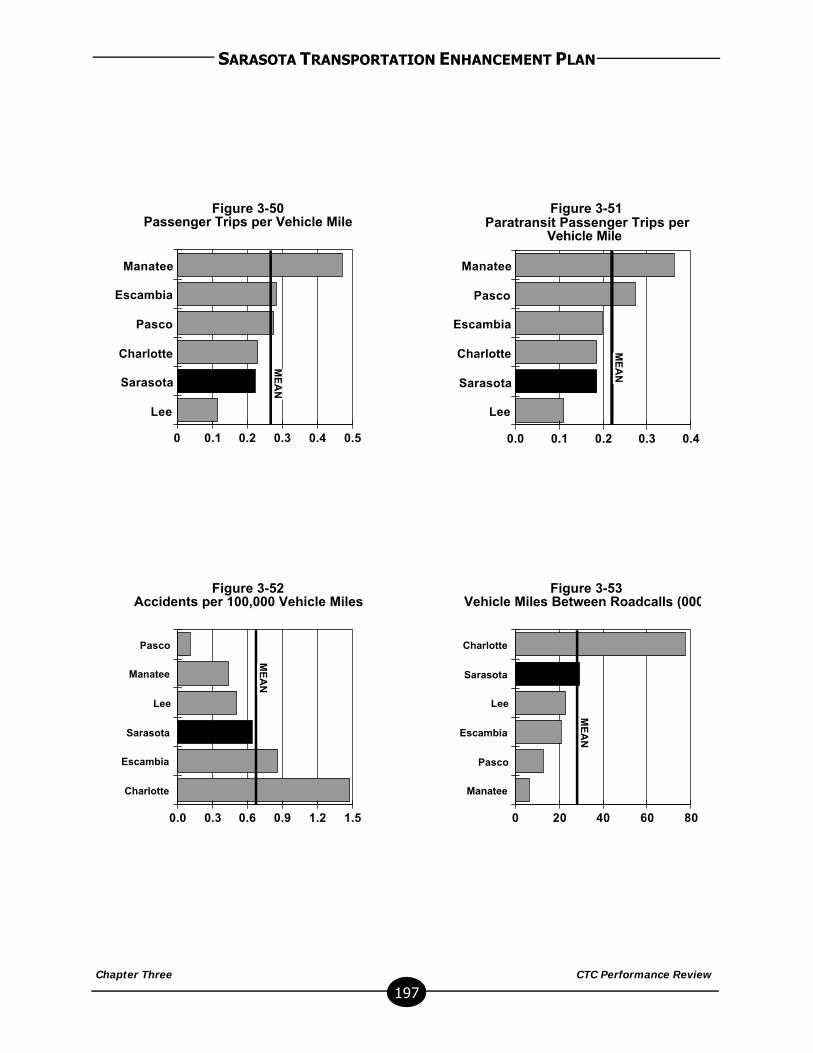
SARASOTA TRANSPORTATION ENHANCEMENT PLAN
Chapter Three CTC Performance Review
197
Manatee
Escambia
Pasco
Charlotte
Sarasota
Lee
0 0.1 0.2 0.3 0.4 0.5
Manatee
Pasco
Escambia
Charlotte
Sarasota
Lee
0.0 0.1 0.2 0.3 0.4
Pasco
Manatee
Lee
Sarasota
Escambia
Charlotte
0.0 0.3 0.6 0.9 1.2 1.5
Charlotte
Sarasota
Lee
Escambia
Pasco
Manatee
0 20 40 60 80
ME
AN
ME
AN
ME
AN
ME
AN
Figure 3-50Passenger Trips per Vehicle Mile
Figure 3-51Paratransit Passenger Trips per
Vehicle Mile
Figure 3-52Accidents per 100,000 Vehicle Miles
Figure 3-53Vehicle Miles Between Roadcalls (000)
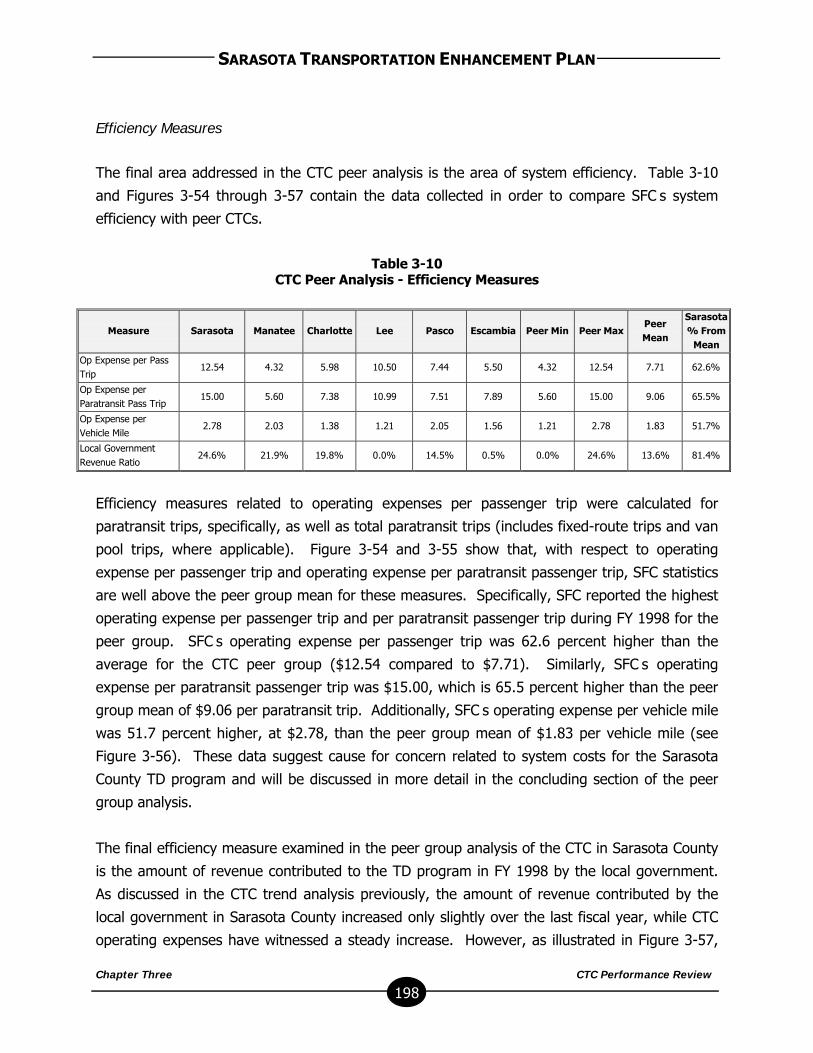
SARASOTA TRANSPORTATION ENHANCEMENT PLAN
Chapter Three CTC Performance Review
198
Efficiency Measures
The final area addressed in the CTC peer analysis is the area of system efficiency. Table 3-10
and Figures 3-54 through 3-57 contain the data collected in order to compare SFC’s system
efficiency with peer CTCs.
Table 3-10CTC Peer Analysis - Efficiency Measures
Measure Sarasota Manatee Charlotte Lee Pasco Escambia Peer Min Peer MaxPeerMean
Sarasota% From
Mean
Op Expense per PassTrip
12.54 4.32 5.98 10.50 7.44 5.50 4.32 12.54 7.71 62.6%
Op Expense perParatransit Pass Trip
15.00 5.60 7.38 10.99 7.51 7.89 5.60 15.00 9.06 65.5%
Op Expense perVehicle Mile
2.78 2.03 1.38 1.21 2.05 1.56 1.21 2.78 1.83 51.7%
Local GovernmentRevenue Ratio
24.6% 21.9% 19.8% 0.0% 14.5% 0.5% 0.0% 24.6% 13.6% 81.4%
Efficiency measures related to operating expenses per passenger trip were calculated for
paratransit trips, specifically, as well as total paratransit trips (includes fixed-route trips and van
pool trips, where applicable). Figure 3-54 and 3-55 show that, with respect to operating
expense per passenger trip and operating expense per paratransit passenger trip, SFC statistics
are well above the peer group mean for these measures. Specifically, SFC reported the highest
operating expense per passenger trip and per paratransit passenger trip during FY 1998 for the
peer group. SFC’s operating expense per passenger trip was 62.6 percent higher than the
average for the CTC peer group ($12.54 compared to $7.71). Similarly, SFC’s operating
expense per paratransit passenger trip was $15.00, which is 65.5 percent higher than the peer
group mean of $9.06 per paratransit trip. Additionally, SFC’s operating expense per vehicle mile
was 51.7 percent higher, at $2.78, than the peer group mean of $1.83 per vehicle mile (see
Figure 3-56). These data suggest cause for concern related to system costs for the Sarasota
County TD program and will be discussed in more detail in the concluding section of the peer
group analysis.
The final efficiency measure examined in the peer group analysis of the CTC in Sarasota County
is the amount of revenue contributed to the TD program in FY 1998 by the local government.
As discussed in the CTC trend analysis previously, the amount of revenue contributed by the
local government in Sarasota County increased only slightly over the last fiscal year, while CTC
operating expenses have witnessed a steady increase. However, as illustrated in Figure 3-57,
SARASOTA TRANSPORTATION ENHANCEMENT PLAN
Chapter Three CTC Performance Review
199
SFC ranks the highest among its CTC peers in terms of the ratio of total revenue contributed by
the local government. During FY 1998, the amount of revenue contributed by the local
government in Sarasota County was 81.4 percent higher than the peer group mean. A majority
of these revenues are the County’s contribution toward the purchase of ADA complementary
paratransit trips from the CTC.
Table 3-11SFC CTC Performance Strengths and Weaknesses, Peer Review
Performance Strengths Performance Weaknesses
Local Government Revenue Ratio Passenger Trips per TD CapitaParatransit Passenger Trips per TD Capita
Operating Expense per Vehicle MileOperating Expense per Passenger Trip
Operating Expense per Paratransit Pass. Trip
Conclusions
This concluding section summarizes the results of the CTC peer review analysis for SFC. For the
CTC peer review analysis, a performance strength is defined as a performance area that is more
than 10 percent better than the peer group average, while a performance weakness is defined
as a performance area that is more than 10 percent worse than the peer group average.
Overall, as shown in Table 3-11, the CTC peer comparison reveals that SFC is performing below
the peer group mean in many important effectiveness and efficiency measures. However, these
data must be considered within the unique context of the Sarasota County TD program.
For example, the data presented in the SFC’s AOR represent system-wide data. Included in
these data are information from agencies that provided transportation to their own clients in
vehicles procured through the FDOT Section 16 program. Transportation is not the primary
business of these agencies and the CTC reports that many of these agencies have difficulty
separating transportation costs from overall agency costs. Therefore, the operating costs
reported to the CTC for several agencies likely include total agency costs, rather than only those
costs incurred in the delivery of transportation services for clients. As a result, overall operating
expenses for the TD program are inflated. The CTC has made strides toward resolving this
problem by developing point-by-point instructions for agencies to use to calculate transportation
costs as a portion of overall agency costs. The CTC should continue working with agencies to
ensure that the most accurate data is collected.
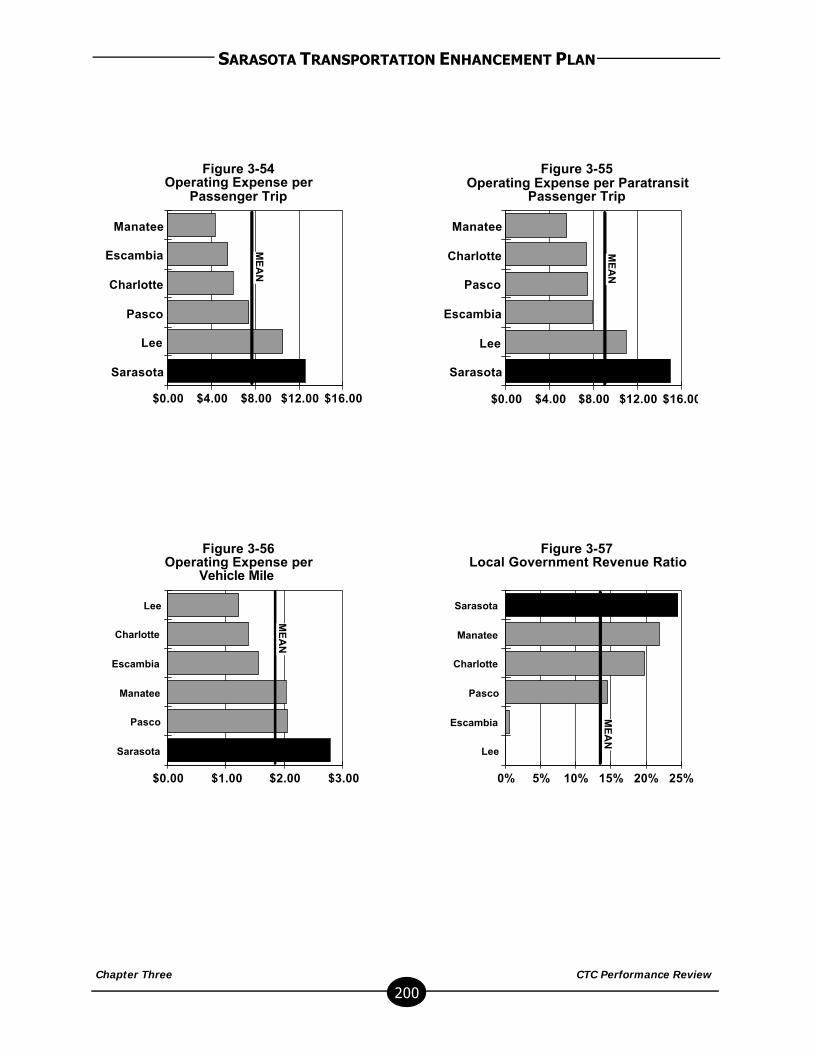
SARASOTA TRANSPORTATION ENHANCEMENT PLAN
Chapter Three CTC Performance Review
200
Manatee
Escambia
Charlotte
Pasco
Lee
Sarasota
$0.00 $4.00 $8.00 $12.00 $16.00
Manatee
Charlotte
Pasco
Escambia
Lee
Sarasota
$0.00 $4.00 $8.00 $12.00 $16.00
Lee
Charlotte
Escambia
Manatee
Pasco
Sarasota
$0.00 $1.00 $2.00 $3.00
Sarasota
Manatee
Charlotte
Pasco
Escambia
Lee
0% 5% 10% 15% 20% 25%
ME
AN
ME
AN
ME
AN
ME
AN
Figure 3-54Operating Expense per
Passenger Trip
Figure 3-55Operating Expense per Paratransit
Passenger Trip
Figure 3-56Operating Expense per
Vehicle Mile
Figure 3-57Local Government Revenue Ratio
SARASOTA TRANSPORTATION ENHANCEMENT PLAN
Chapter Three CTC Performance Review
201
In addition, the Sarasota County TD program has not yet instituted a bus pass program that will
facilitate greater use of the fixed-route bus system by TD passengers. This type of program has
been very successfully implemented in most of the peer group TD programs resulting in much
lower operating expenses. Within the next year, the CTC in Sarasota County plans to
implement a bus pass program that will make the fixed-route bus system the transportation
mode of first consideration for TD trips. Paratransit service will be reserved for TD customers
who are able to demonstrate that they cannot use the fixed-route bus service for needed trips.
This program, when fully implemented, should help to reduce and stabilize system costs. In
addition, the implementation of paratransit feeder service in the future could result in a
reduction of operating costs and increased system efficiencies by helping paratransit passengers
to use the less costly fixed-route bus service. This also would result in increased capacity on
paratransit vehicles for individuals who are not able to use fixed route services. Given these
system particularities, the reader should note that although all of the comparisons presented in
this section do provide insight into how well the CTC for Sarasota County appears to be
performing statistically, they should not be used as the sole measures to make inferences about
the quality of SFC’s TD services.
SARASOTA TRANSPORTATION ENHANCEMENT PLAN
Chapter Three CTC Performance Review
202
CTC OPERATOR SURVEY
This section of the paratransit evaluation portion of the STEP summarizes the results of a surveyof CTC bus operators. Since bus operators are in direct contact with passengers on a dailybasis, they are a valuable resource for information concerning CTC operations, particularly fromthe rider’s perspective. The surveys were distributed to 35 bus operators on July 21, 1999, bySFC staff. The surveys were placed in the operator’s mailbox and operators were given untilJuly 23, 1999, to complete and return the surveys to the SFC office. A total of 29 surveys werecompleted and returned by the bus operators. For reference, a copy of the actual operatorsurvey is contained in Appendix L.
The first question on the survey asked CTC operators to read over a list of common complaintsthat riders often voice and rank, from 1 to 5, the complaints that they hear most frequently fromTD riders with 1 being the most frequent complaint and 5 being the least frequent. A total of12 possible complaints were listed on the survey for bus operators to read over and select fromincluding an “other” category. This particular category required bus operators to write-out theirresponse if it was not represented among the list of common complaints.
The most frequent rider complaints expressed to the bus operators by CTC clients are presentedin Table 3-12. According to the results of the survey, the most frequent complaint expressed byCTC clients is “the vehicle is late in picking me up.” In addition to late pick-ups, clients similarlycomplained that CTC vehicles are late in delivering riders to their destinations. For the mostpart, the results from the survey indicate that bus operators feel that the complaints are valid or“some” of the passengers’ complaints were valid, as shown in Figure 3-58.
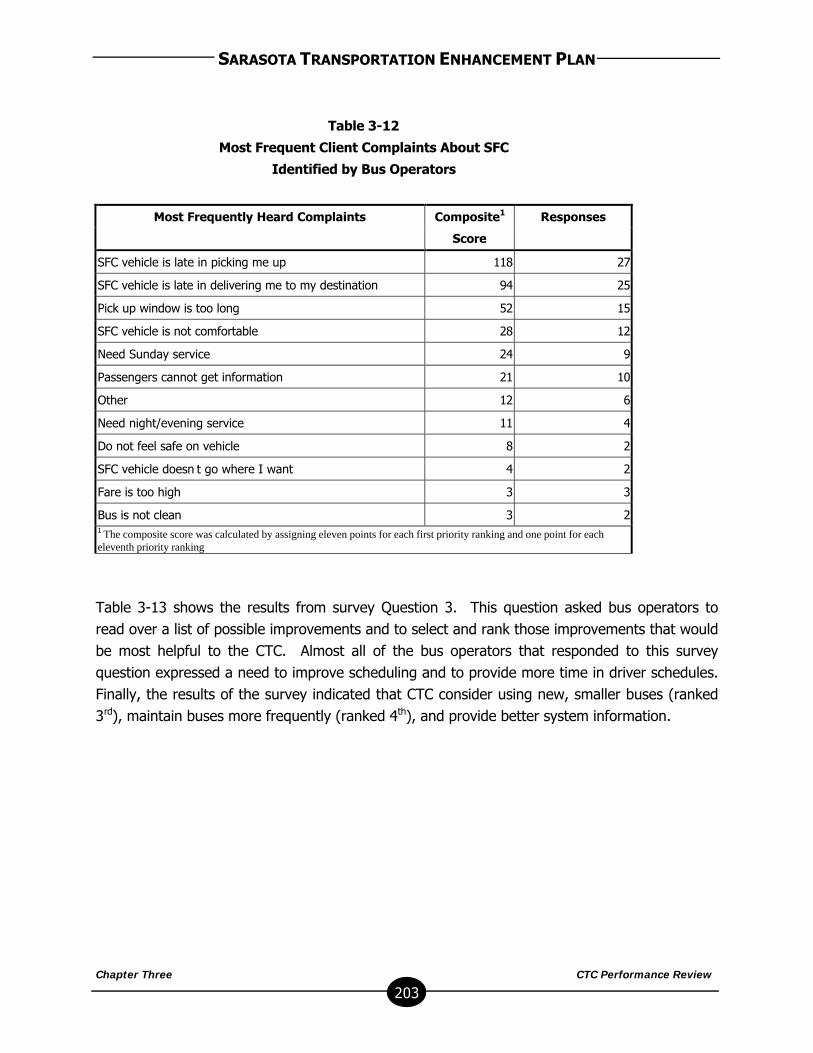
SARASOTA TRANSPORTATION ENHANCEMENT PLAN
Chapter Three CTC Performance Review
203
Table 3-12
Most Frequent Client Complaints About SFC
Identified by Bus Operators
Most Frequently Heard Complaints Composite1 Responses
Score
SFC vehicle is late in picking me up 118 27
SFC vehicle is late in delivering me to my destination 94 25
Pick up window is too long 52 15
SFC vehicle is not comfortable 28 12
Need Sunday service 24 9
Passengers cannot get information 21 10
Other 12 6
Need night/evening service 11 4
Do not feel safe on vehicle 8 2
SFC vehicle doesn’t go where I want 4 2
Fare is too high 3 3
Bus is not clean 3 21 The composite score was calculated by assigning eleven points for each first priority ranking and one point for eacheleventh priority ranking
Table 3-13 shows the results from survey Question 3. This question asked bus operators toread over a list of possible improvements and to select and rank those improvements that wouldbe most helpful to the CTC. Almost all of the bus operators that responded to this surveyquestion expressed a need to improve scheduling and to provide more time in driver schedules.Finally, the results of the survey indicated that CTC consider using new, smaller buses (ranked3rd), maintain buses more frequently (ranked 4th), and provide better system information.

SARASOTA TRANSPORTATION ENHANCEMENT PLAN
Chapter Three CTC Performance Review
204
Table 3-13Improvement Areas for SFCIdentified by Bus Operators
Areas of Improvement Composite1 Responses
Score
Improve scheduling 254 25
Give more time to schedules 253 25
Operate new, smaller vehicles 171 20
Maintain buses more frequently 150 19
Provide better system information 136 19
Operate Sunday service 82 14
Operate night/evening service 82 14
Operate new, larger vehicles 66 13
Lower the fares 46 12
Other 29 41 The composite score was calculated by assigning eleven points for each first priority ranking and one pointfor each eleventh priority ranking.
Question 4 of the bus operator survey asked bus operators to indicate potential safety problemswith the CTC transportation service. The question required bus operators to write-out theircomments. The potential safety problems/hazards noted by bus operators are listed below:
! Pick-ups and drop-offs at the main entrance of Sarasota Memorial Hospital would be saferthan current location
! Contact with clients with contagious diseases is unsafe! Due to bus radios poor quality, drivers sometimes cannot contact dispatch! Drivers need to hurry form point to point in order to maintain schedule! Lack of proper driver training! Drivers are familiar with the vehicle that they normally drive which causes problems when
they are assigned to a different vehicle! Nursing home clients that are unable to communicate! Drop-off area at 5741 Bee Ridge Road! The need to look for street signs and house numbers in the dark! Some drivers do not use turn signals when changing lanes
Question 5 on the bus operator survey queried bus operators about modifications that should bemade to the scheduling process. The question required bus operators to write-out theircomments. The following is a complete list of comments offered by bus operators.
SARASOTA TRANSPORTATION ENHANCEMENT PLAN
Chapter Three CTC Performance Review
205
! The only way to solve the window problem is to increase the number of drivers and vehicles! Schedule pick-ups and drop-offs in a circle! Decrease deadheading! Have schedulers ride with drivers to get a better understanding of time needed! Lunch hours are left out of schedules many times! All schedules should be reviewed by someone other than the person producing them to
ensure accuracy! Give drivers more time between pick-ups and drop-offs! Allow drivers to work areas they are familiar with! Allow more load time for wheelchairs! Use a different computer scheduling program! Computer scheduled routes will never work due to bridges, road repairs and unforeseen
accidents
Finally, question 6 on the bus operator survey asked bus operators to indicate any othercomments that would be helpful to improve CTC transportation service. The question requiredbus operators to write-out their comments. The following is a complete list of comments madeby bus operators.
! Better scheduling will improve SFC and will reduce the amount of late arrival/departures! We provide a very beneficial service to the community, elderly, homebound, and
institutionalized! The service is a good value for the fare charged! If a vehicle is not dispatched for a single individual, clients will always have complaints! Institute a decision making process from the supervisors to drivers! Install a dependable radio system! Fine tune schedules! Too many clients, not enough buses! Outside of scheduling, SFC runs fairly well! Schedules are quite busy, we need more drivers! Prioritize clients! Have someone knowledgeable proofread manifests! Have a drivers’ meeting every six weeks to discuss problems/solutions! Input from drivers should be taken seriously! Don’t schedule pick-ups at the same time on opposite ends of town! New radio system is a must! Improve radio system! Poor radio system is downright unsafe! Include customer phone number on manifests
SARASOTA TRANSPORTATION ENHANCEMENT PLAN
Chapter Three CTC Performance Review
206
SARASOTA TRANSPORTATION ENHANCEMENT PLAN
Chapter Three CTC Performance Review
207
SENIOR FRIENDSHIP CENTER ON-BOARD SURVEY
This section summarizes the results of an on-board survey of Senior Friendship Center (SFC)paratransit riders conducted on July 21, 1999. The purpose of this survey was to obtain dataabout rider demographics, travel behavior, satisfaction with specific aspects of Senior FriendshipCenter’s services, and the use or potential use of Sarasota County Area Transit (SCAT) servicesby SFC riders.
Survey Methodology
The paratransit on-board survey was designed to elicit descriptive information regarding thedemographic traits and travel behavior of SFC riders as well as their satisfaction with specificaspects of SFC paratransit service. This information will enable SFC to focus on relevant needsand issues. In addition, information about SFC riders’ perception and use of SCAT will help todetermine ways of encouraging paratransit riders to use fixed-route transit for some or all oftheir trips.
The on-board survey was conducted on Wednesday, July 21, 1999. Surveys were distributed bythe drivers of all CTC vehicles on that date. Passengers filled out the survey while riding thevehicle and returned the survey to the driver before exiting the vehicle. If passengers were notable to complete the survey before the end of their trip, they were asked to return thecompleted survey on their next trip. Riders were asked to complete only one survey regardlessof whether they used the system multiple times during the survey period. For reference, a copyof the survey instrument is included in Appendix M.
SFC On-Board Survey Analysis
The on-board survey analysis is composed of five sections: demographics, travel behavior, ridersatisfaction with specific aspects of SFC paratransit service, ridership of SFC clients on SCAT,and rider comments and suggestions. Each section provides information that will be useful inimproving the performance and service offered by the CTC.
Demographic data consists of such information as rider age, gender, ethnicity, annualhousehold income, and the number of working vehicles in the rider's household. Thisinformation is useful for comparison of the demographic characteristics of SFC riders to thecharacteristics of all persons in Sarasota County.
Travel behavior included data such as frequency of use, length of use, trip purpose, farepayment and fare category, alternative transportation, and assistance requirements. This

SARASOTA TRANSPORTATION ENHANCEMENT PLAN
Chapter Three CTC Performance Review
208
information can assist SFC in effective scheduling and general policy-decisions regarding overallSFC service.
A series of questions were asked to evaluate quality of service and user satisfaction. Thequestions asked include information concerning comfort of vehicles, on-time performance, driverassistance, driver courtesy, telephone agent courtesy, and overall quality of service. Identifiedweaknesses may potentially be addressed through changes in the system. By distinguishingrider sensitivities regarding specific characteristics of the system, the CTC will be better able toprioritize improvements to the service.
Three questions were also included in the on-board survey regarding the use of SCAT busservices by users of SFC Transportation. These questions were asked to establish whatpercentage of SFC clients have ever ridden SCAT, the reason(s) they haven’t tried SCAT, andunder what conditions would they consider using SCAT bus services.
Finally, respondents were given the opportunity to provide open-ended comments regardingSFC service.
A total of 141 surveys were returned by riders. This represents a 44 percent coverage of allpersons riding SFC on the day of the survey. (This assumes that all of the 642 trips paratransittrips provided in this day were roundtrips. Therefore, 321 people were transported.) Eachsurvey question was analyzed independently and the results for each question are provided ineither tables or figures. The tables and figures are accompanied by brief narratives that explainthe relevance of the findings being reported. All questions were included in the analysisregardless of whether or not the survey was completed entirely.
SFC Rider Demographic Information
A number of questions were asked in order to establish a demographic profile of the typical SFCparatransit rider. Demographic-related questions included age (Question 17), gender (Question18), ethnicity (Question 19), annual household income (Question 20), and auto ownership(Question 21). Where information is available the demographics of SFC riders was compared tothe demographics of all residents of Sarasota County (as derived from the 1990 and 1997 USCensus data), as shown in Table 3-14.
Age - The on-board survey results indicate that more than 72 percent of SFC riders are 60 yearsor older. Another 12 percent of the riders are between the age of 45 and 59 years old.
SARASOTA TRANSPORTATION ENHANCEMENT PLAN
Chapter Three CTC Performance Review
209
Gender - Results from the on-board survey show that many more women currently use SFCservice than men. As Table 3-14 indicates, 74 percent of the riders are female and 26 percentare male. This finding related to gender is typical of overall paratransit ridership.
Ethnicity - For the entire system, according to the results from the on-board survey, 82 percentof riders are white, while 17 percent are black. Only 1 percent of riders indicated their ethnicityto be Hispanic.
Annual Household Income – The on-board survey results indicate that 55 percent of riders havean annual household income that is less than $10,000, and another 29 percent have an annualhousehold income between $10,000 and $19,999. Of all the riders surveyed, only 7 percenthave an annual household income of $30,000 or greater.
Vehicle Ownership - The on-board survey results indicate that 61 percent of riders do not have avehicle available to them in their household. Another 29 percent indicated that they have onlyone vehicle available at their household.
SFC Rider Travel Behavior Information
A number of questions were included in the on-board survey to obtain information about thetravel behavior of SFC riders. This information includes frequency of use, length of use, trippurpose, fare payment and fare category, alternative transportation, and assistancerequirements. The results of these questions are shown in Figures 3-59 through 3-65.
Frequency of Use – The majority of respondents reported that they use SFC three days perweek (30 percent), as illustrated in Figure 3-59. The second most common response to thisquestion was five days per week (25 percent). Fewer than 2 percent of respondents ride morethan five days per week.
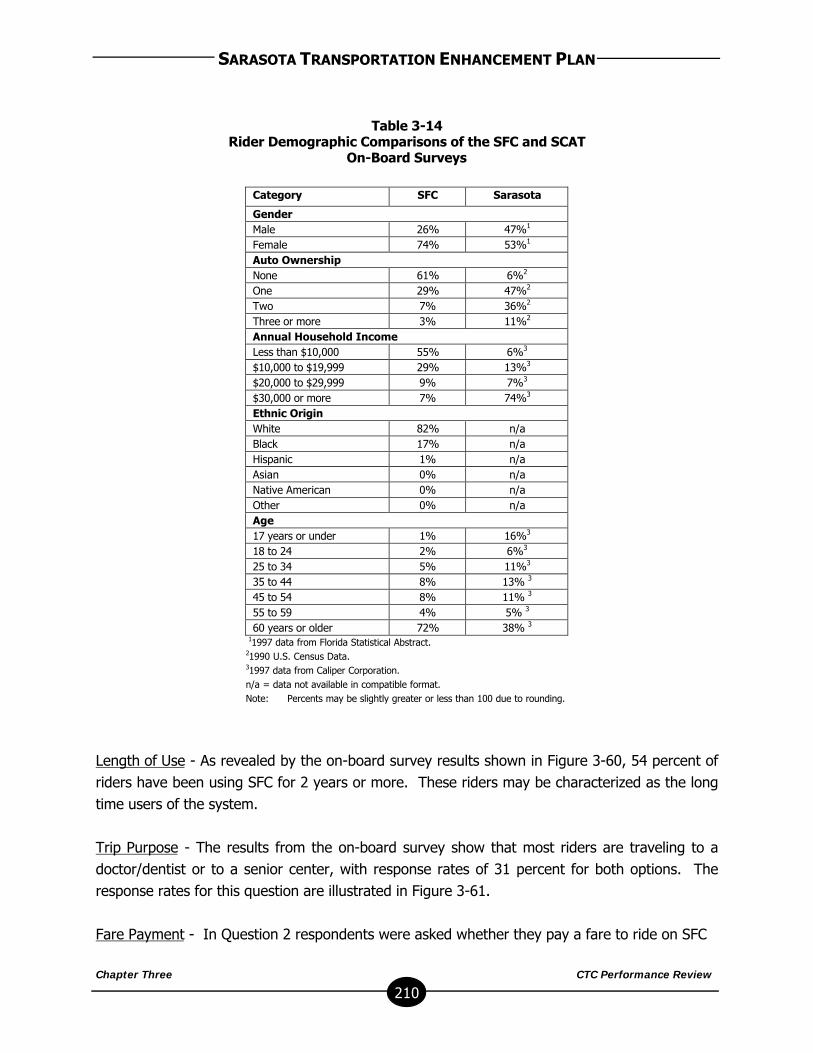
SARASOTA TRANSPORTATION ENHANCEMENT PLAN
Chapter Three CTC Performance Review
210
Table 3-14Rider Demographic Comparisons of the SFC and SCAT
On-Board Surveys
Category SFC SarasotaCountyGender
Male 26% 47%1
Female 74% 53%1
Auto OwnershipNone 61% 6%2
One 29% 47%2
Two 7% 36%2
Three or more 3% 11%2
Annual Household IncomeLess than $10,000 55% 6%3
$10,000 to $19,999 29% 13%3
$20,000 to $29,999 9% 7%3
$30,000 or more 7% 74%3
Ethnic OriginWhite 82% n/aBlack 17% n/aHispanic 1% n/aAsian 0% n/aNative American 0% n/aOther 0% n/aAge17 years or under 1% 16%3
18 to 24 2% 6%3
25 to 34 5% 11%3
35 to 44 8% 13% 3
45 to 54 8% 11% 3
55 to 59 4% 5% 3
60 years or older 72% 38% 3
11997 data from Florida Statistical Abstract. 21990 U.S. Census Data. 31997 data from Caliper Corporation. n/a = data not available in compatible format. Note: Percents may be slightly greater or less than 100 due to rounding.
Length of Use - As revealed by the on-board survey results shown in Figure 3-60, 54 percent ofriders have been using SFC for 2 years or more. These riders may be characterized as the longtime users of the system.
Trip Purpose - The results from the on-board survey show that most riders are traveling to adoctor/dentist or to a senior center, with response rates of 31 percent for both options. Theresponse rates for this question are illustrated in Figure 3-61.
Fare Payment - In Question 2 respondents were asked whether they pay a fare to ride on SFC
SARASOTA TRANSPORTATION ENHANCEMENT PLAN
Chapter Three CTC Performance Review
211
vehicles and if they do pay, what the amount of the fare was. As shown in Figure 3-62,approximately 73 percent of respondents paid a fare, with the majority paying $1.00 for eachtrip (see Figure 3-63).
Trip Type – Riders were also asked whether their trip was sponsored by an organization. Thelargest group of respondents indicated that they were “Silver Card” riders (36 percent), asshown in Figure 3-64. Silver Card paratransit trips are sponsored through the ADAcomplementary paratransit service and are open to individuals who are not able to use thefixed-route bus service because of a disability. The next most common trip type was Medicaid-sponsored trips (22 percent).
Alternative Transportation – To find out how people would travel to their destinations if theycould not travel by a SFC vehicle, the survey included Question 15. SFC riders were asked toindicate from eight discrete choices how they would make their trip if SFC were not available;the results are presented in Figure 3-65. If the SFC transportation services were not available,41 percent of riders wouldn’t make the trip, 30 percent would ride with someone, 11 percentwould use a taxi service, 7 percent would take a SCAT bus, 3 percent would drive themselves, 1percent would walk, and 8 percent would use other means of making their trip.
Assistance Requirements – In Question 8, respondents were asked whether they requireassistance from a SFC driver to board the vehicle. Of the respondents, 55 percent indicatedthat they do not require assistance, 45 percent require assistance from the driver.
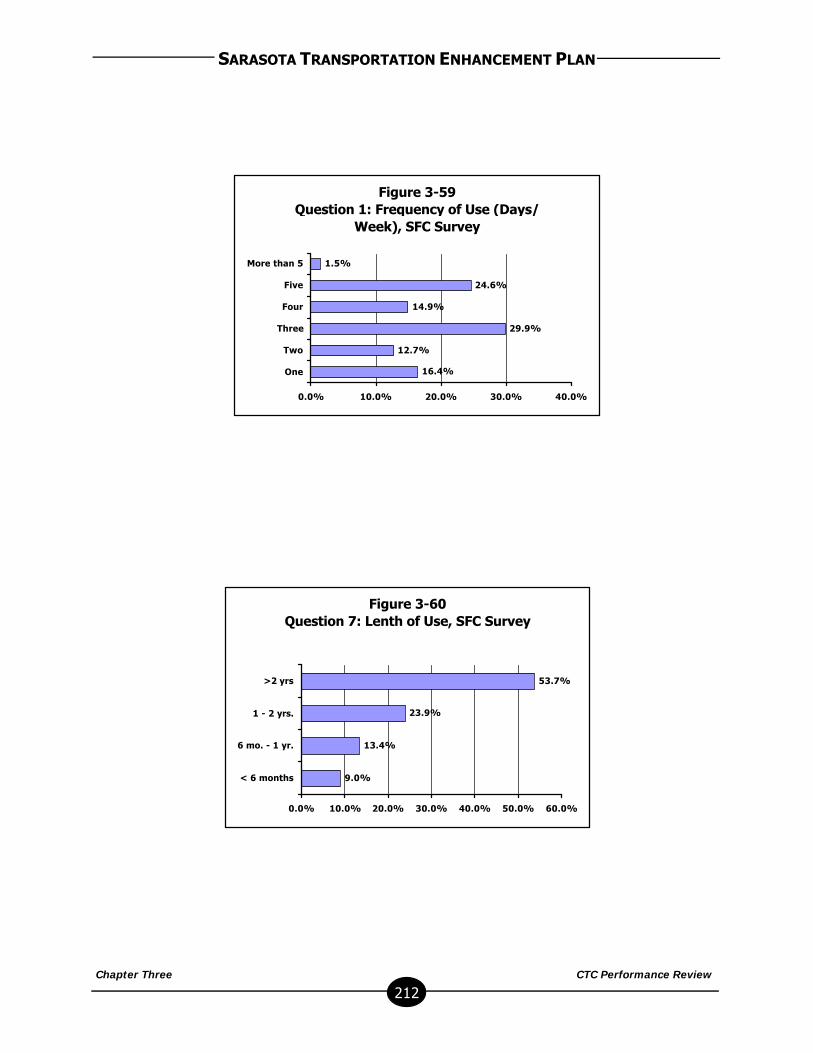
SARASOTA TRANSPORTATION ENHANCEMENT PLAN
Chapter Three CTC Performance Review
212
Figure 3-59Question 1: Frequency of Use (Days/
Week), SFC Survey
12.7%
29.9%
14.9%
24.6%
1.5%
16.4%
0.0% 10.0% 20.0% 30.0% 40.0%
One
Two
Three
Four
Five
More than 5
Figure 3-60Question 7: Lenth of Use, SFC Survey
13.4%
23.9%
53.7%
9.0%
0.0% 10.0% 20.0% 30.0% 40.0% 50.0% 60.0%
< 6 months
6 mo. - 1 yr.
1 - 2 yrs.
>2 yrs
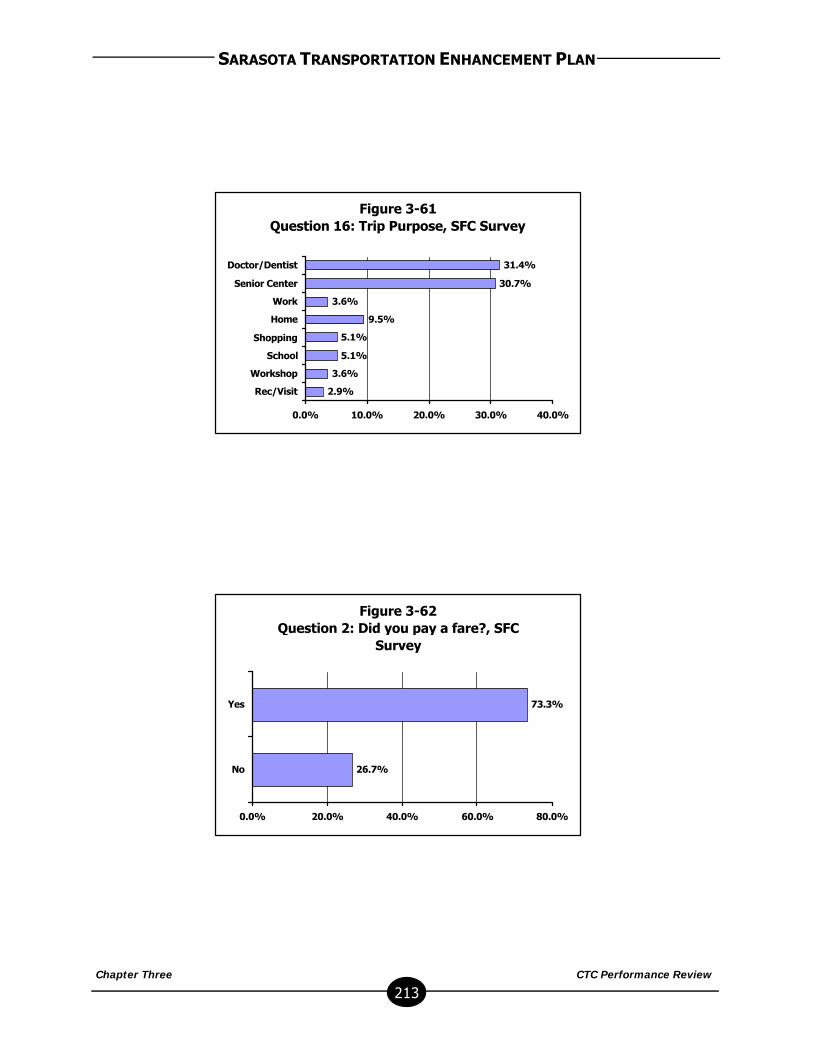
SARASOTA TRANSPORTATION ENHANCEMENT PLAN
Chapter Three CTC Performance Review
213
Figure 3-61Question 16: Trip Purpose, SFC Survey
3.6%
5.1%
5.1%
9.5%
3.6%
30.7%
31.4%
2.9%
0.0% 10.0% 20.0% 30.0% 40.0%
Rec/Visit
Workshop
School
Shopping
Home
Work
Senior Center
Doctor/Dentist
Figure 3-62Question 2: Did you pay a fare?, SFC
Survey
73.3%
26.7%
0.0% 20.0% 40.0% 60.0% 80.0%
No
Yes
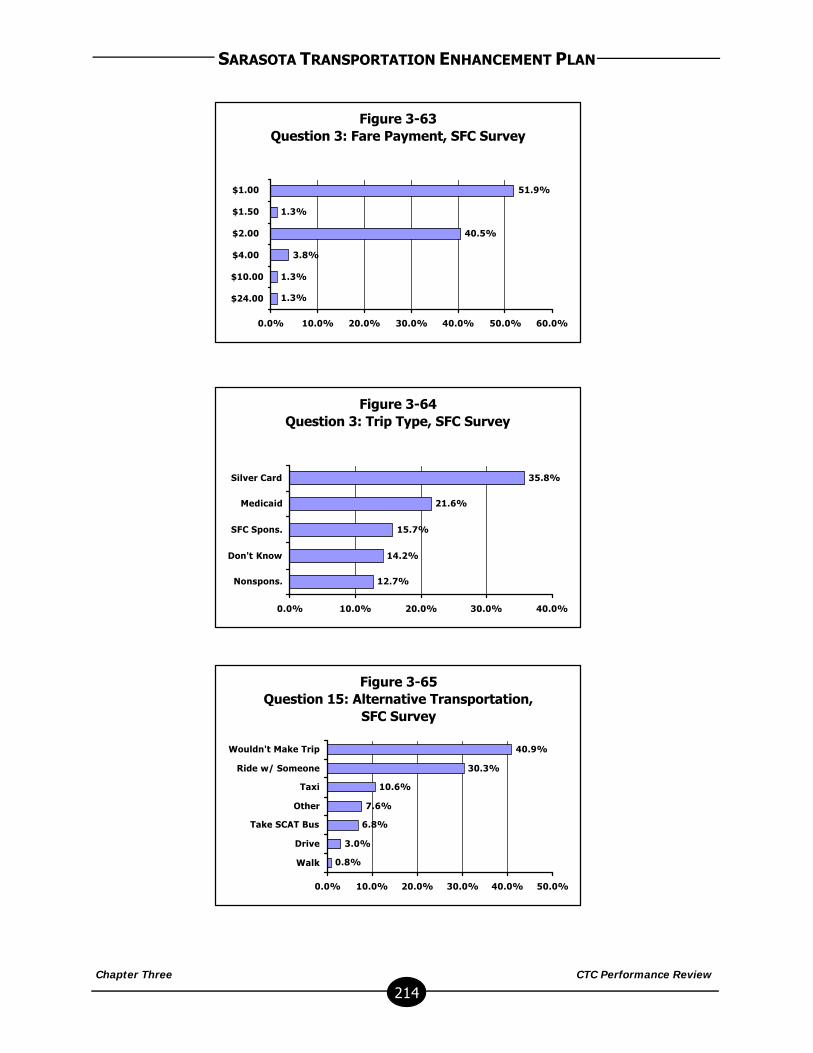
SARASOTA TRANSPORTATION ENHANCEMENT PLAN
Chapter Three CTC Performance Review
214
Figure 3-64Question 3: Trip Type, SFC Survey
14.2%
15.7%
21.6%
35.8%
12.7%
0.0% 10.0% 20.0% 30.0% 40.0%
Nonspons.
Don't Know
SFC Spons.
Medicaid
Silver Card
Figure 3-65Question 15: Alternative Transportation,
SFC Survey
3.0%
6.8%
7.6%
10.6%
30.3%
40.9%
0.8%
0.0% 10.0% 20.0% 30.0% 40.0% 50.0%
Walk
Drive
Take SCAT Bus
Other
Taxi
Ride w/ Someone
Wouldn't Make Trip
Figure 3-63Question 3: Fare Payment, SFC Survey
1.3%
3.8%
40.5%
1.3%
51.9%
1.3%
0.0% 10.0% 20.0% 30.0% 40.0% 50.0% 60.0%
$24.00
$10.00
$4.00
$2.00
$1.50
$1.00
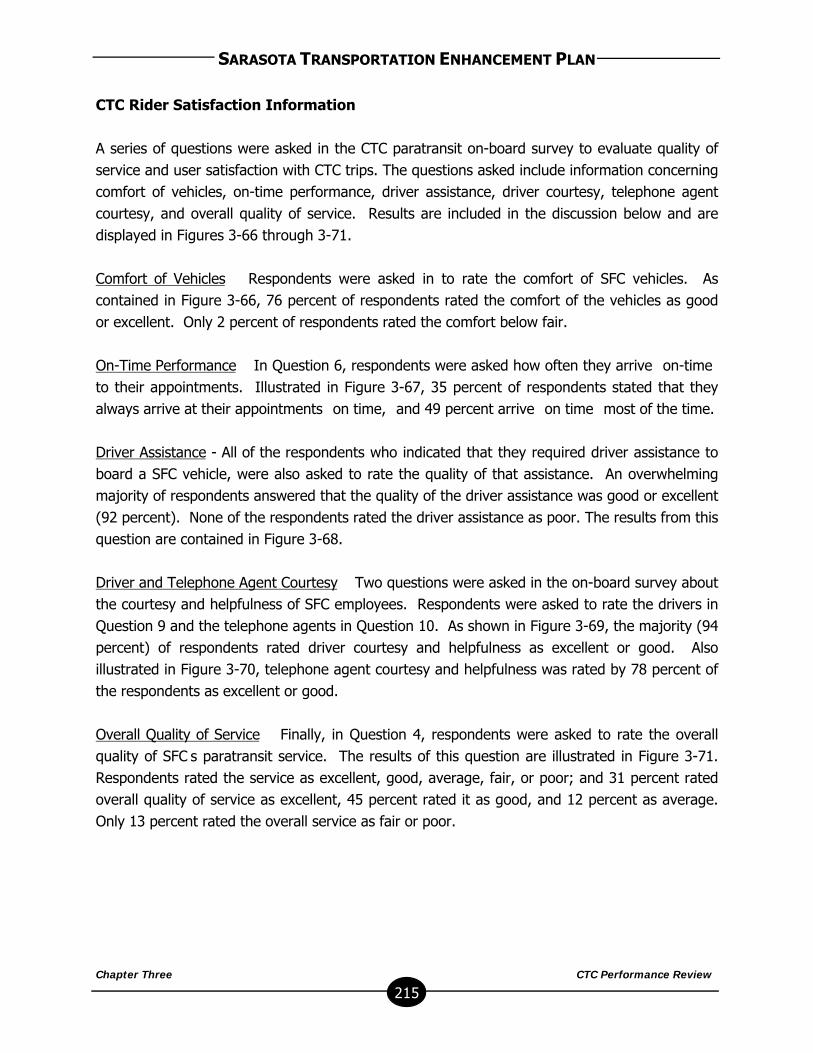
SARASOTA TRANSPORTATION ENHANCEMENT PLAN
Chapter Three CTC Performance Review
215
CTC Rider Satisfaction Information
A series of questions were asked in the CTC paratransit on-board survey to evaluate quality ofservice and user satisfaction with CTC trips. The questions asked include information concerningcomfort of vehicles, on-time performance, driver assistance, driver courtesy, telephone agentcourtesy, and overall quality of service. Results are included in the discussion below and aredisplayed in Figures 3-66 through 3-71.
Comfort of Vehicles – Respondents were asked in to rate the comfort of SFC vehicles. Ascontained in Figure 3-66, 76 percent of respondents rated the comfort of the vehicles as goodor excellent. Only 2 percent of respondents rated the comfort below fair.
On-Time Performance – In Question 6, respondents were asked how often they arrive “on-time”to their appointments. Illustrated in Figure 3-67, 35 percent of respondents stated that theyalways arrive at their appointments “on time,” and 49 percent arrive “on time” most of the time.
Driver Assistance - All of the respondents who indicated that they required driver assistance toboard a SFC vehicle, were also asked to rate the quality of that assistance. An overwhelmingmajority of respondents answered that the quality of the driver assistance was good or excellent(92 percent). None of the respondents rated the driver assistance as poor. The results from thisquestion are contained in Figure 3-68.
Driver and Telephone Agent Courtesy – Two questions were asked in the on-board survey aboutthe courtesy and helpfulness of SFC employees. Respondents were asked to rate the drivers inQuestion 9 and the telephone agents in Question 10. As shown in Figure 3-69, the majority (94percent) of respondents rated driver courtesy and helpfulness as excellent or good. Alsoillustrated in Figure 3-70, telephone agent courtesy and helpfulness was rated by 78 percent ofthe respondents as excellent or good.
Overall Quality of Service – Finally, in Question 4, respondents were asked to rate the overallquality of SFC’s paratransit service. The results of this question are illustrated in Figure 3-71.Respondents rated the service as excellent, good, average, fair, or poor; and 31 percent ratedoverall quality of service as excellent, 45 percent rated it as good, and 12 percent as average.Only 13 percent rated the overall service as fair or poor.
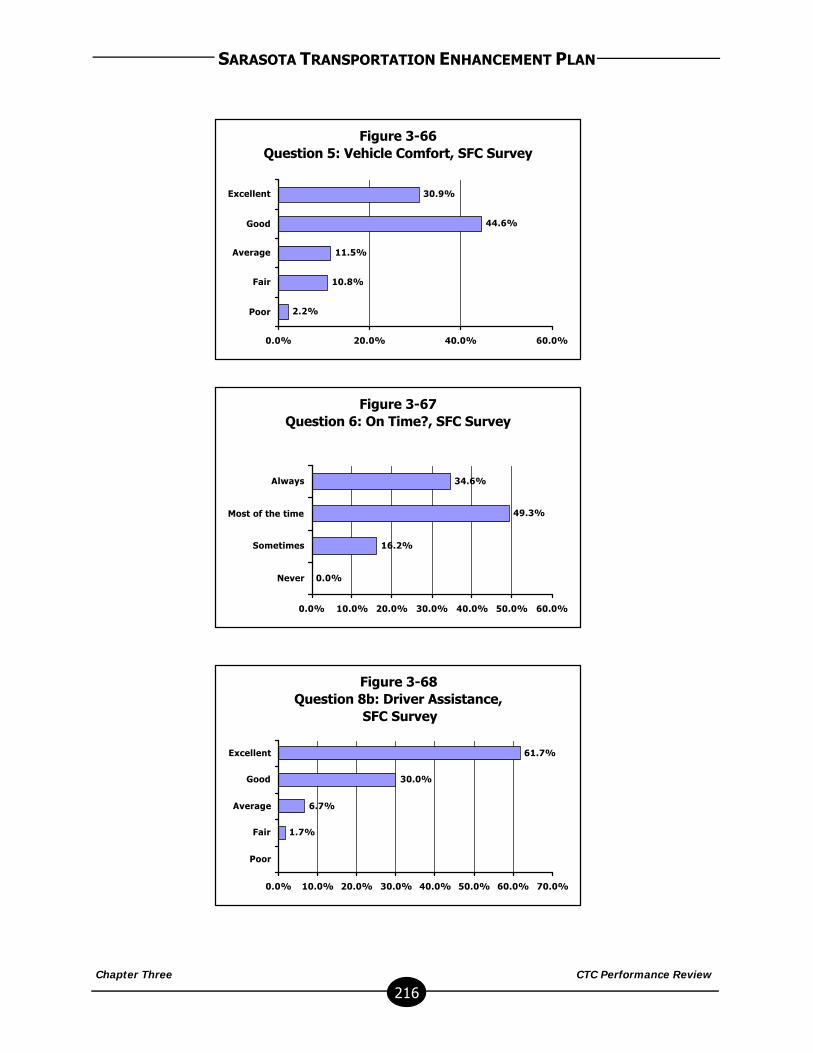
SARASOTA TRANSPORTATION ENHANCEMENT PLAN
Chapter Three CTC Performance Review
216
Figure 3-66Question 5: Vehicle Comfort, SFC Survey
10.8%
11.5%
44.6%
30.9%
2.2%
0.0% 20.0% 40.0% 60.0%
Poor
Fair
Average
Good
Excellent
Figure 3-67Question 6: On Time?, SFC Survey
16.2%
49.3%
34.6%
0.0%
0.0% 10.0% 20.0% 30.0% 40.0% 50.0% 60.0%
Never
Sometimes
Most of the time
Always
Figure 3-68Question 8b: Driver Assistance,
SFC Survey
1.7%
6.7%
61.7%
30.0%
0.0% 10.0% 20.0% 30.0% 40.0% 50.0% 60.0% 70.0%
Poor
Fair
Average
Good
Excellent

SARASOTA TRANSPORTATION ENHANCEMENT PLAN
Chapter Three CTC Performance Review
217
Figure 3-69Question 9: Driver Courtesy, SFC Survey
2.1%
4.3%
28.6%
65.0%
0.0%
0.0% 20.0% 40.0% 60.0% 80.0%
Poor
Fair
Average
Good
Excellent
Figure 3-70Question 10: Telephone Agent Courtesy,
SFC Survey
11.0%
9.6%
35.3%
43.4%
0.7%
0.0% 10.0% 20.0% 30.0% 40.0% 50.0%
Poor
Fair
Average
Good
Excellent
Figure 3-71Question 4: Overall Quality, SFC Survey
11.4%
5.7%
45.0%
36.4%
1.4%
0.0% 10.0% 20.0% 30.0% 40.0% 50.0%
Poor
Fair
Average
Good
Excellent
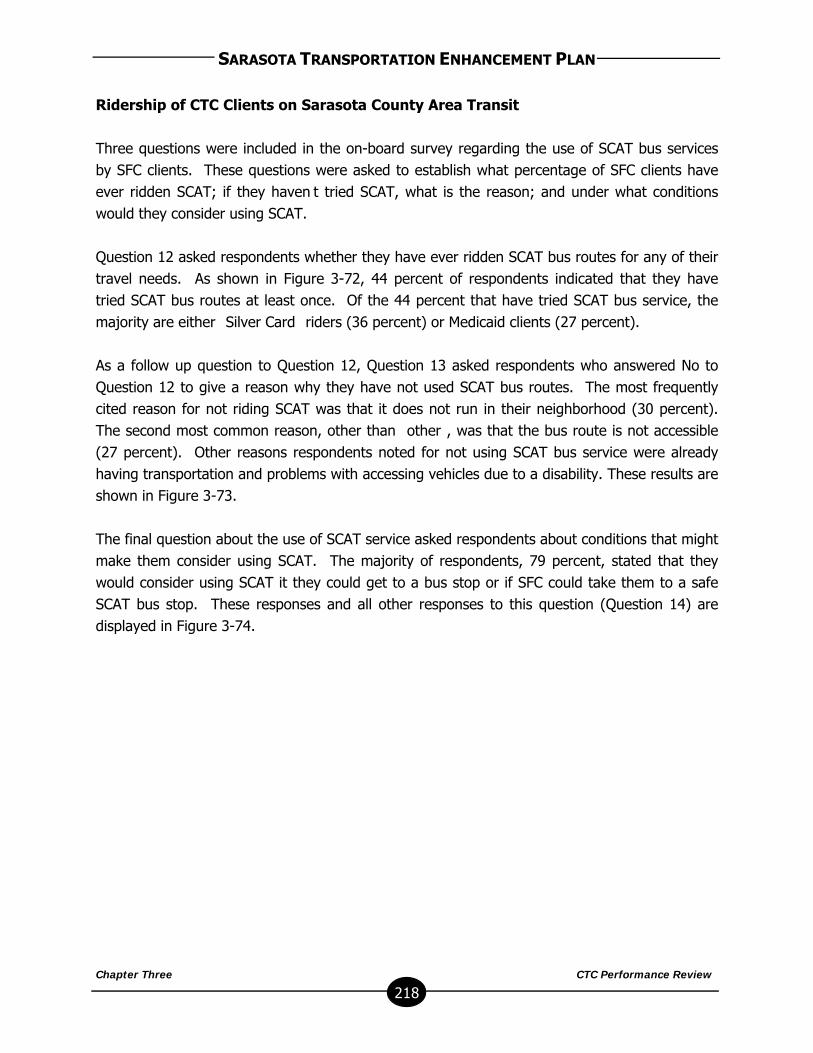
SARASOTA TRANSPORTATION ENHANCEMENT PLAN
Chapter Three CTC Performance Review
218
Ridership of CTC Clients on Sarasota County Area Transit
Three questions were included in the on-board survey regarding the use of SCAT bus servicesby SFC clients. These questions were asked to establish what percentage of SFC clients haveever ridden SCAT; if they haven’t tried SCAT, what is the reason; and under what conditionswould they consider using SCAT.
Question 12 asked respondents whether they have ever ridden SCAT bus routes for any of theirtravel needs. As shown in Figure 3-72, 44 percent of respondents indicated that they havetried SCAT bus routes at least once. Of the 44 percent that have tried SCAT bus service, themajority are either “Silver Card” riders (36 percent) or Medicaid clients (27 percent).
As a follow up question to Question 12, Question 13 asked respondents who answered No toQuestion 12 to give a reason why they have not used SCAT bus routes. The most frequentlycited reason for not riding SCAT was that it does not run in their neighborhood (30 percent).The second most common reason, other than “other”, was that the bus route is not accessible(27 percent). Other reasons respondents noted for not using SCAT bus service were alreadyhaving transportation and problems with accessing vehicles due to a disability. These results areshown in Figure 3-73.
The final question about the use of SCAT service asked respondents about conditions that mightmake them consider using SCAT. The majority of respondents, 79 percent, stated that theywould consider using SCAT it they could get to a bus stop or if SFC could take them to a safeSCAT bus stop. These responses and all other responses to this question (Question 14) aredisplayed in Figure 3-74.
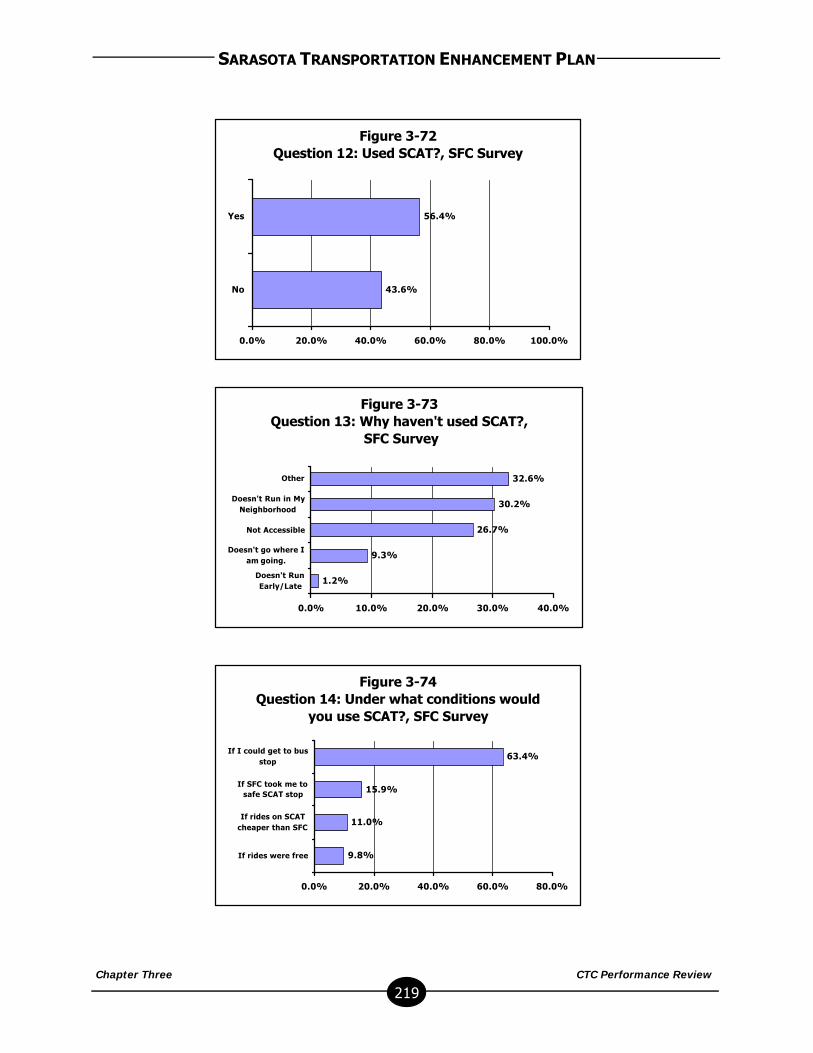
SARASOTA TRANSPORTATION ENHANCEMENT PLAN
Chapter Three CTC Performance Review
219
Figure 3-72Question 12: Used SCAT?, SFC Survey
56.4%
43.6%
0.0% 20.0% 40.0% 60.0% 80.0% 100.0%
No
Yes
Figure 3-73Question 13: Why haven't used SCAT?,
SFC Survey
9.3%
26.7%
30.2%
32.6%
1.2%
0.0% 10.0% 20.0% 30.0% 40.0%
Doesn't RunEarly/Late
Doesn't go where Iam going.
Not Accessible
Doesn't Run in MyNeighborhood
Other
Figure 3-74Question 14: Under what conditions would
you use SCAT?, SFC Survey
11.0%
15.9%
63.4%
9.8%
0.0% 20.0% 40.0% 60.0% 80.0%
If rides were free
If rides on SCATcheaper than SFC
If SFC took me tosafe SCAT stop
If I could get to busstop
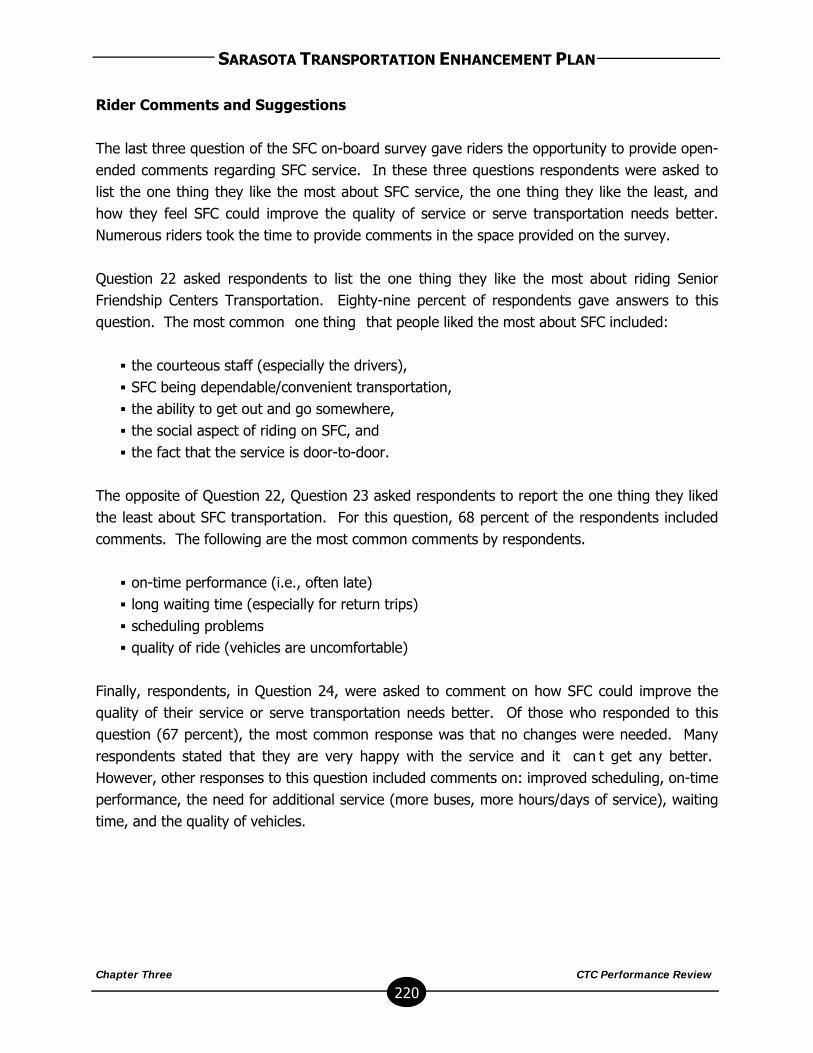
SARASOTA TRANSPORTATION ENHANCEMENT PLAN
Chapter Three CTC Performance Review
220
Rider Comments and Suggestions
The last three question of the SFC on-board survey gave riders the opportunity to provide open-ended comments regarding SFC service. In these three questions respondents were asked tolist the one thing they like the most about SFC service, the one thing they like the least, andhow they feel SFC could improve the quality of service or serve transportation needs better.Numerous riders took the time to provide comments in the space provided on the survey.
Question 22 asked respondents to list the one thing they like the most about riding SeniorFriendship Centers Transportation. Eighty-nine percent of respondents gave answers to thisquestion. The most common “one thing” that people liked the most about SFC included:
§ the courteous staff (especially the drivers),§ SFC being dependable/convenient transportation,§ the ability to get out and go somewhere,§ the social aspect of riding on SFC, and§ the fact that the service is door-to-door.
The opposite of Question 22, Question 23 asked respondents to report the one thing they likedthe least about SFC transportation. For this question, 68 percent of the respondents includedcomments. The following are the most common comments by respondents.
§ on-time performance (i.e., often late)§ long waiting time (especially for return trips)§ scheduling problems§ quality of ride (vehicles are uncomfortable)
Finally, respondents, in Question 24, were asked to comment on how SFC could improve thequality of their service or serve transportation needs better. Of those who responded to thisquestion (67 percent), the most common response was that no changes were needed. Manyrespondents stated that they are very happy with the service and it “can’t get any better.”However, other responses to this question included comments on: improved scheduling, on-timeperformance, the need for additional service (more buses, more hours/days of service), waitingtime, and the quality of vehicles.

SARASOTA TRANSPORTATION ENHANCEMENT PLAN
Chapter Three CTC Performance Review
221
Conclusions
The objective of the Senior Friendship Center paratransit on-board survey was to collect riderdemographic information, travel behavior, satisfaction with specific aspects of SFC paratransitservice, and the use of SCAT bus service by SFC clients. A typical 1999 SFC rider profile wasdeveloped through the compilation of responses to demographic and travel behavior-relatedquestions, as shown in Table 3-15. This rider profile is also compared to the rider profile of thetypical SCAT rider, as taken from the latest SCAT on-board survey. As shown in Table 3-15, thetypical SFC and SCAT rider have many characteristics in common. The main difference,however, is age; the typical SCAT rider is 25 to 44 years old; and the typical SFC rider is 60years or older.
Table 3-15SFC Typical Rider Profile
CharacteristicSFCTypical Rider Profile
SCATTypical Rider Profile
AgeGenderEthnic OriginAnnual Household IncomeLength of UseFrequency of UseAuto OwnershipTrip TypeAlternative Transportation
60 or olderFemaleWhiteLess than $10,0002 years or longer3 or more days per weekNo autosSilver CardWouldn’t make trip
25 to 44FemaleWhiteLess than $15,0005 years or longer4 or more days per weekNo autosCashRide with someone
The bullet points below summarize the findings from the on-board survey analysis.
§ Most SFC riders use the service 3 or more days per week.§ Most riders are long time users of the system§ The most common destinations are doctor/dentist and senior centers.§ The majority of riders pay $1.00 for each trip.§ If SFC service was not available most riders wouldn’t make the trip or they would ride
with someone else.
The majority of respondents are satisfied with the paratransit service they receive from SeniorFriendship Centers. Of particular distinction, riders were overwhelmingly satisfied with drivercourtesy, helpfulness, and assistance. As indicated from Question 6 and the open-endedquestions, some respondents are not happy with the on-time performance of services.

SARASOTA TRANSPORTATION ENHANCEMENT PLAN
Chapter Three CTC Performance Review
222
However, overall, 31 percent of respondents rated quality of service as excellent and 45 percentrated it as good.
Areas that suggest the need for further examination and analysis include data indicating thatmany paratransit users may be able to use and/or have used the SCAT fixed-route bus service.According to the survey findings, 44 percent of survey respondents indicated that they haveused SCAT bus services at least one time. Of further interest is the finding that 63 percent ofthese respondents are either “Silver Card” (ADA paratransit) riders or Medicaid clients. Both ofthese paratransit programs require that individuals use the fixed-route bus service if they areable. The survey results also suggest that lack of access to bus stops may be contributing tothe use of paratransit services among these respondents. This is supported by the surveyfinding that 79 percent of respondents would consider using SCAT bus service if they could getto a bus stop or if SFC could transport them to a safe bus stop. The implementation of a stricterADA paratransit eligibility determination process and/or paratransit feeder services may impactthese findings in the future, as well as result in the delivery of more plentiful, cost effective andefficient services for individuals are not able to use fixed-route bus service.
SARASOTA TRANSPORTATION ENHANCEMENT PLAN
Chapter Three CTC Performance Review
223
CTC PERFORMANCE REVIEW: SUMMARY
Chapter Three has presented a performance review of TD paratransit services coordinated bySenior Friendship Centers, Inc. The performance review of CTC coordinated TD services wasderived from Annual Operating Report (AOR) data submitted to the Florida Commission for theTransportation Disadvantaged (FCTD) on an annual basis, as well data collected from a surveyof CTC bus operators and an on-board passenger survey of CTC paratransit users.
The trend and peer analyses of the TD services provided and coordinated by Senior FriendshipCenters, Inc. as the CTC for Sarasota County had mixed results. The CTC trend analysisshowed that the CTC experienced significant improvements in most measures related thenumber of trips provided through the Sarasota TD program. However, the cost of providingthese trips has consistently increased over the past seven fiscal years. While this indicates somereason for concern, escalating costs may also be partially explained by operational changesexperienced by the CTC during recent fiscal years and inaccurate reporting by agenciesparticipating in the Sarasota TD program.
Similarly, the CTC peer comparison revealed that the CTC is statistically performing below thepeer group mean in many important effectiveness and efficiency measures. Again, many ofthese deficiencies may be related to changes that have occurred recently within CTC operationsand inaccurate data submitted to the CTC by participating agencies. An additional factoraffecting the CTC analysis is the fact that TD services in Sarasota County are provided almostexclusively as door-to-door paratransit. The CTC has not yet maximized the use of existingSCAT fixed-route bus service. It is likely that the CTC will be able to both increase the amountof service provided to TD clients and reduce the costs associated with providing such serviceonce a thorough TD Bus Pass Program has been established and implemented in SarasotaCounty. Given the current configuration of the TD program in Sarasota County, the CTC isdoing a satisfactory job of providing very specialized transportation services (and therefore,relatively expensive service) to the transportation disadvantaged population in the county.
The results from the surveys of CTC bus operators and CTC paratransit passengers reveal thatthere is an overall high level of satisfaction with the paratransit services offered in SarasotaCounty. However, both groups of respondents made some recommendations regarding how toimprove SCAT bus service in the future. Operators and passengers reported problems with on-time performance and the required wait time. Operators agreed with these comments and mostcommonly suggested that scheduling needs to be improved in the paratransit program. Inaddition, operators and passengers reported that Sunday service is both requested and neededby passengers. Finally, many paratransit passengers reported that lack of access to SCAT busstops prohibits their use of the fixed-route bus system.
SARASOTA TRANSPORTATION ENHANCEMENT PLAN
Chapter Three CTC Performance Review
224
The performance reviews presented in this Chapters Two and Three are intended to provide abetter understanding of the performance of the SCAT fixed-route bus services and SFC TDservices currently available in Sarasota County. These reviews are also helpful in identifyingtarget areas for additional attention and improvement. However, it is important to rememberthat performance reviews of this sort do not comprehensively cover all of the objectives of apublic transportation system, nor do they necessarily consider the unique geographic, political,operating, and financial characteristics of such systems. Many system and community goals andobjectives cannot be measured with this mechanism and require additional information or amore subjective evaluation. Nonetheless, the results of the trend and peer review analysesprovide a useful introduction to and a full understanding of the performance of SCAT and SFCand will complement the other components of the Sarasota Transportation Enhancement Plan.


![End$to$End’Speech’Recogni0on’ using’Deep’LSTMs, CTC ...people.csail.mit.edu/jrg/meetings/CTC-Dec07.pdfChinese’Mandarin’conversaonal’telephone’speech’[Liu’etal.]’](https://static.fdocuments.in/doc/165x107/5f50431340398710d16858c5/endtoendaspeecharecogni0ona-usingadeepalstms-ctc-chineseamandarinaconversaonalatelephoneaspeechaliuaetala.jpg)