Chapter Seven: Cost and Financial Analysis Chapter Seven · 7-1 How Much Will the Alternatives...
36
North/South Corridor Alternatives Analysis: Cost and Financial Analysis 7-1 How Much Will the Alternatives Cost? This section presents the costs associated with the various alternatives included for detailed study in the Alternatives Analysis along with the availability of revenues and the resultant financial analysis. A primary intent of the financial analysis is to ensure there are adequate revenues available to fund both the capital costs and the operating costs for a 20-year period. How Are Capital Costs Quantified? This capital cost estimation methodology was designed to produce estimates that can be tracked as the project moves forward from planning and conceptual design to final design and construction, and are consistent with FTA’s Standard Cost Categories (SCC). The major SCCs are listed below: 10 - Guideway and Track Elements 20 - Stations, Stops, Terminals, Intermodals 30 - Support Facilities: Yards, Shops, Admin Buildings 40 - Sitework & Special Conditions 50 - Systems 60 - ROW, Land, Existing Improvements 70 - Vehicles 80 - Professional Services 90 - Unallocated Contingency Capital costs for the first five categories were typically calculated by using unit costs from recent projects and estimated quantities for each component. The costs of procuring right-of-way are difficult to assess at this level of design so a cost allowance was determined and assigned to this category. The professional services categories were calculated as a percentage of construction costs (excluding ROW and vehicle procurement). The specific percentages for these categories are shown in Table 7-1. Estimates were developed in three general steps. First, proposed project improvements were defined for each alternative and the alternatives were divided into alignment segments to simplify the development of capital costs. Project improvements were quantified into units of work (quantities) and assembled into the cost estimate template. Also, appropriate unit pricing was developed, applied to the quantities, and summed into cost categories to complete the cost estimate. All capital cost estimates are presented in 2008 dollars without consideration of future inflation or project staging and scheduling. Year-of-expenditure costs are intended Chapter Seven: Cost and Financial Analysis What is the difference between capital costs and oper- ating costs? Capital costs are the costs for designing and constructing infrastructure, and acquiring ve- hicles and other needed equipment. Operating costs are the costs for operating and maintain- ing the system after it has been constructed. These costs are sometimes referred to as simply as “O & M costs.” Unlike capital costs, operating costs are reoccurring as long as the system is in operation. Table 7-1: Professional Services Percentages for Capital Cost Estimates Source: HNTB Preliminary Engineering 3 Final Design 7 Project Management for Design and Construction 5 Construction Administration and Management 7 Insurance 3 Legal; Permits; Review Fees 3 Surveys, Testing, Inspection 3 Start-up Costs & Agency Force Account Work 1 Total Soft Costs 32 Description Percentage
-
Upload
trinhduong -
Category
Documents
-
view
226 -
download
0
Transcript of Chapter Seven: Cost and Financial Analysis Chapter Seven · 7-1 How Much Will the Alternatives...

North/South Corridor Alternatives Analysis: Cost and Financial Analysis
7-1
How Much Will the Alternatives Cost?This section presents the costs associated with the various alternatives included for detailed study in the Alternatives Analysis along with the availability of revenues and the resultant financial analysis. A primary intent of the financial analysis is to ensure there are adequate revenues available to fund both the capital costs and the operating costs for a 20-year period.
How Are Capital Costs Quantified?This capital cost estimation methodology was designed to produce estimates that can be tracked as the project moves forward from planning and conceptual design to final design and construction, and are consistent with FTA’s Standard Cost Categories (SCC).
The major SCCs are listed below:
�� 10 - Guideway and Track Elements�� 20 - Stations, Stops, Terminals, Intermodals �� 30 - Support Facilities: Yards, Shops, Admin
Buildings �� 40 - Sitework & Special Conditions�� 50 - Systems �� 60 - ROW, Land, Existing Improvements �� 70 - Vehicles�� 80 - Professional Services �� 90 - Unallocated Contingency
Capital costs for the first five categories were typically calculated by using unit costs from recent projects and
Chapter Seven
estimated quantities for each component. The costs of procuring right-of-way are difficult to assess at this level of design so a cost allowance was determined and assigned to this category.
The professional services categories were calculated as a percentage of construction costs (excluding ROW and vehicle procurement). The specific percentages for these categories are shown in Table 7-1.
Estimates were developed in three general steps. First, proposed project improvements were defined for each alternative and the alternatives were divided into alignment segments to simplify the development of capital costs. Project improvements were quantified into units of work (quantities) and assembled into the
cost estimate template. Also, appropriate unit pricing was developed, applied to the quantities, and summed into cost categories to complete the cost estimate.
All capital cost estimates are presented in 2008 dollars without consideration of future inflation or project staging and scheduling. Year-of-expenditure costs are intended
Chapter Seven: Cost and Financial Analysis
What is the difference between capital costs and oper-ating costs? Capital costs are the costs for designing and constructing infrastructure, and acquiring ve-hicles and other needed equipment. Operating costs are the costs for operating and maintain-ing the system after it has been constructed. These costs are sometimes referred to as simply as “O & M costs.” Unlike capital costs, operating costs are reoccurring as long as the system is in operation.
Table 7-1: Professional Services Percentages for Capital Cost Estimates
Source: HNTB
Preliminary Engineering 3
Final Design 7
Project Management for Design and Construction 5
Construction Administration and Management 7
Insurance 3
Legal; Permits; Review Fees 3
Surveys, Testing, Inspection 3
Start-up Costs & Agency Force Account Work 1
Total Soft Costs 32
Description Percentage

Kansas City Area Transportation Authority
7-2
to reflect the cost of construction during a certain period. The estimates presented in this section do not forecast the future cost of construction. Financial models will be used to translate 2008 base-year dollars into year-of-expenditure dollars for the financial analysis.
What Are the Capital Costs for the Alternatives?MAX Alternative
Project improvements were developed based on the definition of the MAX Alternative. Generally the MAX Alternative was assumed to be of the scale of the existing Main Street MAX and the Troost MAX in terms of infrastructure and other capital elements. Unit prices were developed from historical data from the Main Street MAX and the Troost MAX lines; both of which were provided by the KCATA. Unit prices include allowances for the contractor’s margins (profit, overhead etc.) and insurance costs.1
The MAX Alternative is comprised of three BRT routes: Prospect MAX, North Oak MAX, and an extension of the Main Street MAX.
�� The Prospect MAX route has a northern terminus at Truman Road and Grand Boulevard. The route runs east to Prospect Avenue on Truman. At Prospect the route turns south and continues on Prospect to 75th Street.
�� The North Oak MAX route has a northern terminus at North Oak Trafficway and Vivion Road. The line will proceed south on North Oak; it will continue south on Burlington in NKC. After crossing the Missouri River via the Heart of America Bridge, the route will use 3rd Street and will have a southern terminus at the intersection of 3rd Street and Grand Boulevard.
�� The existing Main Street MAX route will be extended 1 Kansas City North/South Corridor AA/DEIS, Methodology for MAX Alternative Capital Cost Estimates, 2/10/09, HNTB. �
to the south and to the southeast. From the existing southern terminus of the Main Street MAX at 47th Street/Cleaver II Boulevard, the line will continue south on Brookside Boulevard, continue on Wornall Road, and terminate at the intersection of 74th Terrace and Wornall Road. The southeast extension of the line would branch from the current line at Cleaver II Boulevard and Main Street, south on Brookside Boulevard and Volker Boulevard then proceed east along Volker Boulevard to Prospect Avenue and Swope Parkway. The route then runs south on Prospect to 75th Street.
The capital cost estimates include the development of transit centers for transferring buses and park and ride lots. These facilities were included to make the MAX Alternative comparable to the Light Rail Alternative. These facilities include:
A transit center and 45-space park and ride lot at Swope Parkway and Prospect on the Prospect MAX route. This is for both the MAX Alternative and the Prospect MAX in the Light Rail Alternative.
�� A transit center and 150-space park and ride lot at 75th and Prospect for the Prospect MAX in the Light Rail Alternative.
�� A transit center and improvements to the existing park and ride lot at 74th Terrace and Broadway.
�� A transit center and an 80-space park and ride lot at 18th and Swift in NKC.
�� A transit center and a 250-space park and ride lot at Vivion and North Oak.
Capital cost estimates for the Main Street MAX route assume that the existing improvements to the roadway, signalization, and stations will be sufficient for the MAX Alternative. Additional capital costs for these cost categories were not added to the Main Street MAX estimates.
North/South Corridor Alternatives Analysis: Cost and Financial Analysis
7-3
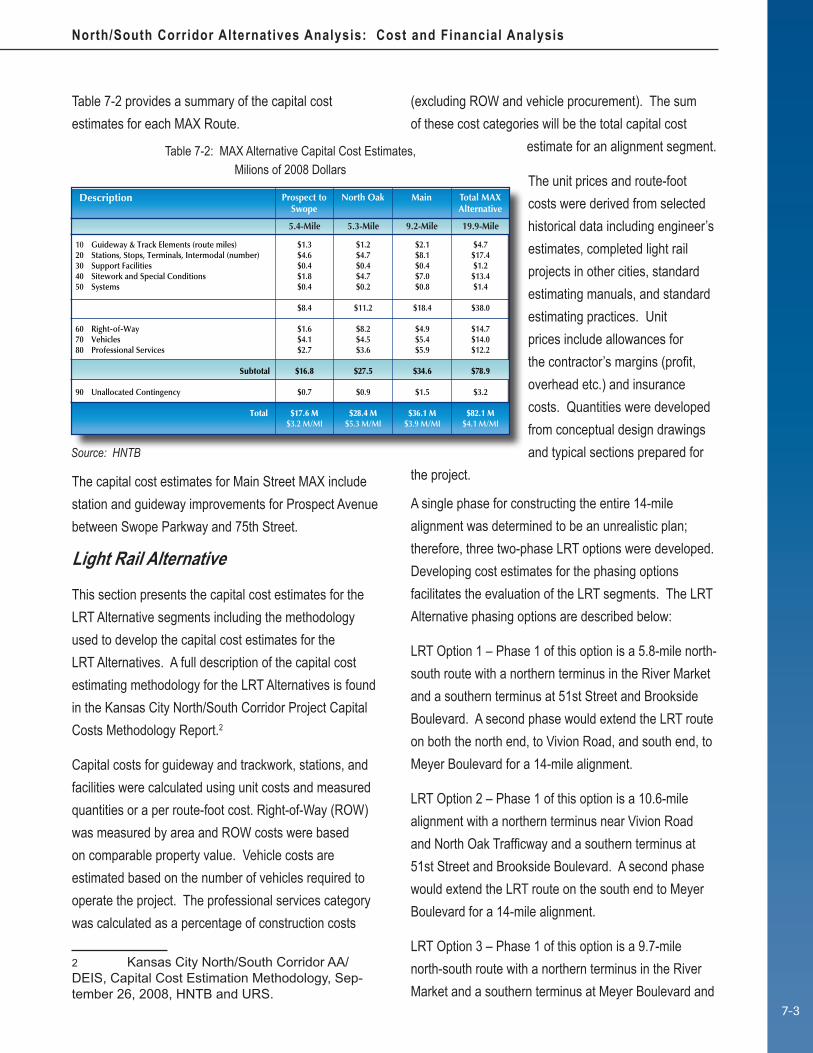
Table 7-2 provides a summary of the capital cost estimates for each MAX Route.
The capital cost estimates for Main Street MAX include station and guideway improvements for Prospect Avenue between Swope Parkway and 75th Street.
Light Rail Alternative
This section presents the capital cost estimates for the LRT Alternative segments including the methodology used to develop the capital cost estimates for the LRT Alternatives. A full description of the capital cost estimating methodology for the LRT Alternatives is found in the Kansas City North/South Corridor Project Capital Costs Methodology Report.2
Capital costs for guideway and trackwork, stations, and facilities were calculated using unit costs and measured quantities or a per route-foot cost. Right-of-Way (ROW) was measured by area and ROW costs were based on comparable property value. Vehicle costs are estimated based on the number of vehicles required to operate the project. The professional services category was calculated as a percentage of construction costs
2 Kansas City North/South Corridor AA/DEIS, Capital Cost Estimation Methodology, Sep-tember 26, 2008, HNTB and URS.
(excluding ROW and vehicle procurement). The sum of these cost categories will be the total capital cost
estimate for an alignment segment.
The unit prices and route-foot costs were derived from selected historical data including engineer’s estimates, completed light rail projects in other cities, standard estimating manuals, and standard estimating practices. Unit prices include allowances for the contractor’s margins (profit, overhead etc.) and insurance costs. Quantities were developed from conceptual design drawings and typical sections prepared for
the project.
A single phase for constructing the entire 14-mile alignment was determined to be an unrealistic plan; therefore, three two-phase LRT options were developed. Developing cost estimates for the phasing options facilitates the evaluation of the LRT segments. The LRT Alternative phasing options are described below:
LRT Option 1 – Phase 1 of this option is a 5.8-mile north-south route with a northern terminus in the River Market and a southern terminus at 51st Street and Brookside Boulevard. A second phase would extend the LRT route on both the north end, to Vivion Road, and south end, to Meyer Boulevard for a 14-mile alignment.
LRT Option 2 – Phase 1 of this option is a 10.6-mile alignment with a northern terminus near Vivion Road and North Oak Trafficway and a southern terminus at 51st Street and Brookside Boulevard. A second phase would extend the LRT route on the south end to Meyer Boulevard for a 14-mile alignment.
LRT Option 3 – Phase 1 of this option is a 9.7-mile north-south route with a northern terminus in the River Market and a southern terminus at Meyer Boulevard and
Table 7-2: MAX Alternative Capital Cost Estimates, Milions of 2008 Dollars
Source: HNTB
Description Prospect to Swope
10 Guideway & Track Elements (route miles)20 Stations, Stops, Terminals, Intermodal (number)30 Support Facilities40 Sitework and Special Conditions50 Systems
60 Right-of-Way70 Vehicles80 Professional Services
Subtotal
90 Unallocated Contingency
Total
$1.3$4.6$0.4$1.8$0.4
$8.4
$1.6$4.1$2.7
$16.8
$0.7
$17.6 M$3.2 M/MI
$1.2$4.7$0.4$4.7$0.2
$11.2
$8.2$4.5$3.6
$27.5
$0.9
$28.4 M$5.3 M/MI
$2.1$8.1$0.4$7.0$0.8
$18.4
$4.9$5.4$5.9
$34.6
$1.5
$36.1 M$3.9 M/MI
$4.7$17.4$1.2$13.4$1.4
$38.0
$14.7$14.0$12.2
$78.9
$3.2
$82.1 M$4.1 M/MI
5.4-Mile 5.3-Mile 9.2-Mile 19.9-Mile
North Oak Main Total MAX Alternative

Kansas City Area Transportation Authority
7-4
Prospect Avenue. A second phase would extend the LRT route on the north end to Vivion Road for a 13.7-mile alignment.
Note that Phase 2 for each option results in the same 14-mile alignment. The segmentation is intended to allow for the assessment of incremental costs and benefits.
During the Alternatives Analysis a number of route variations and options were identified, as explained in Chapter 3. Capital costs for LRT options 1 through 3 were based on the following assumptions regarding these alignment options. These options were selected because they are reflective of the preferred alignment. These options are not likely to have capital costs significantly different than other options under consideration.
�� The “Flyover option” was assumed for the northern terminus at I-35 and North Oak Trafficway
�� The Burlington Street alignment was assumed in NKC
�� The Grand Boulevard alignment was assumed in the Downtown area
�� The Cleaver II alignment was assumed for the east leg with a new Brush Creek crossing from Cleaver II east of The Paseo to Volker Boulevard at Woodland Avenue
�� The grade separation option was assumed along Bruce R. Watkins.
Table 7-3 provides a summary for the capital cost estimates for each of the unique options. Table 7-4 shows the estimates by cost category for each of the six alignment options.
What Are the Operating Costs for the Alternatives?MAX Alternative
Operating costs for the MAX Alternative were
developed from KCATA bus operating costs. KCATA has experience with the costs associated with bus operations and BRT with the operation of Main Street MAX.
KCATA uses a multi-variable operating cost model to
calculate bus operating costs, as shown below:
For KCATA’s MAX large bus, unit costs were modified to increase the Fuel and Tire cost and another category was added to account for the additional expense of the MAX stations. This includes maintenance, service and electric power related. This cost is assessed on a per route-mile basis at $53,042 per route-mile. There was no quantifiable information that vehicle maintenance costs, or other cost components, are higher for MAX. The result is that operating costs for MAX routes are approximately 10 percent higher than for non-BRT large bus routes. The operating cost estimates reflect fully allocated costs. Using this unit cost and the service plan from Chapter 5, annual operating costs were calculated as shown in Table 7-5.
In addition to the operating costs associated with the MAX routes themselves there are operating cost changes resulting from the modifications to the existing bus system. These modifications are explained in Chapter 3. Because the MAX routes will replace existing local service, to an extent, the modifications to the existing bus service actually result in a reduction in operating costs. Thus, the net change in operating cost is significantly less than the operating cost associated with the MAX routes. Table 7-5 also shows the net change in operating cost.
Light Rail Alternative
Because Kansas City does not have an existing light rail system in operation, it is necessary to estimate operating costs using experience from other cities.
Operating Cost = Direct Labor Costs$36.33 X Platform Hours +
Fuel and Tires$0.65 X Total Miles +
Maintenance and Overhead$3.48 X Total Miles

North/South Corridor Alternatives Analysis: Cost and Financial Analysis
7-5
Table 7-3: LRT Alternative Capital Cost Summary Milions of 2008 Dollars
Source: HNTB and URS Corporation, 2008
Table 7-4: LRT Alternative Capital Cost Estimates Milions of 2008 Dollars
Source: HNTB and URS Corporation, 2008
Table 7-5: MAX Alternative Operating Cost Estimates Milions of 2008 Dollars
Table 7-6: Light Rail Alternative Annual Operating Costs Light Rail Alternative Milions of 2008 Dollars
Note: Includes existing MAX operating cost.Source: HNTB and URS Corporation, 2008
Source: HNTB and URS Corporation, 2008
Alignment Option Length Total Cost Cost per Mile
Option 1 Phase 1 - River Market to 51st St.
Option 2 Phase 1 - Vivion Rd to 51st St.
Option 3 Phase 1 - River Market to Meyer Blvd.
Phase 2 Option - Vivion Rd to Meyer Blvd.
5.8 Mi
10.5 Mi
9.7 Mi
13.7 Mi
$365.8 M
$633.1 M
$576.4 M
$845.5 M
$63.3 M/Mi
$60.1 M/Mi
$59.2 M/Mi
$61.8 M/Mi
Description Option 1, Phase 1 River Market
to 51st St
Option 1, Phase 2 Vivion Rd to Meyer Blvd.
Option 2, Phase 1 Vivion Rd to
to 51st St
Option 2, Phase 2 Vivion Rd to Meyer Blvd.
10 Guideway & Track Elements (route-miles)20 Stations, Stops, Terminals, Intermodal (number)30 Support Facilities40 Sitework and Special Conditions50 Systems
Construction Subtotal
60 Right-of-Way70 Vehicles80 Professional Services
Subtotal
90 Unallocated Contingency
Total
Option 3, Phase 1 Market to Meyer Blvd.
Option 3, Phase 2 River Market
to Vivion Rd
$58.2$19.8$39.7$51.9$45.7
$215.3
$9.1$54.4$68.9
$347.7
$18.2
$365.8 M$63.3 M/MI
$134.5$38.9$39.7$168.5$102.1
$483.6
$63.6$96.4$160.2
$803.8
$41.7
$845.5 M$61.8 M/MI
$112.3$32.6$39.7$112.0$78.1
$374.7
$45.9$54.4$125.3
$600.3
$32.7
$633.1 M$60.1 M/MI
$134.5$38.9$39.7$168.5$102.1
$483.6
$63.6$96.4$160.2
$803.8
$41.7
$845.5 M$61.8 M/MI
5.8-Mile 13.7-Mile 10.5-Mile 13.7-Mile
$89.5$29.2$39.7$115.9$76.2
$350.5
$26.7$54.4$112.1
$543.7
$32.7
$576.4 M$59.2 M/MI
9.7-Mile
$134.5$38.9$39.7$168.5$102.1
$483.6
$63.6$96.4$160.2
$803.8
$41.7
$845.5 M$61.8 M/MI
13.7-Mile
Alignment
Main - Waldo - Prospect*
North Oak - Vivion
Prospect - Swope Parkway
Total
$6,337,000
$3,511,000
$3,854,000
$13,702,000
OperatingCost
-$3,659,000
-$828,000
-$2,243,000
-$6,730,000
Bus SystemModifications
$2,678,000
$2,683,000
$1,611,000
$6,972,000
Net OperatingCost
Option Alignment LRT Operating
CostBus System
Modifications
Option 1 Phase 1
Option 2 Phase 1
Option 3 Phase 1
Phase 2 Option
River Market to 51st St.
Vivion Rd to 51st St.
River Market to Meyer Blvd.
Vivion Rd to Meyer Blvd.
$291,000
$1,363,000
$349,000
$1,363,000
$7,848,000
$11,356,000
$10,578,000
$12,750,000
Net Operating Cost
$8,139,000
$12,719,000
$10,927,000
$14,113,000
Kansas City Area Transportation Authority
7-6
Operating costs from comparable light rail systems were compiled from the National Transit Database (NTD).
The estimated unit operating cost used for calculations of annual operating costs is $254 per revenue hour. This figure includes all costs associated with the ongoing operation of the light rail system, including maintenance of vehicles, maintenance of way, and maintenance of stations and other facilities.
Using this unit cost and the estimates of the service plan from Chapter 5, annual operating costs were calculated as shown in Table 7-6.
In addition to the costs associated with operating light rail, there are operating cost changes resulting from the modifications to the existing bus system. These modifications are explained in Chapter 3. Because the LRT line will require supporting bus service, particularly in the Northland, there is a significant increase in bus operating costs.
Table 7-6 shows the net change in LRT operating costs for the four LRT options.
How Will These Transit Alternatives be Funded?KCATA transit capital and operating costs are funded through a mix of local, state and federal revenues, along with operating revenues from passenger fares and advertising. By far, the majority of the current local funding is derived from sales taxes totaling 7/8-cent levied in Kansas City, Missouri. In April of 2008 a 3/8-cent sales tax was extended by the voters for a 15-year period. This tax, along with other existing revenue sources is expected to provide sufficient revenue to maintain current operations through the 15-year period.
A major requirement for the funding of a major transit capital improvement in Kansas City light rail alternative is that the project financing would cover all operating and capital costs for the new system. The improvement could not use revenues directed to the bus system at the
risk of degrading bus service levels or quality. Also, for the purpose of the Alternative Analysis financial planning it is assumed that no Kansas City general fund revenue or KCMO-backed debt will be used for construction or operation of the transit improvement.
The financial analysis for the North/South Corridor Alternatives Analysis was initially to include the preparation of a financial plan in accordance with FTA’s guidance for financial plans for New Starts projects. However, with the defeat of the light rail tax measure in November 2008 it was concluded that a detailed financial plan was unnecessary because the project would not be immediately moving forward. This section describes the financial analysis that was completed for the project.
The primary objectives of the financial analysis were to:
�� Identify and evaluate potential funding sources and financial strategies to implement the alternatives under consideration.
�� Provide a preliminary analysis of the financial feasibility of the build alternatives; financial feasibility was one of the main factors considered during the development of the alternatives.
�� Demonstrate that there will be adequate resources not only to construct and operate the alternatives, but also to operate and maintain them for a 20-year period within the context of the other existing transit obligations of the region.
The financial analysis focused on financing the Light Rail Alternative because the high capital costs associated with this alternative represents a significant challenge for local funding.
MAX AlternativeThe MAX Alternative would likely be developed in stages (i.e., one route at a time) thus spreading the capital costs out over a period of time. A preliminary staging plan was prepared showing the three MAX routes could

North/South Corridor Alternatives Analysis: Cost and Financial Analysis
7-7
be developed over a period of five years. Each MAX route would require three years for development; one year each for preliminary engineering, final design and construction. It is assumed the project could start in 2011 after the completion of the Alternatives Analysis and NEPA process in 2010.
The following Table 7-7 shows the local funding requirement using the assumption of a five-year development period along with the assumption that FTA capital funding through the Very Small Starts program could provide 80 percent of the funding. The increase in net operating costs would require additional local funding as well.
The total funding requirement is greater than KCATA’s current financial capability to fund new projects and programs. The required operating funding will continue, and will continue to grow with assumed rate of cost escalation. Thus, KCATA would require a new revenue source to finance the MAX Alternative.
A 1/8-cent sales tax in Kansas City, Missouri generates approximately $8 million annually. KCATA would require the equivalent of 1/8-cent sales tax beginning in 2012 to provide the funding required to develop and operate the MAX Alternative.
Light Rail Alternative
Anticipated Revenues
During Alternative Analysis Phase I there was considerable discussion and analysis regarding the financing approach to light rail. This discussion occurred among Citizens’ Task Force members, the Kansas City, Missouri City Council and in the larger community. After a review of revenue options, it was concluded that a sales tax was the revenue source that would best meet the needs of the project and would have the greatest likelihood of acceptance among voters.
During the project a conclusion was reached that local financing using a new 3/8-cent sales tax levied in Kansas City, MO was a viable means of funding the construction and ongoing operations of a light rail line. The following assumptions were included in the analysis:
�� The new 3/8-cent sales tax in KCMO would generate $22 to $25 million per year, or about $600 million over a 25-year period.
�� North Kansas City (NKC) would enact a 1/2-cent sales tax, generating
approximately $1.2 million per year, within NKC city limits for 25 years for light rail purposes.
�� Bonds would be sold to finance the local share of the initial capital costs; sales tax receipts would be used to cover annual debt service.
�� Other revenues are projected from KCATA advertising, naming rights and station development.
�� The project financing assumes federal funding for capital costs through FTA’s New Starts program.
�� Sales tax receipts, net of debt service payments, would be sufficient to cover operating and maintenance costs for the 25-year period.
2011
2012
2013
2014
2015
2016
Total
$0.4
$10.7
$26.3
$26.4
$37.8
$0.0
$101.5
$0.3
$8.5
$21.0
$21.1
$30.2
$0.0
$81.2
$0.1
$2.1
$5.3
$5.3
$7.6
$0.0
$20.3
$0.0
$0.0
$0.0
$3.3
$5.4
$9.2
$17.9
$0.1
$2.1
$5.3
$8.5
$13.0
$9.2
$38.2
Year Total Federal
Estimated Capital FundingOperatingFunding
LocalTotalLocal
Table 7-7: MAX Alternative Annual Funding Requirements(Year of expenditure dollars in Millions)

Kansas City Area Transportation Authority
7-8
What Are the Capital and Operating Funding Needs For the Light Rail Alternative?The capital and operating costs for the 14-mile LRT Alternative were projected into year of expenditure (YOE) dollars to determine funding needs using the following assumptions:
�� Project development timing l Completion of the Alternatives Analysis and NEPA
process, and FTA’s New Starts process in 2010 and 2011.
l Preliminary engineering beginning in 2012 requiring 1½ years.
l Final Design beginning in 2013 requiring 2½ years
l Construction and procurement beginning in 2016 requiring 2½ years
l Revenue operations beginning in the second half of 2018
�� Revenue and cost escalation l Capital costs were escalated by 4.5% annually
from 2008 in accordance with the construction schedule.
l Light rail operating costs were escalated by 3.5% annually.
l Sales tax revenues were escalated by 2.5% annually.
The local funding requirement in Table 7-8 assumes 50 percent federal funding to cover capital costs.
The local funding requirement beginning in 2016 exceeds the annual funding from the Kansas City and North Kansas City sales taxes, thus financing the local share through the sale of bonds is required.
A financial analysis was performed that concluded an additional $6.1 million per year would be required to cover the capital and operating costs for the 14-mile Light Rail Alternative. Conceivably this additional funding could come from new state transit funding, or other local sources. An increase in the federal share of capital cost to 60 percent would allow the financing to work with the assumed local funding from the local sales taxes.
Additional detail on the financial analysis can be found in the technical memorandum Light Rail Financial Analysis, HNTB and Oppenheimer and Company, June 2009.
Assessment of the impact of differing assumptions, for example cost escalation and inflation, would be part of the detailed financial assessment and risk assessment which has been deferred.
Risk and Uncertainty
FTA requires an assessment of the risk and uncertainty of the financial analysis and financial plan. Decision makers committing public financial resources to large-scale infrastructure investments must be informed as to the likely range of financial results that may occur. The assessment of risk and uncertainty is intended to explore the range of possible outcomes in the financial analysis.
2011
2012
2013
2014
2015
2016
2017
2018
2019
Total
$10.3
$39.7
$63.9
$50.2
$31.8
$376.0
$389.2
$165.7
$0.0
$1,126.6
$5.1
$19.8
$31.9
$25.1
$15.9
$188.0
$194.6
$82.8
$0.0
$563.3
$5.1
$19.8
$31.9
$25.1
$15.9
$188.0
$194.6
$82.8
$0.0
$563.3
$0.0
$0.0
$0.0
$0.0
$0.0
$0.0
$0.0
$9.6
$19.9
$29.5
$5.1
$19.8
$31.9
$25.1
$15.9
$188.0
$194.6
$92.4
$19.9
$592.8
Year Total FederalOperatingFunding
LocalTotalLocal
Table 7-8: Funding Requirements for the 14-Mile Light Rail Alternative(Year of expenditure dollars in Millions)

North/South Corridor Alternatives Analysis: Cost and Financial Analysis
7-9
Financial projections may be affected by fluctuating economic conditions and depends on the occurrence of future events that cannot be assured.
There are a number of variables that cannot be directly controlled by management and governing bodies. These include inflation; interest rates; construction costs; ridership; and federal, state, and local grant funding levels.
In the case of the Kansas City light rail system the assessment was not conducted because the local funding source did not materialize and the project is not moving forward at this time.


North/South Corridor Alternatives Analysis: Comparison of Benefits
8-1
Chapter Eight: Comparison of Benefits
How Do the Alternatives Compare In Terms of Benefits, Costs, and Meeting Funding Availability?The FTA has a detailed methodology used to evaluate, rate, and recommend funding for New Starts projects request-ing more that $25 million in New Starts funding. In order to be formally evaluated by FTA, a project must develop and submit additional criteria beyond that produced in this AA effort. In light of the lack of local funding, this additional criteria has not been developed.
Accordingly, in lieu of formal FTA rating, this section provides a comparison of the overall performance of the alternatives considered at the final stage of the Alternatives Analysis. The comparison focuses on service effectiveness and cost effectiveness. The comparison is preliminary but provides useful information for future decision making. The alternatives were fully developed with the input of the public and project stakeholders, and capital and operating cost estimates were prepared in accordance with FTA guidelines. Because of the abbreviated Alternatives Analysis, a “formal baseline alternative” as required by FTA was not developed and selected, and the detailed FTA required Cost Effective Index (CEI) was not calculated. These analyses will have to be completed before a New Starts project is able to move forward in the federal funding process.
The comparative analysis summarized in this chapter is for the benefit of local decision-makers who will deter-mine how transit is improved in the future.
To illustrate the differences among the alternatives in terms of effectiveness and cost effectiveness, three scenarios were evaluated for a transit investment in the Corridor. These scenarios are based on the transit alternatives described in previous sections of this report. The assumption is that a transit improvement of some type (rail or bus-based) would be made along each alignment. This is nec-essary to allow for a fair comparison among the alternatives.
The three scenarios are:
1. A 14-mile Light Rail System with MAX BRT on Prospect Avenue
2. A 6-mile Light Rail System (River Market to the Plaza) with
MAX BRT on Prospect and North Oak.
3. A 23-mile MAX BRT System with an expanded MAX route on Main Street/Wornall, and new BRT routes on Prospect and North Oak.
Figure 8-1 on the following page shows these scenarios.
Comparison of Transit Service EffectivenessThe alternatives were evaluated on their effect on mobility in the Corridor in terms of total transit ridership, increases in transit ridership (new riders) and travel time savings.
Comparison of BenefitsThe comparison of the costs and benefits is at the very heart of an alternatives analysis. This chapter provides information on the costs and benefits for the Light Rail Alterna-tives and the MAX Alternative in a compara-tive format. The comparison also includes light rail alignments of different lengths, requiring significantly different levels of funding.
This is information that officials at both the local and federal levels can use to make decisions on the transit investment in the North/South Corridor.

Kansas City Area Transportation Authority
8-2
Figure 8-1: Transit Enhancement Scenarios Cost Benefit Assessment
6-Mile Light Rail System and MAX BRT on Prospect
14-Mile Light Rail System and MAX BRT on Prospect
23-Mile MAX BRT System
!"f$
%&l(
%&n(
%&g(
!"a$
I¹
%&l(
U×
Yü
%&l(
KÆ
!"̀$
BR
UC
E R
. WAT
KIN
S
Downtown
River Market
Union Station/Crown Center
CountryClubPlaza
Kansas City North
Truman Sports
Complex
North Kansas City
Kansas City
MA
IN S
T
51ST ST
63RD ST
GREGORY BLVD
ARMOUR RD
NE VIVION RD
N O
AK
TFW
Y
LINWOOD BLVD
TRO
OST
AV
E.CLEAVER II BLVD
N C
HO
UTE
AU
TFW
Y
PRO
SPEC
T AV
BU
RLI
NG
TON
ST
NE 32ND ST
E 27TH ST
SWOPE PKWY
I0 1 2
Miles
14 Mile Light Rail
Light Rail
Prospect MAX
!"f$
%&l(
%&n(
%&g(
!"̀$
!"a$
I¹
%&l(
U×
Yü
%&l(
KÆ
!"̀$
BR
UC
E R
. WAT
KIN
S
Downtown
River Market
Union Station/Crown Center
CountryClubPlaza
Kansas City North
Truman Sports
Complex
North Kansas City
Kansas City
ARMOUR RD
NE VIVION RD
N O
AK
TFW
Y
LINWOOD BLVD
TRO
OST
AV
E.CLEAVER II BLVD
N C
HO
UTE
AU
TFW
Y
PRO
SPEC
T AV
SWIF
T AV
NE 32ND ST
E 27TH ST
SWOPE PKWY
I0 1 2
Miles
23-Mile MAX System
North Oak MAX
Main Street MAX
Prospect MAX
!"f$
%&l(
%&n(
%&g(
!"a$
I¹
%&l(
U×
Yü
KÆ
!"̀$
Qo
BR
UC
E R
. WA
TKIN
S
Downtown
River Market
Union Station/Crown Center
CountryClubPlaza
Kansas City North
Truman Sports
Complex
North Kansas City
Kansas City
MA
IN S
T
51ST ST
63RD ST
GREGORY BLVD
ARMOUR RD
NE VIVION RD
N O
AK
TFW
Y
LINWOOD BLVD
TRO
OS
T A
V
E.CLEAVER II BLVD
N C
HO
UTE
AU
TFW
Y
PR
OS
PE
CT
AV
BU
RLI
NG
TON
ST
NE 32ND ST
E 27TH ST
SWOPE PKWY
Independence
RaytownI
0 1 2
Miles
6 Mile Light Rail
Light Rail
Prospect MAX

North/South Corridor Alternatives Analysis: Comparison of Benefits
8-3
Table 8-1 shows the total estimated ridership for the three scenarios as defined above. As explained in Chapter 5, ridership forecasts for the Light Rail Alterna-tive were developed using the Aggregate Rail Ridership Forecasting (ARRF) model. The ARRF model is not acceptable to FTA for the formal ridership estimates required for the New Starts program, but it is useful for order of magnitude of comparisons. Ridership for the MAX Alternative was estimated using the experience of Main Street MAX applied to the routes proposed as part of the MAX Alternative. The range presented in Table 8-1 reflects the uncertainty associated with the ridership estimates and the methodology used.
As shown, the 14-mile LRT with Prospect MAX Alterna-tive is estimated to have the highest ridership, but only slightly higher than the 6-mile LRT Alternative. From Table 5-7, 15,000 to 22,000 daily riders were estimated on the 14-mile LRT line and 10,000 to 14,000 riders on the 6-mile LRT line.
Table 8-2 shows the estimate of new riders for the three scenarios. These figures reflect the effectiveness of the alternatives in attracting new ridership to the transit system.
As with total ridership, the 14-mile LRT Alternative at-tracts the highest level of new riders. As shown in Table 8-3 the percent increase in ridership compared with current ridership in the Corridor ranges from 20 to 33 percent for the MAX Alternative to 33 to 54 percent for the 14-mile LRT Alternative. Travel time savings is used by FTA to represent transit user benefits. User benefits also can include other benefits such as reliability and ride quality. User benefits calculated as part of the ridership forecasting process are an important component of the calculation of the CEI used in the New Starts rating pro-cess. Travel time savings is simply the amount of time saved by transit riders collectively, compared to a base-line transit system, as a result of the transit improvement. In this case the baseline was the current transit system. Travel times savings is useful in providing a measure of the effectiveness of transit alternatives in providing a higher level transit service.
Table 8-4 shows estimates of total daily travel time sav-ings in minutes for each of the alternatives.
The 14-Mile LRT alignment is estimated to have signifi-cantly greater time savings by virtue of the faster travel times compared with existing service, and higher rider-ship levels.Table 8-2: New Daily Transit Riders
Table 8-3: New Daily Transit Riders
Table 8-4: Daily Travel Times Savings for Transit Users (minutes)
Source: HNTB and Cambridge Systematics
Source: HNTB and Cambridge Systematics
Source: HNTB and Cambridge Systematics
New Riders
Low
Scenario 1: 14-mile LRT w/Prospect MAXScenario 2: 6-mile LRT w/2 MAX RoutesScenario 3: 23-mile MAX Alternative
6,0005,0003,000
High
14,00011,0006,000
Percent Increase
Low
Scenario 1: 14-mile LRT w/Prospect MAXScenario 2: 6-mile LRT w/2 MAX RoutesScenario 3: 23-mile MAX Alternative
33%29%20%
High
54%48%33%
Travel Time Savings
Low
Scenario 1: 14-mile LRT w/Prospect MAXScenario 2: 6-mile LRT w/2 MAX RoutesScenario 3: 23-mile MAX Alternative
106,65060,93043,050
High
153,40080,97051,660
Table 8-1: Total Daily Transit Ridership
Source: HNTB and Cambridge Systematics
Total Ridership
Low
Scenario 1: 14-mile LRT w/Prospect MAXScenario 2: 6-mile LRT w/2 MAX RoutesScenario 3: 23-mile MAX Alternative
18,00017,00015,000
High
26,00023,00018,000

Kansas City Area Transportation Authority
8-4
Comparison of Cost EffectivenessThe cost effectiveness of a proposed major investment is measured in terms of its added benefits and added costs. Useful measures of cost effectiveness are typi-cally a ratio of a unit of output, such as transit riders, to the cost associated with the output.
Table 8-5 shows the 2008 estimated cost per passenger for the three alternatives. The cost used for the esti-mates is the total of capital and operating costs. Capital costs are annualized using the procedure required by FTA for this type of calculation. The procedure includes using the economic life for assets and a discount rate of ten percent, in accordance with FTA guidance.
For perspective, KCATA’s current Main Street MAX has a total cost per passenger in the range of $3.00 to $3.50.It is important to note that these ratios are not FTA’s Cost Effectiveness Index (CEI).
Table 8-6 uses the same procedure to calculate the cost per new transit rider.
FTA’s Cost Effectiveness IndexFTA procedures currently use the cost per hour of trans-portation system user benefits as the formal measure for a project’s cost effectiveness. The CEI is the measure of cost effectiveness that FTA uses in New Starts project evaluation; it a product of the ridership forecasting pro-cess and is defined as:
Each year FTA establishes thresholds for the CEI as it relates to the FTA project rating process. For FY 2010 a project must have a CEI of $24.49 or less to achieve a Medium rating for cost effectiveness. A Medium rating on cost effectiveness is necessary to qualify for New Starts funding.
CEI was not calculated for the LRT project because of the detailed travel forcasting models were not used.
The FY 2010 Annual Report on Funding Recommenda-tions describes the methodology that FTA uses to evalu-ate and rate candidate New Starts projects. The follow-ing is a link to FTA’s website and the report: http://www.fta.dot.gov/documents/20090508_Release_FY_2010_Annual_Report.pdf
The FTA New Starts program is in a period of transition with the preparation of a new federal transportation au-thorization bill. The Safe, Accountable, Flexible, Efficient Transportation Equity Act: A Legacy for Users (SAFE-TEA-LU), which is the current federal surface transporta-tion act, provides the legislative basis for FTA’s evalu-ation procedure. Procedures for project planning and development for future projects applying to receive New Starts funding will likely be revised.
Because the MARC regional demand forecasting model was not sufficiently developed to accurately assess ridership potential, it was not possible to calculate the formal CEI used in FTA’s New Starts process as part of
CEI = Incremental annualized capital cost + incremental operating cost
Incremental user benefits (ridership x travel time savings)
Table 8-5: Annualized Capital Cost and Operating Cost per Passenger
Source: HNTB
Source: HNTB
Estimated Cost per Passenger
Low
Scenario 1: 14-mile LRT w/Prospect MAXScenario 2: 6-mile LRT w/2 MAX RoutesScenario 3: 23-mile MAX Alternative
$13.22$8.69$4.54
High
$19.09$11.76$5.45
Table 8-6: Annualized Capital Cost and Operating Cost per New Passenger
Estimated Cost per New Rider
Low
Scenario 1: 14-mile LRT w/Prospect MAXScenario 2: 6-mile LRT w/2 MAX RoutesScenario 3: 23-mile MAX Alternative
$24.54$18.17$13.63
High
$57.27$39.97$27.25
North/South Corridor Alternatives Analysis: Comparison of Benefits
8-5
However, actual catalytic effect is very difficult to ac-curately quantity and FTA carefully reviews economic development benefit estimates. There is agreement that given the right market forces and a favorable develop-ment environment supported by local and regional poli-cies that encourage and incent development, transit can help promote development.
Rail transit, with its fixed guideway and well-developed permanent stations, is regarded by many in the indus-try as the type of transit investment that can generate economic development. The industry has less experi-ence with bus rapid transit, but some cities cite economic development benefits similar to rail transit. Two recent BRT examples are Boston’s Silver Line and Cleveland’s Euclid Corridor BRT.
Funding RequirementsTotal costs, including capital and operating expenses, and potential revenue and other funding options were analyzed as part of the AA project. The cash flow analy-sis presented in Chapter 7 addresses these questions relative to the Light Rail Build Alternative.
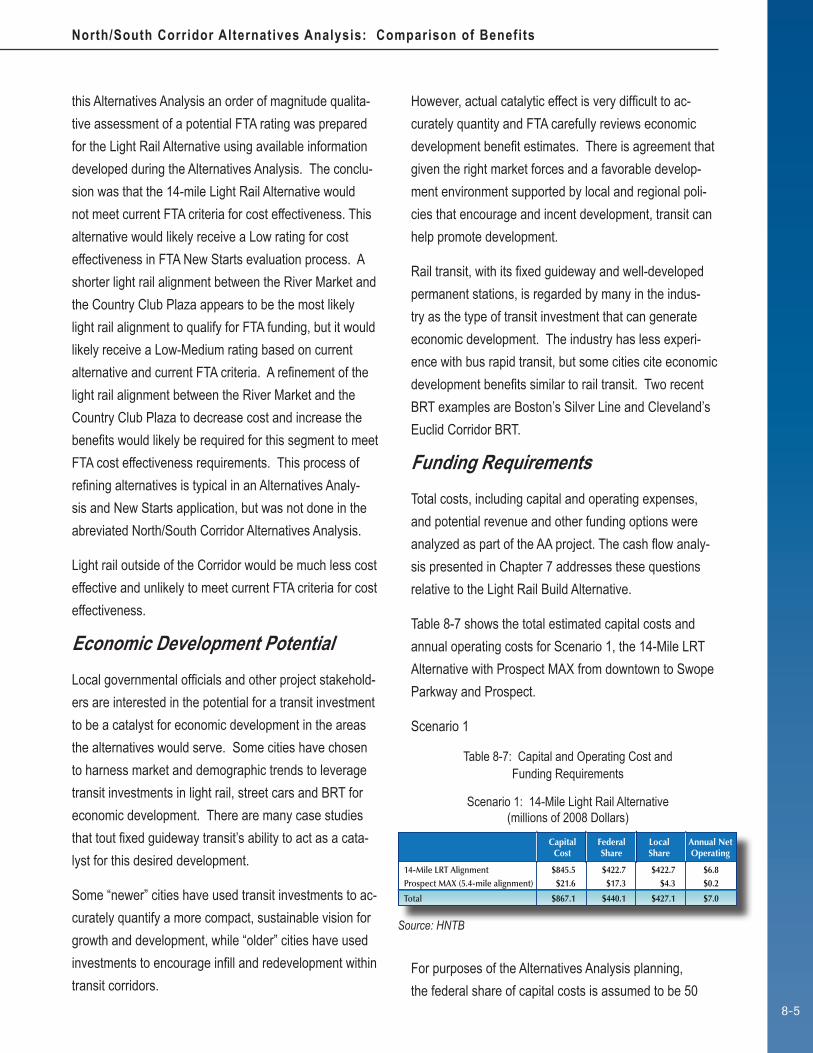
Table 8-7 shows the total estimated capital costs and annual operating costs for Scenario 1, the 14-Mile LRT Alternative with Prospect MAX from downtown to Swope Parkway and Prospect.
Scenario 1
For purposes of the Alternatives Analysis planning, the federal share of capital costs is assumed to be 50
this Alternatives Analysis an order of magnitude qualita-tive assessment of a potential FTA rating was prepared for the Light Rail Alternative using available information developed during the Alternatives Analysis. The conclu-sion was that the 14-mile Light Rail Alternative would not meet current FTA criteria for cost effectiveness. This alternative would likely receive a Low rating for cost effectiveness in FTA New Starts evaluation process. A shorter light rail alignment between the River Market and the Country Club Plaza appears to be the most likely light rail alignment to qualify for FTA funding, but it would likely receive a Low-Medium rating based on current alternative and current FTA criteria. A refinement of the light rail alignment between the River Market and the Country Club Plaza to decrease cost and increase the benefits would likely be required for this segment to meet FTA cost effectiveness requirements. This process of refining alternatives is typical in an Alternatives Analy-sis and New Starts application, but was not done in the abreviated North/South Corridor Alternatives Analysis.
Light rail outside of the Corridor would be much less cost effective and unlikely to meet current FTA criteria for cost effectiveness.
Economic Development PotentialLocal governmental officials and other project stakehold-ers are interested in the potential for a transit investment to be a catalyst for economic development in the areas the alternatives would serve. Some cities have chosen to harness market and demographic trends to leverage transit investments in light rail, street cars and BRT for economic development. There are many case studies that tout fixed guideway transit’s ability to act as a cata-lyst for this desired development.
Some “newer” cities have used transit investments to ac-curately quantify a more compact, sustainable vision for growth and development, while “older” cities have used investments to encourage infill and redevelopment within transit corridors.
Table 8-7: Capital and Operating Cost and Funding Requirements
Scenario 1: 14-Mile Light Rail Alternative (millions of 2008 Dollars)
Source: HNTB
CapitalCost
14-Mile LRT AlignmentProspect MAX (5.4-mile alignment)
Total
$845.5$21.6
$867.1
FederalShare
$422.7$17.3
$440.1
Local Share
$422.7$4.3
$427.1
Annual Net Operating
$6.8$0.2
$7.0

Kansas City Area Transportation Authority
8-6
For purposes of the Alternatives Analysis planning, the federal share of capital costs is assumed to be 50 per-cent for the rail alignment and 80 percent for the MAX portion of the project. For the LRT portion of the project it is assumed for purposes of the Alternatives Analysis that the $182.9 million local share would be funded by a new sales tax dedicated to the project. Table 7-7 shows a preliminary pro forma for this financing. The sales tax could be used to finance bonds to cover the capital costs, as well as the net operating cost. The net operat-ing cost is the total cost of operating the LRT line, less the savings from reduced bus operations and passenger fares.
The local share requirements for the two MAX routes are such that the costs might be funded on a pay-as-you-go basis. It is assumed that the two routes would be implemented sequentially and the additional costs could be absorbed into KCATA’s capital and operating bud-gets. With the assumption of federal funding to cover 80 percent of capital costs, no additional local financing is assumed to be required for the MAX portion of this scenario.
Table 8-9 shows the total capital costs and annual oper-ating costs for Scenario 3, the MAX Alternative.
Scenario 3
With the assumption that the federal share of capital costs would be 80 percent for the three MAX routes, the resultant local share would be $22.4 million and the an-
percent for the rail alignment and 80 percent for the MAX portion of the project. It has been FTA’s practice to allow up to 80 percent for BRT projects while generally limiting rail projects to no more than 50 percent funding or less. For the LRT portion of the project, the $422.7 million would be funded by a new Kansas City 3/8-cent sales tax and proceeds from the North Kansas City TDD. Table 8-8 shows the pro forma for this financing. The local sales tax would be used to finance bonds to cover the capital costs, as well as the net operating cost. The net operating cost is the total cost of operating the LRT line, less the savings from reduced bus operations and passenger fares.
The local share requirements for the Prospect MAX are such that the costs might be funded on a “pay-as-you- go basis”. That is, the capital costs could be funded without having to borrow through the selling of bonds. It is assumed that the three routes would be implemented sequentially and the additional costs could be absorbed into KCATA’s capital and operating budgets. With the assumption of federal funding to cover 80 percent of capital costs, no additional local financing is assumed to be required.
Table 8-8 shows the total estimated capital costs and annual operating costs for Scenario 2, the 6-Mile LRT Alternative with North Oak MAX from downtown to Vivion and North Oak, and Prospect MAX from downtown to 75th Street and Prospect.
Scenario 2
Table 8-8: Capital and Operating Cost and Funding Requirements
Scenario 2: 6-Mile Light Rail Alternative(millions of 2008 Dollars)
Source: HNTB
CapitalCost
6-Mile LRT AlignmentNorth Oak MAXProspect MAX (8.8-mile alignment)
Total
$365.8$32.9$37.3
$436.1
FederalShare
$182.9$26.3$29.9
$239.1
Local Share
$182.9$6.6$7.5
$197.0
Annual Net Operating
$4.1$1.8$0.3
$6.3
Table 8-9: Estimated Capital and Operating Cost and Funding Requirements
Scenario 3: MAX Alternative(millions of 2008 Dollars)
Source: HNTB
CapitalCost
Main Street MAX (upgraded)North Oak MAXProspect MAX (8.8-mile alignment)
Total
$41.5$32.9$37.3
$111.8
FederalShare
$33.2$26.3$29.9
$89.4
Local Share
$8.3$6.6$7.5
$22.4
Annual Net Operating
$0.8$1.8$0.3
$3.0

North/South Corridor Alternatives Analysis: Comparison of Benefits
8-7
nual net operating cost would be $3.0 million. Even if the project implementation was phased, it would be unlikely that the local share requirements for the three MAX routes could be funded on a pay-as-you-go basis using existing revenues. New revenue for Kansas City’s share and new revenue from North Kansas City and Gladstone would be required. This revenue could either be derived from a new tax, or from current general revenues.
Financial Feasibility Financial feasibility is a determination whether the project can be developed, and successfully operated once developed. When faced with major capital projects such as a light rail system, local decision-makers need to know the adequacy of projected revenues needed to fund operating, debt service and other costs. If revenues are adequate to cover all costs, the proposed project is financially feasible.
The Light Rail alternatives would be financially feasible if the appropriate level of dedicated local sales taxes or other revenues were committed and in place for the life of the project. Structuring the financing for light rail to separate it from KCATA’s current general finances is a prudent approach that will ensure the existing bus and MAX system is not degraded in any way due to the fund-ing requirements of light rail. It is assumed that the MAX portions of the LRT Alternatives are such that they may be funded through growth in revenues currently available to the KCATA.
The MAX Alternative, because of its size and cost, would likely require additional funding for implementation and operation. Assuming that the cities of North Kansas City, Gladstone and Kansas City would share the capital and operating cost of the North Oak MAX, and Kansas City would fund the expanded Main Street MAX and Prospect MAX entirely, and assuming these MAX lines replace ex-isting local bus services, the additional funding require-ment would be approximately $3 million per year. Table 8-10 shows how the funding for the MAX routes could be shared.
If the three MAX routes were implemented consecutively over a period of nine years, Kansas City could fund its additional cost with approximately $3 million annually. This is the equivalent of less than a 1/8-cent sales tax. Because of the relatively low local share and the as-sumption of staged implementation, the implementation of the three new MAX routes could be financed on a pay-as-you-go basis if added operating funds are identified or existing funding sources grow. Financing through the sale of bonds would not be required.
No assumption is made regarding the source of the additional $3 million per year required for the new MAX routes. Potential sources include additional funding from Kansas City, Missouri, or additional funding from the state of Missouri. Currently KCATA receives a small amount of state funding; transit advocates in Missouri are attempting to secure a substantial increase in state funding for KCATA and other transit agencies statewide.
Assuming the receipt of additional funding of approxi-mately $3 million per year, the MAX Alternative would be financially feasible.
Table 8-10: Estimated Capital and Operating Cost and Funding Requirements by City
Scenario 3: MAX Alternative(millions of 2008 Dollars)
Source: HNTB
CapitalCost
Kansas CityNorth Kansas CityGladstone
Total Funding
$19.6$2.7$0.1
$22.4
Annual Operating
$2.5$0.2$0.3
$3.0

Kansas City Area Transportation Authority
8-8

North/South Corridor Alternatives Analysis: Conclusions
9-1
IndexChapter Nine: Conclusions
What Are the Conclusions from the Alternatives Analysis?This chapter summarizes the conclusions from the Alter-natives Analysis regarding a major transit improvement in the North/South Corridor and the steps that are required to achieve the improvements.
What Is the Status of the Alternatives Analysis? The Alternatives Analysis is complete, based on a revised and abbreviated approach. Several factors were considered in the revised approach to completing the Alternatives Analysis:
1. With the defeat of the light rail funding measure in November 2008 in Kansas City, Missouri, local funding will not be available for the light rail build alternative and in the short term the LRT alternative will not be advanced for funding under the Federal Transit Administration (FTA) New Starts program.
2. The regional demand forecasting model maintained by the Mid America Regional Council (MARC) needs to be upgraded to meet FTA standards for investment-level forecasts required for a New Starts application.
3. Additional local funds needed to fully develop factors for the formal FTA evaluation and updating of the MARC model, are not immediately available due to the defeat of the tax vote.
Although the regional model was not used for ridership forecasting, information on the costs and benefits of a Light Rail Alternative and a MAX Alternative were devel-oped to provide local decision-makers information that will help determine how the region can pursue improved
transit in this corridor.
The AA was conducted following FTA requirements, but because it was concluded before all FTA New Starts criteria were ad-dressed, it does not fully meet all of FTA’s requirements for an Alternatives Analysis. If the KCATA decides to pursue New Starts funding for a major transit investment, the Alternatives Analysis will need to be complet-ed. Among the additional tasks that would need to be completed are modeled ridership forecasts and the completion of the FTA
cost effectiveness evaluation. There is also additional environmental analyses that must be completed leading to the Draft Environmental Impact Statement (DEIS).
What Is the Status of Transit in the North/South Corridor?Kansas City’s North/South Corridor is the location of many of the region’s most important activity centers and has the greatest concentration of transit service in the region. Transit is an important part of the Corridor’s transportation system supporting business and recre-ational activities in areas such as the Northland, River-market, Downtown, Crossroads, the Country Club Plaza, Brush Creek, and Watkins/Prospect areas. Transit is
ConclusionsAlthough the Alternatives Analysis was completed prior to developing all informa-tion required for an FTA rating, the project did develop a great deal of information and important conclusions that local decision-makers can use to improve transit service in the North/South Corridor. The Corridor is and will continue to be one of the most important travel corridors in the region and transit im-provements are both needed and warranted. This chapter provides insight into the funding possibilities for major transit improvements and outlines steps that should be taken to achieve the improvements.

Kansas City Area Transportation Authority
9-2
also very important in meeting the mobility needs of the Corridor’s lower income, elderly and disabled residents. The North/South Corridor includes many neighborhoods with concentrations of lower income residents and other population groups with special mobility needs.
Transit service in the Corridor is primarily local bus ser-vice with some weekday peak period express bus ser-vice available in parts of the Corridor. The Main Street MAX bus rapid transit service established in July 2005 represents a major improvement in transit service in the corridor. MAX, which runs between downtown and the Plaza with a service extension to 75th Street, has been very popular and has achieved ridership increases of over thirty percent.
The North/South Corridor will remain one of the most important travel corridors in the region in the future. Population is forecast to increase, particularly in the part of the Corridor north of the Missouri River and neigh-borhoods in Midtown and near the Plaza. Residential population in the River Market, Downtown, Crossroads District and Crown Center has grown dramatically in recent years and will continue to grow as the region’s population returns to housing in the commercial core. Employment downtown and in the Plaza is forecast to grow, and employment overall in the Corridor is expect-ed to grow by 32 percent.
Transit service will continue to be an important part of the Corridor’s transportation system in the future and improvements to enhance this service will continue to be needed.
What Kinds of Transit Improve-ments Are Preferred in the North/South Corridor?It is clear that the community supports transit improve-ments in the North/South Corridor. The vote in favor of the 23-mile light rail alignment in November of 2006 sent a message that Kansas Citians will support a fixed guideway transit system serving the City’s primary
transportation corridor under some circumstances. Input received during the Alternatives Analysis from the general public, governmental officials and various stake-holder organizations was overwhelmingly supportive of improved transit in general. Rail transit is supported as evidenced by the November 2006 vote, but as the November 2008 funding initiative defeat indicated, only if it is financially and, technically feasible and can address local issues and concerns.
Two alternative approaches to improved transit were studied in the Alternatives Analysis:
1. A 14-mile light rail alignment running the length of the Corridor (with several phasing options)
2. A 23-mile MAX system that would provide en-hanced transit service similar to the current Main Street MAX throughout the Corridor.
Both of these alternatives would have corresponding improvements in local bus service to support the fixed guideway transit. The Light Rail Alternative could also consist of a shorter rail alignment or be implemented in phases.
These alternatives were developed with consideration for prior transportation and development studies on the Corridor and the region. The alternatives were further developed during the Alternatives Analysis through a combination of technical work and public and stake-holder input.
The two alternatives (LRT and MAX) differ considerably in terms of capital and operating cost, and ridership and other benefits. The alternatives do address the needs in the Corridor as well as the community’s expectations. The alternatives will serve as a guide to the develop-ment of transit improvement plans for the Corridor in the future.

North/South Corridor Alternatives Analysis: Conclusions
9-3
What Is the Likelihood That the Proposed Transit Improvements Would Receive Federal Funding? One of the main objectives of the revised Alternatives Analysis was to answer the question regarding the likeli-hood of receiving FTA funding. FTA uses a structured approach to the evaluation and selection of transit proj-ects for funding under the New Starts program. Federal funding for major transit investments is limited, and the nation-wide competition for funding is intense. There are many more applications for federal transit funding than there are funds.
The FTA New Starts program is in a period of transition with the preparation of a new federal transportation bill. SAFETEA-LU, the current federal surface transportation act, provides the legislative basis for FTA’s evaluation procedure. Procedures for project planning and develop-ment for future projects applying to receive New Starts funding will likely be revised. However, for this AA the current FTA project evaluation criteria were used as the basis for assessing the prospects for federal funding. Transit projects are rated as High, Medium or Low de-pending upon how well the project conforms to the New Starts criteria. Obtaining a Medium rating is the objective in order to qualify for New Starts funding.
Cost Effectiveness RatingBecause MARC’s regional demand forecasting model was not used to assess ridership potential, it is not pos-sible to calculate an acceptable CEI is a critical measure used in FTA’s New Starts process. Estimates of the CEI were prepared for the Light Rail Alternative using available information developed during the Alternatives Analysis. The conclusions of the cost effectiveness analysis were:
�� The 14-mile Light Rail Alternative would not meet to-day’s FTA’s criteria for cost effectiveness and would receive a Low rating in this category.
�� A shorter light rail alignment between the River Market and the Country Club Plaza is the most likely light rail alignment to qualify for FTA funding, but under current FTA New Starts requirements, it would likely receive a Low-Medium rating.
�� Light rail outside of the Corridor is less cost effective.
�� A refinement of the light rail alignment between the River Market and the Country Club Plaza to decrease cost and increase the benefits would be required for the project to meet FTA cost effective-ness requirements.
�� The MAX Alternative would likely be viewed fa-vorably by FTA and would be eligible for up to 80 percent FTA funding for the capital costs.
An assessment of the 14-mile Light Rail Alternative was conducted to assess the alignment’s viability relative to FTA New Starts land use criteria1. The analysis was based on the FTA land use evaluation process and exist-ing land use, current comprehensive and development plans and other information developed during the Alter-natives Analysis. The assessment concluded that none of the alignment segments provide a strong case for benefiting greatly from, or supporting, a light rail line, in their current conditions. However, several of the market areas have the potential to be redeveloped to become more transit-supportive, or transit-oriented. Proposed and existing local plans and policies are an improvement over previous plans, but do not offer incentives that will be specific to transit-related development. Even though local governments are looking to a transit investment as a catalyst for development, they have not yet enacted all the policies and incentives that must be in place to make this happen. Among the land use assessment’s conclu-sions were:
1 Kansas City North/South Corridor AA/DEIS, Land Use Assessment – Revised, May 6, 2009, HNTB.�

Kansas City Area Transportation Authority
9-4
�� Overall, the alignment ranks Medium-High for employment served, with over 230,000 jobs, but it ranks in the Low-Medium category for population density with less than 5,000 population per square mile.
�� Parking policy in the downtown area rates poorly in the assessment. Downtown Kansas City has approximately 4.0 parking spaces per 1,000 SF of development. Current practice appears to continue this trend in development. Parking cost is in the Low-Medium rating.
�� The station areas that were historically developed in an urban pattern with higher densities, a grid street network, and a general availability of pedes-trian facilities provides a solid framework for future redevelopment.
�� Positive transit-supportive land use examples are seen in the redeveloping River Market area, the new Power and Light District downtown, market-driven adaptive reuse in the Crossroads, older mixed-use neighborhoods in the Midtown district, and Country Club Plaza.
�� The Northland, Brush Creek and Watkins areas consist of largely auto-oriented development and are unlikely to change significantly.
�� Adoption of proposed changes to the Kansas City zoning code to allow mixed-use development and include the concept of transit-supportive overlays is required in order to improve the “plans and policies” rating.
Which Transit Improvement in the North/South Corridor Should be Pursued?The decision regarding the approach to transit improve-ments is a local decision. The decision whether the project will receive federal funding is a federal decision.
Referring to the three transit enhancement scenarios described in Chapter 8, the 14-mile Light Rail Alterna-tive is estimated to attract higher ridership levels than the 6-mile Light Rail Alternative or the MAX alternative, but the MAX Alternative would have lower costs and a lower cost per passenger. The table below shows these figures for the three scenarios.
Chapter 8 provides additional information that further distinguishes the alternatives from one another.
This comparison of alternatives highlights the tradeoffs that are part of the decision-making process. The Light Rail Alternative is more effective because it is estimated to attract higher ridership. But the MAX Alternative is more cost effective because the cost per passenger is lower.
The North/South Corridor warrants an enhanced transit system. The presence of the regionally important activ-ity centers and the existing and future development and demographics support the premise that improved transit is warranted.
Based on the Alternatives Analysis the MAX Alternative appears to be the best fit for the Corridor.
�� MAX service can provide an attractive service given the population and employment densities in the Cor-ridor. This is particularly the case in the Northland and south of the Country Club Plaza where devel-opment patterns are much less dense than in the commercial core between downtown and the Plaza.
�� The lower cost of the MAX Alternative requires less funding, making financing of the local share of the project easier to accomplish.
Source: HNTB
Table 9-1: Annualized Capital Cost per Passenger
Low
Total Ridership Capital Cost Cost per Passenger
High (millions) Low High
18,00017,00015,000
26,00023,00018,000
26,00023,00018,000
$867.1$436.1
$111.8
$13.22$8.69
$4.54
Scenario 1: 14-mile LRT w/Prospect MAXScenario 2: 6-mile LRT w/2 MAX RoutesScenario 3: 23-mile MAX Alternative

North/South Corridor Alternatives Analysis: Conclusions
9-5
�� The MAX Alternative is much more likely to receive federal funding than the 14-mile Light Rail Alterna-tive.
Regarding rail transit:
�� The 6-mile Light Rail scenario is more cost effec-tive than the full 14-mile Light Rail alternative, and provides greater benefits in terms of higher ridership compared to MAX.
�� The 6-mile Light Rail Alternative could be com-petitive for FTA New Starts funding, if costs were reduced.
The question before local transit decision-makers is whether a rail transit investment best meets local goals for the Corridor of Kansas City or if other transit alterna-tives like the MAX alternative best meet local goals..
What Are the Next Steps Required to Achieve a Major Transit Investment?There are several steps that the community must take to pursue transit improvements in the Corridor, be they ad-ditional MAX routes or a rail transit system. The require-ments may vary slightly between the alternatives, but the following is a general guide for the improvements.
1.� Complete FTA Alternatives Analysis and New Starts Requirements
�� Formal ridership modeling and forecasts must be completed if the project is to become a federally funded federally-funded New Starts project.
�� A detailed financial plan must be prepared based on forecasts of future costs and available revenues. The plan must ensure that the KCATA can continue to operate the current bus system while developing and operating any new transit improvements.
�� The preferred alignment for the Light Rail Alternative was not fully decided upon. Questions on the details of the alignment in the downtown area and Brush
Creek corridor must be resolved. Details of the MAX alignments also require attention.
�� The KCATA, the City of Kansas City, and the region acting through the MPO must formally adopt a Lo-cally Preferred Alternative (LPA). The Alternatives Analysis stopped short of recommending an LPA because of the uncertainty regarding funding. The community must select transit improvement ap-proach that will be pursued.
2.� Apply for formal FTA review and evaluation based on the completed Alternatives Analysis and a New Starts application. The KCATA can then request authorization to begin preliminary engineering on the LPA.
3.� The community must secure a permanent commit-ted funding source for the local share of the capital cost and the operating funding for any new transit investment.
�� The funding source must allow the continued opera-tion of the current bus system. A sound financial plan is a requirement for the receipt of FTA New Starts funding.
4.� The community (both individual local jurisdictions and regionally) must adopt transit supportive local and regional policies. The development patterns in Kansas City are not supportive of high capacity transit services outside of the Corridor between the River Market and the Country Club Plaza. These policies are required because land use policies are an important of FTA’s New Starts criteria, but also because supportive development is crucial to the long term success of a high capacity transit system.
�� Development codes and ordinances that promote higher density and mixed use developments should be enacted.
�� Development plans and ordinances that support

Kansas City Area Transportation Authority
9-6
density around station areas must be enacted.
�� Parking policies must be revised to be more sup-portive of transit. Parking policies and subsidies that result in high parking ratios are detrimental to transit and result in low ratings in the New Starts process. Even in the CBD, parking ratios are very high and parking costs are low resulting in a difficult competitive position for transit. Parking policies are one of the factors that FTA considers in rating projects for New Starts funding.
�� Regional Plans and Policies that support density in the central area should be enacted.
What Is Being Done in the Community to Pursue Improved Transit?The community is addressing some of the steps re-quired for improved transit service.
�� The City of Kansas City has prepared a revised de-velopment ordinance that includes transit supportive provisions. The ordinance is being reviewed by City Council.
�� The Mid America Regional Council, the KCATA and other regional transit providers have embarked on a project to prepare an implementation plan for expanded bus rapid transit routes in several urban travel corridors, including the North/South Corridor.
�� MARC, the KCATA and representatives of subur-ban communities have embarked on a study of suburban travel corridors to identify the preferred approach to creating a transit improvement plan for these corridors outside the North/South Corridor.

North/South Corridor Alternatives Analysis: Glossary
10-1
Active Warning Device: Flashing lights and/or gates used at grade crossings.
Alignment: Refers to both horizontal and vertical placement of the guideway within the corridor.
Arterial: A major roadway thoroughfare, used primarily for through traffic rather than for access to adjacent land, that is character-
ized by high vehicular capacity and continuity of movement.
At-Grade Crossing: The surface where the rail and roadway (or pathway) cross at the same level.
Bus Rapid Transit: rubber-tired rapid transit service that combines stations, vehicles, running ways, a flexible operating plan, and technology into a high quality, customer focused service that is fast, reliable, comfortable and cost efficient.
Capital Costs: Non-recurring costs required to construct (or improve) the transit system. Capital costs include the purchase of loco-motives, passenger cars, construction or rehabilitation of stations, tracking, maintenance facilities, and the design and administrative costs associated with these improvements.
Catenary: Overhead wires of a traction electrification system (TES) that contain both messenger overhead catenary system (OCS) from which the contact wire is suspended, and contact wires, the wire that provides power through direct contact.
Commuter Rail: Service between a central city and its suburbs, running on a railroad right-of-way and often shared with freight RR. Examples include the Sound Transit’s commuter rail system in Puget Sound, Metrolink in Los Angeles, California and Boston’s MBTA Purple lines.
Consist: The number of cars or coaches forming a train.
Cost Effectiveness Index (CEI): A measure used in FTA’s New Starts process to evaluate caudate projects. The CEI is the ratio of incremental cost to transportation system user benefits.
Chapter Ten: Glossary

Kansas City Area Transportation Authority
10-2
Double Track: Two sets of main line track located side by side, most often used for travel in opposite directions, like roadways.
Environmental Impact Statement (EIS): A comprehensive study of likely environmental impacts resulting from major federally as-
sisted projects; statements are required by the National Environmental Policy Act (NEPA).
Embedded Track: Rail that has been embedded in the road-
way to allow other traffic and pedestrians to move safely and smoothly across the track.
Exclusive Right-of-Way: A right-of-way that is to be used only for the rail line (either freight or passenger or both). It is usually com-
pletely grade-separated from other types of vehicles.
Express Bus: A bus that operates a portion of the route without stops or with a limited number of stops.
Federal Transit Administration (FTA): The agency of the U.S. Department of Transporation, which administers the federal program
of financial assistance to public transit.
Feeder Bus: A bus service that picks up and delivers passengers to a rail rapid transit station, or express bus stop.

North/South Corridor Alternatives Analysis: Glossary
10-3
Fixed Guideway System: A system of vehicles that can operate only on its own guideway constructed for that purpose (e.g. light
rail).
Flashing Light Signals: Used with the cross buck signs at railroad crossings. When the lights are flashing, the motorist or pedes-
trian must stop.
Frequency: A term used to describe the level of transit service.
Geometrics: An engineering term that refers to the design of the tracks.
Grade Crossing: The area along the track where a roadway or pathway crosses.
Grade-Separated: Crossing lines of traffic that are vertically separated from each other (i.e. a roadway that goes over a railroad
track).
Heavy Rail: An electric passenger railway with no roadway or pedestrain crossings that carries a large volume of people on exclu-
sive right-of-way. Subways like San Francisco’s BART or Washington, DC’s Metrorail are examples of heavy rail.
Kiss and Ride: A place where commuters are driven and dropped off at a station to board a public transportation vehicle.
Layover Time: Time build into a schedule between arrival at the end of a route and the departure for the return trip, used for the
recovery of delays and preparation for the return trip.
Light Rail: Carries a lesser volume of passengertraffic compared to heavy rail. “Light” refers to the number of riders that the train
can carry, not the weight. Light rail may share right-of-way on a roadway or operate on exclusive right-of-way and can have multi-
car trains or single cars. Trolley cars and Portland, Oregon’s MAX system are examples of light rail.
Model: An analytical tool used by transportation planners to assist in making forecasts of land use, economic activity, travel activity
and their effects on the quality of resources such as land and capacity.

Kansas City Area Transportation Authority
10-4
New Starts: Federal funding granted under Section 3(i) of the Federal Transit Act. These discretionary funds are made available for
construction of a new fixed guideway system or extension of any existing fixed guideway system, based on cost effectiveness, alter-
natives analysis results and the degree of local financial commitment. To qualify, you must follow a strictly defined project develop-
ment process.
OCS (Overhead Catenary System): The part of the overhead line equipment consisting of: contact wire, contact wire supports,
messenger wires, isolators, counter-weights, hangers and other equipment and assemblies that distributes DC electric power from
substations to the light rail vehicle.
Operational Costs (Operating Costs): Recurring costs of operating passenger service. These costs include wages, maintenance
of facilities and equipment, fuel, supplies, employee benefits, insurance, taxes, marketing, and other administrative costs.
Park and Ride Lot: Designated parking areas for automobile drivers who then board transit vehicles from these locations.
Rail Yard: A system of tracks within defined limits, designed for storing, cleaning, and assembling (to each other) rail cars.
Ridership: The number of people carried by the transit system during a specified period.
Rolling Stock: The vehicles used in a transit system.
Route Miles: The total number of miles included in a fixed route transit system network.
Streetcar: a form of light rail best suited to short trips in urban activity centers usually operating in mixed traffic, making frequent
stops.
Substation: A building or structure containing rectifiers, breakers and other electrical equipment used to change local utility power
into power able to be transmitted to the OCS and used by the vehicles.
Travel Time: The elapsed time between a trip’s beginning and end. It includes travel, transfers, and waiting time.

North/South Corridor Alternatives Analysis: Acronym List
11-1
AA – Alternatives Analysis
AARF - Aggregate Rail Ridership Forecasting
ACHP - Advisory Council on Historic Preservation
APE – Area of Potential Effects
ARRF – Aggregate Rail Ridership Forecasting
BRT – Bus Rapid Transit
CBC – Central Business Corridor
CBD – Central Business District
CEI - Cost Effective Index
CTF – Citizen’s Task Force
DEIS – Draft Environmental Impact Statement
EIS – Environmental Impact Statement
EPA – Environmental Protection Agency
ESA – Endangered Species Act
FEMA – Federal Emergency Management Agency
FOCUS – Forging our Comprehensive Urban Strategy
FTA – Federal Transit Administration
JCT – Johnson County Transit
KCATA – Kansas City Area Transportation Authority
LOS – Level of Service
LPA – Locally Preferred Alternative
LRT – Light Rail Transit
LRV – Light Rail Vehicle
LUST – Leaking Underground Storage Tank
MARC – Mid America Regional Council
MAX – Metro Area Express
MDC – Missouri Department of Conservation
MDNR – Missouri Department of Natural Resources
Chapter Eleven: Acronym List
Kansas City Area Transportation Authority
11-2
MIS – Major Investment Study
MoDOT – Missouri Department of Transportation
MPO – Metropolitan Planning Organization
NEPA – National Environmental Policy Act
NFIP – National Flood Insurance Program
NHPA – National Historic Preservation Act
NRHP – National Register of Historic Places
NTD – National Transit Database
NWI – National Wetlands Inventory
OCS – Overhead Catenary System
PIP – Public Involvement Plan
PTW – Part Time Warning
ROW – Right-of-Way
SAFETEA-LU - Safe, Accountable, Felxible, Efficient Transportation Equity Act: A Legacy for Users
SCC – Standard Cost Categories
SEMA –State Emergency Management Agency
SHPO – State Historic Preservation Office
SMT – Study Management Team
TIP – Transportation Improvement Program
TOD – Transit Oriented Development
TSP – Transit Signal Priority
UGT – Unified Government Transit
USACE – U.S. Army Corps of Engineers
USFWS - U.S. Fish and Wildlife Service
USGS – United States Geological Survey
UST – Underground Storage Tank
YOE – Year of Expenditure

North/South Corridor Alternatives Analysis: Technical Information
12-1
North/South Alternatives Analysis Technical Reports and DocumentationThe following documents provide additional information from the Alternatives Analysis and more detailed documentation. These documents supplement the final report and are available from the KCATA
Design1. Light Rail Design Criteria – March 2008
2. LRT Conceptual Design Report – February 2009
3. Engineering Issues – March 7, 2008
4. Downtown LRT Alternatives – October 7, 2008
5. LRT Station Design Report – February 2008
6. LRT Facility Tech Memo – March 11, 2008
7. BRT Design Report – February 2009
8. LRT Capital Cost Methodology Tech Memo– September 26, 2008
9. BRT Capital Cost Methodology Tech Memo – February 10, 2009
10. LRT Capital Cost Tech Memo – January 15, 2009
11. CBD LRT Capital Cost Estimates – October 16, 2008
12. BRT Capital Cost Tech Memo – January 19, 2009
13. Sprint Center Design Considerations – October 6, 2008
14. Flyover Alternative – October 1, 2008
15. Evaluation Methodology – January 8, 2009
16. Light Rail Vehicle Technology Tech Memo – February 12, 2008
Development and Land Use1. Impact of LRT on Development: Case Studies – February 2008
2. Transit Supportive Land Use Report – August 2008
3. Station Market Areas – Aerial
4. Transit Supportive Land Use Assessment – August 2008
5. Land Use Policy Analysis – July 2008
Chapter Twelve: Technical Information

Kansas City Area Transportation Authority
12-2
6. Station Market Analysis – September 2008
7. Market Analysis Appendix – September 2008
8. FTA Land Use Assessment – May, 8, 2009
9. BRT Development Impact – April 2, 2008
Environmental1. Purpose and Need Statement
2. Red Flag Environmental Analysis
Fact Sheets 1. Maintenance Facility Spatial Requirements
2. Light Rail Vehicle Cut Sheet
Market Assessment and Ridership Forecasting1. Ridership Forecasting Technical Memorandum – December 2009
2. Airport Market Share Tech Memo - September 11, 2007
3. Transfer Rate Analysis - July 31, 2008
November 2006 Plan1. Technical Evaluation Report – November 2007
2. November 2006 Ordinance – November 2006
Phase I1. Phase I Report – March 2008
2. Innovative Finance Memo – December 30, 2009
3. Funding Breakdown – March 6, 2008
4. Citizens’ Task Force Roster
5. Study Management Team Roster
6. Light Rail Resolution – November 16, 2007

North/South Corridor Alternatives Analysis: Technical Information
12-3
Planning1. Regional Transit Plan – October 7, 2008
2. Starter Lines Technical Memo – March 2008
3. KCATA Project Initiation Package – July 2008
4. Center versus Side Running – LRT – March 24, 2008
5. Phase II Initial Definition of Alternatives – April 28, 2008
6. Detailed Description of Alternatives – February 2009
7. Phase II MAX Alternative Definition – May 1, 2008
8. LRT Operating Plan and Operating Cost – September 9, 2008
9. Traffic Analysis Tech Memo – February 27, 2009
10. Existing Bus Service – East Corridor Alternatives – January 14, 2008
11. Financial Analysis – February 22, 2008
12. NKC Alignments – March 11, 2008
13. Kansas City Light Rail Chronology – October 10, 2007
14. Traffic Operations – March 28, 2008
Public Involvement1. Public Involvement Plan - Phase II – January 2008
2. LRT Info Booklet, February 2008
3. Community Input Summary Report, June 2008
Urban Design1. Streetscape Options, July 2008
2. Streetscape Costs - Parks – August 30, 2008
3. Streetscape Concepts Tech Memo – July 2008
PresentationsOver the course of the Alternatives Analysis, multiple presentations were made to citizens, organizations, and stakeholders; these presenta-tions are available from the KCATA.