CHAPTER ONE: OVEVIEW OF MANAGERIAL...
15
CHAPTER ONE: OVEVIEW OF MANAGERIAL ACCOUNTING The Basic Objectives of Accounting • Basic objective of accounting is to provide stakeholders with useful information about a business enterprise in order to help them make rational economic decisions • Similarities between financial and management accounting: o Deal with economic events of a business o Require that results of economic events be quantified and communicated detailed plan of who will do what) o Implementing the plan & decision making (directing, motivating, measuring performance) o Controlling & performance evaluation (keeping firm’s activities on track and ensuring that plan is being followed) • Answers specific questions o Should we stay in business?
Transcript of CHAPTER ONE: OVEVIEW OF MANAGERIAL...
CHAPTER ONE: OVEVIEW OF MANAGERIAL ACCOUNTING
The Basic Objectives of Accounting• Basic objective of accounting is to provide stakeholders with useful information
about a business enterprise in order to help them make rational economic decisions
• Similarities between financial and management accounting:o Deal with economic events of a businesso Require that results of economic events be quantified and communicated
to interested parties
Financial Accounting• Objective is to provide external users with useful financial info to help them
make investment and credit decisions• External users:
o Current owners (shareholders): want to know if they should hold, buy more, or sell shares in company
o Potential investors: want to know if company is a good investmento Creditors: want to know if they should extend credit to firmo Income tax authorities: want to know if income is measured properlyo Others (financial analysts, labour unions, customers, legislators)
• Very regulated • Follows IFRS and GAAP• Focuses on reliability• Has financial statements that are required by law:
1) Balance Sheet (measures financial health)2) Income Statement (measures financial success)3) Cash Flow Statement (measures liquidity)
• Captures all finances that happen in a business
Management Accounting• Objective is to provide internal users (managers of company) with financial and
nonfinancial info to help them make business decisions to achieve goals of organization
• Managers of firm need info to make decisions related to:o Planning (establishing goals/objectives, predicting results, drawing
detailed plan of who will do what)o Implementing the plan & decision making (directing, motivating,
measuring performance)o Controlling & performance evaluation (keeping firm’s activities on track
and ensuring that plan is being followed)• Answers specific questions
o Should we stay in business?

o How much of resource B should we allocate to production and how much or resource A?
• Has no format (rules)• Focuses on relevance
CHAPTER TWO: COST CLASSIFICATIONS
Introduction to Cost Terms and PurposesCost
• Cost: value of economic resources (ex. money) sacrificed or used up to achieve a particular objective (produce a product/service)
• Examples:o On Jan. 1, 2007 ABC Co. purchased a machine for $100,000 to be used in
producing a certain product “X”. The cost of acquiring the machine is the amount paid or to be paid in future so as to acquire the machine for the purpose of using it in production activities.
o During 2007, ABC consumed 20% of the value of the machine in production. Part of the cost of producing product “X” is the amount of resources consumed from the machine during 2007, which is called depreciation $20,000 (100,000 * 20%).
Cost Object• Cost object: anything for which a separate measurement of cost is desired/needed• Ex. cost of product, machine, service, process• Cost objects can vary in size from an entire company to a division/program within
company to a single product/service
Cost Drivers• Cost driver: any activity (ex. production volume) or factor (ex. time) that causes
total amount spend on particular cost object to change• Ex. total cost of renting a car is driven by all or some of following factors:
o Number of miles driveno Number of days car is rentedo Type and size of car
• Change in cost driver results in change in total costs incurred• Managers should attempt to reduce costs by efficiently managing use of cost
drivers• Identifying cost drivers is first step to control costs
Cost Behaviours• Cost drivers influence cost behaviours• Managers need to understand how total amount spent on particular cost object
reacts to changes in a cost driver
Cost Estimation • Cost estimation: development of a welldefined relationship between a cost object
and its cost drivers• Purpose is to identify cost behavior and predict future costs
Cost Assignment• Process of measuring the amount of costs consumed by a particular cost object
from the costs incurred• Two stages:
1) Cost Accumulation: collection of cost data in an organized means in an accounting system
2) Cost assignment: process of assigning costs incurred to a cost object• Assigning cost to cost objects depends on if relationship between costs incurred
and cost object is direct or indirect• Direct costs:
o Costs that can be traced easily to a cost object in an accurate and economically feasible way
o Ex. direct materials costs (costs of all materials and parts that become part of finished product and can be easily traced to into it)
o Ex. direct labour costs (wages and fringe benefits paid to production line workers involved directly in manufacturing a product)
• Indirect costs:o Costs are related to particular cost object but cannot be traced to that cost
object in an economically feasible wayo Should be allocated to the cost objects using an allocation base factoro Ex. all production facilities required to transform raw materials into
finished goods (depreciation of machines, maintenance costs, rent of factory, salary of supervisors)
Notes• The classification of costs into direct and indirect are defined with reference to a
specific cost object• Particular cost can be classified as direct with respect to a certain cost object and
indirect with respect to another cost object• Cost would be considered indirect for one of two reasons:
1. It is impractical to trace the cost to the object (ex. possible to measure the precise amount of nails/glue used on each table produced at a furniture plant but would not be worth the effort)
2. It is impossible to trace the cost to the cost object
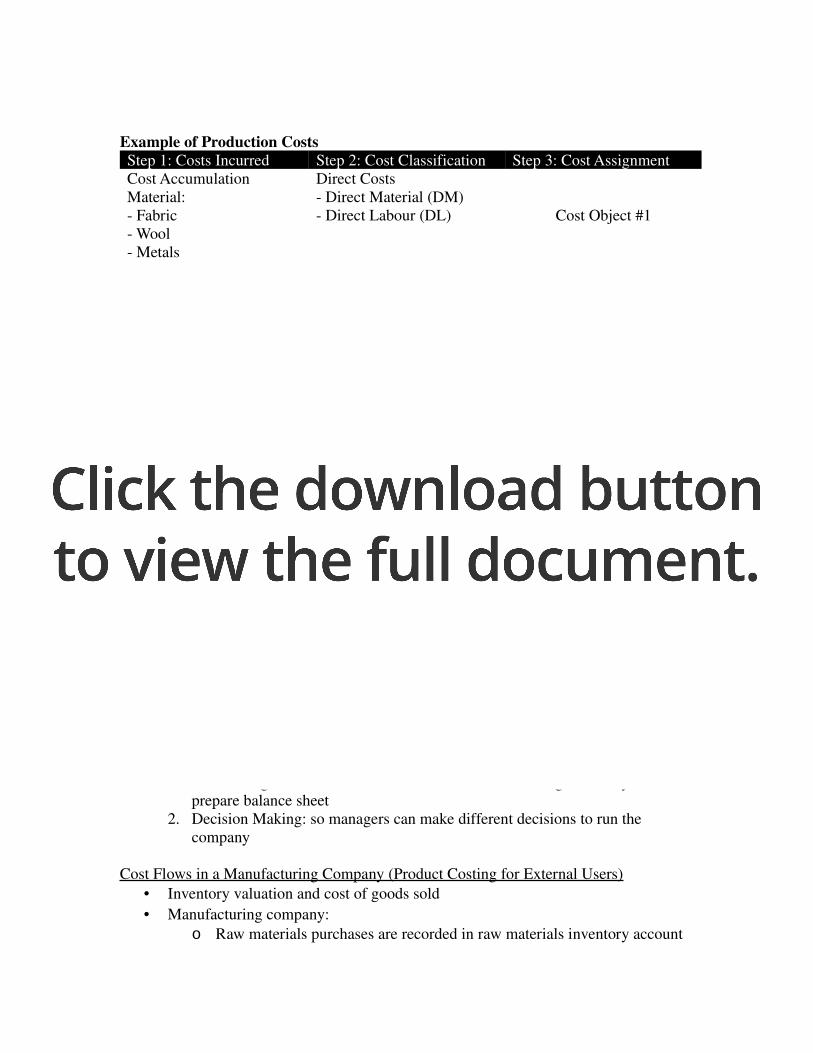
Example of Production CostsStep 1: Costs Incurred Step 2: Cost Classification Step 3: Cost AssignmentCost Accumulation Direct Costs
Cost Object #1
Cost Object #2
Cost Object #3
Material: Fabric Wool Metals Glue Nails Sand Paper
Direct Material (DM) Direct Labour (DL)
Labour: Production lines Security Material Handling Maintenance
Indirect Costs All production costs except DM &DL Factory Overhead
Production Facilities: Machinery Rent Utilities
Ex. A manufacturer of machinery currently produces equipment for a single client. The job is expected to take the entire month of April to complete. The client supplies all required raw materials on a nocost basis. The manufacturer contracts to complete the desired units from this raw material. The production costs included by the manufacturer are correctly identified as:
a) Direct Labourb) Factory overheadc) Direct costsd) None of the above
Different Costs for Different Purposes• Different types of cost information are needed for different purposes• Two basic uses of cost information:
1. Product Costing: calculating the cost of production for the purpose of determining the COGS for income and the Cost of Ending Inventory to prepare balance sheet
2. Decision Making: so managers can make different decisions to run the company
Cost Flows in a Manufacturing Company (Product Costing for External Users)• Inventory valuation and cost of goods sold• Manufacturing company:
o Raw materials purchases are recorded in raw materials inventory account
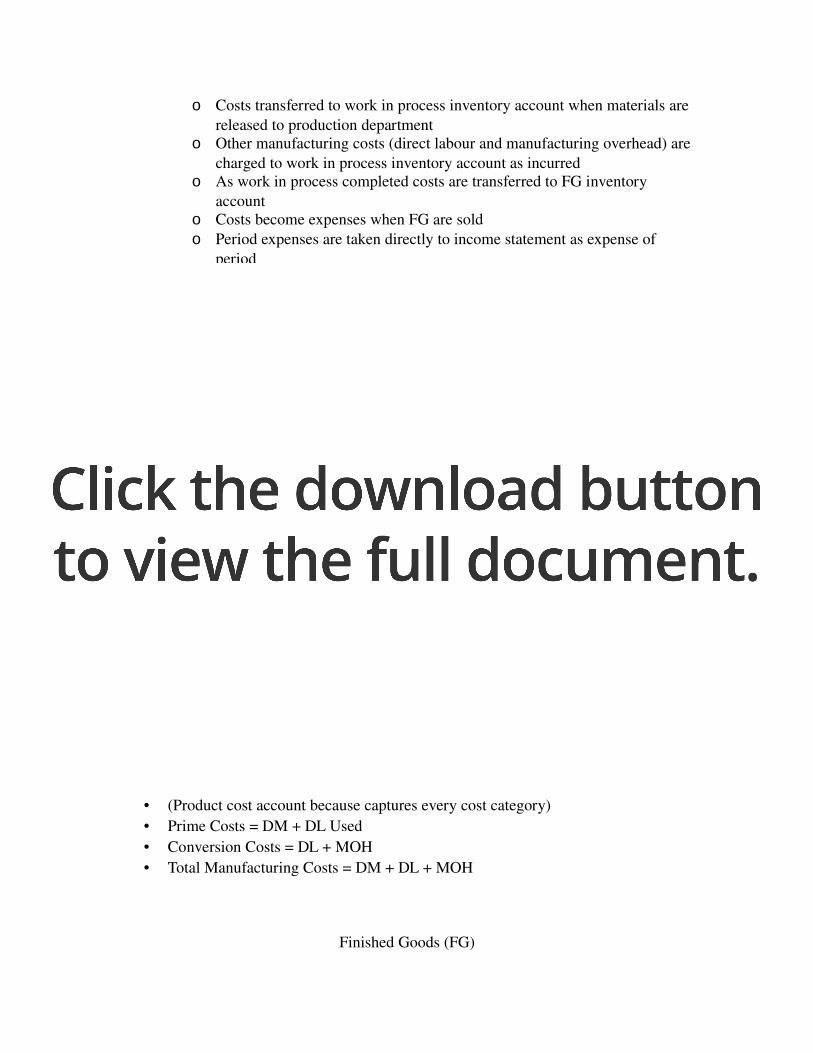
o Costs transferred to work in process inventory account when materials are released to production department
o Other manufacturing costs (direct labour and manufacturing overhead) are charged to work in process inventory account as incurred
o As work in process completed costs are transferred to FG inventory account
o Costs become expenses when FG are sold o Period expenses are taken directly to income statement as expense of
period
Product (Inventoriable) Costs vs. Period Costs• Product Costs:
o Costs charged to units produced as they are incurredo Become part of cost of goods manufactured and treated as inventory until
they are soldo Become COGS when soldo Are charged to income statement at end of period
• Period Costs:o Expensed in the time period in which they are incurredo All selling and administrative costs are considered period costs
Raw MaterialsPurchase RMà Direct Materials Purchasedà Indirect Materials Purchased
Raw Materials Usedà Direct Materials Used (WIP as DM used)à Indirect Materials used (WIP as MOH)
Work in Progress/Process (WIP) BB + Direct Materials (DM) Used+ Direct Labour (DL)+ Manufacturing Overhead (MOH) EB (what you start but are unable to finish)
Cost of Goods Manufactured (COGM)
• (Product cost account because captures every cost category)• Prime Costs = DM + DL Used• Conversion Costs = DL + MOH• Total Manufacturing Costs = DM + DL + MOH
Finished Goods (FG)
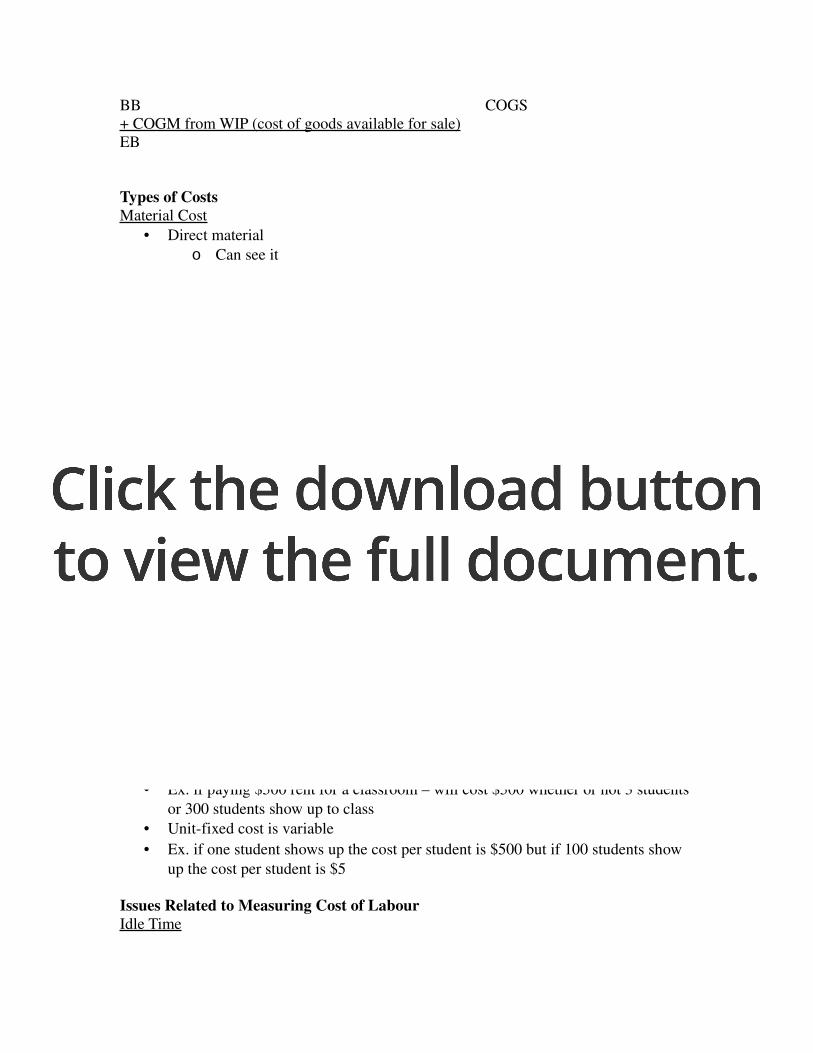
BB+ COGM from WIP (cost of goods available for sale)EB
COGS
Types of CostsMaterial Cost
• Direct materialo Can see ito Is part of ito Can touch ito Is economical and feasible in the final product
• Indirect material
Labour Cost• Direct labour
o Lines peopleo Assembly workerso Can always trace it to the final product (ex. took five people to produce 5
pieces of furniture)• Indirect labour
o Security guardo Janitorial staffo Line supervisor
Variable Overhead• Gas• Unit Variable Cost is fixed or constant • Ex. no matter how many liters of gas you pump, each liter will be $1• The Total Variable Cost changes• Variable cost is defined by total cost not unit cost
Fixed Overhead• Rent• Total Fixed Cost is constant/fixed• Ex. if paying $500 rent for a classroom – will cost $500 whether or not 3 students
or 300 students show up to class• Unitfixed cost is variable• Ex. if one student shows up the cost per student is $500 but if 100 students show
up the cost per student is $5
Issues Related to Measuring Cost of LabourIdle Time

• Idle time: wages of direct labour workers who are idle due to machine breakdowns, material shortages, power failures, etc.
• Cost of idle time is treated as indirect labour and added to overhead• Direct labor has to be broken down into what labour is actually direct and what
labour is idle time• People on the assembly line who are actually making the product• Supervisors are salary workers• Lines people are wageworkers• Easy to trace the cost of lines people to the cost of the product • Regular cost of labor is direct but idle time is overhead
Ex. An assembly line worker is idle for 2 hours during the week due to a power failure. If the worker is paid $15 per hour and works a normal 40 hour week, labour cost would be assigned as follows between direct labour and manufacturing overhead:
Direct labour cost ($15 x 38 hours)Manufacturing overhead cost ($15 x 2 hours)
Total cost for the week
$57030
$600
Overtime Premium• Overtime premium: wage rate paid to workers (for direct and indirect labour) in
excess of their straighttime wage rates)• Overtime premium paid to factory works is considered part of manufacturing
overhead• If customer is responsible for causing overtime then overtime is treated as direct
labour• (Must be explicitly stated otherwise will be treated as indirect labour
Ex. Assume again that an assembly line worker is paid $15 per hour. The worker is paid time and a half for overtime (time in excess of 40 hours per week). During a given week this employee works 46 hours and has no idle time. Labour costs would be allocated as follows:
Direct labour cost ($15 x 46 hours)Manufacturing overhead cost ($7.50 x 6 hours) Total cost for the week
$69045
$735
Labour Fringe Benefits• Made up of employment related costs paid by employer• Costs handled in two different ways:
1. Treat all costs as indirect labour and add them to manufacturing overhead2. Treat fringe benefits that relate to direct labour as additional direct labour
costs and those that relate to indirect labour as FOH
Classifying Costs for Decision Making Understanding Cost Behaviour

• Cost behavior: the way the total amount spent on a specific cost reacts to changes in activity levels (in terms of production/sales volume)
• Costs may stay same or may change proportionately in response to change in activity
• Relevant Range: range of activity over which cost behavior pattern remains valid• Knowing how a cost reacts to a change in level of activity helps to classify it as
variable or fixed• Classification helps managers make optimal decisions and perform planning and
control functions
Variable Costs• Variable cost: cost that changes in total in direct proportion to changes in the
related level of activity/volume• Total variable costs = (number of units) x (variable cost per unit)• Variable costs include things like labour and materials• Overhead/indirect costs can also be variable (indirect labour, supplies, some
utilities)
Ex. A company manufactures microwave ovens. Each oven requires a timing device that costs $30. The per unit and total cost of the timing device at various levels of activity (i.e. number of ovens produced) would be:
Cost per Timing Device
Number of Ovens Produced
Total Variable Cost – Timing Devices
$30 1 $3030 100 3,00030 200 6,000
• Production is also called level of activity• xaxis is level of activity (production)• yaxis is the total cost• Slope of the line is the unit variable cost• Unit variable cost is fixed• Total variable cost increases when level of activity increases• Can tell this is purely variable cost because it changes at same rate (slope is
consistent)
Fixed Costs• Fixed cost: cost that remains unchanged in total for a given time period (despite
changes in level of total activity or volume)• As production increase total fixed costs stay the same within the relevant range• Since constant numerator (total fixed costs) is being divided by increasing
denominator (total production sales) cost per units become smaller and smaller• Fixed costs include: rent, insurance premiums, salaries, depreciation, property
taxes
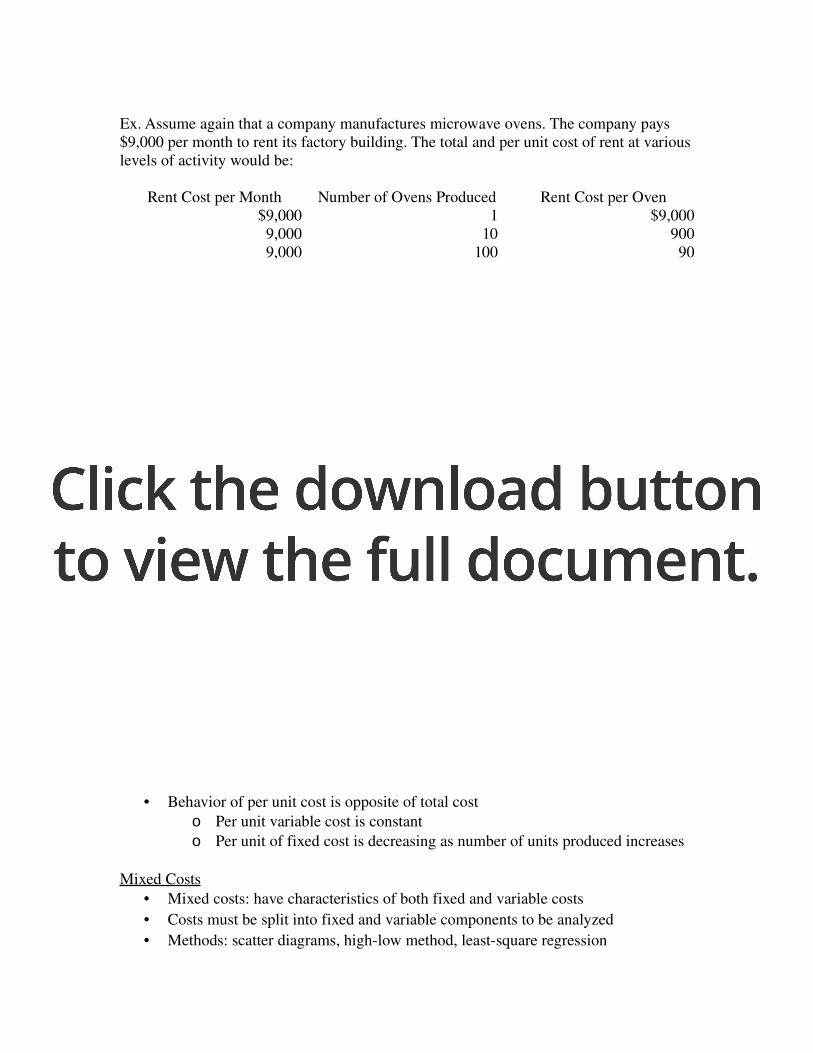
Ex. Assume again that a company manufactures microwave ovens. The company pays $9,000 per month to rent its factory building. The total and per unit cost of rent at various levels of activity would be:
Rent Cost per Month Number of Ovens Produced Rent Cost per Oven$9,000 1 $9,0009,000 10 9009,000 100 909,000 200 45
• Slope is 0 because slope is the unit variable cost• Cost is purely fixed• When level of activity goes up the unit fixed cost goes down• Intercept is total fixed cost• Will always get 9,000 if multiply column 2 by column 3 (that’s how can tell if it is
fixed if not given first column)• Cannot talk about the unit fixed cost without a base• A unit variable cost does mean something (can give value even without a base)
Ex. The unit fixed cost is $50 per student if 100 students come in meaning the total fixed cost is 5000. If 200 students come in, the unit fixed cost is $25.
UFC = $50/student when 100 students attendTFC = 50 x 100 = 5000UFC if 200 students attend = 5000/200 = $25
• Cannot talk about unit fixed cost without the base (100 students)• This base is called the denominator level• It is a reference point
Notes• Costs are described as variable or fixed with respect to particular relevant range• Relevant range: range of activity within which the company usually operates• Relevant range is range of activity during which relationship between cost and
cost driver remain valid• Definition of variable and fixed are with reference to total cost• Behavior of per unit cost is opposite of total cost
o Per unit variable cost is constanto Per unit of fixed cost is decreasing as number of units produced increases
Mixed Costs• Mixed costs: have characteristics of both fixed and variable costs• Costs must be split into fixed and variable components to be analyzed• Methods: scatter diagrams, highlow method, leastsquare regression
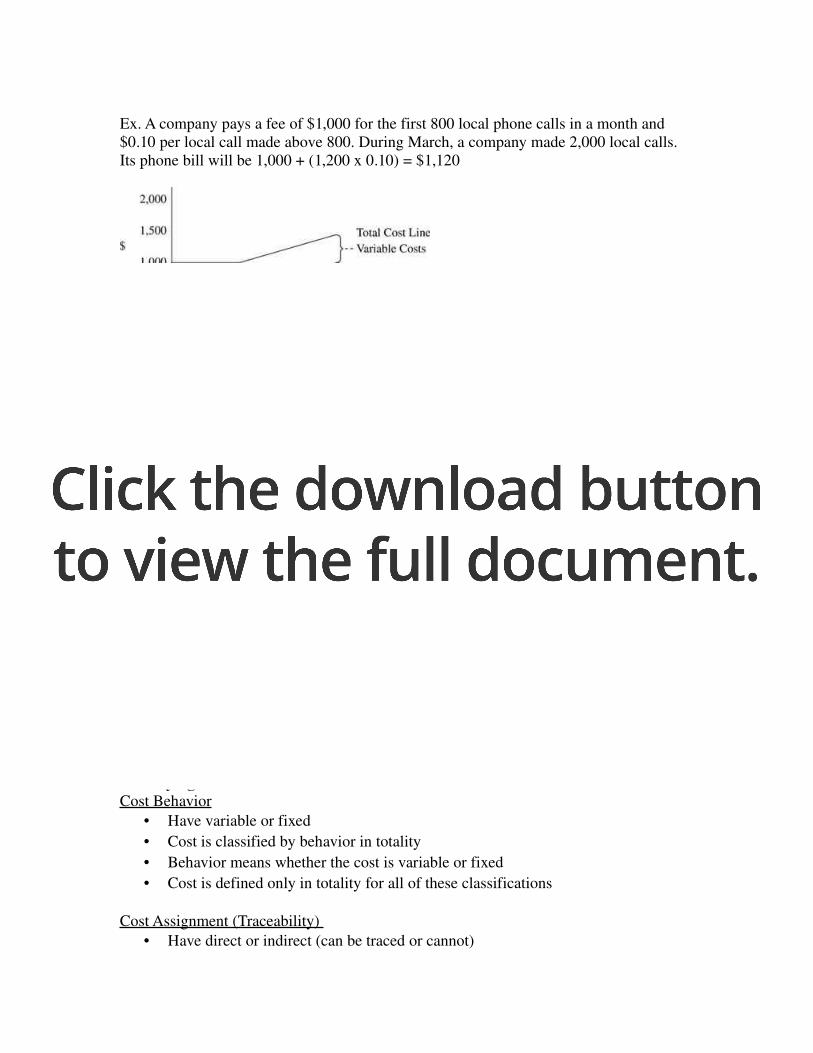
Ex. A company pays a fee of $1,000 for the first 800 local phone calls in a month and $0.10 per local call made above 800. During March, a company made 2,000 local calls. Its phone bill will be 1,000 + (1,200 x 0.10) = $1,120
Step Function Cost• Another example of a mixed cost• Ex. the total salary expense for shift supervisors• If factory runs one shift à only one shift supervisor required• To produce above maximum capacity of single shift à must add second shift
supervisor (total shift supervisor salary expense doubles)
Classifying Cost Behavior
• Have variable or fixed • Cost is classified by behavior in totality• Behavior means whether the cost is variable or fixed• Cost is defined only in totality for all of these classifications
Cost Assignment (Traceability) • Have direct or indirect (can be traced or cannot)
• Cost accumulation: if you can trace the cost to the final product• Cost assignment: if you cannot trace the cost to the final product• Can allocation can be used when costs that cannot be traced to the product• If you cannot trace it need to allocate it• Use a best cost driver to allocate it • Anything that is not a direct material or direct labour is indirect and needs to be
allocated (in this course)
By Function • Selling vs. production function • Production cost in the factory is an asset• If it is in the selling function (building) it is a period cost• A period cost is not an asset is in an expense • Goes on the income statement
Questions1. True or False. Direct material and direct labour are always variable?à True
2. Rodney Worsham is paid $20 an hour for straighttime and $40 an hour for overtime. One week he worked 50 hours, which included 40 hours of regular time and 10 hours of overtime. The 10 hours of overtime include: 4 hours of idle time caused by material shortages; 4 hours of overtime due to bad scheduling; and 2 hours caused by a special requires from a customer who made a late order. How much is charged as direct labour and indirect labour?
Direct LabourRegular 40 hours of work = $20 x 40 hoursRegular wager during bad scheduleing = $20 x 4 hoursOvertime traceable to customer = $40 x 2 hoursTotal = 800 + 80 + 80 $960
• The portion of the wage that is regular during the bad scheduling is direct labour because goods were being produced at that time at the same efficiency and productivity
• The only difference was the cost of the labour not the time spent or output produced
Indirect Labour or Manufacturing OverheadIdle time causing overtime = $40 x 4 hoursOvertime premium during bad scheduling = $20 x 4 hoursTotal = 160 + 80 = $240
• $40 overtime rate $20 regular rate = $20 premium rate
• This is recorded as overhead because it is caused by managements mistake (bad scheduling)
• Because the premium is due to poor scheduling, poor management it is not charged to the production units
Summary• Idle time alwaysindirect labour and fully charged to overtime if any• Overtime due to bad scheduling is split into direct labour at regular rate and
indirect labour at difference between regular rate and overtime rate• Overtime traceable to customer is direct cost
CHAPTER TEN
Cost Estimation• Cost estimation: process of developing a welldefined functional relationship
between a cost object and its cost driver(s) in order to understand cost behavior• Purpose of cost estimations are:
1) To identify the key cost drivers for each cost object to help managers control costs
2) To measure variable and/or fixed components of the cost item to help managers make correct decisions
3) To predict value in the future to help managers plan for future• Cost Behaviour: describes the way total amount spent of a specific cost item on a
cost objects reacts to changes in its cost driver(s)• Three possible cost behaviors:
1) Total cost may stay unchanged (fixed cost)2) Total cost may change proportionately in response to change in activity
level (variable cost)3) Total cost may partially change proportionally and partially remain
constant (mixed cost)• Need to identify and separate fixed component from variable component if costs
are mixed
How to Estimate Cost Functions• Six steps in the cost estimation process:
1. Define the cost item to be estimated2. Determine the cost drivers3. Collect consistent and accurate data4. Plot (graph) the data5. Select and employ the estimation method6. Assess the accuracy of the cost estimation
Linear Methods of Cost Estimation Basic Assumptions
• Changes in total costs can be explained by changes in level of a single cost driver (only one cost driver)
• Assume that the relationship between the cost driver and the cost object is linear (within the relevant range)
Basic Linear Function• Can express relationship between particular cost item and its cost driver in a
mathematical form using: y = mx + bo y = total costso a = fixed cost componento b = slope coefficient (variable cost rate)o x = volume (quantity) of the cost driver
Notes• If estimated value of a = 0 and b > 0 then cost behavior is variable• If estimated value of b = 0 and a > 0 then cost behavior is fixed• If estimated values of a & b > 0 then cost behavior is mixed
HighLow (HL) Method1. Identify the highest value of volume (X) and its associated value of cost (Y)2. Identify the lowest value of volume (X) and its associated value of cost (Y)3. Use the above two points to estimate the parameter b (variable cost per unit) in
following function: b = (High Y – Low Y)/(High X – Low X)
4. Estimate the fixed component of a by:à Substituting value of b and actual values of Y and X (at either lowest or highest point) into y = a + bx
5. Use the estimated cost function to predict future costs
Ex. Bill Garcia, a management accountant, wants to estimate future maintenance costs for a large manufacturing company. Recent monthly data are as follows:
January February March April May June JulyTotal Operating Hours 3,451 3,325 3,383 3,624 3,432 3,420Maintenance costs ($)
Garcia would like to estimate an underlying cost function for maintenance costs.

b = Unit variable cost = $520 ÷ 289 hours = $1.80/hour
a = Fixed cost = Total cost – Estimated variable cost
Fixed cost = $23,030 – ($1.80/hour × 3,614 hours)Fixed cost = $23,030 – $6,505 = $16,525
Estimated cost function:Total cost = Fixed cost + Variable cost
Y = a + (b × X)]Y = $16,525 + ($1.80 × X)Y = 16,525 + (1.80 x X)
Major Weaknesses of HighLow Method• Uses only two data points and ignores the rest of the data• Could provide biased estimates if two data points are outliers (will be no outliers
in this class)• Does not provide info to evaluate how good estimated function is in representing
cost behavior or how accurate it is in predicting future costs (does not use a line of best fit)
• Allows only one independent variable to explain behavior of cost (can only deal with one cost driver – not multiple)
Regression Analysis• A statistical method for obtaining the unique costestimating equation that best
fits a set of data points • Fits data by minimizing sum of square of estimation error• Each error is distance from regression line to one of data points• Regression analysis is also called least squares regression • Two types of analysis:
o Simple regression: only one independent variableo Multiple regression: two or more cost drivers
Simple Regression Model
Model Understanding Coefficients
t Significance
B Sig. Error(Constant) 15805 3460.251 4.568 0.006OpHours 2.036 1.4 1.456 0.209
RSquared = 0.445

TC = 2.306x + 15805• Xcoefficient (Unit Variable Cost) = 2.036• Constant (Total Fixed Cost) = 15,805• tvalue (Probability Density Function):
o Measures the probability that the cost driver is related to the cost objecto The higher the tvalue the stronger the probability that they are relatedo tvalue > 2 is significant (is accepted)o Anything below 2 is rejected
• An RSquared value of greater than 70% or 0.7 means it is a good fit• When doing MCQ: look for value with highest RSquared value and then see if t
value has a correlation
Evaluating the Regression OutputMeasuring Precision and Reliability
• Regression analysis also provides quantitative measures of its reliability• Reliability indicates whether regression reflects actual relationship among
variables• Key measures of reliability:
o RSquaredo tvalueo pvalue
RSquared• Number between 0 and 1 that describes explanatory power of regression• Degree to which change in Y can be explained by changes in X• Relative measure of “goodnessoffit”• Percent change in Y that can be explained by changes in X• A good fit is an r2 > 0.7