CHAPTER NO. IV- CO-OPERATIVE MOVEMENT IN...
54
113 CHAPTER NO . IV - CO-OPERATIVE MOVEMENT IN INDIA 4.1 - INTRODUCTION : India is a developing country facing number of problems, such as the population explosion, low productivity, inequalities, low living standards, inflation and so on. India consisting of 16% of the world‟s population sustains only on 2.4% of land resource. Agriculture sector is the only livelihood to the two-third of its population which gives employment to the 57% of work force and is a source of row material to large number of industries. After 60 years of independence taking into concern these problems, the growth of the Indian economy is rather slow. For the solution and for rapid economic development, it was necessary to accept a mixed economy as an economic system for the balanced growth of public and private sector together with a major role for co-operative societies to contribute their nit in the process of economic development. In the context of globalization of rural development perspectives, the developing countries like India, needs to devote greater attention towards rural development. The country‟s economic structure is undergoing fundamental changes as a result of the policy of liberalization and de-regulation. The objectives of the new economic policy are to impart a new element of dynamism to agriculture, trade and industry, to encourage foreign investment and technologies for making Indian products competitive in the international market to improve the performance of public undertaking and to influence co-operatives, since co- operatives work as an essential part of the country‟s economic structure. It is hoped that the co-operative movement will respond to the changes and develop firm self-discipline. Co-operative movement in India is one of the largest movements in the world. Co-operative movement has made tremendous progress in every aspects of the Indian economy. Co-operative activities occupy a major place in the sphere of the Indian economy. Initially, the co-operative movement was started with a limited scope of activities of rural credit but now it has entered in all fields of economic activity with social essence. Now the movement which has covered 100 per cent villages and 75 per cent rural households and functioning over 545 thousand Co-operatives of various levels with membership coverage of 236 million and working capital of 34,00,555 million
Transcript of CHAPTER NO. IV- CO-OPERATIVE MOVEMENT IN...
113
CHAPTER NO. IV- CO-OPERATIVE MOVEMENT IN INDIA
4.1- INTRODUCTION:
India is a developing country facing number of problems, such as the population
explosion, low productivity, inequalities, low living standards, inflation and so on. India
consisting of 16% of the world‟s population sustains only on 2.4% of land resource.
Agriculture sector is the only livelihood to the two-third of its population which gives
employment to the 57% of work force and is a source of row material to large number of
industries.
After 60 years of independence taking into concern these problems, the growth of
the Indian economy is rather slow. For the solution and for rapid economic development,
it was necessary to accept a mixed economy as an economic system for the balanced
growth of public and private sector together with a major role for co-operative societies
to contribute their nit in the process of economic development. In the context of
globalization of rural development perspectives, the developing countries like India,
needs to devote greater attention towards rural development. The country‟s economic
structure is undergoing fundamental changes as a result of the policy of liberalization and
de-regulation. The objectives of the new economic policy are to impart a new element of
dynamism to agriculture, trade and industry, to encourage foreign investment and
technologies for making Indian products competitive in the international market to
improve the performance of public undertaking and to influence co-operatives, since co-
operatives work as an essential part of the country‟s economic structure. It is hoped that
the co-operative movement will respond to the changes and develop firm self-discipline.
Co-operative movement in India is one of the largest movements in the world.
Co-operative movement has made tremendous progress in every aspects of the Indian
economy. Co-operative activities occupy a major place in the sphere of the Indian
economy. Initially, the co-operative movement was started with a limited scope of
activities of rural credit but now it has entered in all fields of economic activity with
social essence. Now the movement which has covered 100 per cent villages and 75 per
cent rural households and functioning over 545 thousand Co-operatives of various levels
with membership coverage of 236 million and working capital of 34,00,555 million

114
inclusive of credit and non-credit co-operative societies. It has been playing a significant
role in disbursing agricultural credit, distribution of agricultural inputs, providing market
support, processing, etc. Co-operative movement has been recognized as an effective
instrument for the economic development of the rural masses and for improvement in the
socio-economic condition of the poor.
The co-operative movement in India had its origin else where and was introduced
to this region by foreign rule. But even after independence, the movement continued in
the planned economy. The movement has been recognized as an effective instrument for
the economic development of the rural masses and for improvement in the socio-
economic conditions of the neglected. In India co-operation had become a part of national
policy and hence the Indian co-operative movement is sometimes ironically described not
as a movement but only as a product of government policy. It spread and diversified with
the encouragement and support of the government.
The co-operative movement in India was basically organized against the
moneylenders to rescue farmers from the clutches of the poverty and indebtedness. The
need for agricultural credit through co-operatives felt because of rural indebtedness. The
Indian co-operative movement was initiated by the government; it spread and diversified
with the encouragement and support of the government. In this connection, observation
made by NABARD‟ in its Annual Report, 2001-2002 is; “Co-operatives have contributed
significantly to the growth of institutional infrastructure in the rural areas, private capital
formation in the agriculture sector and distribution of farm inputs like fertilizers, seeds
etc.”1 The determination of Government interest in co-operatives and the importance
attached to them was reflected in the appointment of various committees regarding to
review their development and functioning.
1. GoI, Annual Report 2001-2002, NABARD.
115
4.2- TYPES AND FUNCTIONS OF CO-OPERATIVE MOVEMENT IN INDIA-
In the early stage the Co-operative movement was known only in the form of
Consumer‟s Co-operative movement. Now the movement has emerged in different
branches of economy. Many types of co-operative societies are found in all over the
world.
Every type of organizational classification of co-operative societies provides
services to each particular category and to a number of special requirement e.g.,
Consumers Co-operatives in England and Sweden, Agricultural Co-operatives in
Denmark, Co-operative Creameries in Ireland, Agricultural Credit Co-operatives in
Germany, Urban Credit Co-operatives in France, Agricultural and Consumer‟s Co-
operatives in Russia, Agricultural Marketing Co-operatives in U.S.A., and Farming Co-
operatives in Israel.
India is a second largest country in the world with 102,70,50,247, out of total
population 53.12 crore with male and 49.57 crore female.1
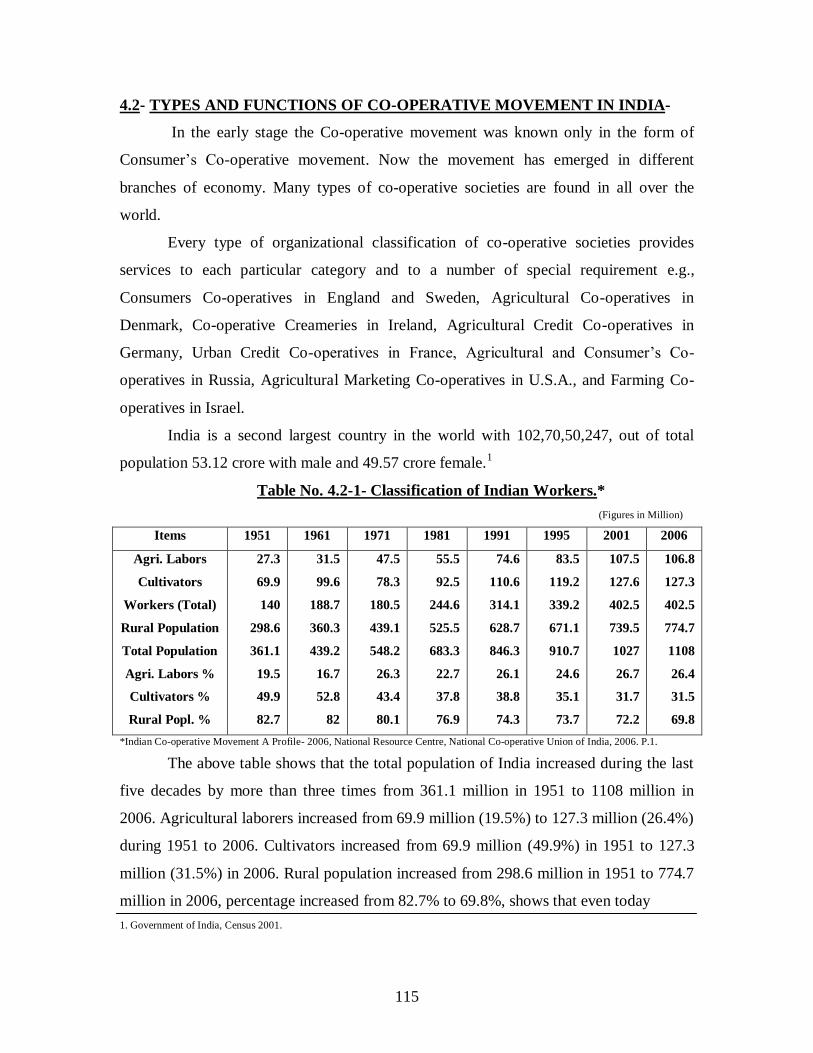
Table No. 4.2-1- Classification of Indian Workers.*
(Figures in Million)
Items 1951 1961 1971 1981 1991 1995 2001 2006
Agri. Labors
Cultivators
Workers (Total)
Rural Population
Total Population
Agri. Labors %
Cultivators %
Rural Popl. %
27.3
69.9
140
298.6
361.1
19.5
49.9
82.7
31.5
99.6
188.7
360.3
439.2
16.7
52.8
82
47.5
78.3
180.5
439.1
548.2
26.3
43.4
80.1
55.5
92.5
244.6
525.5
683.3
22.7
37.8
76.9
74.6
110.6
314.1
628.7
846.3
26.1
38.8
74.3
83.5
119.2
339.2
671.1
910.7
24.6
35.1
73.7
107.5
127.6
402.5
739.5
1027
26.7
31.7
72.2
106.8
127.3
402.5
774.7
1108
26.4
31.5
69.8
*Indian Co-operative Movement A Profile- 2006, National Resource Centre, National Co-operative Union of India, 2006. P.1.
The above table shows that the total population of India increased during the last
five decades by more than three times from 361.1 million in 1951 to 1108 million in
2006. Agricultural laborers increased from 69.9 million (19.5%) to 127.3 million (26.4%)
during 1951 to 2006. Cultivators increased from 69.9 million (49.9%) in 1951 to 127.3
million (31.5%) in 2006. Rural population increased from 298.6 million in 1951 to 774.7
million in 2006, percentage increased from 82.7% to 69.8%, shows that even today
1. Government of India, Census 2001.
116
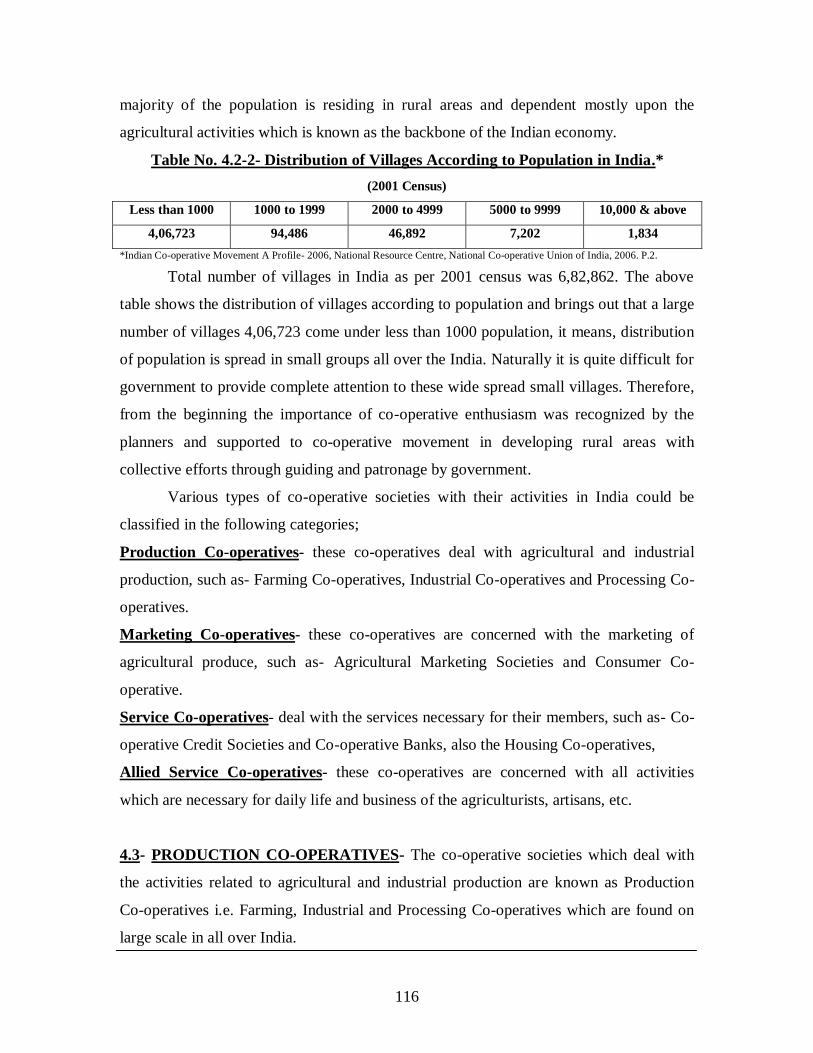
majority of the population is residing in rural areas and dependent mostly upon the
agricultural activities which is known as the backbone of the Indian economy.
Table No. 4.2-2- Distribution of Villages According to Population in India.*
(2001 Census)
Less than 1000 1000 to 1999 2000 to 4999 5000 to 9999 10,000 & above
4,06,723 94,486 46,892 7,202 1,834
*Indian Co-operative Movement A Profile- 2006, National Resource Centre, National Co-operative Union of India, 2006. P.2.
Total number of villages in India as per 2001 census was 6,82,862. The above
table shows the distribution of villages according to population and brings out that a large
number of villages 4,06,723 come under less than 1000 population, it means, distribution
of population is spread in small groups all over the India. Naturally it is quite difficult for
government to provide complete attention to these wide spread small villages. Therefore,
from the beginning the importance of co-operative enthusiasm was recognized by the
planners and supported to co-operative movement in developing rural areas with
collective efforts through guiding and patronage by government.
Various types of co-operative societies with their activities in India could be
classified in the following categories;
Production Co-operatives- these co-operatives deal with agricultural and industrial
production, such as- Farming Co-operatives, Industrial Co-operatives and Processing Co-
operatives.
Marketing Co-operatives- these co-operatives are concerned with the marketing of
agricultural produce, such as- Agricultural Marketing Societies and Consumer Co-
operative.
Service Co-operatives- deal with the services necessary for their members, such as- Co-
operative Credit Societies and Co-operative Banks, also the Housing Co-operatives,
Allied Service Co-operatives- these co-operatives are concerned with all activities
which are necessary for daily life and business of the agriculturists, artisans, etc.
4.3- PRODUCTION CO-OPERATIVES- The co-operative societies which deal with
the activities related to agricultural and industrial production are known as Production
Co-operatives i.e. Farming, Industrial and Processing Co-operatives which are found on
large scale in all over India.
117
4.3.1- Farming Co-operatives- “Co-operative Farming necessarily implies pooling of
land and joint cultivation and management”.1
The term Co-operative Farming is often used as a farm management in which
land is jointly cultivated. In other words, application of the principles of co-operation in
the cultivation of land is called co-operative farming.2
For a country like India, the problem of agricultural production is of utmost
important, where land is scarce and even now concentrated in a few hands, yields are low
but rents are high, farmers are poor and farms expensive, a thorough overhauling of the
tenure system is called for.3
Thus, a co-operative farming society is a voluntary organization of farmers based
on ideals of self-help and mutual aid. With the objectives of increase in production and
employment, improvement in techniques of production, rationale use of land and most
desirable allocation of man-power resources.
According to the Planning Commission (1961), the main features of the co-
operative farming- Members pool their lands, manpower and other resources willingly in
a single unit. Since it is a voluntary association, members can withdraw any time. The
farming is done on co-operative lines i.e. it is cultivated jointly. Ownership of the land
generally lies in the hands of the individual members i.e. the right to land is never
surrendered. Management is jointly conducted by a committee elected from the members.
The program of farm operations is laid down by the society and each member does his
assigned work according to the scheme. Members receive share in the produce according
to the work put in and the land contributed for joint cultivation. The object is to promote
efficient production, purchase and sale of farm produce and supplies as well as to meet
other needs of farmers. And net profits are utilized for payment of bonus to members
after providing reserves.
During the Five Year Plans emphasized the importance of the multi-purpose
society for the rural area and the need for each village to have a co-operative organization
to cater for the multiple needs of the members. Every encouragement was given for the
1. GoI, Second Five Year Plan, Planning Commission, P.201.
2. Schiller Otto, “Co-operative Farming and Individual Farming on Co-operative Lines”, obtained by Memoria C.B., Saksena R.D.,
“Co-operation in India”, Kitab Mahal, Allahabad, 1973. P.378.
3. Memoria C.B., Saksena R.D., “Co-operation in India”, Kitab Mahal, Allahabad, 1973. P.378.
118
establishment of co-operative farms. Particularly, small and medium farmers were to be
encouraged and assisted to group themselves voluntarily in co-operative farming
societies. By 1955-56, there were about 1000 co-operative farming societies with a
membership of 1.9 lacks in India, mostly in Panjab, Bombay and Utter Pradesh. A sum of
Rs.50 lack was provided for promoting this societies.1
By 1960-61 the number of co-operative farming societies increased to 6,325 and
membership to 3.05 lacks and the working capital to Rs.6.90 lack and the land under
cultivation was 8.90 lacks acres.2
In 1965-66, the number of farming co-operative was 7,294 with a membership of
1.88 lacks and a cultivated area of 3.9 lack hectares. In June 1971, there were 9,473
farming co-operatives with a membership of 2.57 lacks and area covered 4.88 lack
hectares. Out of these 5,070 were joint farming co-operative and 4,403 collective farming
societies with a membership of 1.2 lacks and 1.35 lacks with covering an area of 2.87 and
2.01 lack hectares, respectively.3
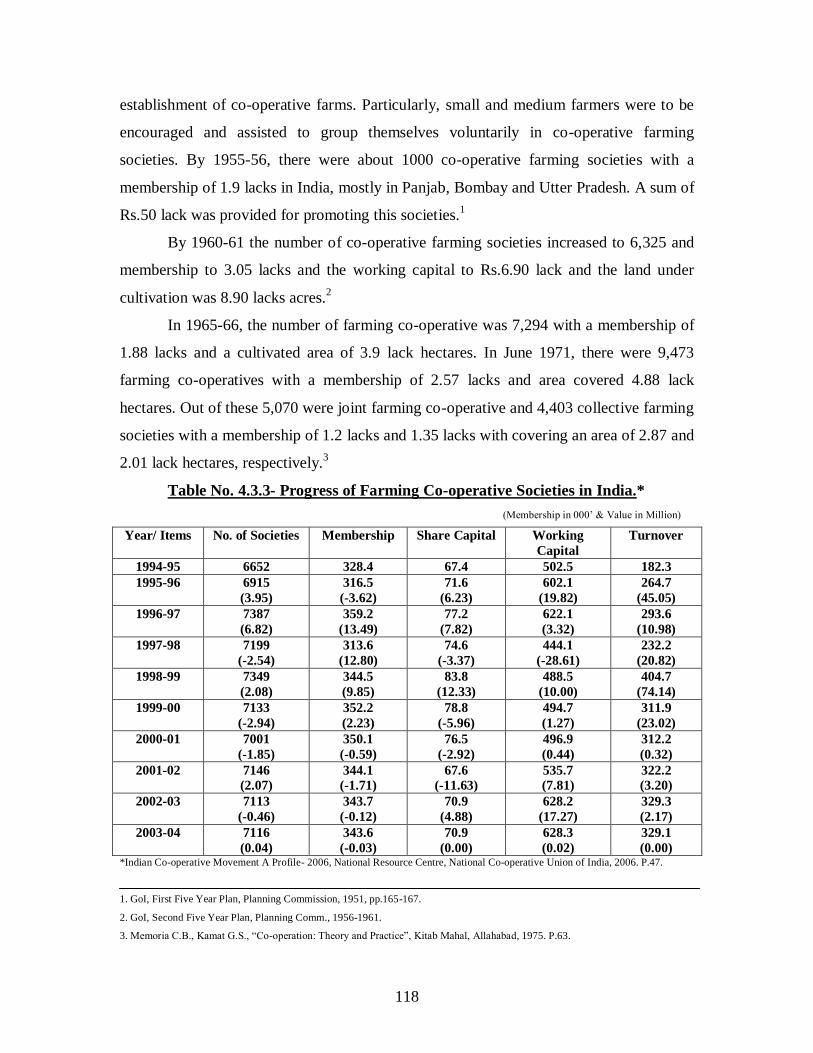
Table No. 4.3.3- Progress of Farming Co-operative Societies in India.*
(Membership in 000‟ & Value in Million)
Year/ Items No. of Societies Membership Share Capital Working
Capital
Turnover
1994-95 6652 328.4 67.4 502.5 182.3
1995-96 6915
(3.95)
316.5
(-3.62)
71.6
(6.23)
602.1
(19.82)
264.7
(45.05)
1996-97 7387
(6.82)
359.2
(13.49)
77.2
(7.82)
622.1
(3.32)
293.6
(10.98)
1997-98 7199
(-2.54)
313.6
(12.80)
74.6
(-3.37)
444.1
(-28.61)
232.2
(20.82)
1998-99 7349
(2.08)
344.5
(9.85)
83.8
(12.33)
488.5
(10.00)
404.7
(74.14)
1999-00 7133
(-2.94)
352.2
(2.23)
78.8
(-5.96)
494.7
(1.27)
311.9
(23.02)
2000-01 7001
(-1.85)
350.1
(-0.59)
76.5
(-2.92)
496.9
(0.44)
312.2
(0.32)
2001-02 7146
(2.07)
344.1
(-1.71)
67.6
(-11.63)
535.7
(7.81)
322.2
(3.20)
2002-03 7113
(-0.46)
343.7
(-0.12)
70.9
(4.88)
628.2
(17.27)
329.3
(2.17)
2003-04 7116
(0.04)
343.6
(-0.03)
70.9
(0.00)
628.3
(0.02)
329.1
(0.00) *Indian Co-operative Movement A Profile- 2006, National Resource Centre, National Co-operative Union of India, 2006. P.47.
1. GoI, First Five Year Plan, Planning Commission, 1951, pp.165-167.
2. GoI, Second Five Year Plan, Planning Comm., 1956-1961.
3. Memoria C.B., Kamat G.S., “Co-operation: Theory and Practice”, Kitab Mahal, Allahabad, 1975. P.63.
119
The table No.4.3.3 shows the progress of farming co-operative societies in India
for last ten years i.e. during the period of economic reforms. Number of societies
increased from 6652 in 1994-95 to 7116 in 2003-04. Therefore, growth rate of these
societies was uneven during the same period as it was 3.95 at 1995-96 decreased up to
0.04 in 2003-04. It was negative during the years 1997-98, 99-00, 2000-01 and in 2002-
03. Membership increased from 328.4 to 343.6 during for the period and share capital
increased from Rs.67.4 million in 1994-95 to Rs.70.9 million in 2003-04. Table shows
that the membership is also not even. Working capital increased from Rs.502 million in
1994-95 to Rs.628.3 million in 2003-04. As well as, turnover of the farming co-operative
societies was increased from Rs.182.3 million in 1994-95 to Rs.329.1 million in 2003-04,
shows around two times increase in total turnover. Therefore, the growth rate of share
capital, working capital and turnover is shown a declining trend along with negative rate.
Farming societies were mainly based on voluntary co-operative principle with two
objectives of realizing economic units and securing the development of the rural
economy, for assistance to the poorer sections.
Reasons of limited success of Co-operative Farming in India are such as- lack of
educated and enlightened leadership in the rural areas, lack of social consciousness
among the members, too much emphasis on membership rather than on quality, failure to
create confidence and enthusiasm among the workers, preponderance of absentee land
owners as members, lack of co-operative spirit in the village life, delay in realizing State
funds to the societies.1
4.3.2- Industrial Co-operatives- An Industrial co-operative consists of a co-operative
formed by artisans, craftsman, industrial laborers and small industrialists either of
undertaking production and marketing or for providing facilities and services to them.
Broadly, industrial co-operatives can be divided into two types; i) societies that undertake
production and ii) societies which provide service to their members. Production societies
are mainly primary societies while service society‟s functions are undertaken both by the
primary and the federal societies.
1. Gadgil Committee Report (1963), Minsitry of Co-operation, Government of India. Obtained by Memoria C.B., Saksena R.D., “Co-
operation in India”, Kitab Mahal, Allahabad, 1973. P.399.

120
Industrial co-operative societies have set up their federal bodies. These federal
bodies are organized on single industry as well as on multi-industry basis. Industrial
federations exist at the District and State level. State level federations admit primary co-
operative societies as their members. District and State level federations have federated
into national level bodies. Federations render several services e.g. supply of basic raw
materials, finishing materials, evolving new patterns of designs, sale of finishing
products, etc.
In India industrial Co-operatives get financial assistance from the Government,
Apex and Central Co-operative Banks, Industrial Co-operative Banks, State Bank of
India, Reserve Bank of India, and Commercial Banks. The Government provides
financial assistance through loans and also participates in the share capital.
Ministry of Industrial Development has classified the societies such as- Weavers
Co-operatives, Spinning Mills, Industrial Co-operative Banks, Industrial Estate, and
Others which include Paddy, Pottery, Oil Crushing, Canning of fruits and vegetables,
Chemical Industries, Handicrafts Industries, Leather Goods, Construction Materials,
Sericulture, Spinning Societies, Coir and Miscellaneous Industries.
After Independence, the Industrial Policy Resolution of 1948 gave special
attention on cottage and small scale industries. The Resolution envisaged that in the
mixed economic order, where the key industries will be in the public sector, the village
and cottage industries would be organized and developed on co-operative lines.
Afterwards the Industrial Policy Resolution of 1956 emphasized the formation and
development of industrial co-operatives in the country.
As a result of various measures such as setting up of separate Boards for different
industries, liberal financial assistance in marketing of products and programs of
improving the productivity of the workers etc. the organization of industrial co-operative
societies received a definite encouragement and from 1951 to 1971-72, as a result the
number of societies, their membership, working capital and sales etc. increased
considerably.
Following table shows the progress of industrial co-operatives in India.

121
Table No.4.3.4- Progress of Industrial Co-operatives in India.*
(Rs. in Crore)
Year No of Societies Membership
(000)
Working Capital Sale
1950-51 7101 766 7.05 N.A.
1960-61 33266
(368.5)
2564
(234.7)
44.42
(530.0)
69.85
(---)
1970-71 46640
(40.2)
3022
(17.8)
212.93
(379.3)
163.00
(183.3)
1971-72 48000
(2.9)
3300
(9.2)
220.00
(3.3)
173.00
(6.1)
*Memoria C.B., Kamat G.S., “Co-operation: Theory and Practice”, Kitab Mahal, Allahabad, 1975. P.68.
The data in above Table No. 4.3.4 substantially brings out the progress of
industrial co-operatives during the initial two decades of the planned India. It increased
from 7101 in 1950-51 to 48000 in 1971-72 whereas the membership increased from 766
thousand to 3300 thousand and working capital Rs.7.05 crore to Rs.220.00 crore; growth
rate of the societies was uneven and compare to year 1960-61 it is shown declining trend,
therefore, it was positive. Sale of industrial co-operatives increased from Rs.69.85 crore
to Rs.173.00 crore during 1960-61 to 1971-72. Therefore, number of societies,
membership, working capital and sale of industrial co-operatives is shown a declining
trend under these twenty years span period.
Table No. 4.3.5- Progress of Weavers and Non- Weavers Co-operatives in India.*
(Value Rs. in Million)
Weavers Co-operatives Non- Weavers Co-operatives
Items 2002-03 2003-04 2002-03 2003-04
No. of Co-operatives
Membership (000’)
Share Capital
Govt. participation in Share Capital
Working Capital
Total Assets
Value of Product Sold
20,940
1,91771
611.38
36.6%
9113.9
5130.7
14,687.8
20,871
(-0.33)
1,9191
(0.07)
1608.78
(Negligible)
40.03%
(3.43%)
9041.1
(Negligible)
5402.2
(5.29)
14,458.3
(-1.56)
49,142
2,255100
951.1
34.7%
4400.5
1495.0
5297.0
48,841
(-0.61)
2,256543
(0.06)
964.7
(1.43)
34.2%
(-0.5)
4410.5
(0.02)
1486.7
(-0.56)
5301.5
(0.08)
*Indian Co-operative Movement A Profile- 2006, National Resource Centre, National Co-operative Union of India, 2006. P.44.
122
Table No. 4.3.5 shows the progress of Weavers and Non-Weavers Co-operatives
in India. Number of weavers‟ co-operatives increased from 20,940 to 20,871 and non-
weavers co-operatives from 49,142 to 48,841 during 2002-03 to 2003-04 with growth
rate of -0.33 and -0.61 respectively. For the same period the membership increased from
19177 to 19191 thousand and 2255100 to 2256543 thousand whereas growth rate was
0.07 and 0.06 respectively. Share capital of weavers increased from Rs.1611.38 to
Rs.1608.78 million and non-weavers increased from Rs.951 to Rs.964 million during the
period from 2002-03 to 2003-04. Government contribution in share capital of weavers‟
co-operatives was 36.6% in 2002-03 which increased to 40.03% in 2003-04 and for non-
weavers the same increased from 34.7% in 2002-03 to 34.2% in 2003-04. Working
capital of weavers‟ co-operatives decreased from Rs.9113 to Rs.9041.1 million and non-
weavers working capital increased from Rs.4400.5 to Rs.4410.5 million during the same
period. Growth rate of total assets and value of product sold was also very less.
Therefore, table shows that the progress is uneven and not much more remarkable.
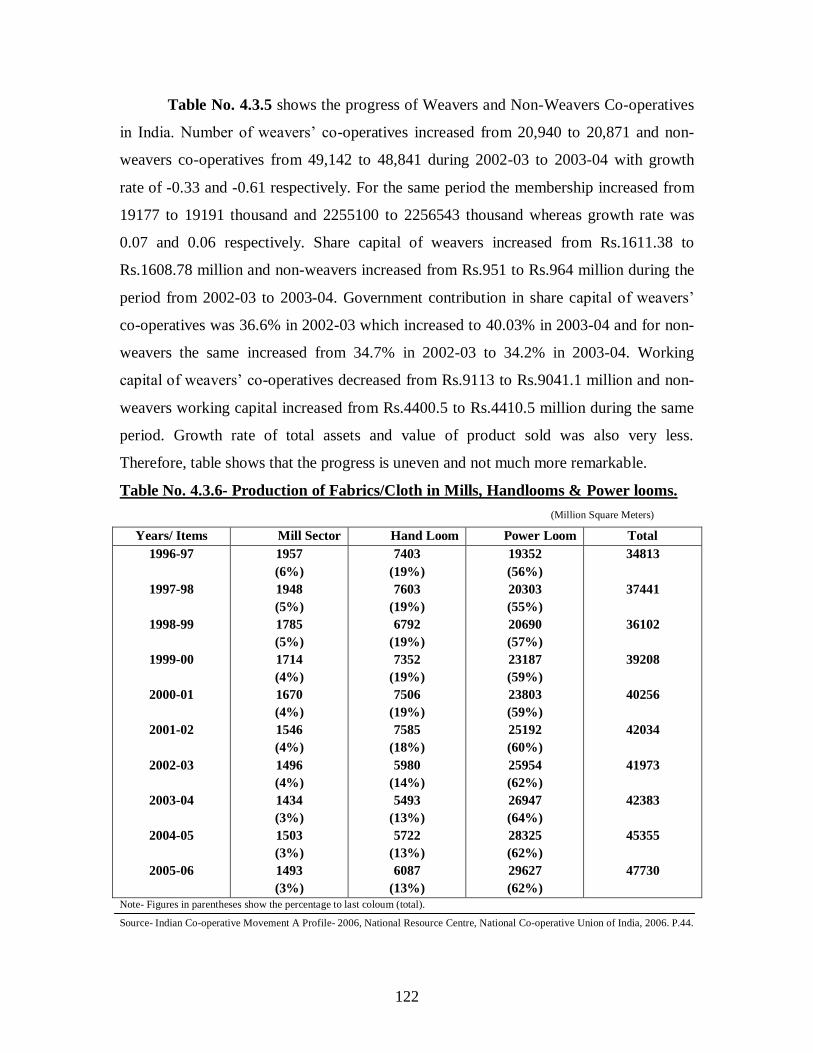
Table No. 4.3.6- Production of Fabrics/Cloth in Mills, Handlooms & Power looms.
(Million Square Meters)
Years/ Items Mill Sector Hand Loom Power Loom Total
1996-97
1997-98
1998-99
1999-00
2000-01
2001-02
2002-03
2003-04
2004-05
2005-06
1957
(6%)
1948
(5%)
1785
(5%)
1714
(4%)
1670
(4%)
1546
(4%)
1496
(4%)
1434
(3%)
1503
(3%)
1493
(3%)
7403
(19%)
7603
(19%)
6792
(19%)
7352
(19%)
7506
(19%)
7585
(18%)
5980
(14%)
5493
(13%)
5722
(13%)
6087
(13%)
19352
(56%)
20303
(55%)
20690
(57%)
23187
(59%)
23803
(59%)
25192
(60%)
25954
(62%)
26947
(64%)
28325
(62%)
29627
(62%)
34813
37441
36102
39208
40256
42034
41973
42383
45355
47730
Note- Figures in parentheses show the percentage to last coloum (total).
Source- Indian Co-operative Movement A Profile- 2006, National Resource Centre, National Co-operative Union of India, 2006. P.44.

123
Data of the Table No.4.3.6 shows the production of fabrics or cloth in mills of the
category of Handlooms and Power looms during the last decade. Production of mill
sector was 1957 million square meter (6% to total) in 1996-97 which decreased to 1493
(3% to total) in 2005-06. Handloom production was 7403 million square meters (19%) in
1996-97 but decreased to 6087 million square meters (13%) in 2005-06. For the same
period Power Loom production increased from 19352 million square meters (56%) to
29627 million square meters (62%). Total production of fabrics cloth in mills i.e.
handlooms and power looms increased from 34813 million square meters to 47730
million square meter for the above stated period. As well as in total production of fabrics
power loom production was highest compare to mill sector and hand loom.
However, Industrial Co-operatives suffered of several problems; such as-
inadequate supervision and inspection and lack of prompt audit, irregular and insufficient
supply of raw materials, fluctuations prices, insufficient storage facilities, lack of cheap
and adequate finance, accumulation of unsold stock, monopoly of middlemen and traders,
etc. The over-all picture of working of industrial co-operatives for the reforms period has
been discouraging.
4.3.3- Processing Co-operatives- Processing co-operatives in India began working with
the setting up of a ginning unit in 1917. Afterwards Sugar Co-operatives, paddy husking,
groundnut decorticating got also added to the sector. Co-operative processing units are
registered under the Co-operative Societies Act of the concern State and up till now work
is regulated by co-operative rules and by-laws. The membership consists of individual
agricultural producers, co-operative marketing societies and Government service co-
operatives located in the area.
In order to enable processing units require block capital for construction of
building and installation of plant and machinery which is raised through contribution by
the members to share capital, State contribution to the share capital, medium/ long term
loans from the Industrial Finance Corporation, State Co-operative Banks and State Bank
of India.
More co-operatives in the field of jute, oil crushing, fruit and vegetables, copra,
teas were set up during the plan periods. Processing co-operatives gained special

124
attention during the plan periods. Third Five Year Plan, considered the development of
co-operative processing as an essential not only for increasing rural incomes and
facilitating credit for production, but also for building up a through co-operatives rural
economy.
Table No. 4.3.7- Progress of Sugar Co-operatives in India.*
(Value Rs. in million)
Items/ Years 2003-04 2004-05 2005-06
No. of Installed Sugar Factories
No. of Factories in Operation
Membership (Million)
Share Capital
Working Capital
Turnover (Total)
316
235
5.264
N.A.
N.A.
N.A.
315
(-0.32)
203
(-13.62)
5.136
(-2.43)
33,235.7
(--)
87.366.1
(--)
12,808.0
(--)
316
(0.32)
239
(17.73)
5.136
(0.00)
32,226.4
(-3.03)
87,366.1
(0.00)
12,808.0
(0.00)
*Indian Co-operative Movement A Profile- 2006, National Resource Centre, National Co-operative Union of India, 2006. P.37.
The above Table No.4.3.7 brings out the performance of Sugar Co-operatives in
India between the periods of 2003-04 to 2005-06. In all the progress of co-operative
sugar factories for the reforms period does not bring out any significant progress. The
number of installed factories remained stagnant whereas for membership shows little
decline; share capital of them has decline whereas the working capital and turnover
remained constant. This is not only because of the economic reforms but overall
economic problems that have been faced by the Indian agriculture. Sugar co-operatives in
India in general and that of Maharashtra in particularly served as centers of the several
economic growths. The role played by sugar co-operatives has remained significant even
during the period of economic reforms.
125
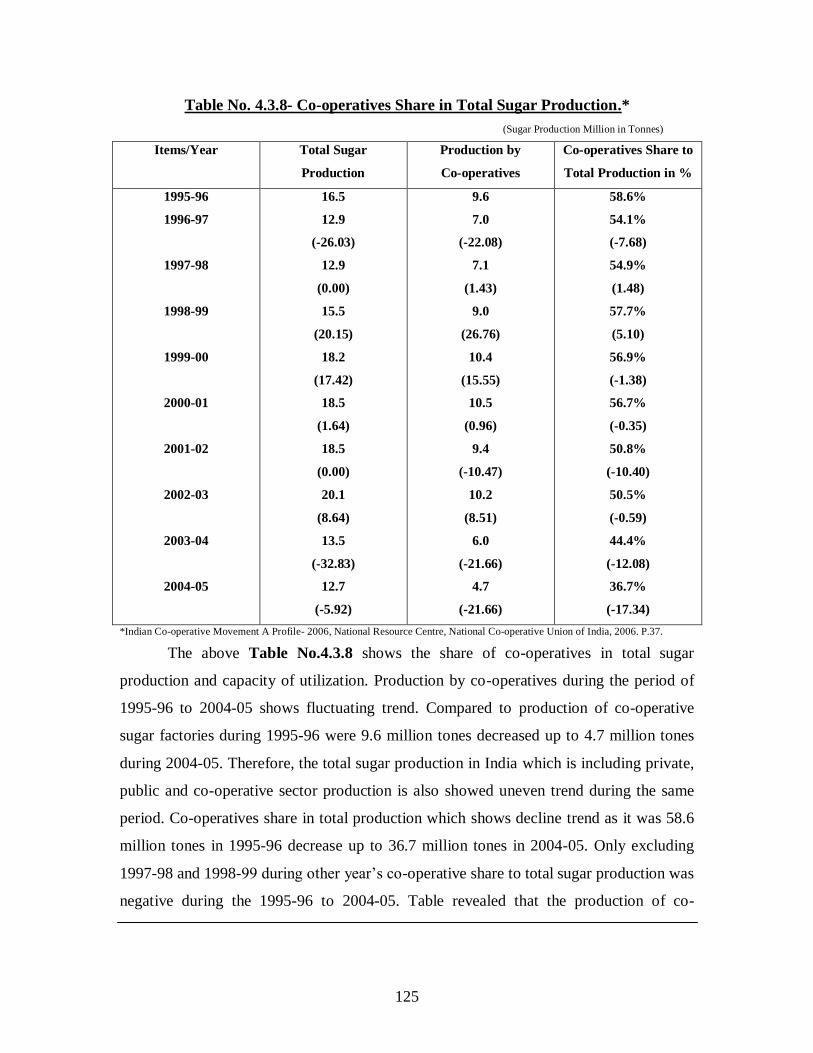
Table No. 4.3.8- Co-operatives Share in Total Sugar Production.*
(Sugar Production Million in Tonnes)
Items/Year Total Sugar
Production
Production by
Co-operatives
Co-operatives Share to
Total Production in %
1995-96
1996-97
1997-98
1998-99
1999-00
2000-01
2001-02
2002-03
2003-04
2004-05
16.5
12.9
(-26.03)
12.9
(0.00)
15.5
(20.15)
18.2
(17.42)
18.5
(1.64)
18.5
(0.00)
20.1
(8.64)
13.5
(-32.83)
12.7
(-5.92)
9.6
7.0
(-22.08)
7.1
(1.43)
9.0
(26.76)
10.4
(15.55)
10.5
(0.96)
9.4
(-10.47)
10.2
(8.51)
6.0
(-21.66)
4.7
(-21.66)
58.6%
54.1%
(-7.68)
54.9%
(1.48)
57.7%
(5.10)
56.9%
(-1.38)
56.7%
(-0.35)
50.8%
(-10.40)
50.5%
(-0.59)
44.4%
(-12.08)
36.7%
(-17.34)
*Indian Co-operative Movement A Profile- 2006, National Resource Centre, National Co-operative Union of India, 2006. P.37.
The above Table No.4.3.8 shows the share of co-operatives in total sugar
production and capacity of utilization. Production by co-operatives during the period of
1995-96 to 2004-05 shows fluctuating trend. Compared to production of co-operative
sugar factories during 1995-96 were 9.6 million tones decreased up to 4.7 million tones
during 2004-05. Therefore, the total sugar production in India which is including private,
public and co-operative sector production is also showed uneven trend during the same
period. Co-operatives share in total production which shows decline trend as it was 58.6
million tones in 1995-96 decrease up to 36.7 million tones in 2004-05. Only excluding
1997-98 and 1998-99 during other year‟s co-operative share to total sugar production was
negative during the 1995-96 to 2004-05. Table revealed that the production of co-

126
operative sector and share of co-operatives to total production is decreased during the
same period.
Table No. 4.3.9- Progress of Co-operative Spinning Mills in India.*
(Membership & Spindles in 000‟)
Year/ Items No. of Installed Mills Membership Spindleage in Production
1994-95
1997-98
1998-99
1999-00
2000-01
2001-02
2003-04
2004-05
137
135
(-1.46)
137
(1.48)
157
(14.60)
160
(1.91)
158
(-1.25)
159
(0.63)
160
(0.62)
5772
6940
(20.23)
7754
(11.73)
7754
(0.00)
7754
(0.00)
7754
(0.00)
7754
(0.00)
7754
(0.00)
3300
3273
(-0.82)
3313
(1.22)
3470
(4.74)
3518
(1.38)
3463
(-1.56)
3474
(0.32)
3534
(1.73)
*Indian Co-operative Movement A Profile- 2006, National Resource Centre, National Co-operative Union of India, 2006. P.38
The data in above table shows the progress of co-operative spinning mills in
India. Number of installed co-operative mills increased from 137 to 160 during 1994-95
to 2004-05. Therefore, the growth rate shows that progress was uneven. Membership
gone up from 5772 to 7754 during the same period but number of membership was
constant from 1998-99 to 2004-05. Spindleage in production increased from 3300
thousand in 1994-95 to 3534 thousand in 2004-05. Therefore, the progress of spindleage
in production was shows uneven progress during the period of 1994-95 to 2004-05
growth rate shows minus progress during the years 1997-98 and 2003-04, -0.82 and -
1.56, respectively.
During the 2004-05 the total number of installed co-operative spinning mills was
160. Total share capital was Rs.3729.50 million whereas the government participation
was 89.47%. Total working capital of co-operative spinning mills was Rs.2041.1 million;
total reserves were Rs.7414.8 and total assets was Rs.16273 million in the year 2004-05.1
1. Indian Co-operative Movement A Profile- 2006, National Resource Centre, National Co-operative Union of India, 2006. P.38.

127
Table No. 4.3.10- Progress of Dairy Co-operatives in India.*
(Value Rs. in Million)
Year/Items Societies
(In 000’)
Membership
(In Million)
Liquid Milk Marketed
(Million Liters/day)
Annual Avg. Milk
Production
1995-96
1996-97
1997-98
1998-99
1999-00
2000-01
2001-02
2002-03
2003-04
2004-05
72.74
77.99
(7.22)
85.52
(2.62)
87.76
(14.62)
100.56
(3.62)
104.20
(1.19)
105.44
(5.28)
111.01
(3.90)
115.34
(5.06)
121.18
(5.20)
9.31
9.60
(3.11)
9.87
(2.81)
10.50
(6.38)
11.10
(5.71)
11.47
(3.33)
11.64
(1.48)
11.81
(1.46)
12.64
(7.03)
12.95
(2.45)
9.9
10.5
(6.06)
11.1
(5.71)
11.8
(6.31)
12.0
(1.69)
13.4
(11.66)
13.4
(0.00)
13.7
(2.24)
14.9
(8.76)
15.6
(4.70)
11.0
12.2
(10.90)
12.5
(2.46)
12.9
(3.20)
13.1
(1.55)
16.5
(25.95)
17.6
(6.66)
18.0
(2.27)
17.5
(2.77)
20.1
(14.85)
65.0
70.1
(7.84)
70.6
(0.71)
75.4
(6.80)
78.3
(3.85)
80.6
(2.55)
84.4
(4.71)
86.2
(2.13)
88.1
(2.20)
91.0
(3.29)
*Indian Co-operative Movement A Profile- 2006, National Resource Centre, National Co-operative Union of India, 2006. P.40.
The information in Table No.4.3.10 clears the progress of dairy co-operatives in
India for the reforms period. Number of societies increased from 69.80 (1994-95) to
125.25 thousand in 2005-06. Average growth rate of dairy co-operatives societies was
nearly five during the period. Membership increased from 8.99 million to 13.01 million
during the same period, whereas the growth rate shows declining trend. Liquid milk
marketed increased from 9.4 million liters to 16.8 million liters of which the annual
average was 10.3 per cent in 1994-95 increased up to 21.4 per cent in 2005-06. Income
out of milk production increased from Rs.63.5 to Rs.91.0 million from 1994-95 to 2005-
06. Growth rate of milk production showed fluctuating trend during the same period.
During the year 2004-05, number of dairy co-operatives was 121.180 thousands
with 12.95 million members, out of total membership women members were 2.963
128
million. Share capital of dairy co-operatives was Rs.3743.5 million, government
participation in total share capital was 26.6%, working capital was Rs.20915.3 million,
own assets Rs.18603.6 million and turnover was Rs.54272.3 million. Milk and milk
products sold by dairy co-operatives were worth Rs.33191.9 million during 2004-05.
Dairy Co-operatives have been instrumental in transforming the rural economy on
the lines of co-operative sugar factories. The states like Gujarat and Maharashtra are the
leading examples.
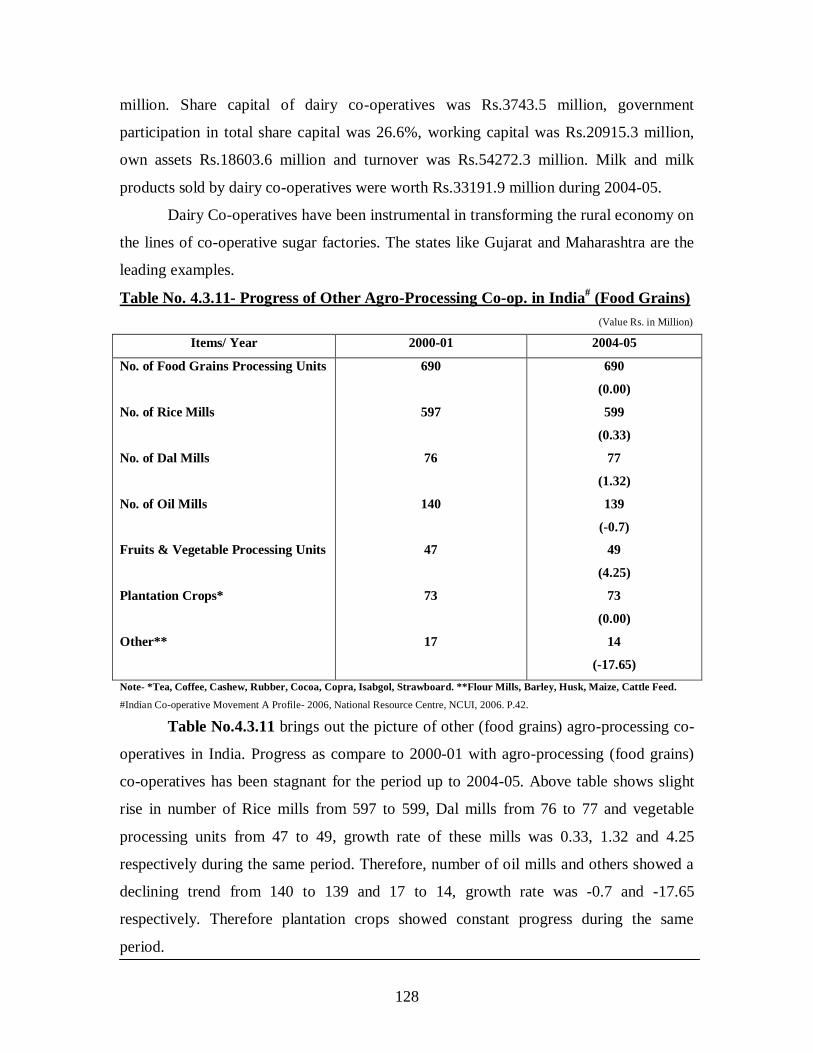
Table No. 4.3.11- Progress of Other Agro-Processing Co-op. in India# (Food Grains)
(Value Rs. in Million)
Items/ Year 2000-01 2004-05
No. of Food Grains Processing Units
No. of Rice Mills
No. of Dal Mills
No. of Oil Mills
Fruits & Vegetable Processing Units
Plantation Crops*
Other**
690
597
76
140
47
73
17
690
(0.00)
599
(0.33)
77
(1.32)
139
(-0.7)
49
(4.25)
73
(0.00)
14
(-17.65)
Note- *Tea, Coffee, Cashew, Rubber, Cocoa, Copra, Isabgol, Strawboard. **Flour Mills, Barley, Husk, Maize, Cattle Feed.
#Indian Co-operative Movement A Profile- 2006, National Resource Centre, NCUI, 2006. P.42.
Table No.4.3.11 brings out the picture of other (food grains) agro-processing co-
operatives in India. Progress as compare to 2000-01 with agro-processing (food grains)
co-operatives has been stagnant for the period up to 2004-05. Above table shows slight
rise in number of Rice mills from 597 to 599, Dal mills from 76 to 77 and vegetable
processing units from 47 to 49, growth rate of these mills was 0.33, 1.32 and 4.25
respectively during the same period. Therefore, number of oil mills and others showed a
declining trend from 140 to 139 and 17 to 14, growth rate was -0.7 and -17.65
respectively. Therefore plantation crops showed constant progress during the same
period.

129
Agro processing in India has a greater scope than other rural industry. Mere 2% of
the total agro production is processed and large amount of the produce is wasted in transit
and storage. Also the agriculture price fluctuations are influenced by seasonality where
the processing can have a greater role to play. The co-operative sector still emerges as
one of the important processing of agriculture produce in India.
Table No. 4.3.12- Progress of Transport Co-operatives in India.*
(Value Rs. in Million)
Items/ Years 2000-01 2004-05
No. of Societies
Membership
Share Capital
Govt. Participation in Share Capital
Reserves
Working Capital
No. of Societies in Profit
Employment
7,693
1,51,512
229.0
5.7%
201.87
1782.24
867
7,049
7,697
(0.05)
1,51,516
(0.002)
228.5
(-0.22)
5.8%
(1.75%)
201.9
(0.05)
1856.33
(4.16)
880
(1.50)
6,875
(-2.47)
* Indian Co-operative Movement A Profile- 2006, National Resource Centre, National Co-operative Union of India, 2006. P.42.
Table No. 4.3.12 shows the progress of transport co-operatives from the period
2000-01 to 2004-05. Number of societies increased from 7,697 to 7,697 (0.05 growth
rate), membership 1,51,512 to 1,51,516, share capital decreased from Rs.229.0 million to
Rs.228.5 (-0.22) while government participation in share capital increased from 5.7% to
5.8%, Reserves increased from Rs.201.87 million to Rs. 201.9 million (0.05), working
capital increased from Rs.1782.24 million to Rs.1856.33 million (4.16) from 2000-01 to
2004-05. Number of societies in profit stood at 867 in 2000-01 increased up to 880 (1.50)
in 2004-05. Therefore, employment generation by transport co-operatives decreased from
7,049 to 6,875 (-2.47) during the same period.
130
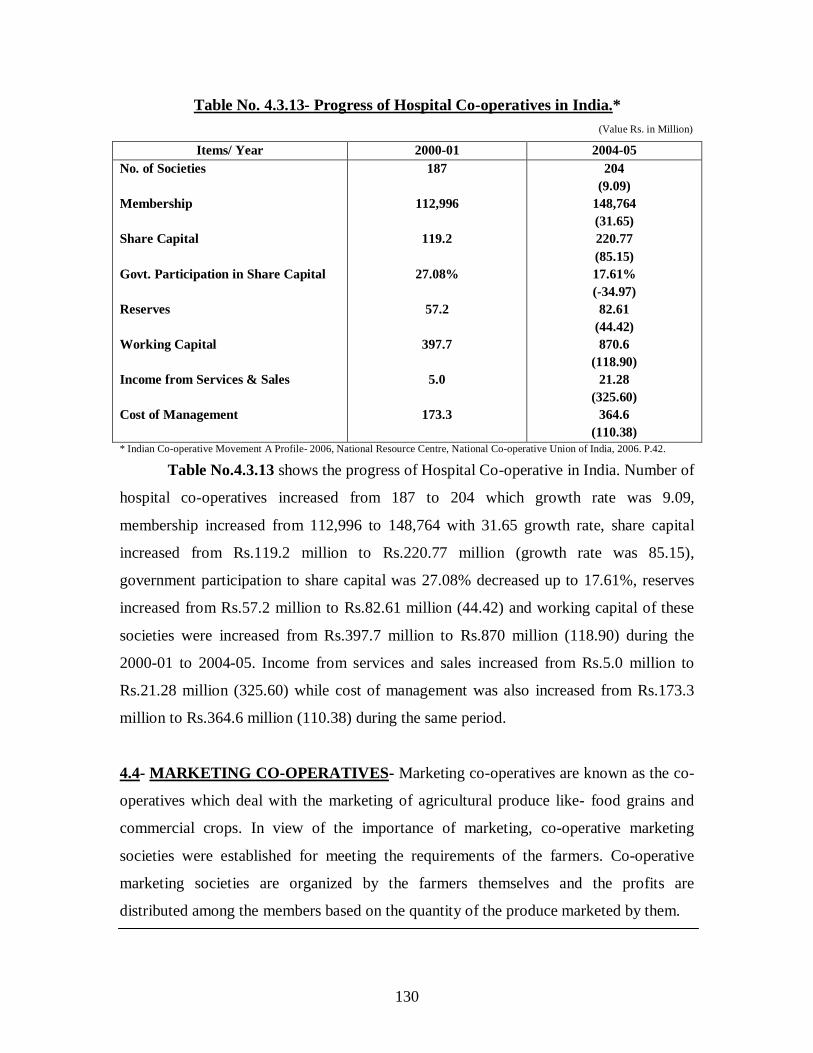
Table No. 4.3.13- Progress of Hospital Co-operatives in India.*
(Value Rs. in Million)
Items/ Year 2000-01 2004-05
No. of Societies
Membership
Share Capital
Govt. Participation in Share Capital
Reserves
Working Capital
Income from Services & Sales
Cost of Management
187
112,996
119.2
27.08%
57.2
397.7
5.0
173.3
204
(9.09)
148,764
(31.65)
220.77
(85.15)
17.61%
(-34.97)
82.61
(44.42)
870.6
(118.90)
21.28
(325.60)
364.6
(110.38)
* Indian Co-operative Movement A Profile- 2006, National Resource Centre, National Co-operative Union of India, 2006. P.42.
Table No.4.3.13 shows the progress of Hospital Co-operative in India. Number of
hospital co-operatives increased from 187 to 204 which growth rate was 9.09,
membership increased from 112,996 to 148,764 with 31.65 growth rate, share capital
increased from Rs.119.2 million to Rs.220.77 million (growth rate was 85.15),
government participation to share capital was 27.08% decreased up to 17.61%, reserves
increased from Rs.57.2 million to Rs.82.61 million (44.42) and working capital of these
societies were increased from Rs.397.7 million to Rs.870 million (118.90) during the
2000-01 to 2004-05. Income from services and sales increased from Rs.5.0 million to
Rs.21.28 million (325.60) while cost of management was also increased from Rs.173.3
million to Rs.364.6 million (110.38) during the same period.
4.4- MARKETING CO-OPERATIVES- Marketing co-operatives are known as the co-
operatives which deal with the marketing of agricultural produce like- food grains and
commercial crops. In view of the importance of marketing, co-operative marketing
societies were established for meeting the requirements of the farmers. Co-operative
marketing societies are organized by the farmers themselves and the profits are
distributed among the members based on the quantity of the produce marketed by them.

131
4.4.1- Agricultural Marketing Societies- Advantages of marketing co-operatives are,
increases bargaining strength of the farmers, remove the intermediaries and enter into
direct relations with the final buyers, provide credit and better returns on their produce,
cheaper transport, storage facilities, grading and standardization, processing of
agricultural production, better prices, provision of inputs (i.e. seeds, manures, fertilizers,
pesticides, etc.) as well as consumer goods at relatively lower prices. Marketing co-
operatives are established primarily to provide marketing facilities to the members.
Two types of co-operative marketing structures are found in India. One, there is a
two tier system with primary societies/Mandi at base level and the State society at the
apex. Under second type, there is three-tier system, it is operational in Andhra-Pradesh,
Gujarat, Haryana, Himachal Pradesh, Karnataka, Maharashtra, Manipur, Punjab, Tamil-
Nadu, Utter-Pradesh and Pondicherry (i.e. Mandi/ Primary societies at the village level,
Central Marketing Societies at District level and State Marketing Society at apex level).
Table No. 4.4.14- Progress of Primary Marketing Co-operative Societies in India.*
(Value Rs. in Million)
Items/Years 1998-99 1999-00 2000-01 2001-02 2002-03 2003-04
No. of Societies
Membership (000’)
Share Capital
Govt. Participation %
Total Turnover
Agril. Prod. Marketed
Inputs Sold
Consumer Goods Sold
10,906
5,087
3,227.8
42%
110,840.1
28,132.7
16,737.3
14,897.9
10,615
(-2.67)
5,018
(-1.35)
3,099.7
(-3.97)
45.1%
(7.38)
110,747.2
(-0.08)
30,214.8
(7.40)
17,401.8
(3.96)
14,026.1
(-5.85)
10,636
(3.41)
5,289
(5.40)
2,897.9
(-6.51)
46.8%
(3.77)
114,497.9
(3.39)
25,822.3
(-14.54)
19,696.7
(13.19)
15,221
(8.52)
10,632
(-0.63)
5,376
(1.64)
2,880.8
(-0.59)
47.8%
(2.14)
72,146.7
(-36.99)
38,229.2
(48.05)
20,162.2
(2.36)
14,120.4
(-7.23)
10,709
(12.18)
5,459
(1.54)
3,028.4
(5.12)
47.4%
(-0.83)
79,728.4
(10.51)
45,441.3
(18.86)
19,250.1
(-4.52)
14,173
(0.37)
10,710
(0.14)
5,369
(-1.65)
2,600.3
(-14.13)
52.2%
(10.13)
77,396.3
(-2.92)
43,912.7
(-3.36)
19,033.3
(-1.13)
13,600.9
(-4.04)
*Indian Co-operative Movement A Profile- 2006, National Resource Centre, National Co-operative Union of India, 2006. P.31.
The above Table No.4.4.14 brings out the situation of primary marketing co-
operatives in India. Number of societies stood at 10,906 at 1998-99 decreased up to
10,710 in 2003-04 growth rates fluctuated during these years. The number of societies
decreased due to financial performance is not satisfactory and a number of societies are
incurring losses. Membership increased from 5,087 thousand to 5,369 thousand during

132
1998-99 to 2003-04 growth rate shows negative during year 1999-00 and 2003-04. Share
capital decreased from Rs.3,227.8 million to Rs.2,600 million during the same period
with negative growth rate except year 2002-03. However, government participation
increased from 42% to 52.2% and growth rate was uneven. Total turnover decreased
from Rs.110,840.1 million to Rs.77,369.3 million. Agricultural production marketed was
Rs.28,132.7 million in 1998-99 increased up to Rs.43,912.7 million in 2003-04. The
growth rate regarding to primary marketing co-operative societies in India shows that the
progress made during these years was uneven. At the same time as the development of
agricultural co-operative marketing societies has been very uneven among different
states. As much as 81 per cent of the overall achievement was contributed by only six
states- Gujarat, Haryana, Karnataka, Maharashtra, Punjab and Utter Pradesh.1
Table No. 4.4.15- Progress of District/ Central Marketing Co-op. Societies in India.
(Value Rs. in Million)
Items/ Years 2002-03 2003-04
No. of District/ Central Level Societies
Membership
Share Capital
Govt. Participation in Share Capital
Working Capital
Reserves
Assets
Business Turnover
Agricultural Produce Marketed
Agricultural Requisites Sold
Consumer Goods Distributed
395
32,97,544
807.159
41.79%
14932.8
1321.2
9898.3
31430.0
21,380.5
6838.9
1,277.9
390
(-1.26)
32,91,315
(-0.19)
806.861
(-0.03)
41.5%
(-0.0069)
14976.7
(0.29)
1341.3
(1.51)
9898.23
(Negligible)
30175.94
(-3.99)
20178.3
(-5.62)
6782.4
(-0.82)
1285.1
(0.56)
Source- Indian Co-operative Movement A Profile- 2006, National Resource Centre, National Co-operative Union of India, 2006. P.33.
Table No.4.4.15 shows the progress of District/ Central Marketing Co-operative
Societies in India. Number of District Co-operative Marketing Societies stood at 395
1. Government of India, Planning Commission, Seventh Five Year Plan, 1985-90, Vol. II, P.26.
133
decreased up to 390 during 2002-03 to 2003-04, growth rate was -1.26. Membership was
32,97,544 decreased up to 32,91,315 with -0.19 growth rate, membership of the District/
Central Co-operative Marketing Societies consists of individuals and primary co-
operative societies. Share capital was Rs.807.1 million decreased up to Rs.806.8 million
(-0.03 growth rate), working capital increased from Rs.14932.8 million to Rs.14976.7
million during the same period which is slightly increased by 0.29 growth rate. Reserves
increased from Rs.1321 million to Rs.1341, business turnover was Rs.31430.0 million
decreased up to Rs.30175.9 million during 2002-03 to 2003-04. Agricultural produce
marketed and agricultural requisites sold decreased during the period from Rs.21,380.5
million to Rs.20,178.3 million and Rs.6838.9 million to 6782.4 million, respectively. The
growth rate shows that the overall progress was affected of the District Co-operative
Marketing Societies in India in economic reform period.
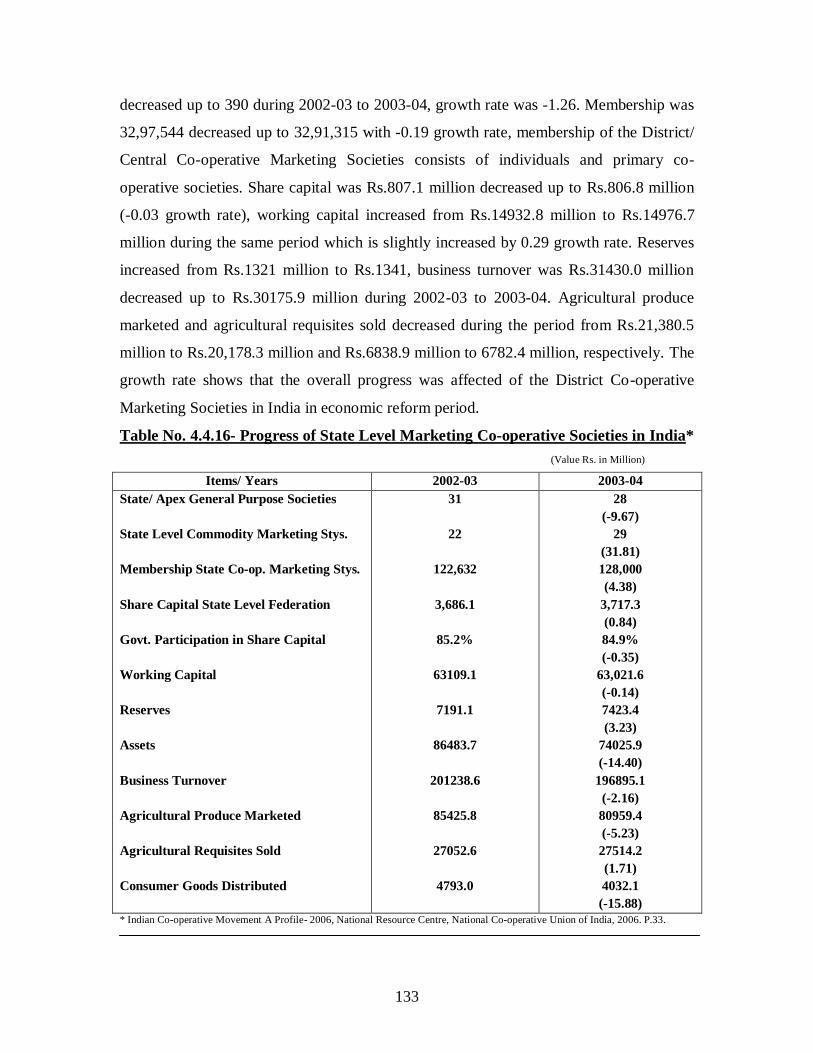
Table No. 4.4.16- Progress of State Level Marketing Co-operative Societies in India*
(Value Rs. in Million)
Items/ Years 2002-03 2003-04
State/ Apex General Purpose Societies
State Level Commodity Marketing Stys.
Membership State Co-op. Marketing Stys.
Share Capital State Level Federation
Govt. Participation in Share Capital
Working Capital
Reserves
Assets
Business Turnover
Agricultural Produce Marketed
Agricultural Requisites Sold
Consumer Goods Distributed
31
22
122,632
3,686.1
85.2%
63109.1
7191.1
86483.7
201238.6
85425.8
27052.6
4793.0
28
(-9.67)
29
(31.81)
128,000
(4.38)
3,717.3
(0.84)
84.9%
(-0.35)
63,021.6
(-0.14)
7423.4
(3.23)
74025.9
(-14.40)
196895.1
(-2.16)
80959.4
(-5.23)
27514.2
(1.71)
4032.1
(-15.88)
* Indian Co-operative Movement A Profile- 2006, National Resource Centre, National Co-operative Union of India, 2006. P.33.
134
Table No.4.4.16 shows the progress of State level marketing co-operative
societies in India. State/ Apex level general purpose societies were 31 in 2002-03
decreased up to 28 in 2003-04 shows negative growth rate -9.67. Therefore, State level
commodity marketing societies was 22 in 2002-03 increased up to 29 in 2003-04 with
31.81 growth rate. Membership increased from 122,632 to 128,000 with 4.38 growth rate
during the same period. Share capital increased from Rs.3,686 million to Rs.3,717
million growth rate was 0.84 but government participation was decreased from 85.2%
and 84.9%, respectively, from 2002-03 to 2003-04. Working capital stood at Rs.63109.1
million decreased up to Rs.63,021.6 million (-0.14), Reserves increased from Rs.7191.1
million to Rs.7423.4 million (3.23) and business turnover stood at Rs.201238.6 million
decreased up to Rs.196895.1 million (-2.16) in 2003-04. Agricultural produce marketed
stood at Rs.85425.8 million decreased up to Rs.80959.4 million (-5.23) in 2003-04.
Consumer goods distributed in 2002-03 Rs.4793.0 million decreased in 2003-04 up to
Rs.4132.1 million shows negative growth rate -15.88 during the years.
Agricultural marketing co-operatives have facing several problems, their
performance is not up to the mark due to inadequate working capital, traditional methods
of marketing, lack of technical support, lack of processing facilities, untrained personnel,
high operational cost, and lack of support from apex marketing societies, etc.
4.4.2- Consumers Co-operatives- A Consumer Co-operative is a voluntary organization
of consumers undertakes bulk purchases of consumer goods and sells to the members. As
the consumer co-operatives make purchases in bulk, from production centre they can
supply them to the members at reasonable rate.1
Co-operative movement was introduced in the world in the form of consumer‟s
co-operatives in the year 1844. Since then consumer‟s co-operatives have made a
tremendous progress in the western countries and have come to occupy an eminent
position in the national economics of those countries.2
The aim of consumer‟s co-operatives is to serve their members with consumer
and other goods of pure quality at reasonable rate, to hold price line to protect consumers
1. Subba Reddy, Raghu Ram, Sastry Neelakanta & Bhavani Devi, “Agricultural Economics”, Oxford & IBH Pub. Co. Pvt. Ltd., New
Delhi, 2004. P.79.
2. Bedi R.D., “Theory, History and Practice of Co-operation”, Loyal Book Depot, Meerut, 1971, P.384.

135
from exploitation, provide members social services and to undertake manufacture of
goods.
In India, the first consumer‟s co-operative was organized in 1904 at Madras, with
the aim of supplying necessities of life to its members. Co-operative stores did not
become popular with the consumers. However, during the Second World War,
consumer‟s co-operative movement made a good progress. In order to check the rise in
prices and ensure equitable distribution, the Government entrusted the work of
distribution of controlled commodities to co-operative stores. During the Plan period,
several efforts were made to consolidate, strengthen and reorganize the movement.
The organization of the consumer‟s co-operatives is not uniform. Some are
organized on a unitary pattern, other on a federal pattern. The earlier co-operatives
operate through branches and undertake procurement and supply. The latter co-operatives
form wholesale organization to give support to the earlier ones.
Table No. 4.4.17- Progress of Primary Co-operative Consumer’s Stores in India.*
(Value Rs. in Million)
Year/
Items
No. of
Stores
Sale per
Store
Working
Capital
Sales
Controlled
Sales Non-
Controlled
Ratio of
WC/
Turnover
% Share
of
Controlled
% of
Profit
Mkg.
1995-96
1996-97
1997-98
1998-99
1999-00
2000-01
2001-02
2002-03
2003-04
2004-05
26817
28275
(5.44)
26501
(-6.22)
26415
(-0.32)
24684
(-6.55)
24696
(0.05)
24714
(0.07)
21962
(-11.13)
21032
(-4.23)
20946
(-0.40)
0.54
0.52
(-0.70)
0.68
(30.77)
0.65
(-0.41)
0.75
(15.38)
0.63
(-16.00)
0.63
(0.00)
0.68
(7.93)
0.67
(-1.47)
0.71
(5.97)
2341.3
2648.1
(13.11)
3232.0
(22.05)
3000.8
(-7.18)
3402.2
(13.40)
3484.2
(2.41)
3923.1
(12.60)
4693.6
(19.63)
4619.1
(-1.58)
5215.9
(12.90)
8921.6
8631.2
(-3.25)
8700.9
(0.80)
0460.3
(-94.71)
0863.2
(87.61)
9615.1
(1014.13)
5938.7
(-38.24)
5686.0
(-4.24)
5675.7
(-0.19)
6493.6
(14.41)
5032.6
4983.8
(-0.97)
5043.6
(1.20)
6735.1
(33.55)
6994.6
(3.84)
6889.3
(-1.50)
9486.8
(37.70)
8994.9
(-9.17)
8169.6
(-8.87)
8209.1
(0.49)
5.5
5.7
(3.64)
4.7
(17.54)
5.8
(23.40)
5.9
(1.72)
4.8
(-18.64)
4.0
(-16.66)
3.2
(-20.00)
3.0
(-6.25)
2.9
(-3.33)
63.9
63.9
(0.00)
57.3
(-10.33)
60.2
(5.06)
53.9
(-10.46)
57.3
(16.30)
38.1
(-33.50)
38.2
(0.26)
40.4
(5.76)
43.6
(7.92)
49.0
48.4
(-1.22)
42.3
(-12.60)
40.3
(-4.72)
38.2
(-5.21)
38.1
(-0.26)
36.2
(-4.98)
36.5
(0.82)
35.5
(-2.73)
36.3
(2.25)
* Indian Co-operative Movement A Profile- 2006, National Resource Centre, National Co-operative Union of India, 2006. P.34.

136
Table No.4.4.17 shows the progress of primary co-operative consumers‟ stores in
India during 1995-96 to 2004-05. Number of stores decreased from 26817 to 20946
during 1995-96 to 2004-05 except the year 2000-01 the growth rate was negative. Sale
per store increased from Rs.0.54 million to Rs.0.71 million, even the growth rate was
uneven. Working capital increased two times from Rs.2341.3 million to Rs.5215.9
million therefore growth rate was uneven during the same period. Sales controlled by
stores was Rs.8921.6 million in 1995-96 increased up to Rs.6493.6 million in 2004-05.
However, percentage of controlled share decreased during the same period as 63.9% to
43.6%. A sale non-controlled was Rs.5032.6 million in 1995-96 increased up to
Rs.8209.1 million in 2004-05 even growth rate was uneven. Profit of stores from
marketing was 49% in 1995-96 decreased put 36.3% in 2004-05, except the year 1995-
96, 2002-03 and 2004-05 there was a negative growth. Several weakness are founds in
consumers stores operating, lack of funds, shortage of stock, storage facility, handing
procedures, auditing, etc. should be removed from co-operative consumer stores to
improve their profit base.
Table No. 4.4.18- Progress of Wholesale Consumer’s Co-operatives in India.*
(Value Rs. in Million)
Year/
Items
No. of
Wholesale
Stores
Working
Capital
Retail
Sales
Wholesale
Sales
Total
Sales
Ratio of
WC/
Turnover
% Share
of
Controlled
% of
Profit
Mkg.
1994-95
1995-96
1997-98
1998-99
1999-00
2000-01
2001-02
2002-03
2003-04
2004-05
666
676
(1.50)
696
(2.96)
697
(0.14)
713
(2.29)
713
(0.00)
740
(3.78)
716
(-3.24)
674
(-5.86)
695
(3.11)
2618
2740
(4.66
2874
(4.89
4566
(58.87
5312
(16.34
5574
(4.93
5516
(-1.04
5736
(3.99
5854
(2.06
5932
(1.33
8439
9687
(14.78)
9699
(0.12)
11032
(13.74)
12132
(9.97)
9925
(-18.19)
N.A.
(--)
N.A.
(--)
11651
(--)
11735
(0.72)
7876
9834
(24.86)
11160
(13.48)
8691
(-22.12)
10129
(16.54)
12082
(19.28)
N.A.
(--)
N.A.
(--)
10597
(--)
11462
(8.16)
16315
19521
(19.65)
20859
(6.85)
21322
(2.22)
22508
(5.56)
21492
(-4.51)
23544
(9.54)
21789
(-7.45)
22248
(2.10)
23197
(4.26)
6.0
5.2
(-13.33)
7.2
(38.46)
4.7
(-32.72)
4.2(-
10.64)
3.9
(-7.14)
4.3
(10.25)
3.8
(-11.62)
3.8
(0.00)
3.9
(2.63)
48
51
(6.25)
49
(-3.92)
53
(8.16)
55
(3.77)
55
(0.00)
47
(-14.54)
49
(4.25)
52
(6.12)
50
(-3.84)
46.0
48.5
(5.43)
44.3
(-8.66)
39.7
(-10.38)
43.0
(8.31)
43.0
(0.00)
38.5
(-10.46)
37.3
(-3.11)
39.6
(6.16)
40.6
(2.52)
* Indian Co-operative Movement A Profile- 2006, National Resource Centre, National Co-operative Union of India, 2006. P.35.

137
Table No. 4.4.18 shows the progress of wholesale consumers‟ co-operatives in
India. Number of wholesale stores was 666 in 1994-95 increased up to 695 in 2004-05
there for the growth was uneven. Working capital increased from Rs.2618 million to
Rs.5932 million during the same period even only during the year 2001-02 growth rate
was negative. Retail sales was Rs.8439 million in 1994-95 increased up to Rs.11735
million in 2004-05 but growth rate fluctuated during the same period. A wholesale sale
was Rs.7876 million in 1994-94 increased up to Rs.11462 in 2004-05. Total sales
increased from Rs.16315 million to Rs.23197 million during the same period. Ratio of
working capital/ turnover decreased from 6.0 to 3.9, share of controlled quite stable
increased from 48% to 50% during the same period. Percentage of profit marketing co-
operatives decreased from 46% to 40.6% during the same period. Growth rate shows that
the progress of wholesale consumer‟s stores was uneven during the same period.
Table No. 4.4.19- Progress of State Level Consumer’s Co-op. Federation in India.*
(Value Rs. in Million)
Year/
Items
No. of
State
Fedn.
Working
Capital
Wholesa
le Sales
Retail
Sales
Ratio of
WC/
Turnover
% of
Wholesale
% of
Controlled
% of
Profit
Mkg.
1995-96
1996-97
1997-98
1998-99
1999-00
2000-01
2001-02
2002-03
2003-04
2004-05
29
29
(0.00)
28
(-3.44)
28
(0.00)
29
(3.57)
29
(0.00)
29
(0.00)
30
(3.44)
30
(0.00)
30
(0.00)
2173
2287
(5.24)
2178
(-4.76)
3766
(72.91)
3954
(4.99)
6833
(72.81)
6420
(-6.04)
6478
(0.90)
4331
(-33.14)
4324
(-0.18)
7697
6476
(-15.86)
9588
(48.05)
12120
(26.40)
11412
(-5.84)
12824
(12.37)
N.A.
(--)
N.A.
(--)
17628
(--)
14124
(-19.88)
1891
1903
(0.63)
1628
(-14.45)
1832
(12.53)
2890
(57.75)
1749
(-39.48)
N.A.
(--)
N.A.
(--)
4418
(--)
4226
(-4.34)
4
4
(0.0)
5
(25.0)
5
(0.0)
4
(-20.0)
2
(-50.0)
2
(0.0)
2
(0.0)
5
(150.0)
4
(-20.0)
80
80
(0.00)
71
(-11.25)
76
(7.04)
89
(17.10)
N.A.
(--)
N.A.
(--)
N.A.
(--)
80
(--)
77
(-3.75)
20
25
(25.0)
27
(8.0)
36
(33.33)
33
(-8.33)
40
(21.21)
10
(-75.0)
13
(30.0)
6
(-53.84)
20
(233.33)
65
44
(-32.30)
46
(4.54)
50
(8.69)
50
(0.00)
N.A.
(--)
N.A.
(--)
33
(0.00)
33
(0.00)
33
(0.00) * Indian Co-operative Movement A Profile- 2006, National Resource Centre, National Co-operative Union of India, 2006. P.36.
Table No. 4.4.19 shows the progress of State Level Consumer‟s Co-operative
Federation in India. Number of State Federations stood at 30 in 2004-05. Working capital
of these federations was Rs.2173 million in 1995-96 increased up to Rs.4323 million
2004-05 but growth rate was uneven. Wholesale sale increased from Rs.7697 million to
Rs.14124 million, Retail sales was Rs.1891 million increased up to Rs.4226 million from
1995-96 to 2004-05. Ratio of working capital to turnover was stood constant to 4 per cent
138
of controlled sale decreased from 31 per cent to 20 per cent, percentage of profit
marketing also decreased from 65 per cent to 33 per cent during the same period.
Therefore, the growth rate shows that the progress of the federation was uneven during
the same period; it was recorded negative trend during some years.
There are several weakness finds in the progress of consumer co-operatives.
Consumer co-operatives have not made significant progress due to various structural,
operational and administrative difficulties such as a large number of uneconomic units,
small membership, weak finances, indifferent attitude of the Government, lack of
supervision, inspection, and defective and purchase policy, etc. However, it is possible
that if some measure adopted to remove these weakness
4.5- SERVICE CO-OPERATIVES- These societies provides every kind of services to
their members. Service co-operatives are created on voluntary form which works on co-
operative principles for the assistance of rural masses. As the rural economy needs
several requirements regarding to agricultural production fulfill by these societies known
as multi-purpose societies.
“A service co-operative is to be treated as an organization of the villagers for
mutual help and co-operation to meet their common economic requirements and to
increase agricultural production. The idea is to relate the short-term credit which the
society gives, to the production plan of the farmer and to the yield he is likely to get from
this loan”.1
Service co-operatives works with several objectives for increasing agricultural
production like- advances loans to agricultural producers, agricultural laborers, artisans or
workers; provides manures, fertilizers, improved seeds, implements, cattle folder, tools
and insecticides on cash and hire; arranges storage, marketing and processing of surplus
agricultural production; arranges raw material for cottage industries; provides gainful
employment to their members; gives technical guidance; supplies consumer goods on
common demand; as well as undertakes several programs of social and economic
welfare.
1. Mukerji B, “Community Development in India”, P.241, obtained by Bedi R.D., “Theory, History & Practice of Co-operation”,
Loyal Book Depot, Meerut, 1971, P.262.
139
Therefore, multi-purpose service co-operatives have taken up a large number of
functions as a bank, a store, a supply and marketing organization, a distribution agent,
and as an agricultural development agency generally. Virtually they are to cover all
economic activities of the community laying special emphasis on agricultural
development programs.1
4.6- CO-OPERATIVE CREDIT SOCIETIES AND CO-OPERATIVE BANKS-
Co-operative credit society‟s form the base on which the entire structure of the
co-operative credit organization is based. The co-operative credit structure in India
consists of two parts, one engaged in short and medium term credit and the other in long
tern credit. The former, in each state, is a three tier structure. The Primary Agricultural
Co-operative Credit Societies at the village level for the base. They federate into Central
Co-operative Banks at the district level, which in turn federate into apex bank at the State
level, which serving the entire State. The apex or State Co-operative Bank in each state is
closely linked with the Reserve Bank of India which provides consideration financial
assistance to co-operative credit structure.
The long tern credit structure is based for the moment on a two tier structure. At
the apex level in each state there is a Central Land Development Bank, while at the
bottom there are Primary Land Development Banks. The apex bank operates through the
primary units. The primary units serve an area of a taluka or district. In some states where
the primary units have not come to be developed, the central land development bank
operates either through its own branches or through central co-operative banks.
1. Memoria C.B., Saksena R.D., “Co-operation in India”, Kitab Mahal, Allahabad, 1973, P.214.
140
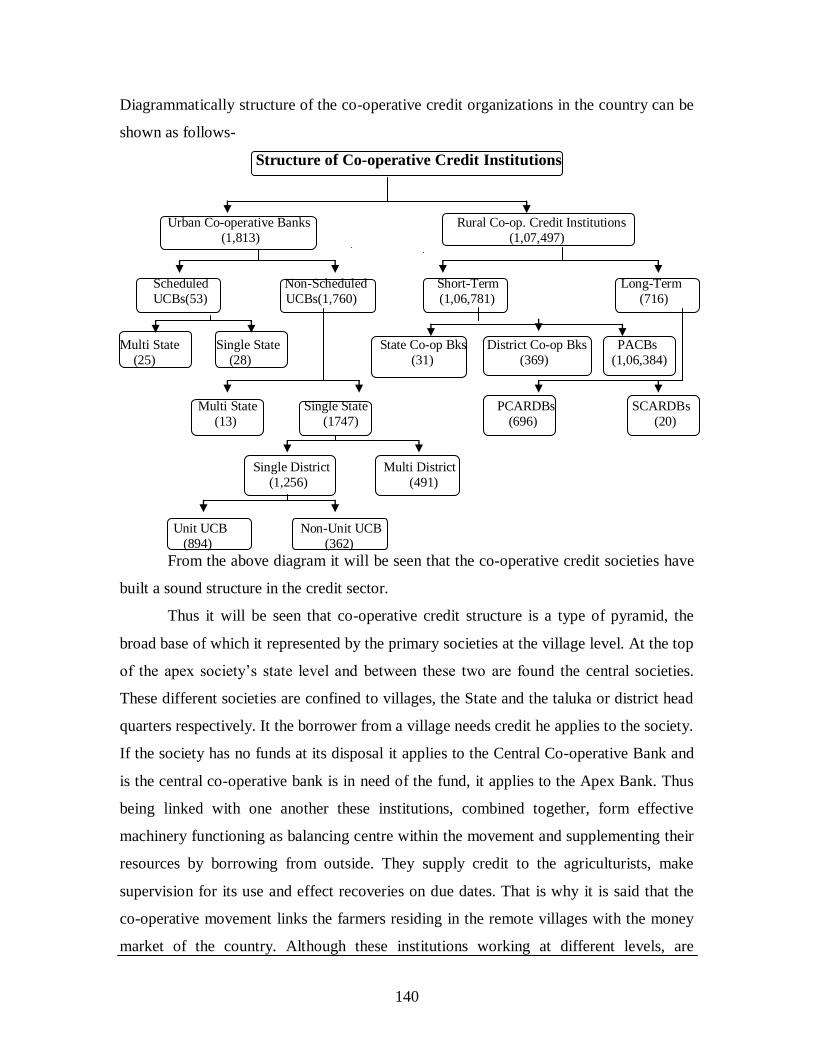
Diagrammatically structure of the co-operative credit organizations in the country can be
shown as follows-
Structure of Co-operative Credit Institutions
Urban Co-operative Banks Rural Co-op. Credit Institutions
(1,813) (1,07,497)
Scheduled Non-Scheduled Short-Term Long-Term
UCBs(53) UCBs(1,760) (1,06,781) (716)
Multi State Single State State Co-op Bks District Co-op Bks PACBs
(25) (28) (31) (369) (1,06,384)
Multi State Single State PCARDBs SCARDBs
(13) (1747) (696) (20)
Single District Multi District
(1,256) (491)
Unit UCB Non-Unit UCB
(894) (362)
From the above diagram it will be seen that the co-operative credit societies have
built a sound structure in the credit sector.
Thus it will be seen that co-operative credit structure is a type of pyramid, the
broad base of which it represented by the primary societies at the village level. At the top
of the apex society‟s state level and between these two are found the central societies.
These different societies are confined to villages, the State and the taluka or district head
quarters respectively. It the borrower from a village needs credit he applies to the society.
If the society has no funds at its disposal it applies to the Central Co-operative Bank and
is the central co-operative bank is in need of the fund, it applies to the Apex Bank. Thus
being linked with one another these institutions, combined together, form effective
machinery functioning as balancing centre within the movement and supplementing their
resources by borrowing from outside. They supply credit to the agriculturists, make
supervision for its use and effect recoveries on due dates. That is why it is said that the
co-operative movement links the farmers residing in the remote villages with the money
market of the country. Although these institutions working at different levels, are
141
connected with each other because of this federal structure, in respect of finance and their
legal position they enjoy a distinct entity. However, the strength of the chain depends
upon the strength of each of the linked units.1
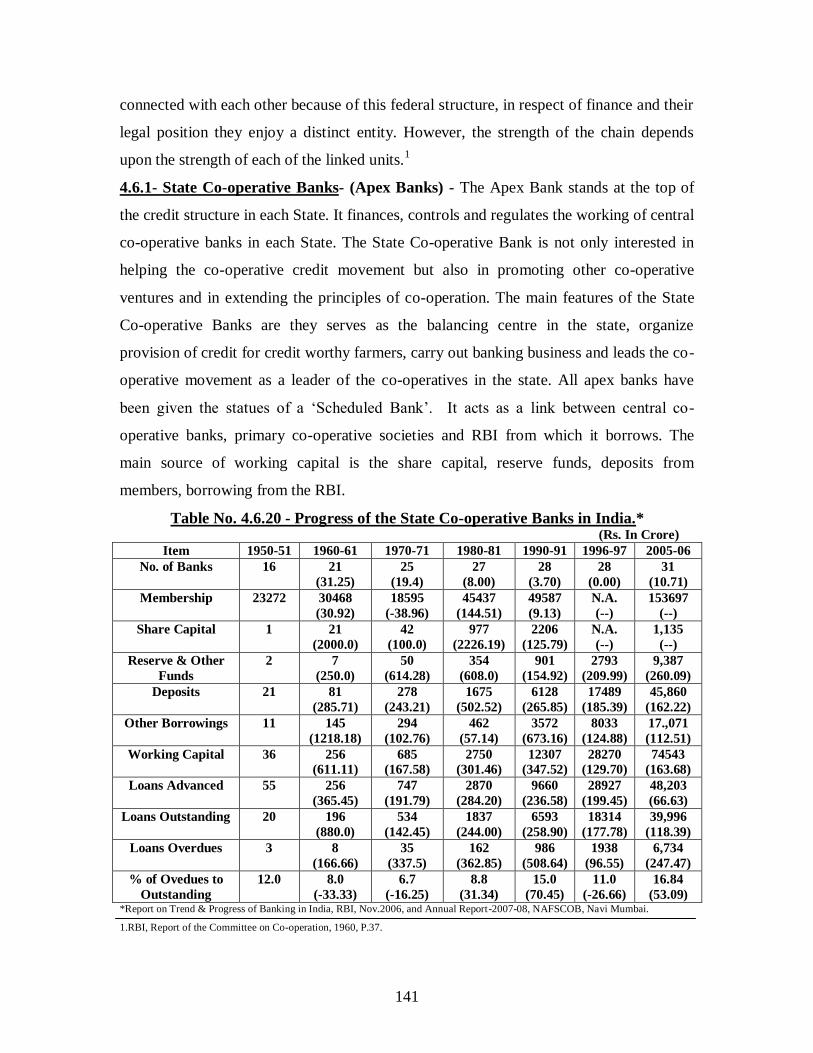
4.6.1- State Co-operative Banks- (Apex Banks) - The Apex Bank stands at the top of
the credit structure in each State. It finances, controls and regulates the working of central
co-operative banks in each State. The State Co-operative Bank is not only interested in
helping the co-operative credit movement but also in promoting other co-operative
ventures and in extending the principles of co-operation. The main features of the State
Co-operative Banks are they serves as the balancing centre in the state, organize
provision of credit for credit worthy farmers, carry out banking business and leads the co-
operative movement as a leader of the co-operatives in the state. All apex banks have
been given the statues of a „Scheduled Bank‟. It acts as a link between central co-
operative banks, primary co-operative societies and RBI from which it borrows. The
main source of working capital is the share capital, reserve funds, deposits from
members, borrowing from the RBI.
Table No. 4.6.20 - Progress of the State Co-operative Banks in India.* (Rs. In Crore)
Item 1950-51 1960-61 1970-71 1980-81 1990-91 1996-97 2005-06
No. of Banks 16 21
(31.25)
25
(19.4)
27
(8.00)
28
(3.70)
28
(0.00)
31
(10.71)
Membership 23272 30468
(30.92)
18595
(-38.96)
45437
(144.51)
49587
(9.13)
N.A.
(--)
153697
(--)
Share Capital 1 21
(2000.0)
42
(100.0)
977
(2226.19)
2206
(125.79)
N.A.
(--)
1,135
(--)
Reserve & Other
Funds
2 7
(250.0)
50
(614.28)
354
(608.0)
901
(154.92)
2793
(209.99)
9,387
(260.09)
Deposits 21 81
(285.71)
278
(243.21)
1675
(502.52)
6128
(265.85)
17489
(185.39)
45,860
(162.22)
Other Borrowings 11 145
(1218.18)
294
(102.76)
462
(57.14)
3572
(673.16)
8033
(124.88)
17.,071
(112.51)
Working Capital 36 256
(611.11)
685
(167.58)
2750
(301.46)
12307
(347.52)
28270
(129.70)
74543
(163.68)
Loans Advanced 55 256
(365.45)
747
(191.79)
2870
(284.20)
9660
(236.58)
28927
(199.45)
48,203
(66.63)
Loans Outstanding 20 196
(880.0)
534
(142.45)
1837
(244.00)
6593
(258.90)
18314
(177.78)
39,996
(118.39)
Loans Overdues 3 8
(166.66)
35
(337.5)
162
(362.85)
986
(508.64)
1938
(96.55)
6,734
(247.47)
% of Ovedues to
Outstanding
12.0 8.0
(-33.33)
6.7
(-16.25)
8.8
(31.34)
15.0
(70.45)
11.0
(-26.66)
16.84
(53.09) *Report on Trend & Progress of Banking in India, RBI, Nov.2006, and Annual Report-2007-08, NAFSCOB, Navi Mumbai.
1.RBI, Report of the Committee on Co-operation, 1960, P.37.

142
Table No.4.6.20 shows that State Co-operative Banks have made fairly good
progress. Number of Banks increased from 16 to 31 all through 1950-51 to 2005-06.
Membership increased from 23272 in 1950-51 to 153697 in 2005-06. Share capital
increased from Rs.1 crore to Rs.1,135 crore in 2005-06. Reserve & other funds increased
from Rs.2 crore to Rs.9,387 crore and working capital from Rs.36 crore to Rs.74543
crore, during the same period. Loans advanced by the bank was increased from Rs.55
crore to Rs.48,203 crore in 1950-51 to 2005-06. At the same time loans outstanding of
the bank also increased to a large extent Rs.20 crore to Rs.39,996 crore. Overdues of
loans increased from Rs.3 crore to Rs.6,734 crore during the same period, the percentage
of overdues to outstanding was 12.% in 1950-51 also shows increase up to 16.84% in
2005-06. Banks must keep percentage of overdues to loans outstanding at minimum level
to keep healthy performance. Therefore, growth rate showed that the progress achieved
during the period is fluctuated.
4.6.2- Central Co-operative Banks- Central Co-operative Banks are a link between
Apex bank and primary societies. These are federations of primary credit societies in a
specified area, normally spreads over a revenue district. The membership of these banks
is confined both to individuals and the societies. These individuals provide both finance
and management. Board of Directors looks after the management and supervision. The
central co-operative banks raise funds by way of share capital, deposits from public and
borrowing from the state co-operative bank. The banks advance short and medium term
loans to the primary societies.
The Co-operative Societies Act of 1912 was immediately followed by a rapid
increase in the number of central banks in the country. The chief task of central co-
operative bank has been to advance loans to the primary co-operative societies in time of
need so that they can fulfill the requirements of farmers. Central Co-operative banks
serves as balancing centre in the district as a central financing agency, carry out banking
business and organize and sanction credit to primary co-operative societies, monitor and
control implementation of policies. The success of the co-operative credit movement
largely depends on their financial strength.
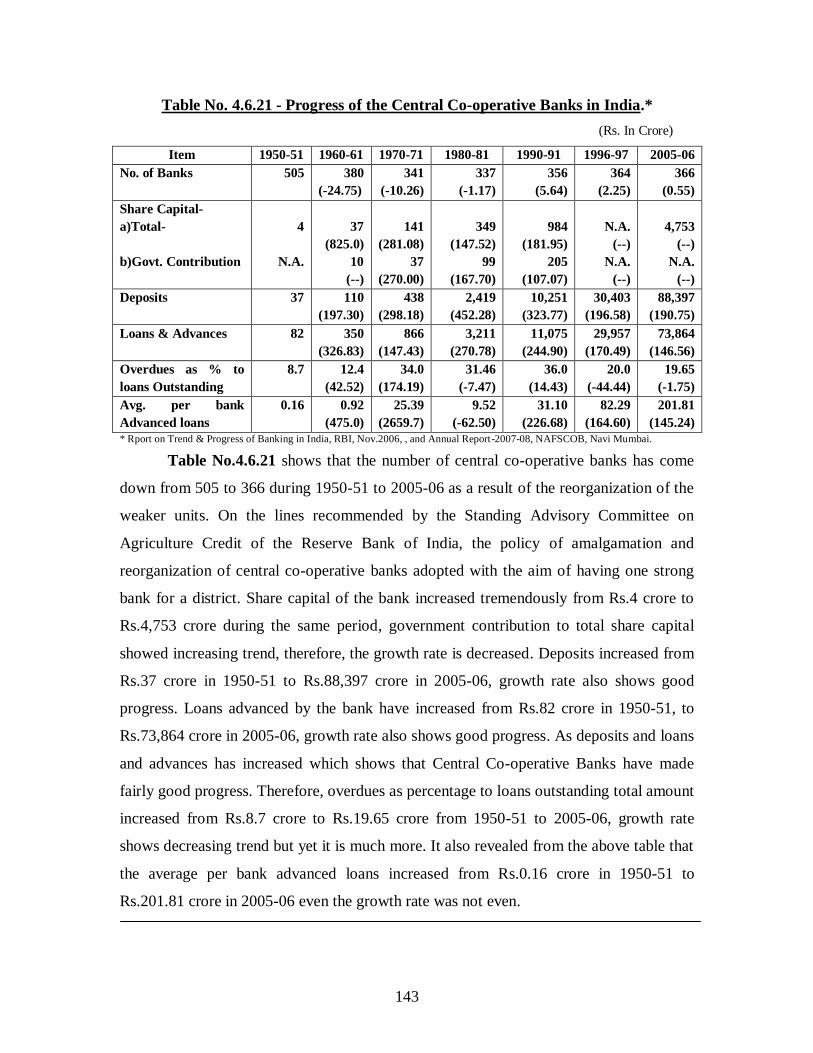
143
Table No. 4.6.21 - Progress of the Central Co-operative Banks in India.*
(Rs. In Crore)
Item 1950-51 1960-61 1970-71 1980-81 1990-91 1996-97 2005-06
No. of Banks 505 380
(-24.75)
341
(-10.26)
337
(-1.17)
356
(5.64)
364
(2.25)
366
(0.55)
Share Capital-
a)Total-
b)Govt. Contribution
4
N.A.
37
(825.0)
10
(--)
141
(281.08)
37
(270.00)
349
(147.52)
99
(167.70)
984
(181.95)
205
(107.07)
N.A.
(--)
N.A.
(--)
4,753
(--)
N.A.
(--)
Deposits 37 110
(197.30)
438
(298.18)
2,419
(452.28)
10,251
(323.77)
30,403
(196.58)
88,397
(190.75)
Loans & Advances 82 350
(326.83)
866
(147.43)
3,211
(270.78)
11,075
(244.90)
29,957
(170.49)
73,864
(146.56)
Overdues as % to
loans Outstanding
8.7 12.4
(42.52)
34.0
(174.19)
31.46
(-7.47)
36.0
(14.43)
20.0
(-44.44)
19.65
(-1.75)
Avg. per bank
Advanced loans
0.16 0.92
(475.0)
25.39
(2659.7)
9.52
(-62.50)
31.10
(226.68)
82.29
(164.60)
201.81
(145.24)
* Rport on Trend & Progress of Banking in India, RBI, Nov.2006, , and Annual Report-2007-08, NAFSCOB, Navi Mumbai.
Table No.4.6.21 shows that the number of central co-operative banks has come
down from 505 to 366 during 1950-51 to 2005-06 as a result of the reorganization of the
weaker units. On the lines recommended by the Standing Advisory Committee on
Agriculture Credit of the Reserve Bank of India, the policy of amalgamation and
reorganization of central co-operative banks adopted with the aim of having one strong
bank for a district. Share capital of the bank increased tremendously from Rs.4 crore to
Rs.4,753 crore during the same period, government contribution to total share capital
showed increasing trend, therefore, the growth rate is decreased. Deposits increased from
Rs.37 crore in 1950-51 to Rs.88,397 crore in 2005-06, growth rate also shows good
progress. Loans advanced by the bank have increased from Rs.82 crore in 1950-51, to
Rs.73,864 crore in 2005-06, growth rate also shows good progress. As deposits and loans
and advances has increased which shows that Central Co-operative Banks have made
fairly good progress. Therefore, overdues as percentage to loans outstanding total amount
increased from Rs.8.7 crore to Rs.19.65 crore from 1950-51 to 2005-06, growth rate
shows decreasing trend but yet it is much more. It also revealed from the above table that
the average per bank advanced loans increased from Rs.0.16 crore in 1950-51 to
Rs.201.81 crore in 2005-06 even the growth rate was not even.

144
4.6.3- Primary Co-operative Banks- The Non-Agricultural Credit Societies, comprising
Urban Co-operative Banks, Employees Credit Societies and other societies were started
in the country as early as 1912 and since then they made good progress. Even after the
First World-War, their progress did not slowed down. In the period of depression, the
urban credit movement was not much affected. It was so because the fall in urban
incomes was comparatively much less than the fall in the rural incomes. Moreover they
were commanding larger resources and better management. During the Second World-
War these organizations made further progress. Their membership and income increased
and they were able to secure good deposits. Thus they have surplus resources with them
which were invested in Govt. securities. During this period, these units in certain states
also worked as Government agencies for the distribution of controlled commodities. Such
co-operatives have made rapid progress since independence. “Urban Credit Societies and
Banks are the most important features of the co-operative movement in India, and they
make up to some extent the absence of joint stock banking facilities in smaller towns.
They occupy a prominent placke among the agencies satisfying credit needs of people
residing in urban areas. They advance loans mostly to small traders, artisans and salary
earned on personal security as well as against gold, silver and produce”.1
Urban co-operative banks have made rapid progress which would be clear from
the following table.
Table No. 4.6.22 - Progress of the Primary Co-operative Banks in India.*
(Amount in Rs. Crore)
Items 1980-
81
1985-
86
1990-
91
1997-
98
2003-
04
2004-
05
2005-
06
2006-
07
2007-
08
No. of
Banks
1,228 1,306
(6.35)
1,401
(7.27)
1,416
(1.07)
1,926
(36.01)
1,872
(-2.80)
1,853
(-1.01)
1,813
(-2.16)
1,770
(-2.37)
Owned
Funds
230 612
(166.08)
1,766
(188.56)
5,659
(220.44)
12,348
(118.20)
13,604
(10.17)
13,973
(2.71)
18,209
(30.31)
19,499
(7.08)
Deposits 1,331 3,939
(195.94)
11,108
(182.00)
38,472
(246.34)
1,10256
(186.58)
1,05021
(-4.75)
1,14,060
(8.60)
1,21,391
(6.42)
1,38,496
(4.09)
Borrowings 92 214
(132.60)
556
(159.81)
839
(50.90)
1,484
(76.87)
1,782
(20.08)
1,781
(-0.056)
2,657
(49.18)
2,292
(-13.73)
Loans
Outstanding
1,070 3,046
(184.67)
8,713
(186.04)
26,465
(203.74)
67,930
(156.67)
66,874
(-1.55)
71,641
(7.13)
79,733
(11.29)
88,981
(11.60)
* Report on Trend and Progress of Banking in India, RBI, various years. , and Annual Report-2007-08, NAFSCOB, Navi Mumbai.
1. RBI, Review of Co-operative Movement in India, 1939-40.
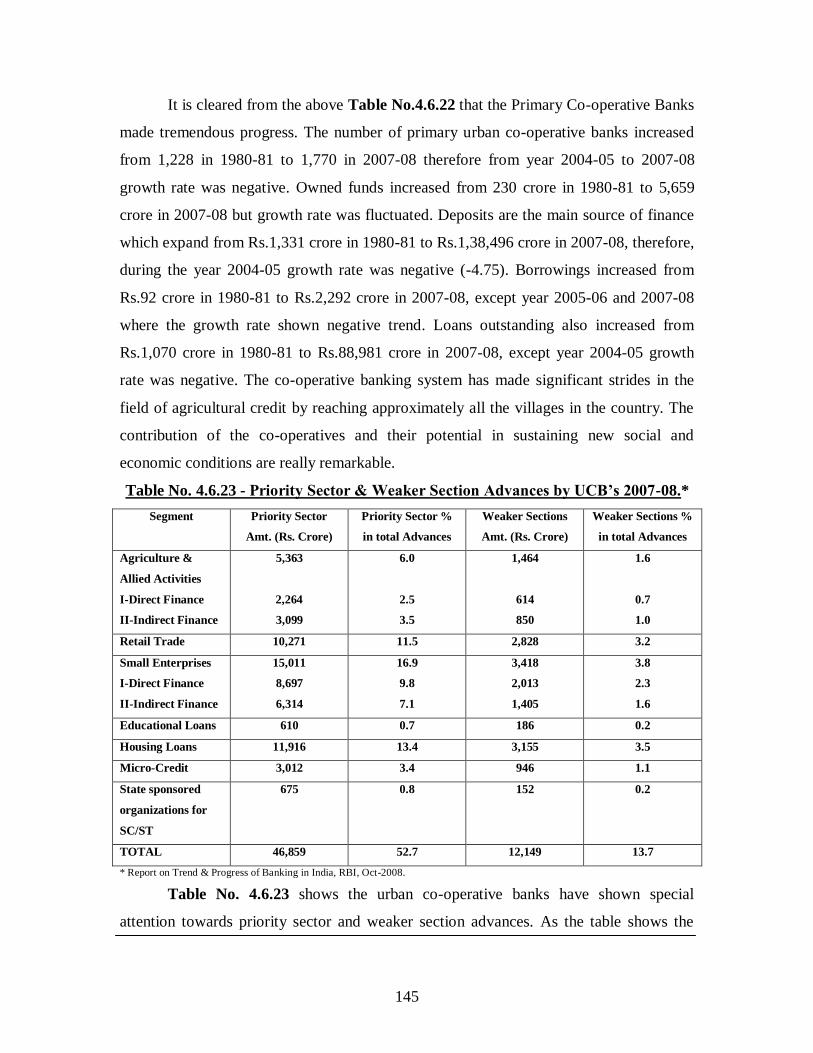
145
It is cleared from the above Table No.4.6.22 that the Primary Co-operative Banks
made tremendous progress. The number of primary urban co-operative banks increased
from 1,228 in 1980-81 to 1,770 in 2007-08 therefore from year 2004-05 to 2007-08
growth rate was negative. Owned funds increased from 230 crore in 1980-81 to 5,659
crore in 2007-08 but growth rate was fluctuated. Deposits are the main source of finance
which expand from Rs.1,331 crore in 1980-81 to Rs.1,38,496 crore in 2007-08, therefore,
during the year 2004-05 growth rate was negative (-4.75). Borrowings increased from
Rs.92 crore in 1980-81 to Rs.2,292 crore in 2007-08, except year 2005-06 and 2007-08
where the growth rate shown negative trend. Loans outstanding also increased from
Rs.1,070 crore in 1980-81 to Rs.88,981 crore in 2007-08, except year 2004-05 growth
rate was negative. The co-operative banking system has made significant strides in the
field of agricultural credit by reaching approximately all the villages in the country. The
contribution of the co-operatives and their potential in sustaining new social and
economic conditions are really remarkable.
Table No. 4.6.23 - Priority Sector & Weaker Section Advances by UCB’s 2007-08.*
Segment Priority Sector
Amt. (Rs. Crore)
Priority Sector %
in total Advances
Weaker Sections
Amt. (Rs. Crore)
Weaker Sections %
in total Advances
Agriculture &
Allied Activities
I-Direct Finance
II-Indirect Finance
5,363
2,264
3,099
6.0
2.5
3.5
1,464
614
850
1.6
0.7
1.0
Retail Trade 10,271 11.5 2,828 3.2
Small Enterprises
I-Direct Finance
II-Indirect Finance
15,011
8,697
6,314
16.9
9.8
7.1
3,418
2,013
1,405
3.8
2.3
1.6
Educational Loans 610 0.7 186 0.2
Housing Loans 11,916 13.4 3,155 3.5
Micro-Credit 3,012 3.4 946 1.1
State sponsored
organizations for
SC/ST
675 0.8 152 0.2
TOTAL 46,859 52.7 12,149 13.7
* Report on Trend & Progress of Banking in India, RBI, Oct-2008.
Table No. 4.6.23 shows the urban co-operative banks have shown special
attention towards priority sector and weaker section advances. As the table shows the

146
progress in year 2007-08 the total advances advanced to priority sector was Rs.46,859
crore (52.7%), and for weaker section Rs.12,149 crore (13.7%). Urban Co-op. Banks
contributed in up lift of the neglected sector of the economy and gave them equal chance
as social justice.
4.6.4- Primary Agricultural Credit Societies- These societies form the foundation on
which entire edifice of the co-operative credit structure is based. It is generally for one
village. The minimum initial membership is ten and ultimately the membership of the
credit society is expected to reach a full coverage of the village. The liability of members
is limited in absolute terms. The management lies in the hands of general body of
members, assisted by the President and the Secretary. They usually render honorary
services. Primary Agricultural Credit Societies provide short term and medium term
loans, loans granted to agricultural for the productive purposes only. These societies raise
funds through share capital, entrance fees, reserves, deposits, loans, income form
investment and loans etc. In short, the broad futures of the Primary Co-operative
Societies i.e. assessment of the credit needs, disbursement of credit to members, recovery
of credit and promote the economic interests of the members.
Table No.4.6.24 - Progress of Primary Agricultural Credit Co-operative Societies.*
(Rs. In Crore)
Items 1950-51 1960-61 1970-71 1980-81 1990-91 1996-97 2005-06
No. of Stys. (lack) 1.50 2.12
(41.33)
1.61
(-24.06)
0.95
(-40.99)
0.88
(-7.37)
0.92
(4.54)
1.06
(15.22)
Membership (lack) 44.08 170.41
(286.59)
309.63
(81.70)
576.33
(86.13)
848.70
(47.26)
982.20
(15.73)
1,252
(27.47)
Share Capital 7.61 57.75
(658.87)
205.74
(256.26)
571.09
(177.57)
1295.00
(126.76)
N.A.
(--)
N.A.
(--)
Deposits 4.26 14.59
(242.49)
69.46
(376.08)
290.58
(318.34)
1362.00
(368.71)
3450.20
(153.30)
19,561
(466.98)
Working Capital 37.25 273.92
(635.35)
1153.40
(322.34)
4035.98
(249.95)
11880.00
(194.42)
N.A.
(--)
73386.67
(--)
Loans Advanced 22.90 202.75
(785.37)
577.88
(185.02)
1763.59
(205.54)
4867.00
(176.06)
11805.00
(142.55)
42,920
(263.57)
*Report on Trend & Progress of Banking in India, RBI, Nov.2006, and Annual Report-2007-08, NAFSCOB, Navi Mumbai.
147
It may be observed from the above Table No.4.6.24 that there has been a
significant achievement in augmenting the business operations of PACS since the
commencement of the first five year plan (1950-51). In the rural sector, co-operatives are
more prominent. The number of societies had shown up and down during the plan period.
The co-operative rural credit system in India is world‟s largest and most wide-spread.
The number of societies which was 1.50 lack in 1950-51 had gone down to 1.06 lack in
2005-06. This was due to structural reorganization of the PACS by merger or liquidation
of weak societies consequent upon the recommendations of the All India Rural Credit
Survey Committee (1954) and the All India Rural Credit Review Committee (1969),
resulted into negative growth rate during the years 1970-71, 1980-81 and 1990-91. Near
about all the villages and more than 60 percent of the total rural households were covered
by the PACS. The membership of the PACS has increased substantially 44.08 lacks in
1950-51 to 1,252 lacks in 2005-06. Deposits increased from Rs.4.26 crore in 1950-51 to
Rs.19561 crore in 2005-06. Working capital of the PACS, which was only Rs.37.25 crore
in 1950-51 increased up to Rs.73386.67 crore in 2005-06. Therefore, growth rate showed
a fluctuating trend.
In 1950-51 it advanced loans worth Rs.22.90 crore, this rose to Rs.42,920 crore in
2005-06. The Primary Agricultural Credit Societies have stepped up their advances to the
weaker sections of the society particularly the small and marginal farmers. This progress
has been quite spectacular but not adequate considering the demand for finance from
farmers. However, the production credit provided by PACS has enabled the agriculturists
to use modern inputs in agriculture and thereby augmenting the total agricultural
production.

148
Table No. 4.6.25 - Progress of Primary Agricultural Credit Societies During the
Five-Year Plans in India.* (Rs. in Lack)
Year/Items No. of
PACS
Membership
(000’)
Issued
Loans
Loans
Recovered
Loans
Outstanding
Loans
Overdure
1950-51 1,15,748 53,69 71,48 58,85 75,90 9,78
1st Plan 1955-56 1,68,410
(45.49)
88,35
(64.55)
1,23,98
(73.44)
1,04,80
(78.08)
1,32,31
(74.32)
21,60
(120.85)
2nd
Plan 1960-61 2,22,004
(31.82)
1,89,59
(114.59)
3,42,32
(176.11)
2,85,70
(172.55)
3,61,80
(173.44)
54,60
(152.72)
3rd
Plan 1965-66 2,00,148
(-9.84)
2,83,14
(49.34
6,55,95
(91.62)
5,40,69
(89.25)
7,70,28
(112.90)
1,44,37
(164.41)
4th
Plan 1973-74 1,60,138
(-19.99)
3,96,82
(40.15)
16,33,49
(149.02)
15,75,16
(191.32)
20,45,53
(165.55)
4,95,25
(243.04)
5th
Plan 1977-78 1,22,064
(-23.77)
5,39,18
(35.87)
24,45,97
(49.74)
21,72,55
(37.92)
33,71,98
(64.84)
9,44,92
(90.79)
Annual Plan 1978-79 1,01,679
(-16.70)
5,86,71
(8.81)
29,00,63
(18.59)
25,10,48
(15.55)
38,76,82
(104.97)
11,05,54
(17.00)
Annual Plan 1979-80 1,00,486
(-1.17)
6,15,36
(4.88 )
34,05,74
(17.41)
28,90,96
(15.15)
45,14,09
(16.43)
13,21,18
(19.50)
6th
Plan 1984-85 90,937
(-9.50)
7,34,85
(19.41)
72,36,45
(112.48)
69,04,81
(138.84)
91,30,53
(102.26)
22,27,39
(68.59)
7th
Plan 1989-90 72,379
(-20.46)
7,58,69
(3.24 )
131,95,44
(82.34)
101,48,23
(46.97)
163,10,49
(78.63)
41,76,08
(87.48)
Annual Plan 1990-91 70,876
(-2.07)
6,62,07
(-12.93)
113,95,69
(-13.64)
103,93,67
(0.44)
163,90,45
(0.49)
35,53,75
(-14.90)
Annual Plan 1991-92 67,486
(-4.78)
7,33,44
(10.78)
134,04,04
(17.62)
109,96,59
(5.80)
198,00,94
(20.80)
46,00,19
(29.44)
8th
Plan 1996-97 93,932
(39.18)
10,61,44
(44.72)
427,31,90
(218.80)
340,35,56
(209.51)
433,54,95
(118.95)
81,61,83
(77.42)
9th
Plan 2001-02 95,748
(1.93)
11,31,55
(6.60)
10,597,254
(147.99)
9,969,468
(192.91)
9,946,238
(129.41)
1,872,681
(129.44)
First Year of 10th
Plan
2002-03
79,347
(-16.78)
10,34,49
(-8.57)
10,635,867
(0.36)
7,965,734
(-20.09)
12,083,927
(21.49)
2,348,655
(25.41)
*Statistical Statements Relating to the Co-operative Movement in India, Part-I, Credit Societies, NABARD, various years.
Table No. 4.6.25 shows the progress of the PACS during the five year plans. The
number of the PACS had shown fluctuations due to structural reorganization of the PACS
by merger or liquidation of weak societies. The number of PACS increased from
1,15,710 in 1950-51 to 79,347 in year 2002-03 of the Tenth five year plan. Growth rate
was negative during the most of the plan periods. Therefore, growth rate of membership
showed positive growth except year 1990-91 and 2002-03. Membership increased from
53,69 thousands in 1950-51 to 10,34,49 thousands in 2002-03. Loans issued by the PACS
also increased from Rs.71 lack in 1950-51 to Rs.10,635 lack in 2002-03, even growth rate
trend was uneven but positive except annual plan year 1990-91. The loans issued by the
PACS have been increasing but their recycle capacity which accelerates the flow of credit

149
to the borrowers depends upon their recovery performance, which adversely affected
their profitability and viability. Loans outstanding of the PACS in the first plan 1950-51
was Rs.75,90 lack increased up to Rs.12,083,927 lack, during the same period there was a
fluctuating trend in growth rate, which was 74.32 in 1955-56 stood on 21.49 in 2003-04.
The PACS borrowed funds from Government, Central Co-operative Banks, and other
sources to make possible it to lend to the ultimate borrowers. More than ninety percent of
the borrowings of the PACS were comes from the Central Financing Agencies. Loans
recovered increased from Rs.58,85 lack to Rs.7,965,734 lack during the 1050-51 to year
2003-04, therefore, growth rate shows that during the study period the growth rate was
not even it was fluctuating. Recovery of loans is quite necessary for sound business but e
it is revealed that the performance of recovery is not satisfactory. Overdue of the PACS
has increased adversely as it was Rs.9,78 lack in 1950-51 to Rs.2,348 lack in 2002-03,
growth rate showed fluctuating trend therefore except year 1990-91 growth was positive.
Report of CRAFICARD (1981) clearly stated that- the main reasons for overdues
are- failure to tie up lending with development programs, defective loaning policies
(including untimely timely loan disbursement), absence of efforts for marketing
arrangements and linkage of credit money with sale of produce, ineffective supervision,
misapplication of loans, apathy and indifference of management of societies to take
coercive measures for recovery, and foremost of all, want of a sense of discipline and
responsibility among the loaners in regard to prompt repayment of debts.1
4.6.5- Primary and Central Land Development Banks- According to All India Rural
Credit Survey Committee Report that “All farmers, especially small proprietors need
finance and borrow it at one time or another for their various needs. The strong Central
and Primary Land Mortgage Banks are one of the foremost needs of the country‟s
agricultural development today.” On the recommendation of Rural Credit Survey
Committee, 1954, greater emphasis began to be given on reorienting their loaning
policies encouraging loans for productive purposes. Hence, the original name “Land
Mortgage Bank” was changed to “Land Development Banks” later.
1. RBI, Report of the Committee to Review the Arrangement of Institutional Credit for Agriculture and Rural Development
(CRAFICARD), 1981, p.55-57.

150
The following tables A and B shows the position of these banks-
Table No. 4.6.26- A)
Progress of the State/Central Land/Agricultural Rural Development Banks in India.
(Rs. In Crore)
Items 1950-51 1960-61 1980-81 1990-91 1993-94 2005-06
No. of Banks 5 18
(260.00)
19
(5.55)
19
(0.00)
20
(5.26)
20
(0.00)
Owned Funds 6.5 54.4
(736.92)
265
(387.13)
635
(139.32)
857
(34.96)
2242
(161.61)
Deposits & Other
Borrowings
3.2 56.3
(1659.37)
2433
(4221.49)
3975
(63.37)
4891
(23.04)
17,029
(248.17)
Loans Outstanding 59.8 366.1
(512.20)
1697
(363.53)
4174
(145.96)
5405
(29.49)
17,678
(227.06)
Working Capital 77.2 476.0
(518.18)
2544
(434.45)
5223
(105.30)
7888
(51.02)
20,003
(153.58)
Loans Issued N.A. N.A.
(--)
365
(--)
867
(137.53)
1352
(55.94)
2,907
(115.01)
Overdues 1 12.2
(1110.00)
289
(2268.85)
910
(214.87)
1014
(11.42)
5,778
(469.82)
Source- Report on Trend & Progress of Banking in India, RBI, Various years, Annual Report-2007-08, NAFSCOB, Navi Mumbai.
Table No. 4.6.27- B)
Progress of the Primary Land/Agricultural & Rural Development Banks in India.*
(Rs. In Crore)
Items 1950-51 1960-61 1980-81 1990-91 1993-94 2005-06
No. of Banks 286 463
(61.88)
673
(45.35)
726
(7.87)
727
(0.13)
696
(-4.26)
Membership-(000’) 215 669
(211.16)
1048
(56.65)
6503
(520.51)
7221
(11.04)
N.A.
(--)
Owned Funds 6.9 24.6
(256.52)
127.3
(417.47)
308
(141.45)
349
(13.31)
N.A.
(--)
Deposits & Other
Borrowings
58.8 245.3
(317.17)
1242.0
(406.94)
2382
(91.78)
N.A.
(--)
13,117
(--)
Working Capital 66.6 269.9
(307.57)
1369.3
(408.92)
2958
(116.07)
3379
(14.23)
N.A.
(--)
Loans Outstanding 62.6 246.6
(296.77)
1243.3
(405.28)
1463
(17.70)
1527
(4.37)
12,179
(697.57)
Loans Issued N.A. N.A.
(--)
N.A.
(--)
435
(--)
664
(52.64)
1,970
(196.68)
Overdues 8 64
(700.00)
442
(590.62)
382
(-13.57)
397
(3.92)
4586
(1055.16)
*Report on Trend & Progress of Banking in India, RBI, Various years, Annual Report-2007-08, NAFSCOB, Navi Mumbai.
Land development banks are co-operative institutions which provide long term
loans to cultivators for agricultural and productive purposes. The structure of Banks may
be of federal type. This is a two-tier structure with Central Land/Agricultural & Rural

151
Development Banks at the State level and Primary Land/Agricultural & Rural
Development Banks at District or Taluka level. The management vests in a Board of
Directors consisting of 7 to 9 members. These banks raise finances from share capital,
loans, deposits, fees, grants and subsidies and borrowings. Central Land/Agricultural &
Rural Development Banks also raise capital through issue of debentures, which are
subscribed by the Commercial Banks, State Bank of India, LIC and the State and Central
Governments.
The number of Primary Land/Agricultural & Rural Development Banks and their
branches increased from 286 in 1950-51 to 696 in 2005-06, therefore, the growth rate was
fluctuating, in year 1960-61 growth rate was 61.88 stood on -4.26 in years 2005-06.
Central Land / Agricultural & Rural Development Banks increased from 5 to 20 during
the period 1950-51 to 2005-06, growth rate was not even it was 260.0 in 1960-61 stood
on 5.26 in 1993-94 as the number was same in year 2005-06. The member of the
SCARDBs at the ultimate borrowers‟ level consist of individual members at Apex level
(in case of Banks which are unitary in structure) and at Primary level (in case of banks
which are federal or mixed in structure) institutional members (including State
Governments and excluding Primary Banks) at Apex and Primary Banks‟ level. As on
31st March 2006, the total number of members was 3087 crore as compared to 3082 crore
on 31st March 2005. The deposit mobilization as per the guidelines approved by
RBI/NABARD is being implemented by Banks. These banks mobilized deposits
amounting to Rs.13,117 crore during the financial year 2005-06 as against Rs.7,304 crore
during the previous year i.e. 2004-05. The aggregate loans outstanding of SCARDBs at
the Apex Bank level as on 31st March 2006 was Rs.20353.31 crore as against
Rs.19855.20 crore as on 31st March 2005 which was increased in percentage terms 2.51
per cent. A sector wise analysis of the aggregate advances during the financial year 2005-
06 showed that the Farm Sector advances accounted for Rs.2154.69 crore forming 69.43
per cent and Non-Farm Sector advances accounted for Rs.336.58 crore forming 10.85 per
cent.

152
Table No. 4.6.28 - Agency-wise Ground Level Credit Flow.*
(Rs. in Crore)
Agency 2003-04 2004-05 2005-06 2006-07 2007-08
Co-operative Banks 26,825 (30.8)
31,231 (24.9)
[16.42]
39,404 (21.8)
[26.17]
42,480 (18.5)
[7.80]
43,684 (19.4)
[2.03]
RRB’s 7,581 (8.7)
12,404 (9.8)
[63.61]
15,223 (8.43)
[22.72]
20,435 (8.90)
[34.23]
24,814 (11.0)
[21.42]
Commercial Banks 52,441 (60.2)
81,481 (65.0)
[55.37]
1,25,477(69.5)
[53.99]
1,66,485(72.6)
[32.68]
1,56,850(69.6)
[-5.78]
Other Agencies 84 (0.9)
193 (0.15)
[129.76]
382 (0.21)
[97.92]
N.A.
[--]
N.A.
[--]
Total 86,981 (100)
1,25,309(100)
[44.06]
1,80,486 (100)
[44.03]
2,29,400 (100)
[27.10]
2,25,348 (100)
[-1.76]
Note- figures in ( ) shows the percentage to total and figures in [ ] shows the growth rate.
*NABARD, Annual Report, 2007-08, P.26.
Table No. 4.6.28 shows the agency wise credit flow. As against the target of
Rs.2,25,000 crore of credit flow to agriculture for 2007-08, disbursements by all agencies
stood at Rs.2,25,348 crore achieving more than the target. Commercial banks, co-
operative banks and RRBs disbursed Rs.1,56,850 crore, Rs.43,684crore and Rs.24,814
crore, achieving 106, 84 and 108 percent of the targets, respectively, against the target of
Rs.1,50,000 crore, Rs.52,000 crore and Rs.23,000 crore, respectively. The agency-wise
share of credit flow to agriculture shows that the Commercial Banks accounted for the
major share 69.6%, followed by Co-operative Banks 28% and Regional Rural Banks
11%. However, declining trend in the share of co-operative banks in the flow of
institutional credit over the years, which is indicative of the need for restructuring and
reforming. Government realized the need to enhance credit flow to agriculture, with the
consultation with RBI, NABARD and Commercial Banks announced a credit package on
18th June 2004, which envisaged doubling of agriculture credit over three years. RBI also
set up an Advisory Committee on the flow of credit to agriculture and related activities
under the Chairmanship of Vyas V.S., which submitted its report to the Government on
30th June 2004. Several recommendations accepted include waiving of margin or security
requirements up to Rs.50,000/- for crop loans and up to Rs.5 lack for loans to agri-
business and agro-clinics, dispensing with the restrictive provisions of Service Area

153
Approach, and aligning NPA norms for direct agricultural advances to the cropping
seasons of short & long duration crops.1
There were 82.68 lack new farmers were brought under the institutional credit
fold. In 1998, 38.64 lacks fresh Kisan Credit Cards (KCCs) were issued and co-operative
banks and Regional Rural Banks (RRBs) accounted for 20.91 lack and 17.73 lack of the
cards issued, respectively. Of the total 714.68 lack cards issued as on 31st March 2008,
co-operative banks accounted for 49% of the share, followed by commercial banks 37%
and Regional Rural Banks (RRBs) 14%.2
Table No. 4.6.29 - Non-Performing Assets of Co-operative Banks.*
(In Percentage)
Rural Co-operative Banks
Year SCBs DCCBs PACS SCARDBs PCARDBs UCBs
1994-95 - - 33.9
(--)
- - 13.9
(--)
1996-97 - - 34.9
(2.95)
- - 13.2
(-5.03)
1999-00 10.7
(--)
17.2
(--)
35.4
(1.43)
18.7
(--)
20.0
(--)
12.1
(-8.33)
2000-01 13.0
(21.49)
17.9
(4.07)
34.9
(-1.41)
20.5
(9.62)
24.3
(21.50)
16.1
(33.05)
2001-02 13.4
(3.07)
19.9
(11.17)
32.5
(-6.87)
18.5
(-11.48)
30.2
(24.28)
21.9
(36.02)
2002-03 18.2
(35.82)
21.2
(6.53)
37.9
(16.61)
20.9
(12.97)
33.8
(11.92)
19.0
(-13.24)
2003-04 18.7
(2.74)
24.0
(13.20)
36.8
(-2.90)
26.7
(27.75)
35.8
(12.22)
22.7
(19.47)
2004-05 16.3
(-12.83)
19.9
(-17.08)
33.6
(-8.61)
31.3
(17.23)
31.9
(-10.89)
23.2
(2.20)
2005-06 16.8
(3.06)
19.7
(-1.00)
30.4
(-9.52)
32.7
(4.47)
35.6
(11.60)
18.9
(-18.53)
2006-07 14.2
(-15.47)
18.4
(-6.59)
N.A.
(--)
30.3
(-7.34)
35.5
(-2.28)
17.0
(-10.05) *Report on Trend & Progress of Banking in India, RBI, October 2008.
Table No. 4.6.29 highlighted the financial performance of the various segments
of the credit co-operatives structure about non-performing assets (NPA). It is cleared that
the various financial institutions are suffered from heavy non-performance assets, which
point out to improvement in the financial operations for sound health of the co-operative
banks. Non-performing assets of State Co-operative Banks (SCBs), District Central Co-
operative Banks (DCCBs), State Central Agricultural and Rural Development Banks
1. Government of India, Economic Survey 2004-05. website:http:/indiabudget.nic.in.
2. NABARD, Annual Report, 2007-08, P.02

154
(SCARDBs), Primary Co-operative Agricultural and Rural Development Banks
(PCARDBs) and Urban Co-operative Banks (UCBs) stood at 14.2%, 18.4%, 30.3%,
35.5% and 17.0% as on 2006-07, respectively. As the NPA of PACS‟ stood at 30.4% in
the year 2005-06 table shows the urgency and magnitude of the problem of Non-
Performing Assets (NPAs) affecting Indian co-operatives banks. Therefore management
of Non-Performing Assets (NPAs) becomes of most immediate importance for co-
operatives. As the efficiency of finance depends largely on timely recovery of loans,
delay in recovery affects liquidity, increase operating cost and finally affects profitability.
The prudential norms of income recognition, assets classification and
provisioning were made applicable to co-operative banks with effect from 1996-97 in the
same form as applicable to commercial banks and regional rural banks (RBI circular No.
RPCD. BC. 155/07.37.02/95-96 dated 22 June 1996). However, many of the co-operative
banks had initial problems in adjusting to new system and therefore norms stabilize in the
year 1997-98. Thus, the provision norms were allowed in a phased manner with
considerable relaxation in the first two years viz. 1996-97 and 1997-98.
The rural co-operative credit institutions, however, are beset with many problems
which include, i) low resource base, ii) high dependence on refinancing agencies, iii) low
recovery levels, iv) huge accumulated losses, v) repeated Non-Performing Asset (NPA),
vi) lack of diversification and vii) various types of organizational weaknesses.
4.7- HOUSING CO-OPERATIVES- A co-operative housing society is an organization
of persons with limited economic needs, who have a common interest of building a house
according to approved standards and on a society base. Housing co-operatives make
available the residential houses to their members, member share the responsibility and
risk of ownership, through them collective purchases of land and building material take
place. This makes substantial saving in cost through group action.
There are three types of housing societies formed in India- All the way co-
operatives- where entire work is done by the society and duly constructed houses are
given to members on a tenancy basis; Co-venture co-operatives- where houses are built
by the society and allotted to members on a hire-purchase system; and Flat ownership co-
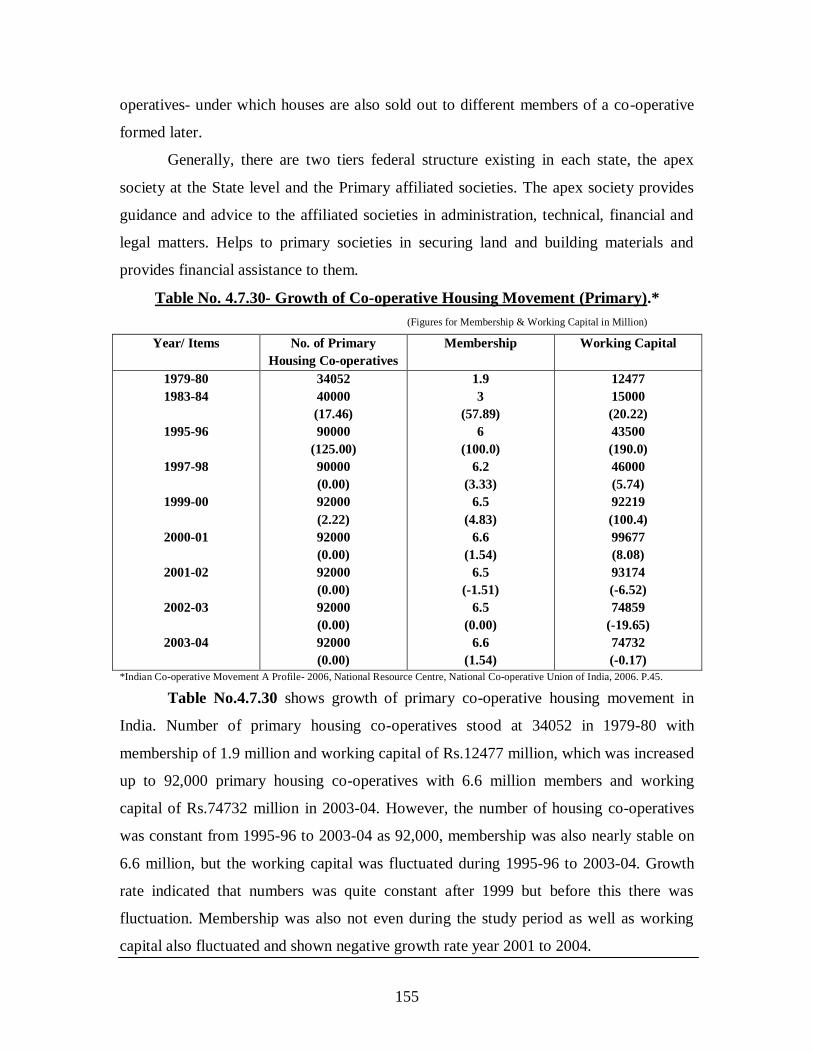
155
operatives- under which houses are also sold out to different members of a co-operative
formed later.
Generally, there are two tiers federal structure existing in each state, the apex
society at the State level and the Primary affiliated societies. The apex society provides
guidance and advice to the affiliated societies in administration, technical, financial and
legal matters. Helps to primary societies in securing land and building materials and
provides financial assistance to them.
Table No. 4.7.30- Growth of Co-operative Housing Movement (Primary).*
(Figures for Membership & Working Capital in Million)
Year/ Items No. of Primary
Housing Co-operatives
Membership Working Capital
1979-80
1983-84
1995-96
1997-98
1999-00
2000-01
2001-02
2002-03
2003-04
34052
40000
(17.46)
90000
(125.00)
90000
(0.00)
92000
(2.22)
92000
(0.00)
92000
(0.00)
92000
(0.00)
92000
(0.00)
1.9
3
(57.89)
6
(100.0)
6.2
(3.33)
6.5
(4.83)
6.6
(1.54)
6.5
(-1.51)
6.5
(0.00)
6.6
(1.54)
12477
15000
(20.22)
43500
(190.0)
46000
(5.74)
92219
(100.4)
99677
(8.08)
93174
(-6.52)
74859
(-19.65)
74732
(-0.17)
*Indian Co-operative Movement A Profile- 2006, National Resource Centre, National Co-operative Union of India, 2006. P.45.
Table No.4.7.30 shows growth of primary co-operative housing movement in
India. Number of primary housing co-operatives stood at 34052 in 1979-80 with
membership of 1.9 million and working capital of Rs.12477 million, which was increased
up to 92,000 primary housing co-operatives with 6.6 million members and working
capital of Rs.74732 million in 2003-04. However, the number of housing co-operatives
was constant from 1995-96 to 2003-04 as 92,000, membership was also nearly stable on
6.6 million, but the working capital was fluctuated during 1995-96 to 2003-04. Growth
rate indicated that numbers was quite constant after 1999 but before this there was
fluctuation. Membership was also not even during the study period as well as working
capital also fluctuated and shown negative growth rate year 2001 to 2004.

156
Table No. 4.7.31- Growth of Co-operative Housing Movement (State Level).*
(Figures for Membership & Working Capital in Million)
Items/ Year 2004-05 2005-06 (Growth Rate)
No. of Apex Federations
Membership-
a) Rural-
b) Urban
Share Capital-
of which raised from Primaries
Govt. Participation
Total Borrowings
Loans Distributed
No. of Houses Completed-
a) Rural
b) Urban
Houses Under Construction-
a) Rural
b) Urban
25
30,579
5,880
22,010
4120.2
77.2%
22.8%
87676.6
91,824.0
2,131,473
921,751
568,977
171,325
80,843
58,255
26 (4.00)
30,498 (-0.26)
5,833 (-0.80)
21,964 (-0.21)
4167.49 (1.14)
77.5% (0.39%)
22.5% (-1.31%)
92430.1 (5.42)
97,023.9 (5.66)
2,168,971 (1.76)
932,022 (1.11)
585,704 (2.94)
159,517 (-6.89)
78,061 (-2.45)
50,225 (-13.78)
*Indian Co-operative Movement A Profile- 2006, National Resource Centre, National Co-operative Union of India, 2006. P.45.
Table No.4.7.31 shows the growth of co-operative housing movement at State
level. Number of apex federations working at state level was 26 in 2005-06. Total
membership of these federations was 30,498. Share capital stands Rs.4167 million during
2005-06 of which rose from primary societies was 77.5% and government participation
was 22.5%. Total borrowings was Rs.92430 million, loans distributed Rs.97,023 million.
Number of houses completed was 2,168,971 out of them in rural areas 932,022 and in
urban areas 585,704 houses was completed in 2005-06. Even, 159,517 houses were under
construction in 2005-06. Growth rate shows that the trend of membership is declining;
government participation is also showed a declining trend during these years. Finances
are raised through issue of share capital, reserve funds, borrowings from the Government,
Central Co-operative Banks, the LIC and the Housing and Urban Development and
Finance Corporation. Financial assistance is also provided by the Government under
various specific housing schemes to co-operatives. Housing co-operatives have not made
even progress in all the states. Therefore, majority of the work of housing co-operatives
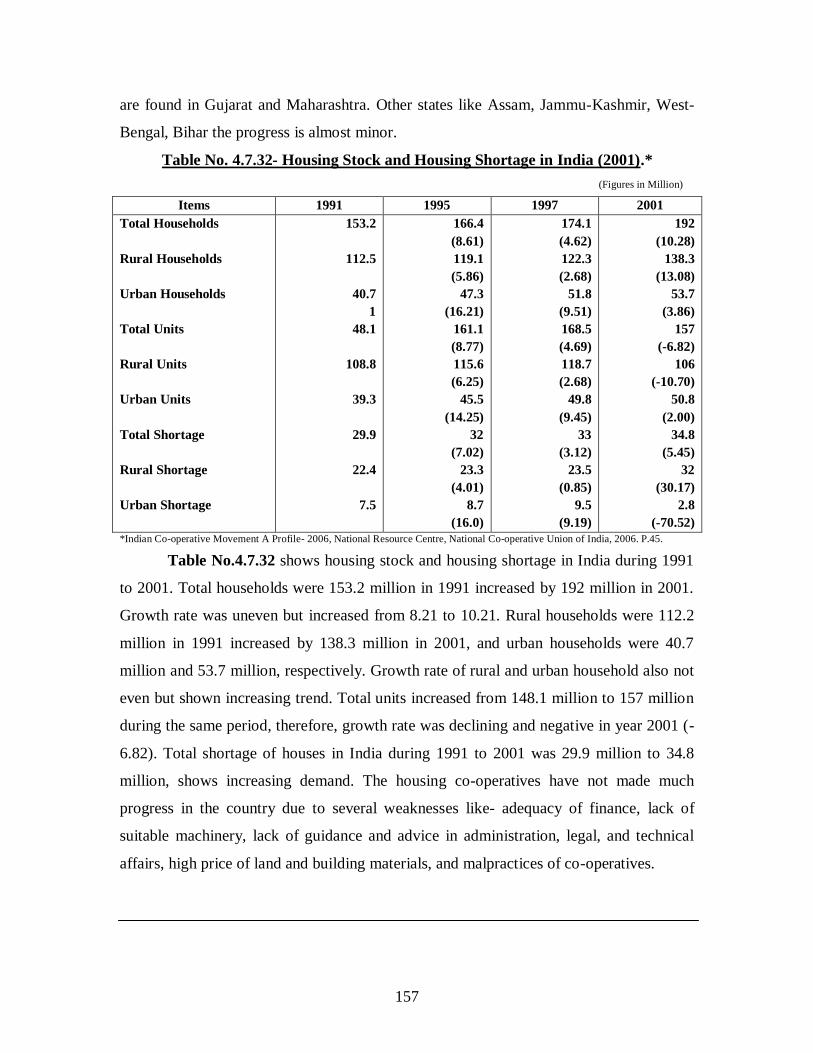
157
are found in Gujarat and Maharashtra. Other states like Assam, Jammu-Kashmir, West-
Bengal, Bihar the progress is almost minor.
Table No. 4.7.32- Housing Stock and Housing Shortage in India (2001).*
(Figures in Million)
Items 1991 1995 1997 2001
Total Households
Rural Households
Urban Households
Total Units
Rural Units
Urban Units
Total Shortage
Rural Shortage
Urban Shortage
153.2
112.5
40.7
1
48.1
108.8
39.3
29.9
22.4
7.5
166.4
(8.61)
119.1
(5.86)
47.3
(16.21)
161.1
(8.77)
115.6
(6.25)
45.5
(14.25)
32
(7.02)
23.3
(4.01)
8.7
(16.0)
174.1
(4.62)
122.3
(2.68)
51.8
(9.51)
168.5
(4.69)
118.7
(2.68)
49.8
(9.45)
33
(3.12)
23.5
(0.85)
9.5
(9.19)
192
(10.28)
138.3
(13.08)
53.7
(3.86)
157
(-6.82)
106
(-10.70)
50.8
(2.00)
34.8
(5.45)
32
(30.17)
2.8
(-70.52)
*Indian Co-operative Movement A Profile- 2006, National Resource Centre, National Co-operative Union of India, 2006. P.45.
Table No.4.7.32 shows housing stock and housing shortage in India during 1991
to 2001. Total households were 153.2 million in 1991 increased by 192 million in 2001.
Growth rate was uneven but increased from 8.21 to 10.21. Rural households were 112.2
million in 1991 increased by 138.3 million in 2001, and urban households were 40.7
million and 53.7 million, respectively. Growth rate of rural and urban household also not
even but shown increasing trend. Total units increased from 148.1 million to 157 million
during the same period, therefore, growth rate was declining and negative in year 2001 (-
6.82). Total shortage of houses in India during 1991 to 2001 was 29.9 million to 34.8
million, shows increasing demand. The housing co-operatives have not made much
progress in the country due to several weaknesses like- adequacy of finance, lack of
suitable machinery, lack of guidance and advice in administration, legal, and technical
affairs, high price of land and building materials, and malpractices of co-operatives.
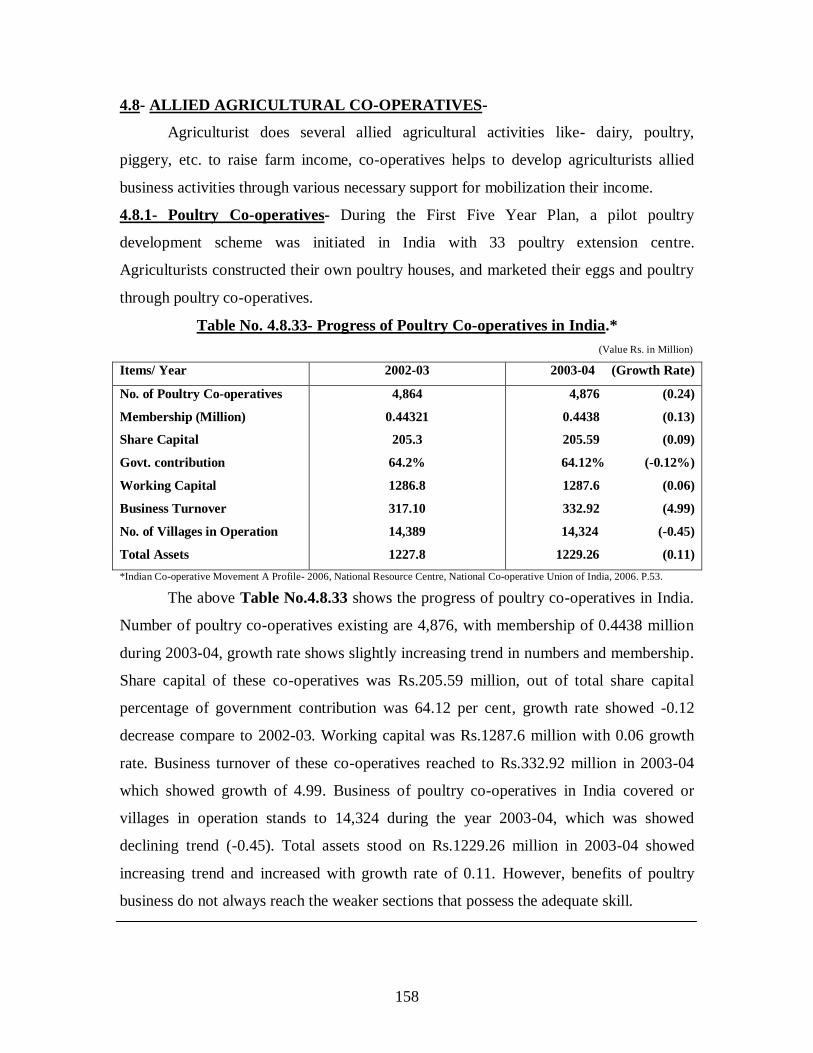
158
4.8- ALLIED AGRICULTURAL CO-OPERATIVES-
Agriculturist does several allied agricultural activities like- dairy, poultry,
piggery, etc. to raise farm income, co-operatives helps to develop agriculturists allied
business activities through various necessary support for mobilization their income.
4.8.1- Poultry Co-operatives- During the First Five Year Plan, a pilot poultry
development scheme was initiated in India with 33 poultry extension centre.
Agriculturists constructed their own poultry houses, and marketed their eggs and poultry
through poultry co-operatives.
Table No. 4.8.33- Progress of Poultry Co-operatives in India.*
(Value Rs. in Million)
Items/ Year 2002-03 2003-04 (Growth Rate)
No. of Poultry Co-operatives
Membership (Million)
Share Capital
Govt. contribution
Working Capital
Business Turnover
No. of Villages in Operation
Total Assets
4,864
0.44321
205.3
64.2%
1286.8
317.10
14,389
1227.8
4,876 (0.24)
0.4438 (0.13)
205.59 (0.09)
64.12% (-0.12%)
1287.6 (0.06)
332.92 (4.99)
14,324 (-0.45)
1229.26 (0.11)
*Indian Co-operative Movement A Profile- 2006, National Resource Centre, National Co-operative Union of India, 2006. P.53.
The above Table No.4.8.33 shows the progress of poultry co-operatives in India.
Number of poultry co-operatives existing are 4,876, with membership of 0.4438 million
during 2003-04, growth rate shows slightly increasing trend in numbers and membership.
Share capital of these co-operatives was Rs.205.59 million, out of total share capital
percentage of government contribution was 64.12 per cent, growth rate showed -0.12
decrease compare to 2002-03. Working capital was Rs.1287.6 million with 0.06 growth
rate. Business turnover of these co-operatives reached to Rs.332.92 million in 2003-04
which showed growth of 4.99. Business of poultry co-operatives in India covered or
villages in operation stands to 14,324 during the year 2003-04, which was showed
declining trend (-0.45). Total assets stood on Rs.1229.26 million in 2003-04 showed
increasing trend and increased with growth rate of 0.11. However, benefits of poultry
business do not always reach the weaker sections that possess the adequate skill.

159
4.8.2- Labor Co-operatives- Labor co-operative is a form of organization for the
employment of a group of workers who associated with one another for working together
for a joint reward. The reward is being shared by all of them as per the work done by
each one of them. These co-operatives workers for undertaking works, arranging funds,
providing technical knowledge and increasing bargaining powers of the members i.e. the
manual laborers and skilled. Labor co-operatives have organized in both urban and rural,
the rural societies helps a lot the landless agricultural labors by providing them
employment during those part of the year when agricultural employment is slack.1
Labor co-operatives not only provides employment but also purchase or hire
equipments for carrying out the work, arranges training facilities for workers, encourage
thrift, self-help and co-operation and saves them from exploitation by the contractors.
Table No.4.8.34-Progress of Labor Contract & Construction Co-operatives in India.
(Value Rs. in Million)
Items/ Year 2002-03 2003-04
No. of Labor Contract Societies
Of which Tribal Labor Societies
Non-Tribal Labor Societies
Membership (Million)
Share Capital
Govt. Participation
Working Capital
Business Turnover
Assets
Societies Making Profit
31,336
20.8%
79.2%
1.68
382.2
9.12%
3064.21
54934.8
2160.9
32.49%
30,030
(-4.16)
25.7%
(23.55%)
74.3%
(-6.18%)
1.691
(0.59)
384.06
(0.52)
9.06%
(-0.65%)
3016.99
(-1.54)
54934.82
(0.00)
2161.7
(0.03)
32.59%
(0.30%)
Source- Indian Co-operative Movement A Profile- 2006, National Resource Centre, National Co-op. Union of India, 2006. P.54.
Table No.4.8.34 shows the progress of labor contract and construction co-
operatives in India. Number of labor contract societies working in India stood at 30,030,
of which tribal labor societies were 25.7 per cent and non-tribal labor societies were
1. Momeria C.B., Saksena R.D., “Co-operation in India”, Kitab Mahal, Allahabad, 1973. P.370.

160
74.3% regarding to growth rate these societies declined by -4.16, tribal societies growth
rate was positive and non-tribal societies growth rate decreased by -6.18 from 2002-03 to
2003-04. Membership of these societies stood at 1.691 million in 2003-04 showed a
slightly growth 0.59. Normally, these co-operatives cover a group of villages so that
membership may be 50 to 200 persons, consisting skilled and unskilled workers in area
of operation. Share capital was Rs.384.06 million, of which government contribution was
9.06 per cent in 2003-04; growth rate showed 0.52 growths in share capital but
government contribution was declined up to -0.65. Working capital was Rs.3016.99
million, assets was Rs.2161.7 million, and profit of these societies was 32.59 per cent in
2003-04. Business turnover of these societies was Rs.54934.82 million during the same
year 2003-04 whereas the growth rate was very slow.
Table No.4.8.35-Progress of Forest Labor Co-operatives in India (State & Primary).
(Value Rs. in Million)
Items/ Year 2002-03 2003-04
No. of Forest Labor Co-operatives
Membership
Share Capital
Working Capital
Business Turnover
Assets
Value of Sales
Societies in Profit Making
3,408
0.73
43.26
2258.3
1027.8
1538.1
459.9
39%
4,714
(38.32)
0.74
(1.37)
43.06
(-0.46)
2272.3
(0.62)
1039.1
(1.10)
1633.6
(6.20)
580.77
(126.2)
40%
(2.56%)
Source- Indian Co-operative Movement A Profile- 2006, National Resource Centre, National Co-operative Union of India, 2006. P.54.
Table No.4.8.35 shows the progress of forest labor co-operatives (state and
primary) in India. Number of forest labor co-operative stood at 4,714, with membership
of 0.74 lacks during 2003-04, growth rate was 38.32 and 1.37, respectively. Share capital
of these societies was Rs.43.06 million, working capital was Rs.2272.3 million, and profit
earned by these societies during the 2003-04 was 40 per cent. Business turnover of these
societies was Rs.1039.1 million and value of sales was Rs.580.77 million during the same
year. Except the share capital growth rate was positive. Country level labor co-operatives

161
working in different states are not made progress on same line. Labor co-operative have
facing several difficulties i.e. lack of adequate capital, poverty of members, delay of
making payments for the work done, lack of assurance about the continuity of work and
failing to complete the work in time due to inadequate resource and financial deficiency.
4.8.3- Fisheries Co-operatives- Fisheries co-operatives are organizations of fishermen
who join collectively to achieve the advantage of co-operation in the field of catching
fish, their assembly, preservation, transport and distribution.
Broadly, fisheries co-operative societies have various forms in different States,
such as fisheries credit co-operatives, fish producer‟s co-operatives, fish consumer‟s co-
operatives, fish marketing federations and fish Apex co-operatives.1
Table No. 4.8.36- Progress of Fishery Co-operatives in India.*
(Value Rs. in Million)
Items/ Year 2002-03 2003-04
No. of Fishery Co-operatives
Membership (Million)
Share Capital
Govt. contribution
Total Assets
Fixed Assets (Mech. Boats & other)
Working Capital
Sales or Turnover
14,211
1.862302
569.76
39.70%
818.9
12.3%
2220.93
1712.8
14,339
(0.90)
1.872959
(0.57)
583.62
(2.40)
40.12%
(1.05%)
817.28
(-0.19)
13.76%
(11.87%)
2299.73
(3.54)
1799.6
(5.06)
*Indian Co-operative Movement A Profile- 2006, National Resource Centre, National Co-operative Union of India, 2006. P.51.
Table No.4.8.36 showed the progress of fishery co-operatives in India. Number
of fishery co-operatives stood at 14,211 in 2002-03 increased up to 14,339 in 2003-04,
growth rate was 0.90. Membership stood at 1.87 million in 2003-04. Share capital was
Rs.583.62 million, government contribution with 40.12% in 2003-04. Total assets was
Rs.817.28 million, percentage of fixed assets (machinery, boats and other) to total assets
was 13.76% in 2003-04. Working capital of fishery co-operatives was Rs.2299.73 million
1. Ghanekar V.V., “Co-operative Movement in India- 1904-2004”, Institute of Rural Development and Education, Pune, 2004. P.108.
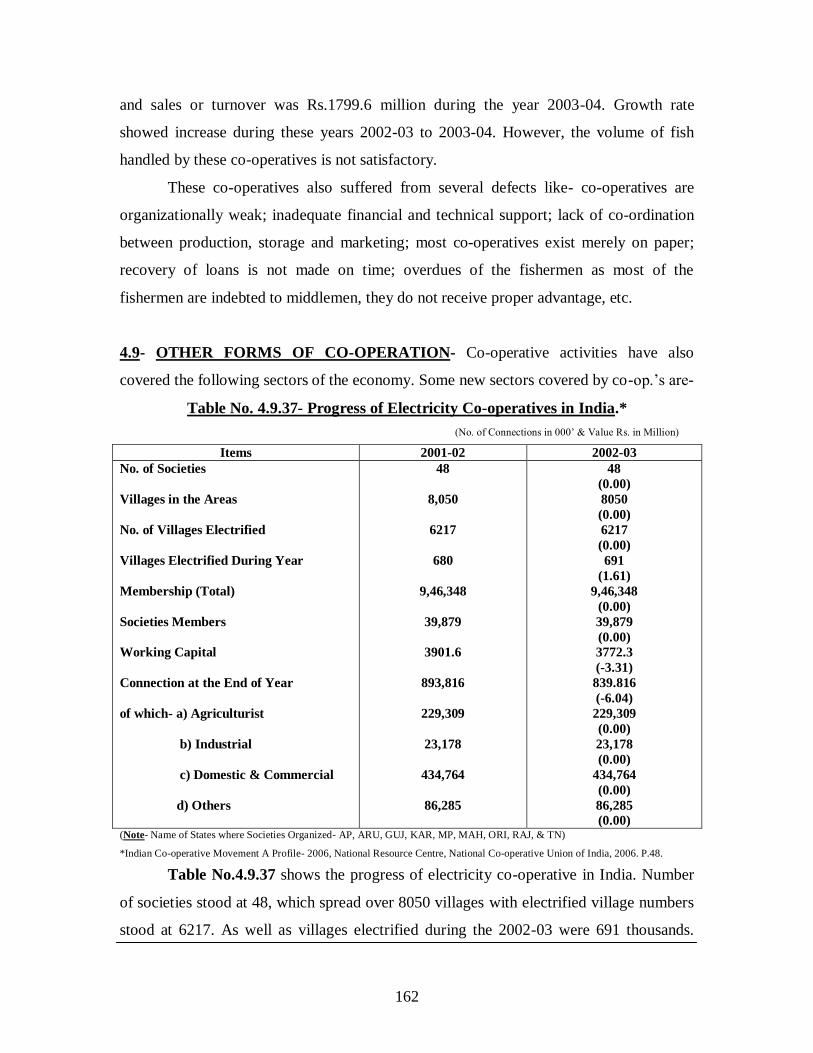
162
and sales or turnover was Rs.1799.6 million during the year 2003-04. Growth rate
showed increase during these years 2002-03 to 2003-04. However, the volume of fish
handled by these co-operatives is not satisfactory.
These co-operatives also suffered from several defects like- co-operatives are
organizationally weak; inadequate financial and technical support; lack of co-ordination
between production, storage and marketing; most co-operatives exist merely on paper;
recovery of loans is not made on time; overdues of the fishermen as most of the
fishermen are indebted to middlemen, they do not receive proper advantage, etc.
4.9- OTHER FORMS OF CO-OPERATION- Co-operative activities have also
covered the following sectors of the economy. Some new sectors covered by co-op.‟s are-
Table No. 4.9.37- Progress of Electricity Co-operatives in India.*
(No. of Connections in 000‟ & Value Rs. in Million)
Items 2001-02 2002-03
No. of Societies
Villages in the Areas
No. of Villages Electrified
Villages Electrified During Year
Membership (Total)
Societies Members
Working Capital
Connection at the End of Year
of which- a) Agriculturist
b) Industrial
c) Domestic & Commercial
d) Others
48
8,050
6217
680
9,46,348
39,879
3901.6
893,816
229,309
23,178
434,764
86,285
48
(0.00)
8050
(0.00)
6217
(0.00)
691
(1.61)
9,46,348
(0.00)
39,879
(0.00)
3772.3
(-3.31)
839.816
(-6.04)
229,309
(0.00)
23,178
(0.00)
434,764
(0.00)
86,285
(0.00) (Note- Name of States where Societies Organized- AP, ARU, GUJ, KAR, MP, MAH, ORI, RAJ, & TN)
*Indian Co-operative Movement A Profile- 2006, National Resource Centre, National Co-operative Union of India, 2006. P.48.
Table No.4.9.37 shows the progress of electricity co-operative in India. Number
of societies stood at 48, which spread over 8050 villages with electrified village numbers
stood at 6217. As well as villages electrified during the 2002-03 were 691 thousands.

163
Total membership of these societies was 9,46,348, of which societies member were
39,879 in 2002-03. Working capital of these societies was Rs.3772.3 million in 2002-03.
Connection at the end of year given by societies stood at 839.81 thousands, of which
connection provided to agriculturists was 229,309 thousand, industrial 23,178 thousands,
domestic and commercial was 434,764 thousands, and other was 86,285 thousands during
the year 2002-03. Therefore growth rate showed that there is not such a increase or
progress have made during 2001-02 to 2002-03 even working capital and connection
indicated a negative trend, -3.31 and -6.04, respectively.
Table No. 4.9.38- Progress of Member Education Program Activity-Wise.*
Year/
Items
Total
Personnel
Trained
General
Education
Program
Women
Education
Program
Youth
Education
Program
UDS** Handloom Handicraft Industrial
1994-95
1995-96
1996-97
1997-98
2000-01
2001-02
2004-05
2005-06
1509307
(--)
1535852
(1.75)
1142434
(-25.61)
1182532
(3.51)
1158162
(-2.06)
1407281
(21.50)
1470806
(4.51)
1592177
(8.25)
1123979
(--)
1136122
(1.08)
984537
(-13.34)
831327
(-15.72)
794449
(-4.43)
752838
(-5.23)
816413
(8.44)
829902
(1.65)
102868
(--)
138165
(34.31)
107578
(-22.13)
109217
(1.52)
103207
(-5.50)
119538
(15.82)
125838
(5.27)
176808
(40.50)
199589
(--)
163882
(-17.89)
163882
(0.00)
125595
(-23.36)
143629
(14.36)
130251
(-9.31)
144850
(11.20)
114235
(-21.13)
59131
(--)
72235
(22.16)
72235
(0.00)
91559
(26.75)
318152
(247.4)
392864
(23.48)
383715
(-2.32)
471232
(22.80)
10174
(--)
10055
(-1.17)
10055
(0.00)
106959
(6.36)
10466
(-2.14)
11790
(12.65)
N.A.
(--)
N.A.
(--)
4071
(--)
4544
(11.62)
3055
(-32.76)
4544
(48.74)
3730
(-17.91)
N.A.
(--)
N.A.
(--)
N.A.
(--)
9495
(--)
10251
(7.96)
10251
(0.00)
11084
(8.12)
9549
(-13.84)
N.A.
(--)
N.A.
(--)
N.A.
(--)
** UDS- Under Developed States/Areas.
*Indian Co-operative Movement A Profile- 2006, National Resource Centre, National Co-operative Union of India, 2006. P.49.
Table No.4.9.38 shows the progress of member education program activity-wise
in India. Total personnel trained through these education program activities increased
from 1509370 to 1592177 during the same period; therefore, the growth rate was
fluctuating. General education program trained 829902 personnel, women education
program trained 176808 personnel and youth education program trained 114235

164
personnel during the year 2005-06. Growth rate shows fluctuating trend over the period.
Education program activity have a great importance to enlighten the member with the
principles of co-operation and to motivate them for selfless work whereas it is observed
that this activity not paying such attention towards this. Under developed states or areas
program had taken place in 2005-06 at 471232 places to trained personnel.
4.9.1- Co-operation and Women in India- Co-operative societies for women were
organized with object to encourage the habit of thrift among them and to provide
subsidiary occupation of the nature of cottage industries such as- hosiery, knitting,
printing of cloth, production of ready-made garments, leather works, preparation of toys
and articles of food such as pickles, condiments, jams, etc. Mostly the member of these
societies belong to the lower middle class families in the towns, engage themselves in
these occupations during their spare time and the societies arrange to sell their products.1
Table No. 4.9.39- Growth of Women Co-operatives in India.*
(Membership in Thousand & Value Rs. in Million)
Year/ Item No. of Societies Membership Share Capital Working Capital Turnover
1994-95
1995-96
1997-98
1998-99
1999-00
2000-01
2001-02
2002-03
2003-04
7195
(--)
8171
(13.56)
8714
(6.64)
8006
(-8.12)
11354
(41.81)
11399
(0.39)
12150
(6.58)
12520
(3.04)
12421
(-0.79)
591.7
(--)
692.6
(17.05)
897.8
(29.62)
828.6
(-7.71)
1016.2
(22.64)
978.4
(-3.74)
996.2
(1.84)
1019.5
(2.31)
1257.3
(23.35)
150.5
(--)
179.3
(19.33)
204.2
(13.96)
157.9
(-22.67)
160.4
(1.58)
289.6
(80.62)
295.2
(2.07)
219.6
(-25.76)
220.6
(0.45)
1478.9
(--)
1408.1
(-4.78)
2041.4
(44.97)
1167.9
(-42.78)
719.9
(-38.36)
714.5
(-0.75)
838.1
(17.36)
1398.6
(66.83)
1272.0
(-9.01)
592.6
(--)
811.3
(36.99)
984.5
(21.33)
922.0
(-6.30)
1186.9
(28.73)
1177.1
(-0.82)
1414.1
(20.13)
1415.4
(0.07)
1410.8
(-0.35)
*Indian Co-operative Movement A Profile- 2006, National Resource Centre, National Co-operative Union of India, 2006. P.50.
Table No. 4.9.39 shows the growth of women co-operatives in India. Number of
women co-operative was 7195 in 1994-95 increased up to 12421 in 2003-04. Growth rate
of societies showed a declining trend 13.56 to -0.79. Membership of these societies
1. Momeria C.B., Saksena R.D., “Co-operation in India”, Kitab Mahal, Allahabad, 1973. P.376.
165
increased from 591.7 to 1257.3 during the same period, therefore, the growth rate was
uneven. Share capital increased from Rs.150.5 million to Rs.220.6 million, working
capital increased from Rs.1478.9 million to Rs.1272.0 million during 1994-95 to 2003-04
regarding to share capital and working capital growth rate was fluctuating during the
same period. Total turnover of women co-operatives was Rs.592.6 million in 1994-95
increased by Rs.1410.8 million in 2003-04, therefore, growth rate was not even and
negative in 1998-99, 2000-01 and 2003-04, -6.30, -0.82 and -0.35, respectively.
4.10- SUMMARY - The beginning of the Co-operative movement in India dates back to
about 1904 when official efforts were initiated to create a new type of institution based
on the principles of co-operative ideology. Co-operative institutions considered to be
solution for the problems particularly to the Indian conditions concerning to over-all rural
development. Co-operatives are the vast and powerful instrument which engaged in the
tasks of production, processing, marketing and distribution, servicing and banking in
Indian economy. Co-operation has shown its effectiveness in various fields like removal
of poverty by reducing member‟s indebtedness, lowering interest rates, increasing
productivity and thrift, lowering of the cost of necessary members, arranging disposal of
their produce and discouraging unnecessary social expenditure. It has done something to
raise the standard of living. It has increased country‟s banking facilities. It has given the
people hope. In all these directions and in others, co-operation has made more or less
progress, although it has so far admittedly affected only border of the situation.
In brief, it may be observed that- the co-operatives in different sectors function
more or less in isolation and do not lend sufficient support to one another. Except in the
sphere of credit, the principle of federalism has not been significant developed within the
respective sectors themselves. There has been inadequate linking of credit with supplies,
services, thrift and marketing, etc. the initiative still comes from the Government and not
from the people. The dynamism that is associated with the term „movement‟ is still
lacking to an appreciable degree. Primary Societies concern themselves only with credit.
The area of operation is either too small or enable the society to be viable, or too big to
ensure mutual knowledge and social cohesion. A rigid adherence to principles of
unlimited liability had kept some of the solvent farmers from such societies. There has

166
been a lack of co-ordination on the part of the central banks with the societies on the one
hand and apex bank on the other. The general lack of education and the inadequacy are
the important causes of the unsatisfactory record of co-operation in India.
In the context of economic reforms introduced since 1991, sound, healthy and
competitiveness have become very important for co-operatives. In the arouse of
economic reforms quality is more important than quantity so emphasis on excellent
quality management, technology up gradation, cost minimization measures which
increases profitability, professionalism, and base of financial resource have utter
importance. The co-operatives in the contest economic reform should make themselves
viable and sustainable to accept challenges and to overcome on it effectively.
Mutual Aided Co-operative Societies Act of 1995, by government of Andhra
Pradesh, marked a significant step towards reform to govern and regulate mutually aided
co-operatives, which promote democratic nature, self-reliant and member centric
atmosphere without any State involvement or financial support from State. Similar
legislation passed by other state too (viz. Bihar, Chhattisgarh, Jammu and Kashmir,
Jharkhand, Karnataka, Madhya Pradesh, Orissa and Uttaranchal). The number of co-
operatives registered under the new Act increasing slowly, and the conversion from old to
new Act mostly takes place in commodity co-operatives. However, most of the existing
co-operatives remain themselves attached with the old law.