CHAPTER MModeling a odeling a BBusinessusiness · 2-1 Interpret Scatterplots ... 2-3 Supply and...
52
If you do an Internet search for the word model, you will find it used in a variety of contexts. There are computer models, medical models, working models, scientific models, business models, data models, and more. In each of these cases, a model is a representation. It is a well-formulated plan that can be used to represent a situation. Often, the model is a simplified version of the actual scenario. In this chapter, you will learn how to use mathematics to model a new busi- ness venture. You will use variables and examine relationships among those variables as you explore the business concepts of expense, revenue, and profit. Statistics play an important role in the creation and use of a business model. You will represent real-world situations with equations, analyze the data that has been derived from those equations, use data to make predictions, and generate and interpret graphs in order to maximize profit. As you work through this chapter, you will realize the importance of Henry Luce’s words. The models you explore will examine the future success or failure of a product and will help you make decisions that will mold and shape its future. CHAPTER Business, more than any other occupation, is a continual dealing with the future; it is a continual calculation, an instinctive exercise in foresight. Henry R. Luce, Publisher and Philanthropist Modeling a Modeling a Business Business 2-1 Interpret Scatterplots 2-2 Linear Regression 2-3 Supply and Demand 2-4 Fixed and Variable Expenses 2-5 Graphs of Expense and Revenue Functions 2-6 Breakeven Analysis 2-7 The Profit Equation 2-8 Mathematically Modeling a Business 2 for the word in a variety of contexts There are com What do you think Henry Luce meant in this quote? What do you think? Answers should contain a reference to the fact that in business, it is important to look ahead, to predict, and to calculate and weigh all options when making decisions. TEACHING RESOURCES Instructor’s Resource CD ExamView ® CD, Ch. 2 eHomework, Ch. 2 www.cengage.com/ school/math/ financialalgebra 49657_02_ch02_p062-113.indd 62 49657_02_ch02_p062-113.indd 62 5/29/10 3:16:52 PM 5/29/10 3:16:52 PM
Transcript of CHAPTER MModeling a odeling a BBusinessusiness · 2-1 Interpret Scatterplots ... 2-3 Supply and...

If you do an Internet search for the word model, you will fi nd it used
in a variety of contexts. There are computer models, medical models, working models, scientifi c models, business models, data models, and more. In each of these cases, a model is a representation. It is a well-formulated plan that can be used to represent a situation. Often, the model is a simplifi ed version of the actual scenario. In this chapter, you will learn how to use mathematics to model a new busi-ness venture. You will use variables and examine relationships among those variables as you explore the business concepts of expense, revenue, and profi t. Statistics play an important role in the creation and use of a business model. You will represent real-world situations with equations, analyze the data that has been derived from those equations, use data to make predictions, and generate and interpret graphs in order to maximize profi t. As you work through this chapter, you will realize the importance of Henry Luce’s words. The models you explore will examine the future success or failure of a product and will help you make decisions that will mold and shape its future.
CHAPTER
Business, more than any other occupation, is a continual dealing with the future; it is a continual calculation, an instinctive exercise in foresight.
Henry R. Luce, Publisher and
Philanthropist
Modeling a Modeling a BusinessBusiness
2-1 Interpret Scatterplots
2-2 Linear Regression
2-3 Supply and Demand
2-4 Fixed and Variable Expenses
2-5 Graphs of Expense and Revenue Functions
2-6 Breakeven Analysis
2-7 The Profi t Equation
2-8 Mathematically Modeling a Business
2
for the wordin a variety of contexts There are com
What do you think
Henry Luce meant in this quote?
What do you think? Answers should contain a
reference to the fact that in
business, it is important to
look ahead, to predict, and
to calculate and weigh all
options when making
decisions.
TEACHING RESOURCESInstructor’s Resource CD
ExamView ® CD, Ch. 2
eHomework, Ch. 2
www.cengage.com/school/math/fi nancialalgebra
49657_02_ch02_p062-113.indd 6249657_02_ch02_p062-113.indd 62 5/29/10 3:16:52 PM5/29/10 3:16:52 PM

63
©G
UE
NT
ER
MA
NA
US
, 20
09
© C
AR
CU
LTU
RE
/CO
RB
IS
Really!
Really?
Think of all the successful brand name products you use on a daily basis. Imagine all of the brain power and creative energy that went into inventing, perfecting, advertising, and selling these items. With all the resources major corporations have to make sure a product will sell, can you ever imagine a successful corporation producing a product that is a failure?
The business world is full of products that have failed. Some of the failures are from very well-known companies, such as The Coca-Cola Company, Ford Motor Company, and Sony Corporation of America. Below are three famous failures.
New Coke• In April 1985, The Coca-Cola Company changed the recipe of Coca-Cola, and the public was outraged. By July 1985, the company decided to bring back the original formula for Coca-Cola.
Edsel• The Ford Motor Company unveiled its new 1958 Edsel in the fall of 1957. The car had a radically different look and was often described as ugly. The buying public did not like the sound of the name, and the advertising campaign had fl aws. By 1959, production ceased on the Edsel, and the term is still used as a synonym for a failed design.
Sony Betamax• In the late 1970s, Sony offered the fi rst home video tape recorder, called the Betamax. Other manufacturers soon offered their own units. The units offered by other man-ufacturers all used the VHS tape format, and movies could be played on any brand’s machine, except Sony’s machine. Eventually, Sony had to abandon Betamax and issued its own VHS format tape recorders.
You can do online research to fi nd more details on these and other famous product failures.
CHAPTER OVERVIEWIn this chapter, mathemati-
cal modeling is used to
model a business. Point out
that the word model can be
used as a noun or a verb.
You can create a mathemati-
cal model, or model a real-
life situation mathematically.
Students learn to graph and
interpret scatterplots, linear
functions, and parabolas.
REALLY? REALLY!Encourage students to
look on the Internet to fi nd
other product failures. Even
Albert Einstein had failed
inventions. Have students
fi nd the failed inventions
of Einstein. Make sure
students understand the
difference between a failed
invention and a product
that just doesn’t appeal to
consumers.
49657_02_ch02_p062-113.indd 6349657_02_ch02_p062-113.indd 63 5/29/10 3:16:54 PM5/29/10 3:16:54 PM

64 Chapter 2 Modeling a Business
How do scatterplots display trends?Any set of numbers is called a set of data. A single set of numbers is called univariate data. When a business owner keeps a list of monthly sales amounts, the data in the list is univariate data. Data that lists pairs of numbers and shows a relationship between the paired numbers is called bivariate data. If a business owner keeps records of the number of units sold each month and the monthly sales amount, the set is bivari-ate data.
A scatterplot is a graph that shows bivariate data using points on a graph. Scatterplots may show a general pattern, or trend, within the data. A trend means a relationship exists between the two variables.
A trend may show a correlation, or association, between two variables. A positive correlation exists if the value of one variable increases when the value of the other increases. A negative correlation exists if the value of one variable decreases when the value of the other variable increases.
A trend may also show a causal relationship, which means one variable caused a change in the other variable. The variable which causes the change in the other variable is the explanatory variable. The affected vari-able is the response variable. While a trend may indicate a correlation or a causal relationship, it does not have to. If two variables are correlated, it does not mean that one caused the other.
correlation• positive • correlationnegative • correlation
Key Termsdata• univariate data• bivariate data• scatterplot• trend•
ObjectivesGraph bivariate •
data.
Interpret trends •
based on
scatterplots.
Draw lines and •
curves of best fi t.
Interpret Scatterplots2-1
To guess is cheap. To guess wrongly is expensive.Ancient Chinese Proverb
causal • relationshipexplanatory • variableresponse variable•
or aposoneothexiwhin
caonvatheatrv
© GEMPHOTOGRAPHY, 2009/USED UNDER LICENSE FROM SHUTTERSTOCK.COM
EXAMINE THE QUESTIONShow students how a
scatterplot can depict a
trend, and how trends affect
business decisions.
Give students several
examples of univariate and
bivariate data.
CLASS DISCUSSIONAsk students to give a
defi nition of function. Provide
examples of scatterplots that
are functions and scatterplots
are not functions. Have stu-
dents identify the differences.
49657_02_ch02_p062-113.indd 6449657_02_ch02_p062-113.indd 64 5/29/10 3:17:07 PM5/29/10 3:17:07 PM

2-1 Interpret Scatterplots 65
Choose a scale for each axis that allows the scatterplot to fi t in the required space. To choose the scale, look at the greatest and least
numbers that must be plotted for each variable. Label the axes accord-ingly. Then plot each point with a dot. Notice that you do not connect the dots in a scatterplot.
Use the statistics features on your graphing calculator to graph the scatterplot. Your display should look similar to the one shown.
Skills and Strategies
You can graph a scatterplot by hand. You can also graph a scatterplot on a graphing calculator.
EXAMPLE 1
Rachael runs a concession stand at the park, where she sells water bottles. She keeps a list of each day’s high temperature and the number of water bottles she sells each day. Rachael is looking for trends that relate the daily high temperature to the number of water bottles she sells each day. She thinks these two variables might be related and wants to investigate possible trends using a scatterplot. Below is the list of her ordered pairs.
(65, 102), (71, 133), (79, 144), (80, 161), (86, 191),
(86, 207), (91, 235), (95, 237), (100, 243)
Construct a scatterplot by hand on graph paper. Then enter the data in a graphing calculator to create a scatterplot.
SOLUTION In each ordered pair, the fi rst number is the high temperature for the day in degrees Fahrenheit. The second number is the number of water bottles sold. Think of these as the x- and y-coordinates. The scatter-plot is drawn by plotting the points with the given coordinates.
140
100
180
1008070 90
220
y
x
Temperature (˚F)
Wat
er B
ottle
Sal
es
260
TEACHAs students learn about
scatterplots, be sure they
realize that a scatterplot is
a graph of a set of ordered
pairs that may or may not
show a relationship. They
likely remember that to
show an equation, ordered
pairs are graphed on a
coordinate plane and then
connected. Point out that
points graphed on a scat-
terplot are not connected.
The position of the points
are examined to determine
the existence and strength
of a correlation.
Spend time discussing the
difference between correla-
tion and causation. Stu-
dents need to understand
that just because two sets
of data have a correlation,
there may or may not be a
causation between the sets.
EXAMPLE 1Discuss with students the
likelihood that this problem
involves causation—the
temperature is responsible
for an increase in the water
sales.
Compare this example to
the following scenario:
As the sales of ice cream
increase, the number of
lifeguard rescues increases.
Students should recognize
that ice cream does not
cause the need for rescues,
but both increase as the
temperature increases.
When it gets hotter, more
people swim (making for an
increased need for lifeguard
rescues), and more people
eat ice cream.
49657_02_ch02_p062-113.indd 6549657_02_ch02_p062-113.indd 65 5/29/10 3:17:18 PM5/29/10 3:17:18 PM

66 Chapter 2 Modeling a Business
EXAMPLE 2
Rachael wants to interpret the trend shown in the scatterplot. What do you notice about the relationship between temperature and water bottle sales? Is there an explanatory variable and a response
variable?
SOLUTION As the temperature rises, the water bottle sales gen-erally increase. So, there is a correlation between the data.
Because the y-values increase when the x-values increase, the correlation is positive. Additionally, the rise in tempera-ture caused the increase in the number of bottles sold. Therefore, the temperature is the explanatory variable and the number of bottles sold is the response variable.
CHECK ■ YOUR UNDERSTANDINGA local coffee shop sells hot chocolate. The manager keeps track of the temperature for the entire year and the hot chocolate sales. A scatterplot is graphed with temperature on the horizontal axis and hot chocolate sales on the vertical axis. Do you think the scatterplot shows a positive or negative correlation? Is there causation? Explain.
EXAMPLE 3
Determine if the following scatterplot depicts a positive correlation or a negative correlation.
SOLUTION As the x-values increase, the y-values decrease. Therefore, this scatterplot shows a negative correlation between the two variables.
CHECK ■ YOUR UNDERSTANDINGA local medical school is studying growth of students in grades 1–12. The height of each student in inches and the length of each student’s foot in centimeters is recorded, and a scatterplot is constructed. Do you think the scatterplot shows a positive correlation or a negative correlation? Is there causation?
© C
OP
RID
, 20
09/U
SE
D U
ND
ER
LIC
EN
SE
FR
OM
SH
UT
TE
RS
TO
CK
.CO
M
CHECK ■ YOUR UNDERSTANDINGIf the temperature reaches 68 degrees Fahrenheit tomorrow, about how many water bottles do you predict will be sold? Explain.
CHECK YOUR UNDERSTANDINGAnswer approximately
120 water bottles
EXAMPLE 2Ask students what they
think the scatterplot would
look like if temperature was
compared to sweater sales.
They should realize that
as temperatures increase,
sales of sweaters decrease.
CHECK YOUR UNDERSTANDINGAnswer Because sales
decrease when the tem-
perature increases, the
correlation is negative.
This correlation is probably
causal, so temperature is
the explanatory variable
and hot chocolate sales is
the response variable.
EXAMPLE 3Compare the trends in the
scatterplots to what students
remember about slopes of
lines. Explain that the sign of
the “slope” of the scatterplot
is the same as the sign of the
correlation.
Ask students to think of two
variables that are positively
correlated, but one variable
does not cause the other.
CHECK YOUR UNDERSTANDINGAnswer Taller people
generally have larger feet,
so a positive correlation is
expected. There is causation.
49657_02_ch02_p062-113.indd 6649657_02_ch02_p062-113.indd 66 5/29/10 3:17:19 PM5/29/10 3:17:19 PM

2-1 Interpret Scatterplots 67
EXAMPLE 4
An elementary school principal compiled the following data about ten students at Compsett Elementary School. The fi rst number represents a student’s height in inches. The second number is the student’s reading level. Create a scatterplot of the data. Do you think a person’s height causes a higher read-ing level?
SOLUTION The scatterplot shows a positive correlation.
A person’s height does not cause a higher reading level. Most likely, both height and reading level for elementary school students increase with age. Keep in mind that if two variables are correlated, they are associated in some way. The student’s height does not cause the read-ing levels to be a certain value.
CHECK ■ YOUR UNDERSTANDINGThink of an example of data that might have a negative correlation but there is no causation.
EXAMPLE 5
The scatterplot at the right shows the relationship between the number of text messages made by each of ten juniors while studying for Mr. Galati’s chemistry test last week and their scores on the test. Describe the trends you see in the data.
SOLUTION As the number of text messages increases, test grades do not increase, so there is no positive correlation. As the number of text messages increases, test grades do not decrease, so there is no negative correlation. There is no trend in the data, so there is no correlation.
CHECK ■ YOUR UNDERSTANDINGStudents in a biology class measure the circumference and diameter of every tree on the school property. The students create a table of ordered pairs and plan to draw a scatterplot. Should there be a positive correlation, a negative correlation, or no correlation?
Height (inches) Reading Level
48 5.8
63 9.2
49 5.5
43 4.1
46 6.1
55 7.6
59 8.1
60 10.0
47 4.9
50 7.7
EXAMPLE 4Point out to students that
reading level and height
both increase due to their
dependence on age. In this
case, age is called a lurking
variable.
CHECK YOUR UNDERSTANDINGAnswer Answers will
vary. Sample answer: miles
a car is driven and balance
of a loan on the car.
EXAMPLE 5In the next lesson students
will learn about describing
a correlation numerically,
using a correlation coef-
fi cient.
CHECK YOUR UNDERSTANDINGAnswer Based on the
formula C = πd, as the
diameter increases, the
circumference increases.
49657_02_ch02_p062-113.indd 6749657_02_ch02_p062-113.indd 67 5/29/10 3:17:24 PM5/29/10 3:17:24 PM

1. Use what you learned in this lesson to explain how the quote can be interpreted by a business person.
2. A scatterplot shows the number of days that have passed and the number of days left in a month. The explanatory variable is the number of days that have passed. The response variable is the num-ber of days left. Is there a positive or negative correlation? Explain.
3. Examine each scatterplot. Identify each as showing a positive corre-lation, a negative correlation, or no correlation.
To guess is cheap. To guess wrongly is expensive.Ancient Chinese Proverb
Applications
4. In a–d, each set of bivariate data has a causal relationship. Determine the explanatory and response variables for each set of data.a. height and weight of a student b. grade on a math test and number of hours the student
studied c. number of hours worked and paycheck amount d. number of gallons of gas consumed and weight of a car
5. The table shows the personal income per capita (per person) in the United States for seven selected years.a. Draw a scatterplot for the data. b. Describe the correlation.
Year
Per Capita Income in
Dollars
2002 30,838
2003 31,530
2004 33,157
2005 34,690
2006 36,794
2007 38,615
2008 39,751
68 Chapter 2 Modeling a Business
e. f.
d.c.
b.a.
See margin.
increases, the number of days left decreases.
negative correlation
negative correlation
positive correlation
no correlation
negative correlation no correlation
height-explanatory; weight-response
hours-explanatory; grade-response
weight-explanatory; gallons-response
See margin.
positive correlation
Negative correlation; as the number of days that have passed
TEACHVocabulary Review Remind students that the
terms explanatory and
response are used when
causation is implied. Have
students offer original
pairs of variables, tell how
they are correlated, and
determine if there seems to
be causation.
ANSWERS1. When making a business
decision, it is wise to use
available data and graphs
to analyze trends, rather
than guessing and subse-
quently investing money
on a “hunch.”
4c. hours-explanatory;
paycheck-response
5a.
See margin.
49657_02_ch02_p062-113.indd 6849657_02_ch02_p062-113.indd 68 5/29/10 3:17:26 PM5/29/10 3:17:26 PM

2-1 Interpret Scatterplots 69
6. The following set of ordered pairs gives the results of a science exper-iment. Twelve people were given different daily doses of vitamin C, in milligrams, for a year. This is the x-value. They reported the num-ber of colds they got during the year. This is the y-value.
(100, 4), (100, 4), (100, 3), (250, 3), (250, 2), (250, 2),
(500, 1), (500, 2), (500, 1), (1,000, 1), (1,000, 2), (1,000, 1)
a. Construct a scatterplot. b. Describe the correlation. c. Should the scientists label the vitamin C intake the explanatory
variable and the number of colds the response variable? Explain.
7. The enrollment at North Shore High School is given in the table. In each year, the number of students on the baseball team was 19.a. If x represents the year and y represents the
enrollment, draw a scatterplot to depict the data.
b. Describe the correlation from the scatterplot.
c. If x represents the enrollment and y represents the number of students on the baseball team, draw a scatterplot to depict the data.
d. Describe the correlation from the scatterplot.
8. The MyTunes Song Service sells music downloads. Over the past few years, the service has lowered its prices. The table shows the price per song and the number of songs downloaded per day at that price.
Year Enrollment
2006 801
2007 834
2008 844
2009 897
2010 922
Price per Song
Number of Downloads (in
thousands)
$0.89 1,212
$0.79 1,704
$0.69 1,760
$0.59 1,877
$0.49 1,944
$0.39 2,011
a. Examine the data without drawing a scatterplot. Describe any trends you see.
b. Draw a scatterplot. Describe the correlation. c. Approximate the number of downloads at a price of $0.54 per
song. Explain your reasoning.
9. Perform an online search to answer the questions below. a. Find your state’s population for each of the last ten years.b. Create a table of bivariate data. Let x represent the year, and let
y represent the population.c. Create a scatterplot for the data.d. Describe the correlation between the year and your state’s
population.
See margin.
negative correlation
Yes; it seems to be causal.
TEACHData EntryStudents need to double
check calculator list entries
before making calculations.
The calculator will display
incorrect answers just as
quickly as it will correct
answers if data are entered
incorrectly. It is very easy to
make a mistake entering data.
Also remind them to check
the number of pieces of data
they entered, to make sure it
agrees with the original list.
ANSWERS6a.
7a.
7c.
8a. As x decreases,
y increases.
8b. There is a negative
correlation.
8c. Approximately
1,910,500 songs. The
average of $0.59 and
$0.49 is $0.54 and the
average of 1,877 and
1,944 is 1,910.
See margin.
positive correlation
See margin.
no correlation
See margin.
See margin.
See margin.
Answers vary.
49657_02_ch02_p062-113.indd 6949657_02_ch02_p062-113.indd 69 5/29/10 3:17:30 PM5/29/10 3:17:30 PM

70 Chapter 2 Modeling a Business
How can the past predict the future?Many scatterplot points can be approximated by a single line that best fi ts the scattered points. This line may be called a: line of best fi t, linear regression line, or least squares line. This line can be used to display a trend and predict corresponding variables for different situations. It is more effi cient to rely on the single line rather than the scatterplot points because the line can be represented by an equation.
Recall that the domain is a set of fi rst elements of the ordered pairs, and the range is the set of corresponding second elements. Interpolation means to predict corresponding y-values, given an x-value within the domain. Extrapolation means to predict corre-sponding y-values outside of the domain.
The scatterplot shown is from Example 1 in the previous lesson. The line shown is a line of best fi t because it closely follows the trend of the data points. The blue labels are included to identify the axes, but will not be shown on a calculator display. Generally, the distance the points lie from
the line of best fi t determines how good a predictor the line is. If most of the points lie close to the line, the line is a better predictor of the trend of the data than if the points lie far from the line. If the points lie far from the line, the line is not good for predicting a trend.
The correlation coeffi cient, r, is a number between –1 and 1 inclu-sive that is used to judge how closely the line fi ts the data. Negative cor-
relation coeffi cients show negative correlations, and positive correlation coeffi cients show positive correlations. If the correlation coeffi cient is near 0, there is little or no correlation. Correlation coeffi cients with an absolute value greater than 0.75 are strong correlations. Correlation coeffi cients with an absolute value less than 0.3 are weak correlations. Any other correlation is a moderate correlation.
interpolation• extrapolation• correlation coeffi cient• strong correlation• weak correlation• moderate correlation•
Key Termsline of best fi t• linear regression • lineleast squares line• domain• range•
ObjectivesBe able to fi t a •
regression line to a
scatterplot.
Find and interpret •
correlation
coeffi cients.
Make predictions •
based on lines of
best fi t.
Linear Regression2-2
The only useful function of a statistician is to make predictions, and thus provide a basis for action.
William Edwards Deming, Professor and Statistician
Temperature (˚F)
Wat
er B
ottle
Sal
es
EXAMINE THE QUESTIONThe trends shown by
scatterplots can be used
to predict the future. But
making a prediction without
a line of best fi t to guide
you would be arbitrary.
Point out that changes
could make the prediction
inaccurate. However, the
predictions are based on
current data and are better
than haphazard guessing.
CLASS DISCUSSIONPut a scatterplot on the
board and point to different
x-values in the domain. For
each, ask students if it is an
example of interpolation or
extrapolation.
What can you tell about the
sign of the correlation coef-
fi cient and the slope of the
regression line?
49657_02_ch02_p062-113.indd 7049657_02_ch02_p062-113.indd 70 5/29/10 3:17:32 PM5/29/10 3:17:32 PM

2-2 Linear Regression 71
CHECK ■ YOUR UNDERSTANDINGApproximately how many more water bottles will Rachael sell if the temperature increases 2 degrees?
© R
OM
AN
SIG
AE
V,
20
09/U
SE
D U
ND
ER
LIC
EN
SE
FR
OM
SH
UT
TE
RS
TO
CK
.CO
M
Skills and Strategies
The line of best fi t and the correlation coeffi cient can be found using a graphing calculator.
EXAMPLE 1
Find the equation of the linear regression line for Rachael’s scatterplot in Example 1 from Lesson 2-1. Round the slope and y-intercept to the nearest hundredth. The points are given below.
(65, 102), (71, 133), (79, 144), (80, 161), (86, 191),
(86, 207), (91, 235), (95, 237), (100, 243)
SOLUTION Although it is possible to fi nd the linear regression equation using paper and pencil, it is a lengthy process. Using the linear regres-sion feature on a graphing calculator produces more accurate results.
Enter the ordered pairs into your calculator. Then use the statistics menu to calculate the linear regression equation. The equation is of the form y = mx + b, where m is the slope and b is the y-intercept. Rounding the slope and y-intercept to the nearest hundredth, the equation of the regression line is y = 4.44x – 187.67.
Note that calculators may use different letters to represent the slope or the y-intercept. Remember that the coeffi cient of x is the slope.
CHECK ■ YOUR UNDERSTANDINGFind the equation of the linear regression line of the scatterplot defi ned by these points: (1, 56), (2, 45), (4, 20), (3, 30), and (5, 9). Round the slope and y-intercept to the nearest hundredth.
EXAMPLE 2
Interpret the slope as a rate for Rachael’s linear regression line. Use the equation from Example 1.
SOLUTION The formula for slope is m = ∆y
___ ∆x
. The range val-
ues, y, represent bottles sold and the domain values, x, repre-
sent temperatures. The slope is a rate of bottles per degree. The slope is 4.44, which means that for each one-degree increase in temperature, 4.44 more water bottles will be sold. Rachael cannot sell a fraction of a water bottle, so she will sell approx-imately 4 more bottles for each degree the temperature rises.
TEACHTo enter regression lines
and have them graphed
on the calculator’s display
along with the scatterplot,
students need to be sure
they have the scatterplot
and the equation set to dis-
play on the same screen.
EXAMPLE 1Different calculators have
keys in different locations with
different names, but the basic
functions are similar. Remind
students to input data care-
fully. An incorrect entry results
in an incorrect answer.
CHECK YOUR UNDERSTANDINGAnswer y = –11.9x + 67.7
EXAMPLE 2Review the units of the slopes
for the examples shown
throughout Lesson 2-1, so
students understand that the
slope is a rate of change.
CHECK YOUR UNDERSTANDINGAnswer 9 bottles
49657_02_ch02_p062-113.indd 7149657_02_ch02_p062-113.indd 71 5/29/10 3:17:36 PM5/29/10 3:17:36 PM

72 Chapter 2 Modeling a Business
EXAMPLE 3
Rachael is stocking her concession stand for a day in which the tem-perature is expected to reach 106 degrees Fahrenheit. How many water bottles should she pack?
SOLUTION The linear regression equation tells Rachel the approximate number of bottles she should sell given a specifi c temperature. Substitute 106 for x in the equation, and compute y, the number of water bottles she should expect to sell.
Equation of the
regression line y = 4.44x – 187.67
Substitute 106 for x. y = 4.44(106) – 187.67
Simplify. y = 282.97
If the trend continues and the temperature reaches 106 degrees Fahrenheit, Rachael should expect to sell approximately 283 water bottles. She should stock 283 bottles. This is an example
of extrapolation because 106 degrees Fahrenheit was not between the high and low x-values of the original domain.
CHECK ■ YOUR UNDERSTANDINGHow many water bottles should Rachael pack if the temperature forecasted were 83 degrees? Is this an example of interpolation or extrapolation? Round to the nearest integer.
EXAMPLE 4
Find the correlation coeffi cient to the nearest hundredth for the linear regression for Rachael’s data. Interpret the correlation coeffi cient.
SOLUTION Use a graphing calculator to fi nd the correlation coeffi cient.
Round r to the nearest hundredth. r = 0.97
Because 0.97 is positive and greater than 0.75, there is a strong positive correlation between the high temperature and the number of water bottles sold.
CHECK ■ YOUR UNDERSTANDINGFind the correlation coeffi cient to the thousandth for the linear regression for the data in Check Your Understanding for Example 1. Interpret the correlation coeffi cient.
EXTEND ■ YOUR UNDERSTANDINGCarlos entered data into his calculator and found a correlation coeffi cient of – 0.28. Interpret this correlation coeffi cient.
SOLRachsho106num
Eq
reg
Su
Si
IfreeS
of extrapolation becaushi h d l l
© VASILIY KOVAL 2009/USED UNDER LICENSE
FROM SHUTTERSTOCK.COM
CHECK YOUR UNDERSTANDINGAnswer 181 water bottles;
it is an example of interpo-
lation.
EXAMPLE 4Have students identify all
correlations as strong, mod-
erate, or weak.
It is a common error for
students to ignore nega-
tive signs when reading
correlation coeffi cients on
calculator displays. Caution
them to note the sign of the
coeffi cient.
CHECK YOUR UNDERSTANDINGAnswer r = –0.998; this
coeffi cient represents a
strong negative correlation.
EXTEND YOUR UNDERSTANDINGAnswer The correlation is
weak and negative.
EXAMPLE 3Ask students if this is an
example of interpolation or
extrapolation.
49657_02_ch02_p062-113.indd 7249657_02_ch02_p062-113.indd 72 5/29/10 3:17:40 PM5/29/10 3:17:40 PM

2-2 Linear Regression 73
1. Apply what you have learned in this lesson to give an interpretation of the quote.
2. Over the past four years, Reggie noticed that as the price of a slice of pizza increased, her college tuition also increased. She found the cor-relation coeffi cient was r = 0.49. Which of the following scatterplots most accurately displays Reggie’s data? Explain.
3. In Exercise 2, would the price of a slice of pizza be labeled as the explan-atory variable and the tuition as the response variable? Explain.
4. The table gives enrollments at North Shore High School.a. Find the equation of the regression line. Round the slope and
y- intercept to the nearest hundredth. b. What is the slope of the linear regression line? c. What are the units of the slope expressed as a rate? d. Based on the linear regression line, how many students will be
enrolled in the year 2016? Round to the nearest integer. e. Is your answer to part d an example of interpolation or extrapola-
tion? Explain. f. Find the correlation coeffi cient to the nearest hundredth. g. Describe the correlation.
5. Examine the data from Exercise 4.a. Find the mean (arithmetic average) of the fi ve years. b. Find the mean of the fi ve enrollment fi gures. c. Create an ordered pair whose x-value is the mean of the years
and whose y-value is the mean of the enrollments. d. Show that the ordered pair satisfi es the linear regression equation.
What does this mean regarding the regression line?
6. Describe each of the following correlation coeffi cients using the terms strong, moderate, or weak and positive or negative.a. r = 0.21 b. r = – 0.87 c. r = 0.55 d. r = – 0.099 e. r = 0.99 f. r = – 0.49
The only useful function of a statistician is to make predictions, and thus provide a basis for action.
William Edwards Deming, Professor and Statistician
Applications
Year Enrollment
2006 801
2007 834
2008 844
2009 897
2010 922
a. b.
See margin.
See margin.
No, there isno apparent causation. Both prices may have increased due to infl ation over time.
2008
859.6
y = 30.5x – 60,384.4
30.5
students per year
1,104 students
Extrapolation; 2016 is outside of the domain.
r = 0.98
strong positive correlation
TEACHInvestigate Correlation Coeffi cientAt some point, have
students switch the x and
y variables and fi nd the
correlation coeffi cient. They
should see it remains the
same. However, the slope of
the regression line changes.
ANSWERS 1. The ability to make
predictions is valuable in
many fi elds. It allows you
to be proactive in regards
to the future, rather
than just assuming you
have no control over the
future.
2. Graph a shows a moder-
ate correlation that could
be described by r = 0.49.
Graph b is almost linear
and shows a strong cor-
relation.
5d. y = 30.5x – 60,384.4
y = 30.5(2008) –
60,384.4 = 859.6. The
linear regression line
always passes through
the point formed by the
averages of each set of
data.
(2008, 859.6)
See margin.
weak positive strong negative
moderate positive
strong positive
weak negative
moderate negative
49657_02_ch02_p062-113.indd 7349657_02_ch02_p062-113.indd 73 5/29/10 3:17:44 PM5/29/10 3:17:44 PM

74 Chapter 2 Modeling a Business
Amount of Restaurant Bill ($)
Tip Amount ($)
45.55 7.00
52.00 15.00
66.00 6.00
24.44 6.00
57.90 15.00
89.75 23.00
33.00 8.00
7. The table gives the number of songs downloaded from MyTunes at different prices per song.a. Find the equation of the linear
regression line. Round the slope and y-intercept to the nearest hundredth.
b. What is the slope of the linear regression line?
c. What are the units of the slope when it is expressed as a rate?
d. Based on the linear regression line, how many thousands of downloads would MyTunes expect if the price was changed to $0.45? Round to the nearest integer.
e. Is your answer to part d an example of interpolation or extrapolation?
f. Find the correlation coeffi cient to the nearest hundredth. g. Describe the correlation.
8. Julie is a waitress. On the left is a log of her tips for yesterday’s shift.a. Find the equation of the linear regression line. Round the slope
and y-intercept to the nearest hundredth. b. What is the slope of the linear regression line? c. What are the units of the slope when it is expressed as a rate? d. Based on the linear regression line, what tip would Julie receive if
the restaurant bill were $120? Round to the nearest dollar. e. Is your answer to part d an example of interpolation or extrapola-
tion? Explain. f. Find the correlation coeffi cient for this data. Round to the near-
est hundredth. g. Describe the correlation. h. Based on the linear regres-
sion line, Julie creates a spreadsheet to compute predicted tips for any restau-rant bill amount. Write the formula that can be used to compute the predicted tips in column B.
9. Explain why the sign of the slope of a regression line must be the same as the sign of the correlation coeffi cient.
10. Which of the following scatterplots shows a correct line of best fi t?
11. Is it possible for a linear regression line to go through every point on the scatterplot? Is it possible for a linear regression line to not go through any point on the scatterplot?
Price per Song
Number of Downloads
(in thousands)
$0.89 1,212
$0.79 1,704
$0.69 1,760
$0.59 1,877
$0.49 1,944
$0.39 2,011
A B
1 Restaurant Bill Predicted Tip
2
3
4
5
b. c.a.
See margin.
ANSWERS8c. tip dollars per restau-
rant bill amount
9. A positive slope means
the line is increasing,
which means as
x increases, y increases.
If y increases as
x increases, the cor-
relation coeffi cient is
positive. A negative
slope means the line
is decreasing, which
means as x increases,
y decreases. If y
decreases as x increases,
the correlation coeffi cient
is negative.
11. Yes, if the points are
linear, the regression
line will go through
every point. If the points
are not linear, it may not
go through any point on
the scatterplot.
TEACHExamine ScatterplotsFor all examples, ask stu-
dents about the shape of
the scatterplots (linear or
not), the sign of the associa-
tion (positive or negative),
and the strength (strong,
moderate, weak) of the cor-
relation. They should
get comfortable using
these terms to describe
scatterplots.
y = –1,380.57x + 2,634.90
–1,380.57
thousands of downloads per dollar
2,014
interpolation
r = – 0.90
strong negative correlation
y = 0.22x – 0.27
0.22
$26
Extrapolation; $120 is outside of the original domain.
r = 0.75
moderate positive correlation
=A2*0.22–0.27
See margin.
c
See margin.
49657_02_ch02_p062-113.indd 7449657_02_ch02_p062-113.indd 74 5/29/10 3:17:48 PM5/29/10 3:17:48 PM

2-3 Supply and Demand 75
How do manufacturers decide the quantity of a product they will produce?Economists often call a new, unnamed product a widget. If a business develops a new product, the number of items they need to manufacture is a key question they need to address. Graphs may be used to help answer this question. Such graphs compare the price of an item, p, and the quantity sold, q. The horizontal axis is labeled p and the vertical axis is labeled q. The set of p values on the horizontal axis is the domain. The set of q values on the vertical axis is the range. A function is a rule that assigns a unique member of the range to each element of the domain.
Graphs using the p- and q- axes can be used to model a trend in consumers’ inter-est in a product. A demand function relates the quantity of a product to its price. If a widget has a low price, many people may want it and will be able to afford it, so a large quantity may be sold. If it has a high price, fewer widgets will be sold. As the price increases, demand (the quantity consumers want) is likely to decrease, and as price decreases, demand increases. The graph of the demand function has a negative slope. However, its curvature varies.
Graphs using p- and q- axes can also be used to model a trend in the manufacturing of a product. Producers provide supply (the quantity of items available to be sold). If a widget sells for a high price, the manufacturer may be willing to produce many items to maximize profi t. If the widget sells for a lower price, the manufacturer may produce less. As price increases, supply increases. The graph of the supply func-tion has a positive slope. Its curvature also varies.
demand• supply• wholesale • price
Key Termswidget• function• demand • function
ObjectivesUnderstand •
the slopes of
the supply and
demand curves.
Find points of •
equilibrium.
Supply and Demand 2-3
q
p
q
p
q
p
markup• retail price• equilibrium• shift•
q
p
q
p
q
p
Teach a parrot the terms “supply and demand” and you’ve got an economist.
Thomas Carlyle, Philosopher
EXAMINE THE QUESTIONHave students imagine they
are starting a new busi-
ness. What are the dangers
of overproducing? (excess
inventory and wasted
money) What are the dan-
gers of underproducing?
(lost income) Deciding how
many items to produce is
not guesswork.
49657_02_ch02_p062-113.indd 7549657_02_ch02_p062-113.indd 75 5/29/10 3:17:49 PM5/29/10 3:17:49 PM

76 Chapter 2 Modeling a Business
Economic decisions require research, and knowledge of the laws of supply and demand. To examine the law of supply and demand, graph both functions on the same axes. Examine what happens as the manufacturer sets different prices. Keep in mind that the manufac-turer sells the items to retailers, such as stores, and not directly to the general public. The price the manufacturer charges the retailer is the wholesale price. Retailers increase the price a certain amount, called markup, so the retailer can make a profi t. The price the retailer sells the item to the public for is the retail price.
Look at the graph on the left. If the price is set at $3.00, consumers will demand h widgets, and manufacturers will be willing to supply k widgets. There will be a shortage of widgets. High demand and low supply often create a rise in price. The manufacturer knows that people want widgets, yet there are not enough of them. If the price rises, demand will fall.
Look at the center graph. If the price is set at $7.00, consumers will demand k widgets, and manufacturers will be willing to supply h widgets. There will be too much supply, and manufacturers will have to lower the price to try and sell the high inventory of widgets.
Look at the graph on the right. At a price of $6.00, the number of widgets demanded by consumers is equal to the number of widgets man-ufacturers will supply. Where the functions of supply and demand inter-sect, the market is in equilibrium.
q
p
q
p
q
p
h
3
k
Supply
Demand
Supply
Demand
hk
Supply
Demand7 6
h
Supply depends on the expenses involved in producing a widget and the price for which it can be sold. The factors of supply will be outlined in Lesson 2-4. This lesson concentrates on demand.
EXAMPLE 1
The Wacky Widget Company sells widgets for $2.00 each wholesale. A local store has a markup of $1.59. What is the retail price?
SOLUTION Add the markup to the wholesale price.
Markup + Wholesale price = Retail price 2.00 + 1.59 = 3.59
The retail price is $3.59.
CHECK ■ YOUR UNDERSTANDINGThe wholesale price of an item is x dollars. The retail price is r dollars. Express the markup algebraically.
Skills and Strategies
CLASS DISCUSSIONGive students other exam-
ples of functions, including
non-numerical examples.
For example, the initials
function assigns fi rst initials
to people. The hair color
function assigns a color to a
person based on their hair
color. Use examples such
as these to show that two
different elements of the
domain could be mapped
to the same element of the
range.
Ask students about any
products that are diffi cult to
fi nd because stores don’t
always have them in stock.
TEACHSupply and demand are
concepts that impact stu-
dents’ lives, yet they have
probably never given much
thought to them. Be sure
they can give examples of
the supply and demand
for products they typically
purchase or use.
EXAMPLE 1Point out to students that
the markup is not all profi t.
Markup costs are used to
cover the store’s expenses.
Ask them to identify some
of these expenses, which
include rental costs, paying
employees, advertising,
utility costs, and purchasing
store fi xtures.
CHECK YOUR UNDERSTANDINGAnswer r – x
Sometimes students have
trouble expressing literal
subtraction expressions,
and they misplace the min-
uend and the subtrahend.
49657_02_ch02_p062-113.indd 7649657_02_ch02_p062-113.indd 76 5/29/10 3:17:53 PM5/29/10 3:17:53 PM

2-3 Supply and Demand 77
EXAMPLE 2
The Robear Corporation sells teddy bears at a wholesale price of $23.00. If a store marks this up 110%, what is the retail price?
SOLUTION Compute the markup amount. Then calculate the retail price.
Markup rate × Wholesale price = Markup 1.10 × $23 = $25.30
Wholesale price + Markup = Retail price $23.00 + $25.30 = $48.30
The retail price is $48.30.
CHECK ■ YOUR UNDERSTANDINGA banner company sells 5-foot banners to retailers for x dollars. The St. James Sign Shop marks them up 90%. Express the retail price at the St. James store algebraically.
EXAMPLE 3
The graph shows the supply and demand curves for a widget. Explain what happens if the price is set at $9.00.
SOLUTION Because $9.00 is less than the equilibrium price, demand will exceed supply. Suppliers will attempt to sell the widget at a higher price.
CHECK ■ YOUR UNDERSTANDINGUse the graph to explain what happens if the price is set at $15.00.
EXAMPLE 4
A company wants to base the price of its product on demand for the product, as well as on expenses. It takes a poll of several of its current retailers to fi nd out how many widgets they would buy at different wholesale prices. The results are shown in the table. The company wants to use linear regression to create a demand function. What is the equation of the demand function? Round the slope and y-intercept to the nearest hundredth.
SOLUTION Use the linear regression feature on your graphing cal-culator. The equation is q = –1,756.19p + 30,238.82. This represents the demand function.
q
p11
Supply
Demand
Wholesale Price ($) (p)
Quantity Retailers Would Purchase
(in thousands) (q)
15.25 3,456
15.50 3,005
15.75 2,546
16.00 2,188
16.25 1,678
16.50 1,290
16.75 889
17.00 310
CHECK ■ YOUR UNDERSTANDINGExplain why it makes sense that the demand function has a negative slope.
EXAMPLE 2Point out to students that a
100% markup is the same as
doubling the wholesale price.
CHECK YOUR UNDERSTANDINGAnswer x + 0.9x, or 1.09x.
EXAMPLE 3Point out the importance
of labeling the axes and
advise students to label all
problems.
CHECK YOUR UNDERSTANDINGAnswer Supply will exceed
demand. Suppliers will
attempt to sell the excess wid-
gets by lowering the price.
EXAMPLE 4Remind students that the
linear regression line is an
“average” line, and if they
substitute the wholesale
prices from the table into
the regression equation,
they will not get the quantity
shown in the table, unless
the regression line goes
through the point with those
coordinates. That is unlikely.
CHECK YOUR UNDERSTANDINGAnswer As the price
increases, less quantity is
demanded, so the demand
function slopes downward.
This is indicated by a nega-
tive slope.
49657_02_ch02_p062-113.indd 7749657_02_ch02_p062-113.indd 77 5/29/10 3:17:54 PM5/29/10 3:17:54 PM

1. Interpret the quote in the context of what you learned in this lesson.
2. An automobile GPS system is sold to stores at a wholesale price of $97. A popular store sells them for $179.99. What is the store’s markup?
3. A CD storage rack is sold to stores at a wholesale price of $18.a. If a store has a $13 markup, what is the retail price of the
CD rack? b. Find the percent increase of the markup to the nearest percent.
4. A bicycle sells for a retail price of b dollars from an online store. The wholesale price of the bicycle is w.a. Express the markup algebraically. b. Express the percent increase of the markup algebraically.
5. The graph shows supply and demand curves for the newest SuperWidget.
Teach a parrot the terms “supply and demand” and you’ve got an economist.
Thomas Carlyle, Philosopher
Applications
q
p$1.12
Supply
Demand$0.98
y
x
q
p35
Supply
Demand
78 Chapter 2 Modeling a Business
a. What is the equilibrium price? b. What will happen if the price is set at $0.98? c. How many SuperWidgets are demanded at a price of $0.98? d. How many SuperWidgets are supplied at a price of $0.98? e. What will happen if the price is set at $1.22?
6. The graph below shows supply and demand curves for a new mp3 player accessory.a. What is the equilibrium price? b. Describe the relationship of supply and demand if the item were
sold for $20. c. Describe the relationship of supply
and demand if the item were sold for $40.
d. Name the domain that will increase demand.
e. Name the domain that will increase supply.
See margin.
$82.99
72%
b – w
TEACHShifts of Demand Curves Notice that when a demand
curve is shifted to the right,
some students may see this
as shifted “up.” Similarly,
when a curve is shifted left,
it may appear to be shifted
“down.” Try to have stu-
dents use left and right to
describe the shifts.
ANSWERS1. Parrots repeat the things
they hear over and over.
Supply and demand is
such an important con-
cept in economics that
it is constantly used by
economists.
5b. Demand will exceed
supply, and suppliers
will attempt to sell the
product at a higher
price.
5e. Supply will exceed
demand, and suppli-
ers will attempt to sell
the excess product at a
lower price.
6b. Demand will exceed
supply, and suppliers
will attempt to sell the
product at a higher
price.
6c. Supply will exceed
demand, and suppliers
will attempt to sell the
excess product at a
lower price.
$31
b – w
______ w
• 100
$1.12
See margin.
y
x
See margin.
$35
See margin.
See margin.
x < 35
x > 35
49657_02_ch02_p062-113.indd 7849657_02_ch02_p062-113.indd 78 5/29/10 3:17:55 PM5/29/10 3:17:55 PM

2-3 Supply and Demand 79
7. The supply and demand curves for a new widget are shown in the graph. Notice there are two demand curves. The original demand curve is d1. Months after the product was introduced, there was a possible health concern over use of the product, and demand dropped to the new demand curve, d2. The movement of the demand curve is called a shift.a. What was the equilibrium price before the demand shift? b. What was the equilibrium quantity before the demand shift? c. What was the equilibrium price after the demand shift? d. What was the equilibrium quantity
after the demand shift? e. Express algebraically the difference in
quantity demanded at price b before and after the shift.
f. Copy a rough sketch of the graph into your notebook. Label the curves. Where would the demand curve have shifted if a health benefi t of the new widget was reported?
8. Debbie is president of a company that produces garbage cans. The company has developed a new type of garbage can that is animal-proof, and Debbie wants to use the demand function to help set a price. She surveys ten retailers to get an approximation of how many garbage cans would be demanded at each price, and creates a table.a. Find the equation of the linear regression line. Round the slope
and y-intercept to the nearest hundredth. b. Give the slope of the regression line and interpret the slope as a
rate. c. Find the correlation coeffi cient and interpret it. Round to the near-
est hundredth. d. Based on the linear regression line, how many garbage cans
would be demanded at a wholesale price of $18.00? Round to the nearest hundred garbage cans.
e. Was your answer to part d an example of extrapolation or inter-polation? Explain.
f. Look at your answer to part d. If the company sold that many garbage cans at $18.00, how much money would the company receive from the garbage can sales?
9. A company that produces widgets has found its demand function to be q = –1,500p + 90,000.a. For each dollar increase in the wholesale price, how many fewer
widgets are demanded? b. How many widgets would be demanded at a price of $20? c. How many widgets would be demanded at a price of $21? d. What is the difference in quantity demanded caused by the $1
increase in wholesale price? e. The company sets a price of $22.50. How many widgets will be
demanded? f. How much will all of the widgets cost the store to purchase at a
price of $22.50? g. If the store marks up the widgets that cost $22.50 at a rate of
50%, what is the retail price of each widget?
q
pb
Supply
d
ad
ce
12
Wholesale Price ($) (p)
Quantity Demanded By Retailers (in hundreds) (q)
13.00 744
13.50 690
14.00 630
14.50 554
15.00 511
15.50 456
16.00 400
16.50 300
17.00 207
17.50 113
TEACHMulti-part ExercisesThese problems have many
parts that depend on previ-
ous parts being answered
correctly. Stress the fact
that calculator list entries
must be checked carefully.
ANSWERS8b. The slope is –136.08.
As a rate, the slope is
expressed as garbage
cans per dollar. For each
dollar increase in price,
about 136 less garbage
cans are demanded.
b
e
a
c
e – c
It would shift to the right.
q = –136.08p + 2,535.79
See margin.
r = –0.99; there is a strong negative correlation.
86 hundred
Extrapolation, $18.00 is not in the domain.
$154,800
1,500
60,000
58,500
1,500 less
56,250
$1,265,625
$33.75
49657_02_ch02_p062-113.indd 7949657_02_ch02_p062-113.indd 79 5/29/10 3:17:59 PM5/29/10 3:17:59 PM

What expenses are involved in the manufacturing process?A group of art school students have decided to start a business producing hand-painted jeans. They made a list of expenses for running the busi-ness. Some of these items must be purchased while others may be rented.
factory space• telephone• paint•
furniture• computer• packaging•
delivery trucks• offi ce supplies• postage•
electricity• jeans• labor• All of these expenses fall into one of two categories—variable expenses or fi xed expenses. Expenses that depend on the number of items pro-duced are variable expenses. Examples of variable expenses are costs for raw materials such as jeans, paint, offi ce supplies, and labor expenses, because these costs change based on the quantity produced.
Some expenses do not change based on the quantity produced. These expenses are fi xed expenses. Examples of fi xed expenses are the cost of the furniture and the computer. The cost of having the lights on is the same regardless of how many items are produced, so this is also a fi xed expense.
The total expenses is the sum of the fi xed and variable expenses. The expense equation is
E = V + F where E represents total expenses, V represents variable expenses, and F represents fi xed expenses
The income a business receives from selling its product is revenue. Revenue is the price for which each product was sold times the number of products sold. The revenue equation is
R = pq where R represents revenue, p represents the price of the product, and q represents the quantity of products sold
The difference obtained when expenses are subtracted from rev-enue is a profi t when positive and a loss when negative. When the expenses and the revenue are equal, there is no profi t or loss. This is the breakeven point.
revenue equation• profi t• loss• breakeven point•
Key Termsvariable expenses • fi xed expenses• expense equation• revenue•
ObjectivesUnderstand the •
difference between
fi xed and variable
expenses.
Create an expense •
equation based on
fi xed and variable
expenses.
Fixed and Variable Expenses2-4
80 Chapter 2 Modeling a Business
An economist is an expert who will know tomorrow why the things he predicted yesterday didn’t happen today.
Laurence J. Peter, Professor
EXAMINE THE QUESTIONStudents have possibly
never brainstormed on all
of the variables that affect
the manufacturing process.
Give them time to think and
formulate answers before
they read the text.
CLASS DISCUSSIONCan you think of any other
expenses involved in the
manufacturing process?
Point out that revenue
depends on quantity sold,
and the quantity sold
depends on the price
charged, so revenue
ultimately depends on the
price charged.
49657_02_ch02_p062-113.indd 8049657_02_ch02_p062-113.indd 80 5/29/10 3:18:00 PM5/29/10 3:18:00 PM

2-4 Fixed and Variable Expenses 81
Business owners use mathematical models to analyze expenses and rev-enue to determine profi tability of a product.
EXAMPLE 1
The art students have researched all of their potential expenses. The fi xed expenses are $17,600. The labor and materials required for each pair of painted jeans produced cost $7.53. Represent the total expenses as a function of the quantity produced, q.
SOLUTION If q units are produced at a cost of $7.53 per unit, the vari-able expenses can be represented by:
V = 7.53q
The fi xed expenses, $17,600, do not depend on the quantity produced. The total expenses, E, are the sum of the variable and the fi xed expenses.
E = V + FE = 7.53q + 17,600
The total expenses, E, are a function of the quantity produced, q.
CHECK ■ YOUR UNDERSTANDINGA widget manufacturer’s expense function is E = 6.00q + 11,000. What are the variable costs to produce one widget?
EXAMPLE 2
Kivetsky Ski Supply manufactures hand warmers for skiers. The expense function is E = 1.18q + 12,000. Find the average cost of producing one pair of hand warmers if 50,000 hand warmers are produced.
SOLUTION Find the total cost of producing 50,000 hand warmers by substituting 50,000 for q in the expense function.
E = 1.18q + 12,000
Substitute. E = 1.18(50,000) + 12,000
Multiply. E = 59,000 + 12,000
Simplify. E = 71,000
To fi nd the average cost, divide the total cost by the number produced.
Divide by 50,000. 71,000
_______ 50,000
= 1.42
The average cost to produce one hand warmer is $1.42 when 50,000 are produced.
CHECK ■ YOUR UNDERSTANDINGThe expense function for a certain product is E = 3.40q + 189,000. Express the average cost of producing q items algebraically.
Skills and Strategies
TEACHRelate what students
know about variables
and constants to the new
vocabulary terms of vari-
able expenses and fi xed
expenses.
EXAMPLE 1Point out to students that
the variable expenses part
of the expense equation
needs a variable. The fi xed
part of the equation is also
called a constant.
CHECK YOUR UNDERSTANDINGAnswer $6.00
Ask students the costs of
producing 500 widgets
and 501 widgets. Find the
difference and compare it
to the slope of the expense
function.
EXAMPLE 2Point out to students that
intuitively, the average cost
decreases as the number of
items produced increases,
because the fi xed costs are
“spread out” over many
items.
CHECK YOUR UNDERSTANDING
Answer 3.40q + 189,000
_______________ q
49657_02_ch02_p062-113.indd 8149657_02_ch02_p062-113.indd 81 5/29/10 3:18:03 PM5/29/10 3:18:03 PM

82 Chapter 2 Modeling a Business
EXAMPLE 3
Willie’s Widgets has created a demand function for its widgets, where q is the quantity demanded and p is the price of one widget.
q = –112p + 4,500
Its expense function is E = 3.00q + 18,000. Express the expense function as a function in terms of p.
SOLUTION Because E is a function of q, and q is a function of p, express E as a function of p using substitution.
E = 3.00q + 18,000
Substitute for q. E = 3.00(–112p + 4,500) + 17,600
Distribute. E = –336p + 13,500 + 17,600
Simplify. E = –336p + 31,100
The expense function in terms of the price, p, is E = –336p + 31,100.
CHECK ■ YOUR UNDERSTANDINGA corporation’s expense function is E = 4.00q + 78,000. The demand function was determined to be q = –4p + 3,000. Express E in terms of p.
EXAMPLE 4
Wally’s Widget World created a monthly expense equation, E = 1.10q + 4,200. Wally’s Widget World plans to sell its widgets to retailers at a wholesale price of $2.50 each. How many widgets must be sold to reach the breakeven point?
SOLUTION Use a graphing calculator. Graph the revenue function, R = 2.50q, using R as revenue and q as the quantity sold. Notice that q is the independent variable, so the horizontal axis is labeled q. The labels on the graph below will not be shown on the calculator display.
Graph the revenue function on a coordinate grid.
Graph the expense function on the same coordinate grid. Use your calculator’s graph intersection feature to fi nd the point of intersection.
dolla
rs
q
R = 2.50q
X=3000 Y=7500Intersection
dolla
rs
q
EXAMPLE 3Remind students that
revenue depends on quan-
tity sold, and the quantity
sold depends on the price
charged, so revenue depends
on price. As a result, they can
express revenue in terms of
the variable p.
CHECK YOUR UNDERSTANDINGAnswer E = –16.00p + 90,000
You can give students
similar problems to make
sure they are substituting
correctly.
EXAMPLE 4Remind students to label the
axes and to use these labels.
Since the y- coordinates (the
“heights”) represent dollars,
the revenue and expense
heights can be compared to
see which is greater.
You may put the graph on
the board, and pick a spe-
cifi c value of q. Highlight
the revenue and expenses
at this q-value, and draw
a vertical line connecting
these two points. Explain
that the length of this line
represents the difference
between revenue and
expenses, and is a graphical
representation of profi t.
49657_02_ch02_p062-113.indd 8249657_02_ch02_p062-113.indd 82 5/29/10 3:18:05 PM5/29/10 3:18:05 PM

2-4 Fixed and Variable Expenses 83
It will cost $7,500 to manufacture 3,000 widgets. If 3,000 widgets are sold to stores for $2.50 each, the company will receive $7,500. Notice that no profi t is made—the revenue equals the expense. The point (3,000, 7,500) is the breakeven point. Look at sections of the graph before and after the breakeven point to see if you understand what happens.
If more than 3,000 widgets are produced, the company will be operat-ing in the green area of the graph, where R > E. A profi t is made when revenue is greater than expenses.
If less than 3,000 widgets are produced, the company will be operating in the red area of the graph, where E > R. The company is not making enough revenue to pay its expenses.
CHECK ■ YOUR UNDERSTANDINGIf the company sells 2,900 widgets, is Wally’s Widget World operating above or below the breakeven point? What is the difference between revenue and expense?
EXAMPLE 5
Find the solution to Example 4 algebraically.
SOLUTION To fi nd the breakeven point, set the revenue and expense equations equal to each other.
R = E
Substitute. 2.50q = 1.10q + 4,200
Subtract 1.10q from each side. 1.40q = 4,200
Divide each side by 1.40. 1.40q
______ 1.40
= 4,200
______ 1.40
q = 3,000
The breakeven point occurs when the quantity produced, q, equals 3,000.
CHECK ■ YOUR UNDERSTANDINGFind the breakeven point for the expense function, E = 5.00q + 60,000, and the revenue function, R = 7.00q.
dolla
rs
q
Revenue
7,500Expense
3,000
CHECK YOUR UNDERSTANDINGAnswer Wally’s Widget
World is operating below
the breakeven point;
expenses cost $140 more
than what is made in
revenue.
For more practice, try other
examples using other quan-
tities.
EXAMPLE 5You can give other exam-
ples of simultaneous linear
equations and have the
students solve them graphi-
cally and algebraically, as
review.
CHECK YOUR UNDERSTANDINGAnswer (30,000, 210,000)
Remind students that the
dollar sign should not be
included in the ordered
pair. They should properly
label the axes on their
graphs to understand the
y- coordinate represents a
dollar amount.
49657_02_ch02_p062-113.indd 8349657_02_ch02_p062-113.indd 83 5/29/10 3:18:06 PM5/29/10 3:18:06 PM

1. Interpret the quote according to what you have learned in this chapter.
2. The Gidget Widget Corporation produces widgets. The fi xed expenses are $65,210, and the variable expenses are $4.22 per wid-get. Express the expense function algebraically.
3. A corporation produces mini-widgets. The variable expenses are $1.24 per mini-widget, and the fi xed expenses are $142,900.a. How much does it cost to produce 1 mini-widget? b. How much does it cost to produce 20,000 mini-widgets? c. Express the expense function algebraically. d. What is the slope of the expense function? e. If the slope is interpreted as a rate, give the units that would be
used.
4. The expense function for the Wonder Widget is E = 4.14q + 55,789.a. What is the fi xed cost in the expense function? b. What is the cost of producing 500 Wonder Widgets? c. What is the average cost per widget of producing 500 Wonder
Widgets? Round to the nearest cent. d. What is the total cost of producing 600 Wonder Widgets? e. What is the average cost per widget of producing 600 Wonder
Widgets? Round to the nearest cent. f. As the number of widgets increased from 500 to 600, did the
average expense per widget increase or decrease? g. What is the average cost per widget of producing 10,000 Wonder
Widgets? Round to the nearest cent.
5. The Royal Ranch Pool Supply Corporation manufactures chlorine test kits. The kits have an expense equation of E = 5.15q + 23,500. What is the average cost per kit of producing 3,000 test kits? Round to the nearest cent.
6. The fi xed costs of producing a Wild Widget are $34,000. The variable costs are $5.00 per widget. What is the average cost per widget of producing 7,000 Wild Widgets? Round to the nearest cent.
7. Wanda’s Widgets used market surveys and linear regression to develop a demand function based on the wholesale price. The demand function is q = –140p + 9,000. The expense function is E = 2.00q + 16,000.a. Express the expense function in terms of p. b. At a price of $10.00, how many widgets are demanded? c. How much does it cost to produce the number of widgets from
part b?
An economist is an expert who will know tomorrow why the things he predicted yesterday didn’t happen today.
Laurence J. Peter, Professor
Applications
84 Chapter 2 Modeling a Business
TEACHUnits in AnswersPoint out to students that
correlation coeffi cients have
no units. Always require
them to give answers,
especially answers that are
slopes, with the units. The
more they hear it, read it,
and say it, the more com-
fortable they will be with
using the units. In science
classes, they are encour-
aged/required to give units
in answers.
ANSWERS1. Many variables are
considered when mak-
ing business decisions.
Although economists use
math models to try to
predict what will happen,
a change in any variable
can cause a change in
the expected result.
See margin.
E = 4.22q + 65,210
$142,901.24
$167,700
E = 1.24q + 142,900
1.24
dollars per mini-widget
$55,789
$57,859
$115.72
$58,273
$97.12
decrease
$9.72
$12.98
$9.86
E = –280p + 34,000
7,600
$31,200
49657_02_ch02_p062-113.indd 8449657_02_ch02_p062-113.indd 84 5/29/10 3:18:08 PM5/29/10 3:18:08 PM

2-4 Fixed and Variable Expenses 85
8. Wind Up Corporation manufactures widgets. The monthly expense equation is E = 3.20q + 56,000. They plan to sell the widgets to retailers at a wholesale price of $6.00 each. How many widgets must be sold to reach the breakeven point?
9. The Lerneg Corporation computed its monthly expense equation as E = 11.00q + 76,000. Its products will be sold to retailers at a whole-sale price of $20.00 each. How many items must be sold to reach the breakeven point? Round to the nearest integer.
10. Solve Exercise 9 using the graph intersection feature on your graphing calculator. Are the answers equivalent?
11. Variable costs of producing widgets account for the cost of gas required to deliver the widgets to retailers. A widget producer fi nds the average cost of gas per widget. The expense equation was recently adjusted from E = 4.55q + 69,000 to E = 4.98q + 69,000 in response to the increase in gas prices.a. Find the increase in the average cost per widget. b. If the widgets are sold to retailers for $8.00 each, fi nd the
breakeven point prior to the adjustment in the expense function.
c. After the gas increase, the company raised its wholesale cost from $8 to $8.50. Find the breakeven point after the adjustment in the expense function. Round to the nearest integer.
12. Examine the graph of expense and revenue.a. What is the breakeven point? b. If quantity C is sold and C < A, is there
a profi t or a loss? Explain. c. If quantity D is sold and D > A, is there
a profi t or a loss? Explain. d. The y-intercept of the expense function
is Z. Interpret what the company is doing if it operates at the point (0, Z).
13. Billy invented an innovative baseball batting glove he named the Nokee and made his own TV infomercial to sell it. The expense function for the Nokee is E = 6.21q + 125,000. The Nokee sells for $19.95.a. Represent the average expense A for one Nokee algebraically. b. Set your calculator viewing window to show x-values between
0 and 1,000, and y-values from 0 to 2,000. Let x represent q and let y represent A. Graph the average expense function.
c. Is the average expense function linear? d. Is the average expense function increasing or decreasing as
q increases? e. If only one Nokee is produced, what is the average cost per
Nokee to the nearest cent? f. If 100,000 Nokees are produced, what is the average cost per
Nokee to the nearest cent?
14. Lorne has determined the fi xed cost of producing his new invention is N dollars. The variable cost is $10.75 per item. What is the average cost per item of producing W items?
dolla
rs
WZ
qA
R
E
20,000
$0.43
(20,000, 160,000)
(19,602, 166,618)
8,444.
Yes; see margin.
See margin.
$125,006.21
$7.46
TEACHDomains and Breakeven Points Constantly remind students
what the domains before
and after the breakeven
points depict. For visual
learners, this is crucial, and
for non-visual learners, it
may be diffi cult.
ANSWERS10.
12b. There is a loss because
expenses are greater
than revenue at any
quantity less than A.
12c. There is a profi t
because revenue is
greater than expenses
at any quantity greater
than A.
12d. If no items are sold,
the company still has
to pay Z dollars for the
fi xed expenses.
13a. 6.21q + 125.000
_______________ q
13b.
X=8444.4444 Y=168888.89Intersection
(A, W )
See margin.
See margin.
See margin.
See margin.
no
decreasing
10.75W + N
___ W
49657_02_ch02_p062-113.indd 8549657_02_ch02_p062-113.indd 85 5/29/10 3:18:11 PM5/29/10 3:18:11 PM

How can expense and revenue be graphed?The total expense for the production of a certain item is the amount of money it costs to manufacture and place it on the market. One contribu-tor to consumer demand is the price at which an item is sold. Expense relies on the quantity produced and demand relies on price, so the expense function can be written in terms of price.
Recall that revenue is the total amount a company collects from the sale of a product or service. Revenue depends on the demand for a product, which is a function of the price of the product. The relationship between price, demand, expense, and revenue can be better understood when the functions are graphed on a coordinate plane.
Both the demand and expense functions are linear. However, as you will see, revenue is a nonlinear function when it is expressed in terms of price. That is, the graph of the revenue function is not a straight line. The revenue function has a variable raised to an exponent of 2, so it is a second-degree equation and is known as a quadratic equation. A quadratic equation can be written in the form
y = ax2 + bx + c where a, b, and c are real numbers and a ≠ 0
The graph of a qua-dratic equation is called a parabola. In the revenue graph pictured, the horizon-tal axis represents the price of an item, and the vertical axis represents the revenue. If the leading coeffi cient, a, is positive, then the parabola opens upward.
leading coeffi cient• maximum value• vertex of a parabola• axis of symmetry•
Key Termsnonlinear function• second-degree equation• quadratic equation• parabola•
ObjectivesWrite, graph, •
and interpret the
expense function.
Write, graph, •
and interpret the
revenue function.
Identify the points •
of intersection of
the expense and
revenue functions.
Identify breakeven •
points, and
explain them in
the context of the
problem.
Graphs of Expense
and Revenue Functions
2-5
Parabola with a Positive Leading Coefficient
86 Chapter 2 Modeling a Business
Money often costs too much.Ralph Waldo Emerson, Poet
EXAMINE THE QUESTIONA picture is worth 1,000 words.
The graphs of expense and
revenue equations yield picto-
rial insight into how expense
and revenue interact.
CLASS DISCUSSIONHow does price contribute
to consumer demand?
Name some other factors
that might also play a role
in the quantity of a product
consumers purchase.
Why does a non-vertical
line have slope but a non-
linear function does not?
Students often confuse –ax 2
with (–ax)2. Highlight the
difference and explain how
the absence of parentheses
changes the result.
49657_02_ch02_p062-113.indd 8649657_02_ch02_p062-113.indd 86 5/29/10 3:18:13 PM5/29/10 3:18:13 PM

2-5 Graphs of Expense and Revenue Functions 87
If the leading coeffi cient is negative, then the parabola opens downward. The downward parabola models the revenue function. In the graph, the parabola reaches a maximum value at its peak. This point is the vertex of the parabola and yields the price at which revenue can be maximized.
The axis of symmetry is a vertical line that can be drawn through the vertex of the parabola so that the dissected parts of the parabola are mirror images of each other. The point on the horizontal axis through which the axis of symme-
try passes is determined by calculating – b ___ 2a
.
Parabola with a Negative Leading Coefficient
Maximum
Axis of symmetry
Skills and Strategies
The graphical relationship between revenue and expense reveals much information helpful to a business.
EXAMPLE 1
A particular item in the Picasso Paints product line costs $7.00 each to manufacture. The fi xed costs are $28,000. The demand function is q = –500p + 30,000 where q is the quantity the public will buy given the price, p. Graph the expense function in terms of price on the coordinate plane.
SOLUTION The expense function is E = 7.00q + 28,000. Substitute for q to fi nd the expense function in terms of price.
Expense function. E = 7.00q + 28,000
Substitute. E = 7.00(–500p + 30,000) + 28,000
Use the Distributive property. E = –3,500p + 210,000 + 28,000
Simplify. E = –3,500p + 238,000
The horizontal axis represents price, and the vertical axis represents expense. Both variables must be greater than 0, so the graph is in the fi rst quadrant.
To determine a viewing window, fi nd the points where the expense function intersects the vertical and horizontal axes. Neither p nor E can be 0 because both a price of 0 and an expense of 0 would be mean-ingless in this situation. But, you can use p = 0 and E = 0 to determine an appropriate viewing window.
To fi nd the vertical axis intercept, let p = 0 and solve for E.
E = –3,500p + 238,000Let p = 0. E = –3,500(0) + 238,000
E = 238,000
To fi nd the horizontal axis intercept, let E = 0 and solve for p.
Let E = 0. 0 = –3,500p + 238,000 3,500p = 238,000 p = 68
TEACHReview a parabola and
its related equation. Have
students identify what is
different in this equation
from linear equations.
Discuss how the leading
coeffi cient, in this case the
coeffi cient on the x 2 term,
determines if the parabola
opens upward or down-
ward. Relate this concept
to the leading coeffi cient
of a linear equation, which
is the coeffi cient on the x
term and determines if the
lines go up and to the right
or down and to the right.
In other words, the leading
coeffi cient determines if the
line has a positive slope or
a negative slope.
EXAMPLE 1It is very important that
students understand the
concept of writing a func-
tion in terms of a stated
variable. In Example 1,
they must fi rst construct an
expense function in terms
of the variable q. Then, they
must use the given demand
function and substitute the
expression for q so that the
expense function is now in
terms of the price p. This skill
will be needed throughout
the chapter.
49657_02_ch02_p062-113.indd 8749657_02_ch02_p062-113.indd 87 5/29/10 3:18:16 PM5/29/10 3:18:16 PM
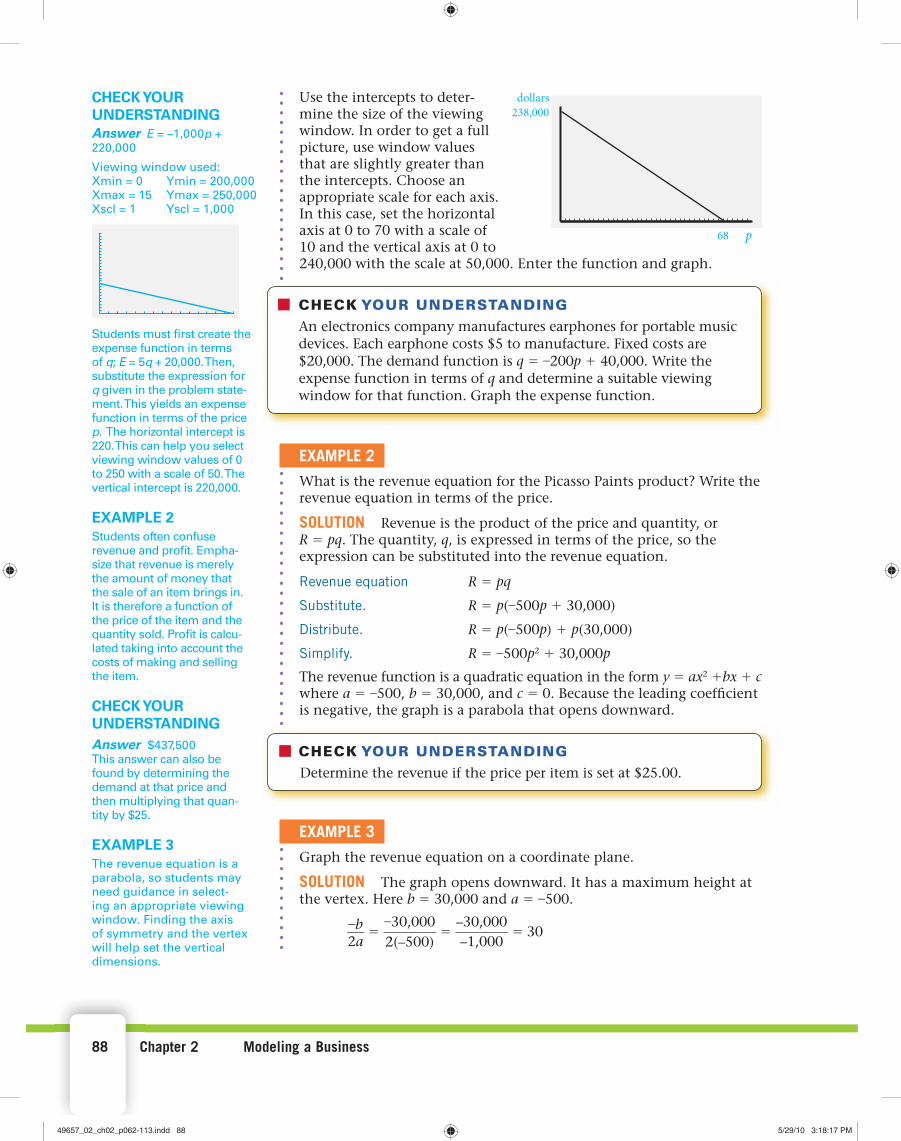
88 Chapter 2 Modeling a Business
Use the intercepts to deter-mine the size of the viewing window. In order to get a full picture, use window values that are slightly greater than the intercepts. Choose an appropriate scale for each axis. In this case, set the horizontal axis at 0 to 70 with a scale of 10 and the vertical axis at 0 to 240,000 with the scale at 50,000. Enter the function and graph.
CHECK ■ YOUR UNDERSTANDINGAn electronics company manufactures earphones for portable music devices. Each earphone costs $5 to manufacture. Fixed costs are $20,000. The demand function is q = –200p + 40,000. Write the expense function in terms of q and determine a suitable viewing window for that function. Graph the expense function.
EXAMPLE 2
What is the revenue equation for the Picasso Paints product? Write the revenue equation in terms of the price.
SOLUTION Revenue is the product of the price and quantity, or R = pq. The quantity, q, is expressed in terms of the price, so the expression can be substituted into the revenue equation.
Revenue equation R = pq
Substitute. R = p(–500p + 30,000)
Distribute. R = p(–500p) + p(30,000)
Simplify. R = –500p2 + 30,000p
The revenue function is a quadratic equation in the form y = ax2 +bx + c where a = –500, b = 30,000, and c = 0. Because the leading coeffi cient is negative, the graph is a parabola that opens downward.
CHECK ■ YOUR UNDERSTANDINGDetermine the revenue if the price per item is set at $25.00.
EXAMPLE 3
Graph the revenue equation on a coordinate plane.
SOLUTION The graph opens downward. It has a maximum height at the vertex. Here b = 30,000 and a = –500.
–b ___ 2a
= –30,000
________ 2(–500)
= –30,000
________ –1,000
= 30
p68
238,000dollarsCHECK YOUR
UNDERSTANDINGAnswer E = –1,000p +
220,000
Viewing window used:
Xmin = 0 Ymin = 200,000
Xmax = 15 Ymax = 250,000
Xscl = 1 Yscl = 1,000
Students must fi rst create the
expense function in terms
of q; E = 5q + 20,000. Then,
substitute the expression for
q given in the problem state-
ment. This yields an expense
function in terms of the price
p. The horizontal intercept is
220. This can help you select
viewing window values of 0
to 250 with a scale of 50. The
vertical intercept is 220,000.
EXAMPLE 2Students often confuse
revenue and profi t. Empha-
size that revenue is merely
the amount of money that
the sale of an item brings in.
It is therefore a function of
the price of the item and the
quantity sold. Profi t is calcu-
lated taking into account the
costs of making and selling
the item.
CHECK YOUR UNDERSTANDINGAnswer $437,500
This answer can also be
found by determining the
demand at that price and
then multiplying that quan-
tity by $25.
EXAMPLE 3The revenue equation is a
parabola, so students may
need guidance in select-
ing an appropriate viewing
window. Finding the axis
of symmetry and the vertex
will help set the vertical
dimensions.
49657_02_ch02_p062-113.indd 8849657_02_ch02_p062-113.indd 88 5/29/10 3:18:17 PM5/29/10 3:18:17 PM

2-5 Graphs of Expense and Revenue Functions 89
The axis of symmetry passes through 30 on the horizontal axis. To determine the height of the parabola at 30, evaluate the parabola when p = 30.
Revenue equation R = –500p2 + 30,000p
Substitute 30 for p. R = –500(30)2 + 30,000(30)
Simplify. R = 450,000
When the price is set at $30, the maximum revenue is $450,000. The vertical axis must be as high as the maximum value. For the viewing window, use a number slightly greater than the maximum value, such as 500,000, so you can get the entire picture of the graph. Use the same horizontal values on the axis as used for the expense function.
CHECK ■ YOUR UNDERSTANDINGUse the graph in Example 3. Which price would yield the higher revenue, $28 or $40?
EXAMPLE 4
The revenue and expense functions are graphed on the same set of axes. The points of intersection are labeled A and B. Explain what is happening at those two points.
SOLUTION Where the revenue and the expense functions intersect, revenue and expenses are equal. These are breakeven points. Notice there are two such points.
Before intersection point A, the expenses are greater than the revenue. The fi rst breakeven price is approximately at $8.08. The second is approximately at $58.92. From point A to point B, the revenue is greater than the expenses. To the right of point B, the expenses again are greater than the revenue.
p
A
B
dolla
rs
8.08 58.92
© I
OFO
TO
20
09/U
SE
D U
ND
ER
LIC
EN
SE
FR
OM
SH
UT
TE
RS
TO
CK
.CO
M
p
dolla
rs maximum
CHECK ■ YOUR UNDERSTANDINGWhy is using the prices of $7.50 and $61.00 not in the best interest of the company?
CHECK YOUR UNDERSTANDINGAnswer Because $28 is
closer to $30 than $40, it
will yield a higher point on
the parabola.
Students could test this
statement by substitution
but should be encouraged to
think through the question
before doing so. The very
structure of a downward
parabola yields a higher
y-value as x approaches the
axis of symmetry.
EXAMPLE 4A and B are points of
intersection. Ask students
what is true about the
y-value in each of the func-
tions when evaluated at the
x-values of points A and B.
Once equality is establish,
discuss what it means for
the y-values to be the same
for both functions at the
points of intersection in
the context of expense and
revenue.
CHECK YOUR UNDERSTANDINGAnswer At both prices,
revenue is less than
expenses. The price of $7.50
is too low for the incom-
ing revenue to make up
for the outgoing expenses.
The price of $61 may be
too high for consumers
and would decrease the
demand for the product.
Therefore, with fewer items
being sold, the revenue will
be less.
49657_02_ch02_p062-113.indd Sec12:8949657_02_ch02_p062-113.indd Sec12:89 5/29/10 3:18:19 PM5/29/10 3:18:19 PM

90 Chapter 2 Modeling a Business
1. How might the quote apply to what you have learned?
2. Rich and Betsy Cuik started a small business. They manufacture a microwavable coffee-to-go cup called Cuik Cuppa Coffee. It contains spring water and ground coffee beans in a tea-bag-like pouch. Each cup costs the company $1.00 to manufacture. The fi xed costs for this product line are $1,500. Rich and Betsy have determined the demand function to be q = –1,000p + 8,500, where p is the price for each cup.a. Write the expense equation in terms of the demand, q. b. Express the expense equation found in part a in terms of the
price, p. c. Determine a viewing window on a graphing calculator for the
expense function. Justify your answer. d. Draw and label the graph of the expense function. e. Write the revenue function in terms of the price. f. Graph the revenue function in a suitable viewing window. What
price will yield the maximum revenue? What is the revenue at that price? Round both answers to the nearest cent.
g. Graph the revenue and expense functions on the same coordinate plane. Identify the points of intersection using a graphing calcula-tor. Round your answers to the nearest cent. Identify the price at the breakeven points.
3. Orange-U-Happy is an orange-scented cleaning product that is manu-factured in disposable cloth pads. Each box of 100 pads costs $5 to man-ufacture. The fi xed costs for Orange-U-Happy are $40,000. The research development group of the company has determined the demand func-tion to be q = –500p + 20,000, where p is the price for each box.a. Write the expense equation in terms of the demand, q. b. Express the expense function in terms of the price, p. c. Determine a viewing window on a graphing calculator for the
expense function. Justify your answer. d. Draw and label the graph of the expense function. e. Write the revenue function in terms of the price. f. Graph the revenue function in a suitable viewing window. What
price will yield the maximum revenue? What is the revenue at that price? Round answers to the nearest cent.
g. Graph the revenue and expense functions on the same coordi-nate plane. Identify the points of intersection using a graphing calculator, and name the breakeven points. Round to the nearest cent. Identify the price at the breakeven points.
Money often costs too much.Ralph Waldo Emerson, Poet
Applications
TEACHExercises 2 and 3 Students are introduced
to a new product in each
and given information
necessary for creating
an expense function. The
independent variable for
the expense function will
be the quantity, q. Parts a–g
of each question guide the
students through the steps
to graph the functions.
ANSWERS1. Emerson cautions to be
aware of the fact that the
expenses involved in mak-
ing revenue are often more
than the revenue itself.
2c. The intercepts are
(0, 10,000) and (10, 0),
so the viewing window
can be set from 0 to 12
with a scale of 1 for the
horizontal axis and
0 to 12,000 for the
vertical axis with a
scale of 100.
2f. The maximum revenue
of $18,062.50 is achieved
when the price is $4.25;
see additional answers
for graph.
2g. (1.21, 8,794.36) and
(8.29, 1,705.64); $1.21
and $8.29; see additional
answers for graph.
3c. The intercepts are
(0, 140,000) and (56, 0),
so the viewing window
can be set from 0 to 60 for
the horizontal axis with a
scale of 5 and 0 to 150,000
for the vertical axis with a
scale of 10,000.
3f. The maximum revenue
of $200,000 is achieved
when the price is set at
$20.00; see additional
answers for graph.
See margin.
E = 1.00q + 1,500
E = –1,000p + 10,000
See additional answers.
R = –1,000p2 + 8,500p
See margin.
See margin.
See additional answers.
R = –500p2 + 20,000p
See margin.
See margin.
E = 5q + 40,000
E = –2,500p + 140,000
See margin.
(7.46, 121,354.02) and
(37.54, 46,145.98)/$7.46 and $37.54; see additional answers for graph.
49657_02_ch02_p062-113.indd Sec12:9049657_02_ch02_p062-113.indd Sec12:90 5/29/10 3:18:26 PM5/29/10 3:18:26 PM

2-6 Breakeven Analysis 91
What happens when revenue equals expense?When the revenue function is a quadratic equation, you can determine the values at which the expense and revenue functions are equal. Graph the revenue and expense func-tions on the same coordinate plane.
The functions intersect at the values at which the expense and revenue functions are equal (blue points), or the breakeven points. The difference between expense and revenue equals zero, which is a zero net difference.
Notice that the prices on the revenue function between the breakeven points result in revenue greater than expense. Prices beyond the breakeven points result in revenue less than expense. Decision makers must examine the breakeven points carefully to set appropriate prices to yield maximum revenue.
Breakeven points may be found algebraically or by using a graphing calculator. To fi nd breakeven points algebraically, set the expense and revenue functions equal to each other. Rewrite the resulting equation with 0 on one side of the equal sign and all the remaining terms on the other side.
This gives a quadratic equation in the form ax2 + bx + c = 0, where a ≠ 0. The quadratic formula can then be used to solve this quadratic equation. The quadratic formula is
x = –b ± √_______
b 2 – 4ac _____________ 2a
where ± (read plus or minus) indicates the two solutions
x = –b + √________
b 2 – 4ac ______________ 2a
and
x = –b – √________
b 2 – 4ac _____________ 2a
Key Termszero net difference• quadratic formula•
ObjectivesDetermine the •
breakeven prices
and amounts
using technology
or algebra.
500,000
100
price
dollars
0
Breakeven points
Revenue less than expenses
Revenue greater than expenses
Breakeven Analysis 2-6
Risk comes from not knowing what you’re doing.Warren Buffet, Businessman
EXAMINE THE QUESTIONThis lesson examines what
happens at the intersection
of those functions. It might
be helpful if you ask “What
is true about the intersec-
tion of a street and an
avenue?” Elicit responses
that refer to the fact that the
pavement at the intersec-
tion is shared by both the
street and the avenue. Use
this as a springboard for the
discussion about intersec-
tion on graphs.
49657_02_ch02_p062-113.indd Sec13:9149657_02_ch02_p062-113.indd Sec13:91 5/29/10 3:18:29 PM5/29/10 3:18:29 PM

92 Chapter 2 Modeling a Business
Breakeven analysis can be used to make product price-setting decisions. Calculation and interpretation must be done during breakeven analysis.
EXAMPLE 1
Determine the prices at the breakeven points for the Picasso Paints product in Lesson 2-5. The expense function is E = –3,500p + 238,000, and the revenue function is R = –500p2 + 30,000p.
SOLUTION The breakeven point occurs when the expense and revenue functions intersect. There are two ways to determine the breakeven point—using technology or algebra.
If a graphing calculator is used, let x represent the price, and express the equations in terms of x. Enter each function into the calculator, and graph them both using a suitable viewing window. Find the intersection points.
Because the calculator will display answers to many decimal places, round the intersection points to the nearest cent. The fi gures below show two graphing calculator screens after the Intersect feature has been used.
Shown below on the left is the leftmost breakeven point; the price is at $8.08.
On the right is the rightmost breakeven point; the price is $58.92.
The breakeven point can also be found algebraically. Set the expense and revenue functions equal to each other. Rewrite the resulting equation with 0 on one side and all the remaining terms on the other side. The quadratic equation is usually written with the leading coeffi cient positive.
E = R
Set the expressions equal. –3,500p + 238,000 = –500p 2 + 30,000p
Rewrite to set equal to 0. +500p2 – 30,000p = +500p2 – 30,000p
500p2 – 33,500p + 238,000 = 0
In the quadratic equation 500p2 – 33,500p + 238,000 = 0, a = 500, b = –33,500, and c = 238,000. Because the equation is written in terms of p, use p instead of x in the quadratic formula. Substitute values for a, b, and c, and calculate.
Skills and Strategies
X=58.921448 Y=31774.933Intersection
X=8.0785524 Y=209725.07Intersection
CLASS DISCUSSIONWhy wouldn’t a company
set the price of an item at
the breakeven point price?
Are there always two
breakeven points? Could
there be a situation where
there are more than two?
Less than two?
Ask students to describe
situations where a graph
might also be a quadratic.
What are you fi nding when
you solve a quadratic
equation?
TEACHUse the labeled graph
from page 91 to be certain
students can interpret these
graphs when they create
them in this lesson.
If your students do not
remember the quadratic
formula and want to know
where it comes from, show
the process of fi nding solu-
tions by completing the
square for the equation
y = ax 2 + bx + c.
EXAMPLE 1Make sure that students
are comfortable with both
methods of fi nding the
breakeven points. Discuss
the role that rounding
plays in creating a pos-
sible discrepancy in the
vertical axis values at the
breakeven points. Some
students might fi nd the
quadratic formula more
accessible if it is stated as
x = − b ___ 2a
±
√________
b 2 − 4ac _________
2a . Here,
students can see that the
same amount is added to
and subtracted from the
axis of symmetry x-value,
yielding roots that are sym-
metrical with respect to the
axis of symmetry.
49657_02_ch02_p062-113.indd Sec13:9249657_02_ch02_p062-113.indd Sec13:92 5/29/10 3:18:33 PM5/29/10 3:18:33 PM

2-6 Breakeven Analysis 93
Quadratic formula x = –b ± √________
b 2 – 4ac ______________ 2a
Use + in the formula.
p = –(–33,500) + √
___________________________ (–33,500) 2 – 4(500)(238,000) _________________________________________
2(500) ≈ 58.92
Use – in the formula.
p = –(–33,500) – √
___________________________ (–33,500) 2 – 4(500)(238,000) ________________________________________
2(500) ≈ 8.08
The prices at the breakeven points are $8.08 and $58.92.
CHECK ■ YOUR UNDERSTANDINGThe expense function for a particular product is E = –2,000p + 125,000. The revenue function for that product is R = –600p2 + 18,000p. Determine the prices at the breakeven points for this product both algebraically and graphically.
EXTEND ■ YOUR UNDERSTANDINGKnowing that the two breakeven prices have been rounded to the nearest cent, what would you expect when each is substituted into the expense and revenue equations?
EXAMPLE 2
Determine the revenue and expense for the Picasso Paints product at the breakeven points found in Example 1.
SOLUTION The y-value of the breakeven point will be both the rev-enue and expense values. These values can be determined by substitut-ing the values of p into the expense and revenue equations.
Substitute 8.08 for p. E = –3,500(8.08) + 238,000 = 209,720
R = –500(8.08)2 + 30,000(8.08) = 209,756.80
Substitute 58.92 for p. E = –3,500(58.92) + 238,000 = 31,780
R = –500(58.92)2 + 30,000(58.92) = 31,816.80
When the breakeven price is approximately $8.08, the expense and revenue values are each close to $209,750.
When the breakeven price is approximately $58.92, the expense and revenue values are each approximately $31,800.
Because of rounding, the expense and revenue are not equivalent. They are, however, approximately equal.
CHECK ■ YOUR UNDERSTANDINGHow could you have improved on the error when calculating the expense and revenue values?
CHECK YOUR UNDERSTANDINGAnswer The breakeven
prices using both the qua-
dratic formula method and
the graphing calculator are
$8.33 and $25. The former
has been rounded to two
decimal places.
EXTEND YOUR UNDERSTANDINGAnswer The actual
breakeven values have
non-terminating decimal
parts, so using the rounded
values will not yield exact
expense and revenue
values. The expense and
revenue values are approxi-
mately equal when
p = 8.08 and p = 58.92.
EXAMPLE 2Example 2 follows from the
discussion in Extend Your
Understanding. Notice that
the expense and revenue
values are approximately
equal due to rounding.
CHECK YOUR UNDERSTANDINGAnswer The error could
have been improved by
using more accurate prices
with more decimal places in
the calculation. But, for this
purpose, it is acceptable to
round to the nearest cent.
49657_02_ch02_p062-113.indd Sec13:9349657_02_ch02_p062-113.indd Sec13:93 5/29/10 3:18:34 PM5/29/10 3:18:34 PM

94 Chapter 2 Modeling a Business
EXAMPLE 3
Use a spreadsheet to determine the breakeven price for the Picasso Paints product.
SOLUTION Develop general expense and revenue equations so the spreadsheet can calculate the breakeven prices regardless of the situations. The expense function is E = Vp + F, where p equals price, V equals vari-able costs, and F equals fi xed costs. The revenue function is R = Ap2 + Bp where p equals price and A and B are values specifi c to the particular situ-ation. Set the expense equation equal to the revenue equation.
E = RSubtract Vp + F from both sides. Vp + F = Ap2 + Bp –Vp – F = –Vp – F 0 = Ap2 + Bp – Vp – FCombine like terms. 0 = Ap2 + ( B – V ) p – F
This is a quadratic equation where a = A, b = (B – V), and c = –F. Depend-ing on the spreadsheet software, cell formulas may vary. The Picasso Paints functions are E = –3,500p + 238,000 and R = –500p2 + 30,000.
The values of V and F from the expense function are entered into cells B3 and B4. The values of A and B from the revenue function are entered into cells B7 and B8. Cells B15 and B16 are the breakeven prices calculated using the quadratic formula.
For B15 the formula is =(–B12+SQRT(B12ˆ2–4*B11*B13))/(2*B11). For B16 the formula is =(–B12–SQRT(B12ˆ2–4*B11*B13))/(2*B11).
A B
1 Breakeven Calculator
2 The expense equation has the form Vp + F. –3,500p + 238,000
3 Enter the value of V in cell B3. –3,500
4 Enter the value of F in cell B4. 238,000
5
6 The revenue equation has the form Ap 2 + Bp. –500p 2 + 30,000p
7 Enter the value of A in cell B7. –500
8 Enter the value of B in cell B8. 30,000
910 Solve the quadratic equation. –500p 2 + 33,500p +
–238,000
11 where a = –500
12 b = 33,500
13 c = –238,000
1415 The price at the fi rst breakeven point is $8.08
16 The price at the second breakeven point is $58.92
CHECK ■ YOUR UNDERSTANDINGWhat cell formulas were used to identify the a, b, and c values shown in B11, B12, and B13?
EXAMPLE 3Carefully walk the students
through the solution as
stated here. Without a
good understanding of the
algebraic manipulations,
students will not be able
to create the spreadsheet
formulas. Impress upon
students that there are
other acceptable correct
solutions in spreadsheet
form that will yield the
same result.
CHECK YOUR UNDERSTANDINGAnswer Because the value
in B11 is the same as the
value in B7, the formula in
B11 is =B7. The value in B12
is the difference between
B and V. Therefore, the for-
mula in B12 is =(B8–B3). The
value in B13 is the negative
value in B4. The formula in
B13 is =–B4.
If you want to stress to stu-
dents that they are taking
the opposite of the value
in B4, you can have them
write the formula for B13
as =–1*B4.
49657_02_ch02_p062-113.indd Sec13:9449657_02_ch02_p062-113.indd Sec13:94 5/29/10 3:18:36 PM5/29/10 3:18:36 PM

2-6 Breakeven Analysis 95
1. How might the quote apply to what you have learned?
2. A manufacturer has determined that the combined fi xed and variable expenses for the production and sale of 500,000 items are $10,000,000. What is the price at the breakeven point for this item?
3. A supplier of school kits has determined that the combined fi xed and variable expenses to market and sell G kits is W. a. What expression models the price of a school kit at the
breakeven point? b. Suppose a new marketing manager joined the company and
determined that the combined fi xed and variable expenses would only be 80% of the cost if the supplier sold twice as many kits. Write an expression for the price of a kit at the breakeven point using the new marketing manager’s business model.
4. A jewelry manufacturer has determined the expense equation for necklaces to be E = 1,250q + 800,000, where q is the quantity demanded. At a particular price, the breakeven revenue is $2,600,000. a. What is the quantity demanded at the breakeven point? b. If the breakeven revenue changes to 3.5 million, will the quan-
tity demanded have increased or decreased? Explain.
5. A manufacturer determines that a product will reach the breakeven point if sold at either $80 or $150. At $80, the expense and revenue values are both $300,000. At $150, the expense and revenue values are both $100,000.
On graph paper, graph possible revenue and expense functions that depict this situation. Circle the breakeven points.
6. iSports is considering producing a line of baseball caps with wire-less cellphone earpieces attached. The breakeven point occurs when the price of a cap is $170 or $350. At $170, the expense and revenue values are both $2,600,000. At $350, the expense and revenue values are both $900,000. On graph paper, graph possible revenue and expense functions that depict this situation. Circle the breakeven points.
7. SeaShade produces beach umbrellas. The expense function is E = –19,000p + 6,300,000 and the revenue function is R = –1,000p2 + 155,000p. a. Graph the expense and revenue functions. Label the maximum
and minimum values for each axis. Circle the breakeven points.b. Determine the prices at the breakeven points. c. Determine the revenue and expense amounts for each of the
breakeven points.
Risk comes from not knowing what you’re doing.Warren Buffet, Businessman
Applications
See margin.
$20
TEACHExercises 2 and 3 These questions are related
and should be assigned
together. Exercise 2 offers
a purely numerical situa-
tion and Exercise 3 offers a
related algebraic situation.
Exercises 5 and 6 These questions offer
students numerical infor-
mation about the relation-
ship between revenue and
expense. They are asked to
use this data (rather than
equations) to sketch graphs.
ANSWERS1. Warren Buffet speaks to
the need to be knowl-
edgeable in order to
minimize or eliminate
risk. With the knowl-
edge of the prices and
subsequent revenue at
breakeven points, the
risk of putting a product
on the market can be
minimized.
4b. Increased; substitute
3,500,000 into the
expense equation.
When you solve for p,
the solution is 2,160,
which is greater than
1,440.
7b. $51.38 and $122.62
7c. When p = $51.38,
E = $5,323,780.00 and
R = $5,323,995.60.
When p = $122.62,
E = $3,970,220.00 and
R = $3,970,435.60.
G
___ W
2G _____
0.8W
1,440 necklaces
See additional answers.
See margin.
Answers vary.
Answers vary.
See margin.
See margin.
49657_02_ch02_p062-113.indd Sec13:9549657_02_ch02_p062-113.indd Sec13:95 5/29/10 3:18:37 PM5/29/10 3:18:37 PM

96 Chapter 2 Modeling a Business
8. Where-R-U produces global positioning systems (GPS) that can be used in a car. The expense equation is E = –5,000p + $8,300,000, and the revenue equation is R = –100p2 + 55,500p.a. Graph the expense and revenue functions. Circle the breakeven
points. b. Determine the prices at the breakeven points. Round to the near-
est cent. c. Determine the revenue and expense amounts for each of the
breakeven points. Round to the nearest cent.
9. The student government at State College is selling inexpensive bookcases for dorm rooms to raise money for school activities. The expense function is E = –200p + 10,000 and the revenue function is R = –18p2 + 800p.a. At what price would the maximum revenue be reached? What would
that maximum revenue be? Round to the nearest cent. b. Graph the expense and revenue functions. Circle the breakeven
points. c. Determine the prices at the breakeven points. Round to the near-
est cent. d. Determine the revenue and expense amounts for each of the
breakeven points. Round to the nearest cent.
10. An electronics store is selling car chargers for cell phones. The expense function is E = –300p + 13,000 and the revenue function is R = –32p2 + 1,200p.a. At what price would the maximum revenue be reached? b. What would that maximum revenue be? Round to the nearest
cent. c. Graph the expense and revenue functions. Circle the breakeven
points. d. Determine the prices at the breakeven points. Round to the near-
est cent. e. Determine the revenue and expense amounts for each of the
breakeven points. Round to the nearest cent.
Use the graph to answer Exercises 11–14.
11. At what price is the maximum profi t reached?
12. What are the breakeven prices?
13. Name two prices where the revenue is greater than the expenses.
14. Name two prices where the revenue is less than the expenses.
100,000
200
price
dollars
0
$210.27 and $394.73
See margin.
E = 7,384.00 and R = 7,384.44. When p = 42.48, E = 1,504.00 and R = 1,502.09.
$11,250
See additional answers.
See margin.
See additional answers.
$13.08 and $42.48
When p = 13.08,
When p = 11.48,E = 9,556.00 and R = 9,558.71. When p = 35.40, E = 2,380.00 and R = 2,378.88.
TEACHExercises 9 and 10 These questions are similar
in structure and intent.
Perhaps assign Exercise 9
to half the class and Exer-
cise 10 to the other half.
Have students from each
group present the solutions
to the other group.
ANSWERS8c. When p = $210.27,
E = $7,248,650.00 and
R = $7,248,637.71.
When p = $394.73,
E = $6,326,350.00 and
R = $6,326,337.71
9a. If the bookcase is set at
$22.22 then the maxi-
mum revenue would
be approximately
$8,888.89.
10c. When p = $11.48,
E = $9,556.00 and
R = $9,558.71.
When p = $35.40,
E = $2,380.00 and
R = $2,378.88. See
additional answers for
graph.
$11.48 and $35.40
$70,000
$40 and $80
Sample answers: $45 and $50
Sample answers: $35 and $150
See margin.
$18.75
49657_02_ch02_p062-113.indd Sec13:9649657_02_ch02_p062-113.indd Sec13:96 5/29/10 3:18:39 PM5/29/10 3:18:39 PM

2-7 The Profit Equation 97
How do revenue and expenses contribute to profit calculation?In the business world, two companies may produce and sell the same product. It is possible that both companies will have the same maximum revenue based on their individual revenue functions. However, other aspects of production may not be identical.
Revenue is the amount of money a company makes from the sale of goods or services. While the maximum revenue may be the same for each product, the revenue and expense equations may be different. Figure A displays the graph of the revenue function for the product. Figure B dis-plays the graph of the revenue function of a similar product produced by a different company. The graphs of the revenue functions yield the same maximum values but model different situations.
Figures C and D depict the same revenue functions but different expense functions. Figure C shows an expense function that is always greater than the revenue graph. Therefore, the company makes no money on the manufacture and sale of the product. The company can-not even reach a breakeven point because there are no breakeven points. In Figure D, the expense function is greater than the revenue function at certain prices, but there are also prices at which the opposite is true. A company would prefer Figure D to model the sale of its product because there are prices at which money coming in is greater than money spent. The money a company makes after expenses have been deducted from revenue is profi t. In Figure D, there are prices at which the company will make a profi t. In Figure C, no matter the price, the rev-enue is never enough to offset the expenses.
Key Termsprofi t • maximum profi t•
ObjectivesDetermine a profi t •
equation given
the expense
and revenue
equations.
Determine the •
maximum profi t
and the price
at which that
maximum is
attained.
The Profi t Equation 2-7
Figure A Figure B Figure C Figure D
500,000
70
price
dollars
0
500,000
70
price
dollars
070
0
500,000
price
dollars500,000
70
price
dollars
0
Nobody ever lost money taking a profi t.Bernard Baruch, Businessman
EXAMINE THE QUESTIONStudents have now explored
the algebraic and graphi-
cal relationships between
expense and revenue.
This chapter is about profi t
and what factors contribute
to profi t. Ask students for
their defi nition of profi t.
Then, ask them how rev-
enue and expense contrib-
ute to profi t. Their response
will pave the way for the
lesson and act as a fi rst-step
in answering the opening
question.
49657_02_ch02_p062-113.indd Sec13:9749657_02_ch02_p062-113.indd Sec13:97 5/29/10 3:18:40 PM5/29/10 3:18:40 PM

98 Chapter 2 Modeling a Business
Graphically, profi t is the vertical distance between the revenue and expense functions. In Figure E, the top of the vertical line segment (in purple) hits the revenue graph at $437,500 when the price is about $25.
The bottom of the vertical line segment hits the expense graph at $150,500 at the same price. The verti-cal length of this segment is 437,500 – 150,500 = 287,000 and is the profi t the company makes when the price is about $25.
P = R – E where P is profi t, R is revenue, and E is expenses
In Figure F, several profi t line segments have been drawn for different prices. The longest seg-ment would represent the great-est difference between revenue and expense at a given price. The greatest difference between revenue and expense denotes maximum profi t.
It is diffi cult to make a visual determination as to where the maximum profi t line might be drawn. Algebra and graphing must be used to make a more pre-cise determination.
500,000
70price
dollars
0
Figure E
500,000
70price
dollars
0
Figure F
© M
AR
CIN
BA
LC
ER
ZA
K 2
009/U
SE
D U
ND
ER
LIC
EN
SE
FR
OM
SH
UT
TE
RS
TO
CK
.CO
M
CLASS DISCUSSIONAsk students for the names
of different companies that
produce the same product.
Then, ask what aspects of
the production might not be
identical among the
companies.
Describe a graph and a situ-
ation in which there is only
one breakeven point. What
does it mean for production
and sales?
Have students examine the
graph. Ask them to iden-
tify three different prices
at which profi t would be a
small, medium, and large
amount (not necessarily the
maximum).
49657_02_ch02_p062-113.indd Sec13:9849657_02_ch02_p062-113.indd Sec13:98 5/29/10 3:18:44 PM5/29/10 3:18:44 PM

2-7 The Profit Equation 99
The revenue and expense functions are both functions of price, p, so, you can create a profi t function in terms of p.
EXAMPLE 1
Determine the profi t equation for the Picasso Paints product in Lesson 2-5. The revenue and expense functions were
R = –500p2 + 30,000pE = –3,500p + 238,000
SOLUTION Profi t is the difference between revenue and expense.
P = R – E
Substitute for R and E. P = –500p2 + 30,000p – (–3,500p + 238,000)
Distribute. P = –500p2 + 30,000p + 3,500p – 238,000
Combine like terms. P = –500p2 + 33,500p – 238,000
The profi t equation is P = –500p2 + 33,500p – 238,000. It is a down-ward parabola because the leading coeffi cient is negative.
CHECK ■ YOUR UNDERSTANDINGSuppose that the revenue and expense functions are R = –350p2 + 18,000p and E = –1,500p + 199,000. Write the profi t equation.
EXAMPLE 2
Use a graphing calculator to draw the graph of the profi t equation from Example 1. What is the maximum profi t?
SOLUTION Enter the profi t equation P = –500p2 +33,500p – 238,000 into a graphing calculator. Use the same viewing window you used for the graphs of the revenue and expense functions in Lesson 2-5. The maximum profi t is at the vertex of the parabola. Graphing calculators have a maximum feature that determines the value of the maximum point of a function. Let x represent the price, p. The maximum is 323,125 when x = 33.50.
CHECK ■ YOUR UNDERSTANDINGSketch the graph. Identify the points where zero profi t is made. Explain your reasoning.
Skills and Strategies
500,000
70
price
dollars
0
Maximum profit
TEACHBefore you begin Example 1,
choose a product that
students can relate to such
as cell phones. Name two
different companies that
manufacture cell phones and
have students describe the
differences in Figures A–D
on page 97 by relating them
to the cell phones and their
manufacturers.
EXAMPLE 1Perhaps the most com-
mon error students make
when generating the profi t
equation is the failure to
distribute the subtraction
over both terms in the
expense expression. Make
sure that you alert them to
the importance of this part
of the computation.
CHECK YOUR UNDERSTANDINGAnswer P = R – E
P = –350p2 + 19,500p –
199,000
EXAMPLE 2Replace the variable p with
x and P with Y.
CHECK YOUR UNDERSTANDINGAnswer The two points
where the profi t function
intercepts the horizontal axis
indicate item prices at which
no profi t is made. These
prices are $8.07 and $58.93.
49657_02_ch02_p062-113.indd Sec13:9949657_02_ch02_p062-113.indd Sec13:99 5/29/10 3:18:50 PM5/29/10 3:18:50 PM

100 Chapter 2 Modeling a Business
EXAMPLE 3
Graph the revenue, expense, and profi t functions on the same coordi-nate plane. Interpret the zero-profi t points, the maximum profi t, and how the functions relate to each other.
SOLUTION The maximum profi t is at the vertex of the profi t graph. The price at this point yields the greatest difference between the rev-enue and expense functions. There are two zero-profi t points on the graph of the profi t function. No profi t is made at the selling price where expense is equal to revenue. Visually, this is the price at which the revenue and expense functions intersect.
Expenses
Revenue
Profit
Zero profit
Maximum profit
CHECK ■ YOUR UNDERSTANDINGMust maximum profi t occur at the same price as the maximum revenue?
EXAMPLE 4
Algebraically, determine the price of the Picasso Paints product that yields the maximum profi t.
SOLUTION To determine the maximum profi t algebraically, recall that the maximum value occurs on the axis of symmetry. For the profi t function P = –500x2 + 33,500x – 238,000, a = –500, b = 33,500, and c = –238,000. The x- intercept of the axis of symmetry is determined
by calculating – b___2a
.
–b ___ 2a
= –33,500
________ 2 (–500)
= –33,500
________ –1,000
= 33.5
The axis of symmetry intercepts the horizontal axis at 33.5. To determine the height of the parabola at 33.5, evaluate the function when p = 33.5.
Quadratic equation P = –500p2 + 33,500p – 238,000
Substitute 33.5 for p. P = –500(33.5)2 + 33,500(33.5) – 238,000
Simplify. P = 323,125
At $33.50, a maximum profi t of $323,125 is attained.
CHECK ■ YOUR UNDERSTANDINGUse the profi t function from Example 1 Check Your Understanding. Determine the price to the nearest cent that yields the maximum profi t.
EXAMPLE 3Students should maintain
the same viewing win-
dow and all three graphs
should be pictured in this
window. Walk the students
through each of the points
mentioned in the problem
statement and ask them to
interpret the situation that
is modeled at those points.
CHECK YOUR UNDERSTANDINGAnswer No; the greatest
difference between rev-
enue and expense does not
depend on the maximum
revenue.
You might wish to use
a ruler to show that the
maximum revenue distance
and the maximum profi t
are more than likely not the
same.
EXAMPLE 4To solve this problem
algebraically, students need
to fi rst determine the profi t
quadratic and put it in stan-
dard form. Discuss where
the maximum of a parabola
always occurs (horizontal
value is the axis of sym-
metry). Then, lead them
through to the calculation
of that maximum point.
Although the question asks
for the price at which the
profi t is a maximum, the
solution shows students
how to use that price to
determine the maximum
profi t.
CHECK YOUR UNDERSTANDINGAnswer Using P = –350p2 +
19,500p – 199,000, a maxi-
mum profi t of $72,607.14 is
attained at a price of $27.86.
49657_02_ch02_p062-113.indd Sec13:10049657_02_ch02_p062-113.indd Sec13:100 5/29/10 3:18:51 PM5/29/10 3:18:51 PM

2-7 The Profit Equation 101
1. How might the quote apply to what has been outlined in this lesson?
Examine each of the graphs in Exercises 2–5. In each case, the blue graph represents the expense function and the black graph represents the revenue function. Describe the profi t situation in terms of the expense and revenue functions.
2. 3.
In Exercises 6–9, write the profi t function for the given expense and revenue functions.
6. E = –20,000p + 90,000R = –2,170p2 + 87,000p
7. E = –6,500p + 300,000 R = –720p2 + 19,000p
8. E = –2,500p + 80,000 R = –330p2 + 9,000p
9. E = –12,500p + 78,000 R = –1,450p2 + 55,000p
Nobody ever lost money taking a profi t.Bernard Baruch, Businessman
Applications
$100,000
100
price
dollars
0
$100,000
100
price
dollars
0
$100,000
100
price
dollars
0
$100,000
100
price
dollars
0
4. 5.
P = –2,170p2 + 107,000p – 90,000
P = –720p2 + 25,500p – 300,000
P = –330p2 + 11,500p – 80,000
P = –1,450p2 + 67,500p – 78,000
ANSWERS1. A person would lose
money when the
expense is greater than
the revenue. A true profi t
equation is found in the
fi rst quadrant and is
the difference between
the revenue and the
expense. If the expense is
greater than the revenue,
then there is no profi t.
Therefore, no one would
lose money if they take
(make) a profi t!
2. The expenses are
fi xed for this product.
Regardless of price, the
expenses are $500,000. A
profi t is made when the
price is set approximately
between $20 and $60.
3. This situation is similar
to that examined in Skills
and Strategies. Expenses
decrease as the price of
the item increases. Profi t
is made when the price
is set approximately
between $13 and $70.
4. The expenses are
greater than the revenue
at all possible prices. No
profi t can be made from
the sale of this item.
5. This situation is similar
to that examined in Skills
and Strategies. Expenses
decrease as the price of
the item increases. Profi t
is made when the price
is set approximately
between $7 and $18.
See margin.
See margin.
49657_02_ch02_p062-113.indd Sec13:10149657_02_ch02_p062-113.indd Sec13:101 5/29/10 3:18:53 PM5/29/10 3:18:53 PM

102 Chapter 2 Modeling a Business
800,000
50price
dollars
0
10. Examine the revenue (black) and expense (blue) func-tions. Estimate the price at the maximum profi t. Explain your reasoning.
11. The expense and revenue func-tions yield a profi t function, but the equation can represent no profi t made for any price. One of the profi t functions in Exercises 6–9 models such a situation.a. Determine which profi t function models a no profi t situation. b. What does a profi t function look like when no profi t can
be made?
12. Determine the maximum profi t and the price that would yield the maximum profi t for each. a. P = –400p2 + 12,400p – 50,000 b. P = –370p2 + 8,800p – 25,000 c. P = –170p2 + 88,800p – 55,000
13. Greenyard’s manufactures and sells yard furniture made out of recy-cled materials. It is considering making a lawn chair from recycled aluminum and fabric products. The expense and revenue functions are E = –1,850p + 800,000 and R = –100p2 + 20,000p.a. Determine the profi t function. b. Determine the price, to the nearest cent, that yields the maxi-
mum profi t. c. Determine the maximum profi t, to the nearest cent.
14. Mountaineer Products Incorporated manufactures mountain-bike accessories. It is considering making a new type of refl ector for night biking. The expense and revenue functions are E = –450p + 90,000 and R = –185p2 + 9,000p.a. Determine the profi t function. b. Determine the price, to the nearest cent, that yields the maxi-
mum profi t. c. Determine the maximum profi t, to the nearest cent.
15. Business Bargains manufactures offi ce supplies. It is considering sell-ing sticky-notes in the shape of the state in which they will be sold. The expense and revenue functions are E = –250p + 50,000 and R = –225p2 + 7,200p.a. Determine the profi t function. b. Determine the price, to the nearest cent, that yields the maxi-
mum profi t. c. Determine the maximum profi t, to the nearest cent.
16. FlipFlops manufactures beach sandals. Their expense and revenue functions are E = –300p + 32,000 and R = –275p2 + 6,500p.a. Determine the profi t function. b. Determine the price, to the nearest cent, that yields the maxi-
mum profi t. c. Determine the maximum profi t, to the nearest cent.
will lie entirely below the horizontal axis.
TEACHExercise 12Encourage students to
attempt at least one of
these problems in two
different ways (graphically
and algebraically).
Exercises 13–16These questions are similar
in intent. You might want to
randomly assign two prob-
lems to each student so
that when reviewing them
the next day, students can
listen to their peers explain
the individual work that was
done.
ANSWERS10. Approximately $26;
it appears to have the
greatest positive verti-
cal distance from the
revenue to the expense
function.
11a. In Exercise 7 the
expenses are always
greater than the rev-
enue.
12a. At $15.50, the
maximum profi t
would be $46,100.
12b. At $11.89, the
maximum profi t
would be $27,324.35.
12c. At $261.18, the
maximum profi t
would be
$11,541,235.29.
See margin.
If expenses are always greater than the revenue, the profi t parabola
P = –100p2 + 21,850p – 800,000
$109.25
$393,556.25
P = –185p2 + 9,450p – 90,000
$25.54
$30,679.05
P = –225p2 + 7,450p – 50,000
$16.56
P = –275p2 + 6,800p – 32,000
$12.36
$10,036.36
$11,669.44
See margin.
See margin.
49657_02_ch02_p062-113.indd Sec13:10249657_02_ch02_p062-113.indd Sec13:102 5/29/10 3:18:56 PM5/29/10 3:18:56 PM
2-8 Mathematically Modeling a Business 103
How can you mathematically model a start-up business?Statistics are necessary in making business decisions. The relation-ship between supply and demand; expense, revenue, and profi t; and breakeven points must be analyzed. All of the factors may be modeled together to assess business situations.
Dependence is used in many contexts.In sports, baseball fans • depend on the manager of the team to lead the team to victory. In turn, the manager of the team depends on the players to work hard to succeed.In politics, voters • depend on their local elected offi cials to represent them. Local elected offi cials depend on state government offi cials to give them the support they need to represent the voters.When starting a business venture, expenses • depend on the demanded quantity of the product. Demand depends on the price of the product.These are a few examples of dependence in daily life. In the fi rst
example, if the fans depend on the manager and the manager depends on the players, the fans depend on the players as well. In the second example, if the voters depend on the local elected offi cials and the local offi cials depend on the state offi cials, the voters depend upon the state offi cials, too. Finally, in the last example, if expenses depend on quantity and quantity depends on price, expenses also depend on price. These are examples of the transitive property of dependence.
If x depends on y and y depends on z, it follows that x depends on z.The determination of the price that yields the maximum profi t
depends on a number of factors that precede it. Mathematical model-ing using algebra is an illustration of the use of the transitive property in business.
Key Termsdependence• transitive property of dependence•
ObjectivesRecognize •
the transitive
property of
dependence as
it is used in a
business model.
Use multiple •
pieces of
information,
equations, and
methodologies
to model a new
business.
Mathematically Modeling
a Business
2-8
All models are wrong. Some models are useful.George Box, Statistician and Quality Control Pioneer
EXAMINE THE QUESTIONIn order for this question
to make sense, students
need a good understand-
ing of what a mathematical
model is and when those
models are used. Discuss
some situations where real
life situations are modeled
mathematically in order to
gain information that would
otherwise be diffi cult to
attain.
CLASS DISCUSSIONName other situations that
illustrate dependence.
Have students use the
situations identifi ed in
previous discussions and
illustrate how they might be
examples of the transitive
property of dependence.
49657_02_ch02_p062-113.indd Sec13:10349657_02_ch02_p062-113.indd Sec13:103 5/29/10 3:18:57 PM5/29/10 3:18:57 PM

104 Chapter 2 Modeling a Business
Mathematically modeling a business situation helps you better under-stand the relationships between and among variables.
EXAMPLE 1
Determine the expense, E, for production of an item when the price, p, is $60 given E = 50q + 80,000 and q = 80p + 100,000.
SOLUTION E depends on q, and q depends on p. To fi nd the value of E at a particular price, p, use substitution or express the expense equa-tion directly in terms of price. Both methods illustrate the transitive property of dependence.
The fi rst method uses the price given to fi nd a value for q that can be substituted into the equation for E.
Method 1
Use the equation for q. q = 80p + 100,000
Substitute 60 for p. q = 80(60) + 100,000
Simplify. q = 104,800
Use the equation for E. E = 50q + 80,000
Substitute 104,800 for q. E = 50(104,800) + 80,000
Simplify. E = 5,320,000
The second method substitutes the value of q in terms of p into the expense equation, and then uses the price given to fi nd the value of E.
Method 2
Use the equation for E. E = 50q + 80,000
Substitute 80p + 100,000 for q. E = 50(80p + 100,000) + 80,000
Distribute. E = 4,000p + 5,000,000 + 80,000
Calculate. E = 4,000p + 5,080,000
Substitute 60 for p. E = 4,000(60) + 5,080,000
Simplify. E = 5,320,000
The expenses total $5,320,000.
CHECK ■ YOUR UNDERSTANDINGDetermine the expense, E, for production of an item when the price, p, is $42 given E= 50q + 80,000 and q = 80p + 100,000.
EXTEND ■ YOUR UNDERSTANDINGSuppose A = 20x + 30, x = 30y + 40, and y = 40z + 50. Describe how the value of A depends on the value of z.
Skills and StrategiesTEACHDiscuss with students how
the models in this lesson
differ from models used
in math courses in earlier
grades and how they are
the same. Students will
likely remember using mod-
els such as algebra tiles,
fraction bars, and three-
dimensional models of
geometric solids. They will
not, however, usually think
of graphing on a coordinate
plane or writing and solving
an equation as a model.
Guide students to see that
the fundamental use of a
model is the same, whether
it is an equation or a cube.
EXAMPLE 1It is important to work
through both methods with
students so that they can
see the nature of math-
ematical dependency in this
situation.
CHECK YOUR UNDERSTANDINGAnswer Using either
method, the expense is
$5,248,000.
EXTEND YOUR UNDERSTANDINGAnswer Once the value
of z is known, then y
can be calculated. With
y calculated, then x can
be determined. Once x is
determined, it is substituted
into the fi rst equation, and
A can be evaluated.
49657_02_ch02_p062-113.indd Sec13:10449657_02_ch02_p062-113.indd Sec13:104 5/29/10 3:19:00 PM5/29/10 3:19:00 PM

2-8 Mathematically Modeling a Business 105
EXAMPLE 2
A business model uses a summary analysis of the situation in terms of dependent variables. Examine the three graphs of a business sit-uation for the production of wid-gets. The graphs depict numerical information that is needed to complete the summary analysis.
Write the summary analysis in terms of the data presented in the graphs. The summary analysis should have the following format.
In summary, to start this busi-ness, __?__ widgets should be manufactured. Each should be sold for $__?__.
The breakeven point is reached at a price of $__?__ or $__?__, but a profi t is made at any price between those prices.
At the selling price, there is revenue of $__?__ and expenses of $__?__, resulting in a profi t of $__?__.
SOLUTION In summary, to start this business, 103,200 wid-gets should be manufactured. Each should be sold for $40.
The breakeven point is reached at a price of $14.83 or $65.17, but a profi t is made at any price between those prices.
At the selling price, there is revenue of $800,000 and expenses of $420,000, resulting in a profi t of $380,000.
150,000
200
price
demand
0
Demand
(40, 103,200)
900,000
100
price
amount
0
Expense
(36.57, $806,666.67)
Revenue
(40, $420,000)
(14.83, 520,664.46)
(65.17, $319,335.54)
(40, $800,000)
CHECK ■ YOUR UNDERSTANDINGUse the points labeled on the graphs to show that the maximum profi t at the selling price is the difference between the revenue and expense values at that price.
900,000
100
price
profit
0
Profit
(40, 380,000)
These amounts can be found at the
intersection points of the expense
and revenue functions.
This is asking the price that will yield
the maximum profi t and the quantity
demanded at that price.
Use the price that yields the maximum profi t, $40, in both the expense and
profi t functions.
EXAMPLE 2Students may need assis-
tance with this activity in
determining what type of
information each graph
yields. Before attempting
a solution, ask students to
examine each graph and
determine what information
can be gained from it.
CHECK YOUR UNDERSTANDINGAnswer The maximum
point on the profi t func-
tion is (40, $380,000).
The expense at a price of
$40 is $420,000, and the
revenue at a price of $40 is
$800,000.
800,000 – 420,000 = 380,000
49657_02_ch02_p062-113.indd Sec13:10549657_02_ch02_p062-113.indd Sec13:105 5/29/10 3:19:02 PM5/29/10 3:19:02 PM

1. How might those words apply to what has been outlined in this lesson?
2. Use the following graph to answer the questions below. Let Y1 = cost function and Y2 = revenue function.
a. Explain the signifi cance of point (D, B). b. Explain the signifi cance of point (E, A). c. Explain the signifi cance of point (F, C). d. Explain the signifi cance of point (G, 0). e. Explain the signifi cance of point (H, 0).
f. Where do you think the maximum profi t might occur?
3. Draw a graph of cost function Y1 and revenue function Y2 that meet the following criteria. Maximum revenue: $125,000 Breakeven points: $40 and $160 Price at which no revenue is made: $200 Maximum expenses: $105,000
Use the following situation to answer Exercises 4–20. A company produces a security device known as Toejack. Toejack is a computer chip that parents attach between the toes of a child, so parents can track the child’s location at any time using an online system. The company has entered into an agreement with an Internet service pro-vider, so the price of the chip will be low. Set up a demand function—a schedule of how many Toejacks would be demanded by the public at dif-ferent prices.
4. As the price increases, what is expected to happen to the quantity demanded?
5. The horizontal axis represents price, and the vertical axis represents quantity. Does the demand function have a positive or negative slope? Explain.
All models are wrong. Some models are useful.George Box, Statistician and Quality Control Pioneer
Applications
0D E F G H
AB
C
106 Chapter 2 Modeling a Business
TEACHExercise 2This question is a prerequi-
site for all of the exercises
to follow. It is very impor-
tant that students have an
understanding of the points
identifi ed on the graphs and
what those points represent
in the context of a start-up
business. You might want to
do this problem in class as a
closure piece for the lesson.
ANSWERS1. Models simulate reality
but they themselves are
not reality. There are a
fi xed number of variables
that are used in models.
In reality, there are many
more variables that con-
tribute to the outcome
of a situation. So, while
models can be wrong,
they can still be useful.
2f. The maximum profi t
occurs where there is the
greatest vertical difference
between the revenue and
expenses functions. It
appears that this might
happen at an x value
slightly to the left of E.
3.
It is the fi rst breakeven point.
It is the maximum revenue point.
It is the second breakeven point.
It represents the price at which
It represents the price at whichno revenue is made.
there are no expenses.
0$100 $200
$125,000$105,000
$160
$40
See margin.
The demand is decreasing; the slope is negative.
See margin.
See margin.
decreases
49657_02_ch02_p062-113.indd Sec13:10649657_02_ch02_p062-113.indd Sec13:106 5/29/10 3:19:03 PM5/29/10 3:19:03 PM

2-8 Mathematically Modeling a Business 107
6. The company decides to conduct a market research survey to deter-mine the best price for the device. The variable p represents price, and q represents quantity demanded. The points are listed as (p, q).
(14, 8,200), (11, 9,100), (16, 7,750), (16, 8,300), (14, 8,900),(17, 7,100), (13, 8,955), (11, 9,875), (11, 9,425), (18, 5,825)
Make a scatterplot of the data. Does the data look like it has a linear form?
7. Find the regression equation. Remember the quantity demanded, q, is the dependent variable. Round the slope and y–intercept to the nearest hundredth.
8. Is the linear regression line a good predictor? Explain.
9. Examine the data to see if there is any relationship between the price and the quantity demanded. Determine the correlation coeffi cient between price and demand, rounded to nearest hundredth. Explain the signifi cance of the correlation coeffi cient.
10. Fixed costs are $24,500, and variable costs are $6.12 per Toejack. Express expenses, E, as a function of q, the quantity produced.
11. Express the revenue, R, in terms of p and q.
12. Express the revenue, R, in terms of p.
13. Use the transitive property of dependence to express expense, E, in terms of p. Round to the nearest hundredth.
14. Graph the expense and revenue functions.a. Determine an appropriate maximum horizontal-axis value. b. Determine an appropriate maximum vertical-axis value. c. Sketch the graphs of the expense and revenue functions.
15. Determine the coordinates of the maximum point on the revenue graph. Round the coordinates to the nearest hundredth.
16. Determine the breakeven points. Round to the nearest hundredth.
17. Express the profi t, P, in terms of p.
18. Graph the profi t function. Determine the coordinates of the maxi-mum point of the profi t graph. At what price, p, is profi t maximized? Round to the nearest cent. This will be the price at which Toejack will sell!
19. Write the business summary statement by fi lling in the blanks.
In summary, to start this business, __a.__ Toejacks should be manufactured. Each should be sold at $__b.__. The breakeven point is reached at a price of $__c.__ or $__d.__, but a profi t is made at any price between those prices. At the selling price, there is a revenue of $__e.__ and expenses of $__f.__, resulting in a profi t of $__g.__.
20. If shares of stock are sold with an initial value of $5 each, how many shares must be sold to get enough money to start the business?
The scatterplot has a linear form. See margin.
q = –423.61p + 14,315.94
(19.96, 56,611.81). The profi t is maximized at a price of $19.96. Seeadditional answers for graph.
P = –423.61p2 + 16,908.43p – 112,113.55
TEACHExercises 4–20 These problems guide stu-
dents through the model-
ing process. They must be
assigned in their entirety
since they are cumulative
and sequential.
ANSWERS6.
8. Based on the correlation
coeffi cient of 0.92, the
linear regression line is a
good predictor.
9. r = –0.92 This is a signifi -
cant correlation because
the coeffi cient is close
to –1.
19. a. 5,661; b. $19.96;
c. $8.40; d. $31.52;
e.$116,979.26;
f. $60,367.45;
g. $56,611.81.
See margin.
See margin.
E = 6.12q + 24,500
R = pq
R = –423.61p2 + 14,315.94p
E = –2,592.49p + 112,113.55
50
130,000
(16.90, 120,952.14)
(8.40, 90,343.87) and (31.52, 30,403.76)
See margin.
12,074
See additional answers.
49657_02_ch02_p062-113.indd Sec13:10749657_02_ch02_p062-113.indd Sec13:107 5/29/10 3:19:07 PM5/29/10 3:19:07 PM

108 Chapter 2 Modeling a Business
CHAPTER
Examine the scatterplot below. It depicts the rate of failures reported for a single product. A product failure is when a product fails to do what it was manufactured to do. The diagram below is called a “bathtub curve.” Write a short newspaper-type article centered on this graph, based on a hypothetical situation you create. An electronic copy of the graph can be found at school.cengage.com/math/fi nancialalgebra. Copy and paste it into your article.
You Write the Story!!Real Numbers
Assessment2
Reality Check
0 0.5 1 1.5 2 2.5
Product Failure Rate Over Time
Time in Years3 3.5 4 4.5
Failu
re R
ate
1. Corporations pride themselves on the recognition of their logos. This project involves creating a game. Use the library or the Internet to fi nd logos of twelve popular brands. Look only for logos that do not include the corporate name. Paste the logos on a sheet of paper. With teacher approval, give the class the sheet of logos, and ask students to write the brand name next to each logo.
2. Use the Internet or library to fi nd more details on the failures of the three products mentioned at the beginning of the chapter: New Coke, the Edsel, and the Sony Betamax. Write a report on the specifi c reasons for each failure.
3. Find an example of a product not mentioned in this chapter that failed. Prepare a report detailing the story behind the product’s inven-tion and its failure.
CHAPTER 2 ASSESSMENTREAL NUMBERSYou Write the StoryStudents’ answers will vary.
Begin by having them focus
on the shape of the curve.
Why are the points at the
beginning and at the end of
the time cycle higher than
those in the middle? Why are
the mid-cycle points close to
horizontal? Once they have
established the nature of the
graph, the article should be
easy to write.
REALITY CHECKThe Reality Check projects
are a terrifi c form of alterna-
tive assessment. They give
students an additional ave-
nue to show what they have
learned, so their grades are
not solely based on tests.
The Reality Check Projects
in this lesson ask students
to do research, interview
business workers, read
the business section of a
newspaper, and more. Each
project is designed so that
students can use what they
have learned in this chapter
as a springboard for further
work.
49657_02_ch02_p062-113.indd Sec13:10849657_02_ch02_p062-113.indd Sec13:108 5/29/10 3:19:08 PM5/29/10 3:19:08 PM

4. Interview a local businessperson. Ask for examples of fi xed and vari-able expenses. Do not ask for amounts as that information is private. Make a comprehensive list. Also ask about the history of the business and how he or she became involved in it.
5. Trace the history of the portable, hand held calculator from inception to the present. Include brand names, sales fi gures, features, pictures, model names, etc. Prepare the fi ndings in a report.
6. On January 1, 1962, the Beatles, looking for their fi rst recording con-tract, had an audition with Decca records. They were turned down, and legend has it that Decca said “ . . . guitar groups are on the way out.” Use the library and/or the Internet to research the international sales of Beatles recordings over the past 5 decades and any other fi nancially-related Beatles facts. Compare Decca’s decision to the product failures discussed in this chapter. What are the similarities and differences? Prepare the fi ndings in a report.
7. How prevalent are brand names in society? With teacher approval, get two copies of the same newspaper or magazine. Divide the class into two teams. First, give the number of pages in that publication. Next, have each team predict the number of times a brand name will be used. Have each team read through the entire publication (teams may split up the reading) and count every brand name that is written in the publication. If a name is written multiple times, count every time it is written. Write in the newspapers or magazines to easily keep track. Compare fi ndings, and if they differ, fi nd out where they differ. How did the fi ndings compare to the predictions?
8. Search the Internet for three different websites that offer breakeven calculators. Compare and contrast them. What can one do that the other(s) can’t? Write up a recommendation for the use of one of the three calculators and justify the recommendation.
9. Look either in the Business section of a newspaper or online to iden-tify three companies that claim to have made a profi t over a period of time. Research how they each defi ne profi t, and state the monetary amounts that each is quoting as their profi t for the time period.
10. Many children set up lemonade stands in front of their homes when they were younger. What would the fi xed costs of a lemonade stand be? What would be the variable costs? At what price would a glass of lemonade be sold? Explain how to decide the price. Estimate revenues and profi t over a one-week period.
Go to www.cengage.com/school/math/fi nancialalgebra where you will fi nd a link to a website containing current issues about modeling a business.
Assessment 109
Dollars and Sense Your Financial News Update
49657_02_ch02_p062-113.indd Sec13:10949657_02_ch02_p062-113.indd Sec13:109 5/29/10 3:19:09 PM5/29/10 3:19:09 PM

110 Chapter 2 Modeling a Business
REVISITEDReally!Really?
Ford Motor Company predicted 1958 Edsel sales to exceed 200,000 cars. Only 63,107 of the 1958 models were sold. The 1960 model saw only 2,846 cars sold. During the three years of production, approximately 110,847 Edsels were manufactured.
Today, less than 6,000 of them remain. As a rare curiosity, they are prized by many car collectors and have grown in value.
The following bar graph gives the values of a 1958 Edsel Villager 9-Passenger Station Wagon during the years 1999–2008. Because the value depends on the condition of the car, car appraisers rate the condi-tion of a classic car. On this graph, Condition 2 is the best condition and Condition 6 is the poorest condition.
1. Give an approximate value for the 1958 Villager in a condition of 6 in 2008.
2. Give an approximate value for the 1958 Villager in a condition of 2 in 2008.
3. Approximate the difference between a 1958 Villager in a condition of 6 and in a condition of 2 in 2008.
4. Approximate the difference between a 1958 Villager in a condition of 2 in 1999 and in 2008.
Look at the general trend of the graph. If a failure is kept for long enough, it may prove to be a good decision! Go online and look for pic-tures of the original 1958 Edsel. Also fi nd photos of the 1958 Chevrolet, the 1958 Chrysler, and the 1958 Buick. Does the Edsel look very different from the other cars? Consumers thought it did! And that’s reality!
234
16000
14000
12000
10000
8000
6000
4000
2000
05
Condition
1958 Villager 9-Passenger Wagon
Pric
e (U
S$)
6
1999200020012002200320042005200620072008
Source: Edsel.com, http://www.edsel.com/charts/e58vil9p.jpg
REALLY? REALLY! REVISITEDIn the Really? Really!
feature at the beginning of
the chapter, students were
introduced to products
that were market failures.
Certainly, the manufac-
turers of these products
envisioned market success.
But, for numbers of rea-
sons, each individual to the
product, consumers just
didn’t make the purchases.
Here, students revisit one
such product failure, the
Edsel. The structure of this
bar graph might be new to
students and will need an
explanation. The concepts
of automobile deprecia-
tion and appreciation will
be explored in detail in the
Automobile chapter, but
are worth mentioning here.
Often some cars depreciate
at the outset and then after
numbers of years become
a collector’s item. Once
that happens, the demand
for them increases and the
value of the car appreciates.
This appears to be the case
with the Edsel.
After completing the ques-
tions related to the graph,
encourage students to
follow up with the Internet
research extension activity.
Remind them of the role
perception played in stock
splits. Link that concept to
how perception played a
role in the sale of the Edsel.
$1,000
$14,000
$13,000
$7,000
49657_02_ch02_p062-113.indd Sec13:11049657_02_ch02_p062-113.indd Sec13:110 5/29/10 3:19:10 PM5/29/10 3:19:10 PM

1. Examine each scatterplot. Identify each as showing a positive corre-lation, a negative correlation, or no correlation.
a. b. c.
2. If each set of bivariate data has a causal relationship, determine the explanatory and response variables for each set of data.a. number of hours spent reading and page number on which you
are reading b. calories burned and number of minutes of exercisingc. amount paid as income tax and the amount of a paycheck d. pounds of hamburger used to make a meatloaf and number of
people that can be fed from the meatloaf
3. Which of the following scatterplots does not show a line of best fi t?
a. b. c.
4. Describe each of the following correlation coeffi cients using the terms strong, moderate, or weak and positive or negative.a. r = 0.17 b. r = –0.62 c. r = –0.88 d. r = 0.33 e. r = 0.49 f. r = –0.25 g. r = 0.91
5. The graph shows supply and demand curves for the newest game controller for the VVV video game system.a. What is the equilibrium price? b. What will happen if the price is set
at $7.99? c. How many game controllers are demanded
at a price of $7.99? d. How many game controllers are supplied at
a price of $7.99? e. What will happen if the price is set at
$12.99?
q
p$11.49
Supply
Demand
$7.99
1,000
250
Applications
Assessment 111
positive negative none
hours-explanatory; page number-response
minutes exercised-explanatory; calories-response
paycheck-explanatory; taxes-response
pounds of hamburger-explanatory; people-response
will attempt to sell the excess product at a lower price.
b
weak positive
moderate negative
$11.49
Demand will exceed supply.
1,000
250
Supply will exceed demand, and suppliers
strong negative
weak positive
moderate positive
weak negative
strong positive
49657_02_ch02_p062-113.indd Sec13:11149657_02_ch02_p062-113.indd Sec13:111 5/29/10 3:19:11 PM5/29/10 3:19:11 PM

112 Chapter 2 Modeling a Business
6. The demand function for a certain product is q = –300p + 10,000. The fi xed expenses are $500,000 and the variable expenses are $2 per item produced.a. Express the expense function in terms of q. b. Use substitution to express the expense function in
terms of p. c. If the price is set at $20, what quantity will be demanded? d. If price is set at $25, fi nd the demand. Use these numbers in a
complete sentence that explains what they mean. e. If q = 1,000 widgets, fi nd E, the cost (expense) of producing
them. Use both numbers in a complete sentence to explain what they mean.
f. If the price is set at p = $15, how much will it cost to produce the correct number of widgets? Use these numbers in a complete sentence to explain what they mean.
7. Let the expense function for a particular item be defi ned as y = –1,950x + 53,000. Let the revenue function be defi ned as y = –450x2 + 10,000x, where x represents price in each equation. Use this window.a. Graph the two functions. b. Determine the x- and y-coordinates of
the fi rst point where the two graphs intersect. Round those values to the nearest whole number.
c. Explain the signifi cance of this point in the context of expense, revenue, and price.
8. Express the revenue equation in terms of price given the demand function.a. q = –900p + 120,000 b. q = –88,000p + 234,000,000
9. The expense function for a widget is E = –3,000p + 250,000. The revenue function is R = –600p2 +25,000p.a. Write the profi t equation in simplifi ed form. b. Use the axis of symmetry formula to determine the maximum
profi t price and the maximum profi t.
Use this situation to answer Exercises 10–25. A company is interested in producing and selling a new device called an eyePOD (eyewear personal optical device). The eyePOD is an MP3 and video player built into a pair of sunglasses. The user can listen to music from the small earphones and watch videos projected on the screen behind the glasses.
10. As the price of the eyePOD increases, what is expected to happen to the quantity demanded?
11. The horizontal axis represents price, and the vertical axis represents quantity. Does the demand function have a positive or negative slope? Explain.
Xmin=0Xmax=30
WINDOW
Xscl=1Ymin=0Ymax=70000Yscl=1Xres=1
E = 2q + 500,000
$529,000 to produce widgets that sell for $15 each.
E = –600p + 520,000
revenue and the expense will be approximately $42,026.
P = –600p2 + 28,000p – 250,000
4,000
E = 502,000; it costs $502,000 to produce 1,000 widgets.
E = 529,000; it would cost
See margin.
x = 6 and y = 42,026
When the price is set at approximately $6, both the
R = –900p 2 + 120,000p
R = –88,000p 2 + 234,000,000p
ANSWERS
6d. demand = 2,500; when
price is set at $25 per
item, the demand for
the item will be 2,500.
7a.
9b. The maximum profi t
price is approximately
$23.33. At that price,
the maximum profi t
is approximately
$76,666.66.
See margin.
See margin.
decreases
The demand is decreasing; the slope is negative.
49657_02_ch02_p062-113.indd Sec13:11249657_02_ch02_p062-113.indd Sec13:112 5/29/10 3:19:13 PM5/29/10 3:19:13 PM

12. The market research department conducted consumer surveys at college campuses and reported its results. In these ordered pairs, the fi rst number represents price, p, and the second number represents the quantity demanded, q. The points are listed as ( p, q).
(300, 10,000), (325, 8,900), (350, 8,800), (375, 8,650), (400, 6,700),(425, 6,500), (450, 5,000), (475, 4,500), (500, 4,450), (525, 3,000)
Make a scatterplot of the data.
13. What is the correlation coeffi cient? Round it to the nearest hun-dredth. Is this line a good predictor? Explain.
14. Write the regression equation. Remember that the demanded quan-tity, q, is the dependent variable. Round the slope and y-intercept to the nearest hundredth.
15. The accounting department has calculated that this could be the big-gest product to hit the market in years. It anticipates the fi xed costs to be $160,000 and the variable cost to be $150 per eyePOD. Express expenses, E, as a function of q, the quantity produced.
16. Express the revenue, R, in terms of p and q.
17. Express the revenue, R, in terms of p.
18. Recall the transitive property of dependence. Express expenses, E, in terms of p. Round to the nearest hundredth.
19. Graph the expense and revenue functions.a. Determine an appropriate maximum horizontal-axis value. b. Determine an appropriate maximum vertical-axis value. c. Sketch the graphs of the expense and revenue functions.
20. Determine the coordinates of the maximum point on the revenue graph. Round to the nearest hundredth.
21. Determine the breakeven points. Round to the nearest hundredth.
22. Express the profi t, P, in terms of p.
23. Graph the profi t function. Determine the coordinates of the maxi-mum point of the profi t graph. At what price, p, is profi t maximized? Round to the nearest cent. This will be the price at which one eye-POD will sell!
24. Write the business summary statement by fi lling in the blanks.
In summary, to start this business, __a.__ eyePODS should be manu-factured. Each should be sold at $__b.__. The breakeven point is reached at a price of $__c.__ or $__d.__, but a profi t is made at any price between those prices. At the selling price, there is a revenue of $__e.__ and expenses of $__f.__, resulting in a profi t of $__g.__.
25. If shares of stock are sold with an initial value of $10 each, how many shares must be sold to get enough money to start thebusiness?
Assessment 113
See margin.
–0.98; because the absolutevalue of the correlation coeffi cient is greater than 0.75, this is a good predictor.
q = –30.74p + 19,330
E = 150q + 160,000
R = pq
R= –30.74p 2 + 19,330p
E = –4,611p + 3,059,500
700
3,100,000
(3,14.41, 3,038,784.16)
(161.13, 2,316,534.30) and (617.69, 211,315.67)P = –30.74p 2 + 23,941p – 3,059,500
(389.41, 1,601,946.66); the profi t is maximized at a price of $389.41.
See margin.
26,394
12.
24. a. 7,360; b. $389.41;
c. $161.13; d. $617.69;
e. $2,865,877.15;
f. $1,263,930.49;
g. $1,601,946.66
See additional answers.
49657_02_ch02_p062-113.indd Sec13:11349657_02_ch02_p062-113.indd Sec13:113 5/29/10 3:19:14 PM5/29/10 3:19:14 PM