CHAPTER IV: STUDENT OUTCOMES AND ASSESSMENT - Mste
97
CHAPTER IV: STUDENT OUTCOMES AND ASSESSMENT John A. Dossey, Illinois State University and Alan H. Schoenfeld, University of California at Berkeley ABSTRACT The focus of this chapter is on indicators of undergraduate mathematics performance. In particular, it emphasizes the broad spectrum of mathematics necessary for a technologically and mathematically sophisticated work force, as well as the kind of substantial mathematical background(s) that will enable increasing numbers of American students to go on to careers in the mathematical and other sciences. This chapter addresses three major issues: What range of competencies should be assessed in a system of national indicators? What is the current state of conceptual frameworks and technologies for assessment – that is, what do we know how to document, and what needs work? What levels of mathematical performance (from remedial arithmetic through precalculus to calculus and beyond) might profitably be assessed, for which students? In which arenas can the assessment system "make do" with proxies, and in which arenas is direct assessment necessary in order to obtain reliable information? How might direct information be gathered? What current candidates exist for use as either direct assessment or proxies? The first is addressed in general, in order to allow for a smooth liaison with issues of K-12 mathematics, and to establish the "ideal" dimensions of an indicator system. The second focuses on different populations of interest: all graduates, those pursuing technical careers, those who use mathematics in the service of other majors or disciplines, prospective teachers, and those who will go on to careers in mathematics. The third makes concessions to practicalities, and discusses what might be economically feasible or pragmatically realizable.
Transcript of CHAPTER IV: STUDENT OUTCOMES AND ASSESSMENT - Mste

CHAPTER IV: STUDENT OUTCOMES AND ASSESSMENT
John A. Dossey, Illinois State University
and Alan H. Schoenfeld, University of California at Berkeley
ABSTRACT
The focus of this chapter is on indicators of undergraduate mathematics performance. In particular, it emphasizes the broad spectrum of mathematics necessary for a technologically and mathematically sophisticated work force, as well as the kind of substantial mathematical background(s) that will enable increasing numbers of American students to go on to careers in the mathematical and other sciences. This chapter addresses three major issues:
What range of competencies should be assessed in a system of national indicators? What is the current state of conceptual frameworks and technologies for assessment – that is, what do we know how to document, and what needs work? What levels of mathematical performance (from remedial arithmetic through precalculus to calculus and beyond) might profitably be assessed, for which students? In which arenas can the assessment system "make do" with proxies, and in which arenas is direct assessment necessary in order to obtain reliable information? How might direct information be gathered? What current candidates exist for use as either direct assessment or proxies?
The first is addressed in general, in order to allow for a smooth liaison with issues of K-12 mathematics, and to establish the "ideal" dimensions of an indicator system. The second focuses on different populations of interest: all graduates, those pursuing technical careers, those who use mathematics in the service of other majors or disciplines, prospective teachers, and those who will go on to careers in mathematics. The third makes concessions to practicalities, and discusses what might be economically feasible or pragmatically realizable.

Chp. 4: Student Outcomes and Assessment
– 2 –
CHAPTER IV: STUDENT OUTCOMES AND ASSESSMENT
John A. Dossey, Illinois State University and
Alan H. Schoenfeld, University of California at Berkeley 4.0 INTRODUCTION The focus of this chapter is on indicators of undergraduate mathematics performance. In particular, it emphasizes the broad spectrum of mathematics necessary for a technologically and mathematically sophisticated work force, as well as the kind of substantial mathematical background(s) that will enable increasing numbers of American students to go on to careers in the mathematical and other sciences. As this report is being compiled, curriculum and assessment – and national policy issues concerning them – are in a state of flux. It is essential to understand the current state in order to comprehend (a) evolving conceptions of what it means to understand and do mathematics (both in a formal sense and in the more general sense of mathematical literacy for a technological society), and (b) the continuities and discontinuities between K-12 mathematics and the undergraduate mathematics curriculum. The overarching question to be asked at every stage in students' mathematical education, (with one major assessment point being at the termination of students' undergraduate careers) is:
"What mathematics do students know and what are they able to do?" Here, as introduction, we briefly highlight three framing issues concerning the population (which students?), the content (which mathematics?), and the methods of data gathering (which measurement tools?) that must be dealt with in designing indicator systems. These are described in general, to make clear their links to K-12 issues. We then list the three major issues that will serve as the frame for this chapter. The consideration of these questions and issues must be in the context of the present moves to reform in the teaching and learning of mathematics. What is critically important for specific groups of students to know and be able to do? Why is it important that they should know and be able to do these things? How do we know that they have achieved the goals we have established for them?

Chp. 4: Student Outcomes and Assessment
– 3 –
4.0.1 Which students? How one chooses to address the question of mathematical competency depends in significant ways on the population on which one chooses to focus. For example, the question highlighted above may be posed for:
• the population at large, where issues of broad mathematical, scientific, and
technological literacy are paramount; • those who will use some amount of mathematics for technical careers,
including career tracks in two-year colleges; • those who use mathematics in the service of other majors or disciplines; • those who will teach mathematics at the elementary or secondary level; • those who will go on to careers in mathematics.
An attempt to build a comprehensive indicator system must target or sample from these various populations. Especially in the case of the first population (the vast majority of Americans), it must dovetail with other indicators of national performance, specifically those at the high school level. Hence issues (a) and (b) in the introductory paragraphs – changing conceptions of what it means to understand and do mathematics, and continuity with K-12 mathematics – become paramount.
4.02 Which mathematics? In the light of curricular reform, and the research that underpins it, we have come to recognize that "mathematical performance" is multi-faceted, and must be examined in various ways. For example, the examination of student performance at any level might focus on a number of things, such as:
• performance tied to basic facts, concepts, skills, and procedures; • performance tied to particular course goals (which, for example, differ
substantially for different calculus courses); • broad mathematical understandings (e.g., "problem solving" or "critical
thinking" skills; • student beliefs and attitudes.

Chp. 4: Student Outcomes and Assessment
– 4 –
To sum up our perspective in a nutshell: an adequate indicator system (indeed, an adequate curriculum!) must represent a sense of balance – it must attend to all of the above, in reasonable proportion.
4.03 Which measurement tools or indicator systems? Issues of measurement are thorny, to say the least. As an introduction to that notion (which may seem odd at first glance, given that we have been implementing a variety of testing mechanisms and national assessments for the better part of the century) we briefly provide one example, that of performance standards. The purpose of this example is to show that currently accessible and widely-used assessment technologies are not up to the task of capturing mathematical performance (though they can of course tell us which content students have mastered). At the school level, the National Assessment of Educational Progress (NAEP) has a long and distinguished history of reporting student performance in mathematics (among other disciplines). Traditionally NAEP scores, reported on a 0 to 500 scale, summarize students' performance on a range of problems at varying levels of difficulty. In response to pressures for the establishment of nation-wide standards, the National Assessment Governing Board (NAGB) attempted in 1990 and 1992 to develop "achievement levels" within the framework of mathematics content measured by the NAEP instruments. The idea appears simple: establish various "cut-off" scores for the NAEP exam that indicate varying levels of mathematical proficiency – with a given score indicating the kind of mathematical performance one could expect from a student who scored it. These achievement levels were developed through the examination of the extant items available for the NAEP assessments. Simply put, the exercise was a failure: the NAEP exam, which was largely content-based, did not provide a meaningful frame for describing student performance (National Academy of Education, 1993, p. 36). (Here is a rough analogy. Saying someone was a "B student" in high school mathematics may give you some sense of how well the student did, but not of what the student can do - was the student good at proofs but bad at algebra, decent but not excellent on almost everything, etc.? More precise specifications of what was tested, and how it is reported, are necessary to see what the student knows. There are, obviously, parallel issues in collegiate mathematics.) Work to carefully describe the desired outcomes and expected levels of performance associated with mathematics learning is an extremely difficult task. The Standards for mathematics curricula provided by the National Council of Teachers of Mathematics (NCTM, 1989), the Principles and Standards (NCTM, 2000) and the American Mathematical Association of Two Year Colleges (AMATYC, 1995) provide content, but they do not provide expected levels of achievement.

Chp. 4: Student Outcomes and Assessment
– 5 –
Assessments and indicators designed to tap directly into students' performance or achievement levels will not be easy to create or implement. While the limitations of prior methodologies have been highlighted in recent years, new assessment technologies with the desired statistical properties of reliability and validity have not yet been developed to take their place (Mislevy, 1993). In the past, assessments were judged by their objectivity, as defined in terms of reliability and match with a matrix of desired outcomes. They were characterized by multiple-choice formats which were constructed upon the fundamentals of classical test theory (Cronbach, 1960; Ghiselli, 1964; Gronlund, 1965). No one questioned the fact that the development of the content framework for the tests was highly subjective. Today, the movement is toward the use of assessments which require student products as output, assessments which seem to be highly subjective at the end, but assessments for which emerging methods of evaluation are beginning to approach the replicability levels once sought in traditional assessments. 4.04 THE FRAME FOR THIS CHAPTER In what follows we turn our attention largely to undergraduate mathematics – with the recognition that the boundaries between high school mathematics and collegiate mathematics are blurred, and that issues of "mathematical literacy" cut across them. This chapter addresses three major issues:
1. What range of competencies should be assessed in a system of national
indicators? What is the current state of conceptual frameworks and technologies for assessment – that is, what do we know how to document, and what needs work?
2. What levels of mathematical performance (from remedial arithmetic through
precalculus to calculus and beyond) might profitably be assessed, for which students?
3. In which arenas can the assessment system "make do" with proxies, and in
which arenas is direct assessment necessary in order to obtain reliable information? How might direct information be gathered? What current candidates exist for use as either direct assessment or proxies?
The issues are addressed in the order posed, and we make some recommendations regarding each issue in each section.
Chp. 4: Student Outcomes and Assessment
– 6 –
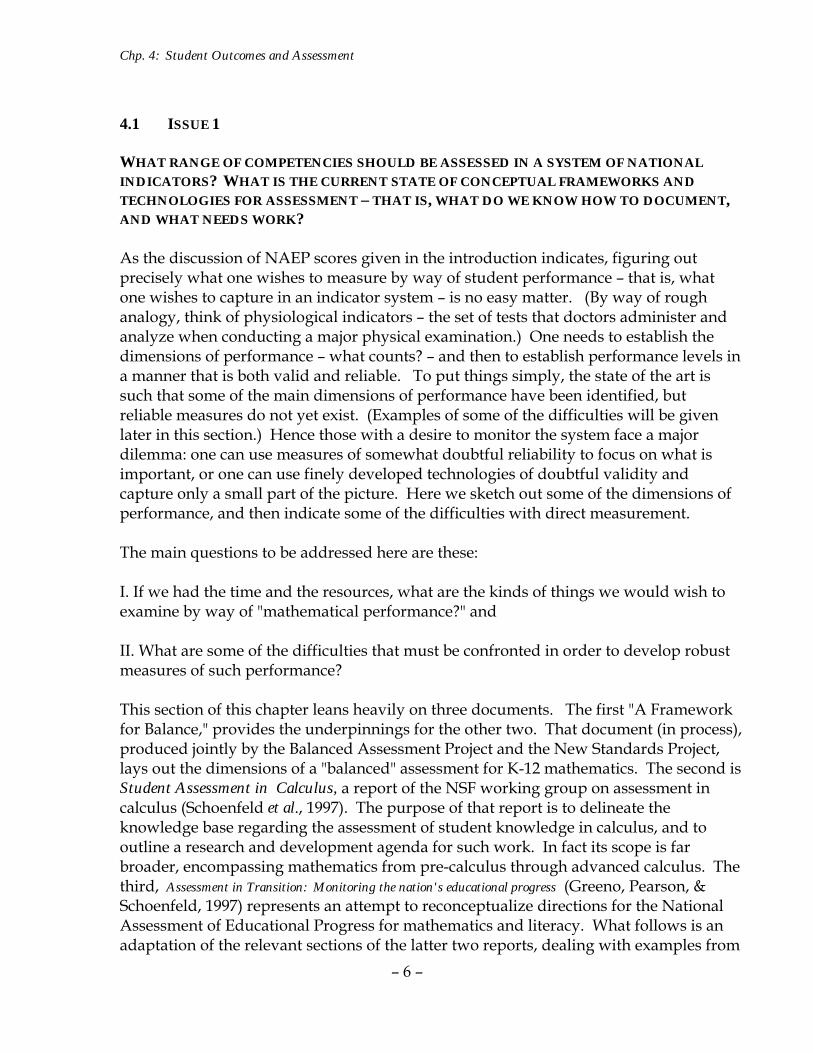
4.1 ISSUE 1 WHAT RANGE OF COMPETENCIES SHOULD BE ASSESSED IN A SYSTEM OF NATIONAL INDICATORS? WHAT IS THE CURRENT STATE OF CONCEPTUAL FRAMEWORKS AND TECHNOLOGIES FOR ASSESSMENT – THAT IS, WHAT DO WE KNOW HOW TO DOCUMENT, AND WHAT NEEDS WORK? As the discussion of NAEP scores given in the introduction indicates, figuring out precisely what one wishes to measure by way of student performance – that is, what one wishes to capture in an indicator system – is no easy matter. (By way of rough analogy, think of physiological indicators – the set of tests that doctors administer and analyze when conducting a major physical examination.) One needs to establish the dimensions of performance – what counts? – and then to establish performance levels in a manner that is both valid and reliable. To put things simply, the state of the art is such that some of the main dimensions of performance have been identified, but reliable measures do not yet exist. (Examples of some of the difficulties will be given later in this section.) Hence those with a desire to monitor the system face a major dilemma: one can use measures of somewhat doubtful reliability to focus on what is important, or one can use finely developed technologies of doubtful validity and capture only a small part of the picture. Here we sketch out some of the dimensions of performance, and then indicate some of the difficulties with direct measurement. The main questions to be addressed here are these: I. If we had the time and the resources, what are the kinds of things we would wish to examine by way of "mathematical performance?" and II. What are some of the difficulties that must be confronted in order to develop robust measures of such performance? This section of this chapter leans heavily on three documents. The first "A Framework for Balance," provides the underpinnings for the other two. That document (in process), produced jointly by the Balanced Assessment Project and the New Standards Project, lays out the dimensions of a "balanced" assessment for K-12 mathematics. The second is Student Assessment in Calculus, a report of the NSF working group on assessment in calculus (Schoenfeld et al., 1997). The purpose of that report is to delineate the knowledge base regarding the assessment of student knowledge in calculus, and to outline a research and development agenda for such work. In fact its scope is far broader, encompassing mathematics from pre-calculus through advanced calculus. The third, Assessment in Transition: Monitoring the nation's educational progress (Greeno, Pearson, & Schoenfeld, 1997) represents an attempt to reconceptualize directions for the National Assessment of Educational Progress for mathematics and literacy. What follows is an adaptation of the relevant sections of the latter two reports, dealing with examples from

Chp. 4: Student Outcomes and Assessment
– 7 –
the calculus report and suggesting cognitively-oriented modifications of current mathematics assessments. We take the NAEP mathematics assessment as our starting point for commentary, for three reasons: (1) NAEP is the primary national indicator of K-12 mathematics student performance in the U.S. – see, for example, NSF publication 93-95, Indicators of Science and Mathematics Education, 1992; and hence the issues raised in a consideration of NAEP allow for an articulation of K-12 and higher education; (2) the limitations of NAEP point out the directions one might want to pursue, and also the difficulties to be found in pursuing them; and (3) groundwork has been done for establishing an undergraduate level version of NAEP by the National Center for Education Statistics (NCES, 1992, 1994a, 1994b). Broadly speaking, we have witnessed over the past three decades a significant reformulation of what it means to be competent in terms of mathematics content at the undergraduate level. The expectations have grown from outlines provided by the Committee on the Undergraduate Program in Mathematics (1965; 1981, 1991) to expectations provided for future teachers by the NCTM (1981, 1991) and the MAA (1983, 1991), and outlines provided by AMATYC (1995). In a like manner, the marks of competence in terms of more general cognitive abilities are much broader in scope than frameworks provided by trait psychology and its descendants (which, it should be noted, provided the underpinnings of much of the current indicator systems). In crude terms, the shift has been from knowledge to performance: that is, the research focus has shifted from the issue of knowledge inventories ("what does one need to know in order to be declared knowledgeable in X?") to delineations of competent performance ("what are the things one must be able to do in order to be declared good at X?"). This expansion has, in a sense, "put knowledge in its place." Now, what one "knows" is seen as one of many important aspects of "thinking mathematically." Borrowing from the theoretical frame offered in Schoenfeld (1985, 1992), we present an overview of four major categories of mathematical competence: 1. The knowledge base. Little need be said regarding this category; it has received the lion's share of attention in the psychology of assessment, and of NAEP (NAGB, 1995) in particular. The basic perspective: one identifies content areas of interest, and creates a spectrum of problems ranging from easy to hard in each content area. (Such content could be "measurement or "algebra" in K-12; it could be "differentiation" or "max-min problems" in calculus; it could be "linear independence" in linear algebra.) Student performance on the items indicates how well they have mastered the content. 2. Strategies. In every intellectual domain there are a set of heuristic strategies – rules of thumb for making progress when the knowledge base does not in itself prove

Chp. 4: Student Outcomes and Assessment
– 8 –
adequate for solving a problem. In mathematics, thanks to the work of Polya (1945), many of these strategies have been formalized – e.g., "exploit easier or analogous problems" or "consider special or extreme cases." The ability to use such strategies is an important aspect of mathematical competence . 3. Aspects of metacognition, in particular self-monitoring and self-regulation. An essential ingredient of competent performance is reflecting on one's performance, knowing how well you seem to be doing at any given moment, and acting on that knowledge. Poor problem solvers will perseverate on particular approaches long after those approaches have failed to yield results, while competent problem solvers, in contrast, will truncate wild-goose chases. They will realize they have lost the thread of an argument, and will go back to the point where they lost it. They will check periodically to see if they work they have done is adequate to the task at hand. In short, what "counts" is not only what you know, but effectively what knowledge is used, if at all. 4. Beliefs, dispositions, and practices. One's sense of a discipline (one's beliefs about it) shapes how one acts in it – and those beliefs may vary from very productive (and very much like those of practitioners of the discipline) to very counter-productive. For example, many mathematics students believe, on the basis of their classroom and homework experience, that any problem can be solved in five minutes or less – and they thus give up on problems when they haven't solved them in five minutes. People in the United States (as opposed to Japan) tend to believe that success in mathematics is a matter of innate talent, as opposed to the result of hard work – and they do not, therefore, invest as much effort as they might (Stevenson, Lee, & Stigler, 1986). Following extended experience in a discipline and membership in a community of people who practice it, one picks up certain practices – ways of perceiving (of self and discipline) and of acting. Mathematically-minded people tend to mathematize – to model things mathematically, to symbolize, to analyze. They tend to demand analytic proof of assertions: if something is claimed to be true there should be a comprehensible and communicable reason as to why it is. The issue: do our mathematics classrooms provide opportunities for students to engage in mathematics in these ways? The four categories of knowledge and behavior described immediately above are indicators of mathematical competency. With the exception of the first category, they are dramatically under-represented in current indicator systems. Where they have been elaborated, they can and should be included in a revised indicator system. Where they have not, it is essential to begin a research and development program to develop the relevant indicators (or solid proxies for them). In what follows immediately below, we elaborate on the conceptual frame just delineated – discussing the state of assessment with regard to each of the five categories.

Chp. 4: Student Outcomes and Assessment
– 9 –

Chp. 4: Student Outcomes and Assessment
– 10 –
4.1.1 Category 1: The knowledge base As noted above, this area is in large measure the focus of the current content indicators and the one for which assessment and indicator technologies are best known. There are some new testing technologies, in particular for examining complex knowledge structures such as schemata (Marshall , 1990), which merit examination. But the primary focus of this category should be a re-definition of "content," both in line with current curricular changes and in line with a much more process-oriented view of mathematics. It is essential to begin with the observation that there has been significant curriculum reform in mathematics over the past half-dozen years at both the K-12 and undergraduate levels. The reform in K-12 mathematics can be traced to Everybody Counts and the National Council of Teachers of Mathematics' standards documents (1989, 2000) and subsequent state and national reports. The 1981 Committee on the Undergraduate Program's 1981 Recommendations for a general mathematical sciences program and the MAA's 1986 "Lean and Lively Calculus" (Douglas, 1986) conference and its proceedings sparked reform in calculus in particular, and in collegiate mathematics more generally . Those documents suggest a re-ordering of content priorities, with various topics to receive less attention and others to receive more. But topic coverage is only the tip of the content iceberg. Content broadly conceived includes a great deal more (Board on Mathematical Sciences, 1990, 1991). A framework for delineating the knowledge base A. It is important to attend to the overarching philosophical and pedagogical goals intended for mathematics curricula. For example, the NCTM Standards (1989) focus on four overarching themes, which are given as Standards 1-4 for all grade levels: Mathematics as reasoning, mathematics as problem solving, mathematics as communication, and mathematics as making connections. Similar recommendations are given in the American Mathematical Association of Two-Year Colleges' standards (AMATYC, 1995). At a global level, any indicator system should provide significant information about American students' abilities in those areas. This is especially the case at the level of "mathematical literacy" – the general competencies of students who are not mathematical specialists. In addition, both the AMATYC and NCTM Standards set goals for students to become more confident in their use of mathematics and their valuing of mathematics as a positive force in their lives. Calculus reform provides a compelling example of the need to focus on philosophy and goals. A decade ago, what "counted" in a course was, by and large, the list of topics to be covered (Steen, 1988). Standardized texts defined the course, and one could often construct a plausible final examination by sampling appropriately from end-of-chapter

Chp. 4: Student Outcomes and Assessment
– 11 –
problems. Now, however, some courses have radically different goals. Here is a description from the calculus working group report:
"Many [reformers] feel that changes in pedagogical style are particularly important. They emphasize that students should be active learners and should learn to think autonomously. They believe that students should work together in small groups, because small group work tends to replace competition with cooperation, promotes conversations about mathematics, and provides a chance for students of different strengths and learning styles to contribute to the solution of problems. Moreover, they argue that students should acquire the habit and skill of working in teams because that will often be expected in later life. Correspondingly, there is a de-emphasis and de-valuing of lecturing in the classical style. Many say it should be reduced, some to nil. There is general agreement that students should work on some ill-defined and open-ended problems, to learn that often one must construct and test assumptions not explicitly stated in a problem in order to find a solution. The expectation is that students should realize that significant problems usually take more than a few minutes to solve, and that they should learn to accept the frustration that accompanies such work (and the corresponding gratification when a difficult problem yields to their efforts). Broadly speaking, [calculus reformers] believe that today's students will almost always have computers and calculators available, so they should learn to use such technological devices appropriately. Some . . . noted that computers also can and should be used to enable (or encourage) students to construct their own mathematical understandings. In addition, it may well be the case that students will (appropriately) develop a different sense of the domain as a result of the accessibility of technology – a sense of the domain that corresponds closely to some contemporary technology-based uses of calculus. A common goal is that students should enjoy learning, doing, and applying mathematics, and thus be encouraged to study more mathematics. [Reformers] want their students to be able to use what they have learned in subsequent courses, both in and out of the mathematics department; they also want their students to retain some understanding and knowledge for a long period of time, and to be able to learn more mathematics on their own." (Schoenfeld et al., 1997)
Such goals are hardly limited to calculus courses. They are, for example, relevant and appropriate in remedial courses, where students get a second chance to figure out what the subject is all about. In addition, more mature adult learners in particular respond positively to the "learning how to learn" concept and are quick to reject mindless problem sets full of repetitive drill. The goals are likewise applicable to liberal arts

Chp. 4: Student Outcomes and Assessment
– 12 –
courses in mathematics, to linear algebra, and to differential equations. And, since these goals reflect intended student outcomes, they must be reflected in any indicator system. As a preface to what follows, it is important to note (see the methodological commentary that follows after list E) that current methods of gathering information regarding student performance are likely to be completely inadequate for some aspects of performance, e.g., students' ability to communicate mathematically. It is unlikely that ability to communicate will be adequately captured by multiple choice tests or questionnaires! [Of course, questionnaires can provide some information about how frequently students are asked to write "essays" in their mathematics classes, or to give oral reports. However, these are an inadequate proxy for real performance data, which let us know whether students can communicate effectively using mathematics.] In fact, few attempts at change or reform carefully set out their goals in the form of a guideline document, a plan for change, a plan for initiation, a plan for implementation, a plan for assessing progress and making adjustments, and a plan for continuation of the program. Careful planning for indicators should be a major portion of such an overall plan for any reform or initiation of an extant curriculum (Fullan, 1993).
B. As noted above, recent (and evolving!) curriculum frameworks have expanded the scope of what is considered to be mathematical "content." Broadly speaking, a mathematics assessment/indicator system should attempt to capture both the traditional knowledge base of content and the related processes that are discipline specific, such as the following:
• Major facts, concepts, and principles students are expected to learn; • The major procedures and techniques students are expected to know, and the
kinds of computations (with and without technology) they should be able to perform;
• Knowledge about mathematics – its nature and history; • The kinds of reasoning and sense-making in which the students are expected
to engage (e.g., quantitative, spatial, symbolic, relational, probabilistic, logical).
• The kinds of representations students are expected to be able to employ (sketches, tables, graphs, matrices, etc.);
• The kinds of connections, within and outside mathematics, that students are expected to be able to make;
• The ability to communicate (read, write, speak, listen, and model) mathematically.

Chp. 4: Student Outcomes and Assessment
– 13 –
C. As curriculum goals have expanded, students are being asked to engage in a much wider variety of mathematical tasks, and to make greater use of a range of mathematical processes. The collection of such information at the present would provide a baseline for ongoing attempts to strengthen such skills in our students. Some of the kinds of thinking processes students are expected to learn to use, and to demonstrate, are the following:
• Analyzing, interpreting, abstracting; • Evaluating, comparing; • Planning, organizing; • Exploring, experimenting, investigating; • Formulating, conjecturing, hypothesizing; • Designing, making; • Generalizing, justifying, proving; • Reflecting, explaining, summarizing.
D. The expansion of curricular practices has resulted in a much expanded set of products that students are expected to produce in order to do mathematics and to demonstrate their competencies. Some such products are:
• Mathematical models; • Plans or designs; • Pure or applied investigations and reports; • Decisions and justifications for them; • Explanation of concepts; • Routine problem solutions; • Exhibitions of technique; • Proofs and mathematical justifications.
E. There is an expanded set of situations students are expected to be able to deal with, e.g.:
• Pure mathematics problems; • Illustrative applications (such as standard max-min problems, or
conventional applications of linear programming); • Complex real-world situations that must be modeled and "mathematized."

Chp. 4: Student Outcomes and Assessment
– 14 –
F. It should also be noted that new curricula provide students access to new technologies, and that students now work collaboratively, often in extended projects. See for example the Mathematical Contest in Modeling work (Giordano, 1994b). In order to provide an accurate reflection of the nation's mathematical health, NAEP, and collegiate level counterparts, must tap into these dimensions of mathematical performance as well. Something new is happening in the curriculum and the teaching and learning models being employed in framing the undergraduate curriculum in the mathematical sciences. Focus is being placed on the methods used to interface students with the content. The content is changing as the mathematical sciences themselves continue to change and evolve. One way of thinking about the effectiveness of instruction, and about what a particular student learns during the undergraduate years, is through a student growth model. That is, what does a department want of its students as a measure of "added value" related to their study and experiences in a collegiate program? How should students' approach to the subject change as a result of their undergraduate experience? What new skills should they develop of a process variety (computing, investigating, proving,...)? A Brief Commentary on Methods It is clear that significant changes in current assessments and indicators are necessary if an assessment is to provide adequate measures of the knowledge base as described above. For all of the items described above, the technology is within our grasp – but implementation requires a different use of matrix sampling or scoring authentication and verification than currently employed. The main issues here are related to cost. Assessments like those produced by the Balanced Assessment project and used by the New Standards project at the secondary level tap into the relevant content, and a comparable effort at the undergraduate level (though requiring a fair amount of work) could produce an item bank at the collegiate level. With matrix sampling techniques, it is possible to obtain samples of student performance on the full range of tasks discussed above. Instead of working a large number of multiple-choice questions, a student may work three fifteen-minute tasks or one forty-five-minute task. But the relevant data can be gathered. The main costs at this point are in analyzing the data. (See the section on practices for a discussion of student projects. These too can be authenticated with reasonable expenditures of time and energy.) 4.1.2 Category 2: Problem Solving Strategies

Chp. 4: Student Outcomes and Assessment
– 15 –
This area is under-developed, both with regard to instruction and assessment – but the theory is in place, and what needs to be done is "merely" a matter of detail. For a recent summary of the state of the art, see Schoenfeld (1992). The brief discussion that follows draws heavily on that article and the author's previous work (Schoenfeld, 1985). We consider three issues:
(1) the state of knowledge regarding problem solving strategies; (2) techniques for assessing student competency at the implementation of such
strategies; (3) relevant information about instructional practices.
1. The state of knowledge regarding problem solving strategies To sum things up in brief: A wide range of problem solving strategies has been identified, and agreement seems to be forming that the methodology for delineating and teaching such strategies is in place. The indications are (Schoenfeld, 1985; Silver, 1985) that students can learn to use these more carefully delineated strategies. Generally speaking, studies of comparable detail have yielded similar findings. Silver (1979, 1981), for example, showed that "exploiting related problems" is much more complex than it first appears. Heller and Hungate (1985), in discussing the solution of (routine) problems in mathematics and science, indicate that attention to fine-grained detail, of the type suggested in the AI work discussed by Newell (1983), does allow for the delineation of learnable and usable problem solving strategies. Their recommendations, derived from detailed studies of cognition: (a) make tacit processes explicit (b) get students talking about processes; (c) provide guided practice; (d) ensure that component procedures are well learned; and (e) emphasize both qualitative understanding and specific procedures. The recommendations appear to apply to heuristic strategies as well as to the more routine techniques Heller and Hungate discuss. Similarly, Rissland's (1985) "tutorial" on AI and mathematics education points to parallels, and to the kinds of advances that can be made with detailed analyses of problem solving performance. There now exists the base knowledge for the careful, prescriptive characterization of problem solving strategies. (Schoenfeld, 1992, p. 354)
2. Techniques for assessing student competency at implementing problem solving strategies There are a variety of techniques available for examining students' problem solving competency. Most if not all of these techniques require that students work on extended

Chp. 4: Student Outcomes and Assessment
– 16 –
tasks (Dossey, Mullis, and Jones, 1993); most require a substantive reading rather than a simple mechanical scoring algorithm; and some rest on videotape analyses. While using such tasks would be a change from most current procedures, (a) it is in fact a straightforward matter to score such tasks, and (b) a matrix sampling approach makes it quite reasonable to have a student work only one or two problems during an hour of assessment time. What follows is a brief description of some techniques for tapping into aspects of problem solving performance. Details on many of these techniques can be found in Schoenfeld (1985).
A. Where there is an interest in students' ability to employ particular strategies, problems can be used which yield to those strategies. For example various carefully selected problems can be used to explore students' ability to seek patterns or to see whether students draw diagrams, establish subgoals, examine related problems, explore analogies, etc. Instructions given to students can enhance the likelihood of seeing student use of problem solving strategies. For example, one set of instructions is as follows: "We are interested in everything you think about as you work on these problems, including (a) things you try which don't work, (b) approaches to the problem you think might work but didn't have the time to try, and (c) the reasons why you did." Students can work the tasks with a pen. This provides a record of various approaches taken.
B. Students can be given problems with the specific request that those problems be solved using specific techniques. ("Solve this problem by...")
C. Students can be asked to plan solutions, or asked what methods they think might actually be useful to solve the given problems. (Though it is reductive, one could imagine a multiple choice version of some such tasks, i.e., "which of the following methods seems relevant to the solution of the following problem..."
3. Relevant information about instructional practices There is with regard to problem solving strategies (as in many other areas) an "opportunity to learn" issue: we need to know if such strategies are being taught. Such issues will be revisited in the section on practices but it is worth noting that some such information exists for secondary classrooms and programs in current versions of NAEP publications (Dossey, Mullis, Gorman, & Latham, 1994). Here is one summary (Lindquist, Dossey, & Mullis, 1995, p. 49):

Chp. 4: Student Outcomes and Assessment
– 17 –
NAEP's 1992 reports from students and their teachers show that no real progress has been made in shifting the instructional atmosphere in the mathematics classrooms to one in which active learning and in-depth problem solving are emphasized., Consistent with considerable research about effective learning and teaching, the NCTM Standards recommend classrooms in which students actively solve real-world problems. The emphasis is on communication among students, group work, and using mathematical tools. Assessment is integrated with instruction. According to students and their teachers, textbooks and worksheets remain the mainstay of instruction. Almost all students solve problems from these sources on at least a weekly basis. In contrast, the majority of the students are unlikely to participate in group work or to have the opportunity to work with mathematics tools (e.g. rulers, geometric shapes, or measuring instruments) as often as once a week. Students and their teachers overwhelmingly agree that students rarely work on projects or write reports. Students apparently spend a fair amount of their time discussing mathematics in their classrooms but relatively little time writing about mathematics ideas. Again, both students and their teachers agreed that students were infrequently asked to write even a few sentences about how to solve a mathematics problem. Only about one-fifth of the students do so as frequently as once a week. Students reported frequent testing during mathematics class. Two-fifths of the eighth and twelfth graders reported weekly testing. Unfortunately, students reported that these tests rarely asked them to provide extended solutions to problems not worked on previously. Students have great difficulty applying mathematics to new situations. This may be because they are rarely asked to do so as part of their school activities and assessments. Teachers reported an overreliance on using problem sets for assessment; nearly all students work on problem sets at least monthly. Both multiple-choice tests and written responses were used sparingly, and the more innovative assessment techniques were hardly used at all. Teachers reported using such techniques as portfolios, projects, and presentations–the approaches indicated by research to be the most effective– for only about one-fifth of the students on even a monthly basis.
According to this and other NAEP-based reports, there is a predominance of textbooks, workbooks, and ditto sheets in mathematics classrooms; lessons are generically of the type Burkhardt (1988) calls the "exposition, examples, exercises" mode. Additional information is found in the publications concerning the National Adult Literacy Survey (Kirsch, et. al, 1994) and various policy reports on adult education (Barton and Jenkins,

Chp. 4: Student Outcomes and Assessment
– 18 –
1995). Unfortunately, a knowledge base comparable to that provided for K-12 by NAEP does not exist at the undergraduate level.
4.1.3 Category 3: Self-monitoring and self-regulation Self-regulation or monitoring and control is one of three broad arenas encompassed under the umbrella term metacognition. For a broad historical review of the concept, see Brown (1987); for discussions within mathematics, see Schoenfeld (1985, 1992). In brief, the issue is one of resource allocation during cognitive activity and problem solving. During the 1970's, research in at least three different domains – the developmental literature, artificial intelligence, and mathematics education – converged on self-regulation as a topic of importance. In general, the developmental literature shows that as children get older, they get better at planning for the tasks they are asked to perform, and better at making corrective judgments in response to feedback from their attempts. Over roughly the same time period, researchers in artificial intelligence came to recognize the necessity for "executive control" in their own work. As problem solving programs (and expert systems) became increasingly complex, it became clear to researchers in AI that "resource management" was an issue. Solutions to the resource allocation problem varied widely, often dependent on the specifics of the domain in which planning or problem solving was being done. But the main theme was simple: complex problem-solving requires efficient management, including the "on-line" determination of whether one was making reasonable progress, and the modification of one's plans if there was evidence that one was not.
Analogous findings were accumulating in the mathematics education literature. In the early 1980's, Silver (1982) and Silver, Branca, and Adams (1980), and Garofalo and Lester (1985) pointed out the usefulness of the construct for mathematics educators; Lesh (1983, 1985) focused on the instability of students' conceptualizations of problems and problem situations, and of the consequences of such difficulties. Speaking loosely, all of these studies dealt with the same set of issues regarding effective and resourceful problem solving behavior. Their results can be summed up as follows: it's not just what you know; it's how, when, and whether you use it. Here are three possibilities for assessment.
A. Students can be given the mathematical analogies of tasks such as those used by Karmiloff-Smith – tasks that call for a fair amount of planning – and their work can be scored according to a pre-established protocol.
B. Students can be asked questions about the tasks they work on an assessment. For example (Schoenfeld, 1992), a series of questions such as

Chp. 4: Student Outcomes and Assessment
– 19 –
1. Have you ever seen a problem like this before? 2. Have you seen a closely related problem before? 3. Did you have an idea of how to start the problem? 4. Did you plan your solution or plunge into it (scored on a Likert scale)? 5. Did you feel your work on the problem was organized or disorganized
(scored on a Likert scale)? 6. Please rate the overall difficulty of the problem (scored on a Likert scale).
provides indications of student perceptions of their thinking processes. These can be contrasted with the kinds of data provided in C.
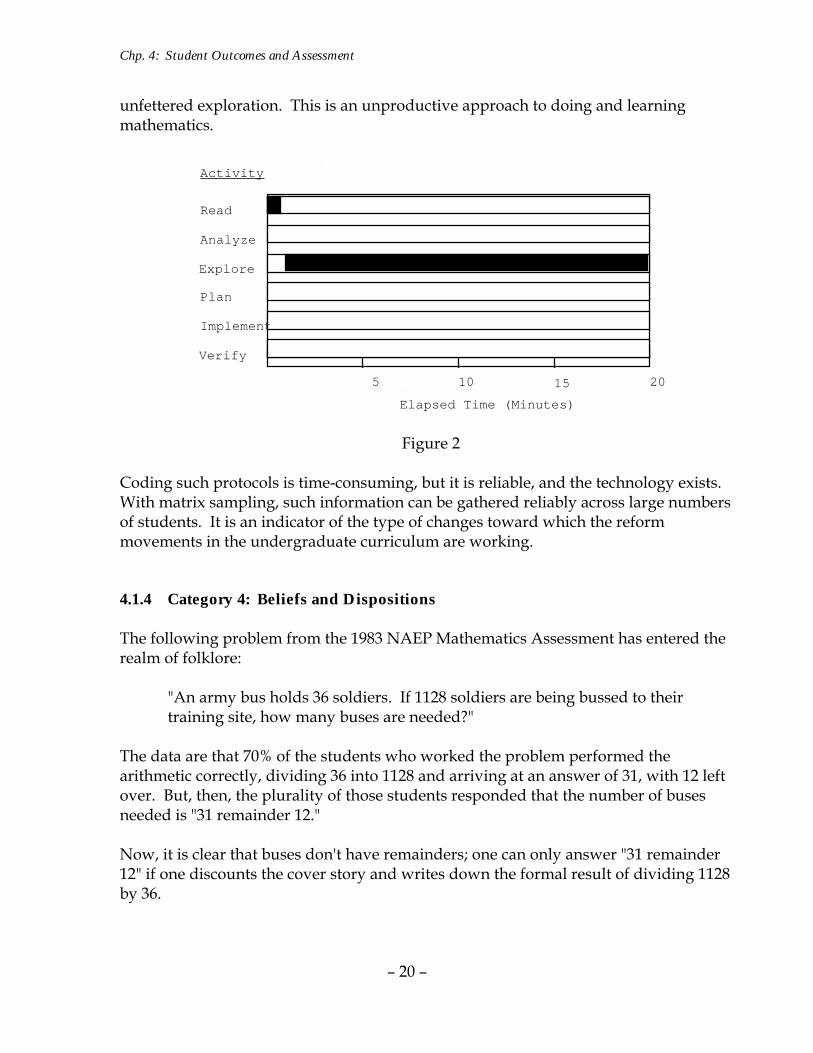
C. There is a well-established methodology (Schoenfeld, 1985) for analyzing videotapes of people engaged in problem solving, a methodology that provides summaries of the degree to which those people engage in effective monitoring and self-control. Figures 1 and 2 show graphical analyses of effective and ineffective problem solving sessions, respectively. They represent observations of the same individual at the end and beginning, respectively, of a mathematics course focusing on mathematical problem solving. Note the changes observed in the individual's behavior and approach to problem solving in mathematical settings. Effective monitoring and self-control are revealed in Figure 1 in two ways: (1) the presence of analysis and planning, as opposed to extended periods of exploration only; and (2) the problem solver's overt monitoring of the problem state, indicated by the triangles.
Read
Analyze
Explore
Plan
Implement
Verify
Activity
Elapsed Time (Minutes)
5 10 15 20
Figure 1
Note the constant self-monitoring of the individual's work by the individual in Figure 1. In rather stark contrast, Figure 2 shows no self-monitoring, and twenty minutes of
Chp. 4: Student Outcomes and Assessment
– 20 –
unfettered exploration. This is an unproductive approach to doing and learning mathematics.
Read
Analyze
Explore
Plan
Implement
Verify
Activity
Elapsed Time (Minutes)
5 10 15 20
Figure 2 Coding such protocols is time-consuming, but it is reliable, and the technology exists. With matrix sampling, such information can be gathered reliably across large numbers of students. It is an indicator of the type of changes toward which the reform movements in the undergraduate curriculum are working. 4.1.4 Category 4: Beliefs and Dispositions The following problem from the 1983 NAEP Mathematics Assessment has entered the realm of folklore:
"An army bus holds 36 soldiers. If 1128 soldiers are being bussed to their training site, how many buses are needed?"
The data are that 70% of the students who worked the problem performed the arithmetic correctly, dividing 36 into 1128 and arriving at an answer of 31, with 12 left over. But, then, the plurality of those students responded that the number of buses needed is "31 remainder 12." Now, it is clear that buses don't have remainders; one can only answer "31 remainder 12" if one discounts the cover story and writes down the formal result of dividing 1128 by 36.

Chp. 4: Student Outcomes and Assessment
– 21 –
How could so many students do this? They could, if they believed that the cover story was irrelevant – that when doing mathematics problems, one pulls out the numbers, performs the operation, and writes down the answer. This is an example of a belief about mathematics – and one that affects mathematical performance. Another is that all problems can be solved in five minutes or less, if you know the relevant techniques. As Lampert writes:
Commonly, mathematics is associated with certainty; knowing it, with being able to get the right answer, quickly (Ball, 1988; Schoenfeld, 1985; Stodolsky, 1985). These cultural assumptions are shaped by school experience, in which doing mathematics means following the rules laid down by the teacher; knowing mathematics means remembering and applying the correct rule when the teacher asks a question; and mathematical truth is determined when the answer is ratified by the teacher. Beliefs about how to do mathematics and what it means to know it in school are acquired through years of watching, listening, and practicing. (Lampert, 1990, p. 5)
Table 1 provides a list of beliefs attributed to students from various sources in the literature. Some of these findings come from classroom studies (e.g., Lampert's and Schoenfeld's); some from international comparisons (e.g., Stevenson, Stigler, & Lee's work); some of it (e.g., "mathematics is mostly memorizing") comes from NAEP questionnaire data; yet others come from a variety of attitude and belief surveys given college students.
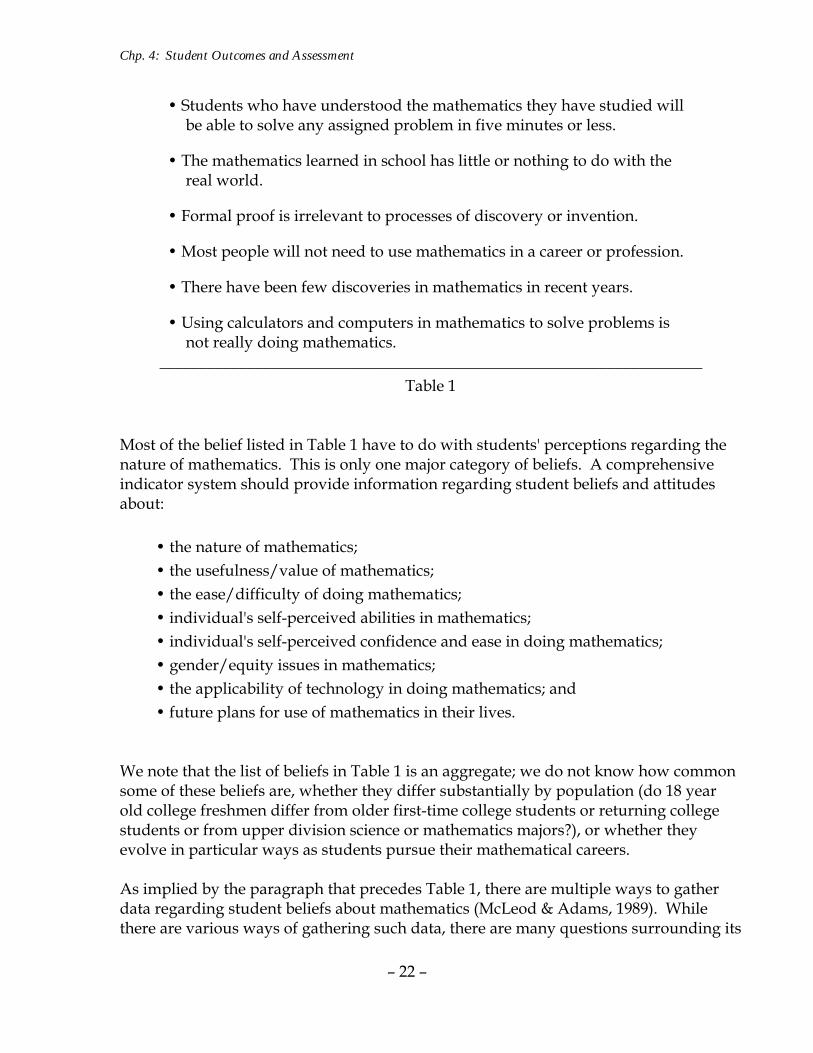
____________________________________________________________________ Typical beliefs about the nature of mathematics
• Mathematical talent is innate – "either you have it or you don't," and effort doesn't make much of a difference.
• Mathematics problems have one and only one right answer.
• There is only one correct way to solve any mathematics problem – usually the rule the teacher has most recently demonstrated to the class.
• Ordinary students cannot expect to understand mathematics; they expect simply to memorize it, and apply what they have learned mechanically and without understanding.
• Mathematics is a solitary activity, done by individuals in isolation.
Chp. 4: Student Outcomes and Assessment
– 22 –
• Students who have understood the mathematics they have studied will be able to solve any assigned problem in five minutes or less.
• The mathematics learned in school has little or nothing to do with the real world.
• Formal proof is irrelevant to processes of discovery or invention.
• Most people will not need to use mathematics in a career or profession.
• There have been few discoveries in mathematics in recent years.
• Using calculators and computers in mathematics to solve problems is not really doing mathematics.
____________________________________________________________________ Table 1
Most of the belief listed in Table 1 have to do with students' perceptions regarding the nature of mathematics. This is only one major category of beliefs. A comprehensive indicator system should provide information regarding student beliefs and attitudes about:
• the nature of mathematics; • the usefulness/value of mathematics; • the ease/difficulty of doing mathematics; • individual's self-perceived abilities in mathematics; • individual's self-perceived confidence and ease in doing mathematics; • gender/equity issues in mathematics; • the applicability of technology in doing mathematics; and • future plans for use of mathematics in their lives.
We note that the list of beliefs in Table 1 is an aggregate; we do not know how common some of these beliefs are, whether they differ substantially by population (do 18 year old college freshmen differ from older first-time college students or returning college students or from upper division science or mathematics majors?), or whether they evolve in particular ways as students pursue their mathematical careers. As implied by the paragraph that precedes Table 1, there are multiple ways to gather data regarding student beliefs about mathematics (McLeod & Adams, 1989). While there are various ways of gathering such data, there are many questions surrounding its

Chp. 4: Student Outcomes and Assessment
– 23 –
interpretation. Are the beliefs independent or dependent? What are the underlying forces in the shaping and nurturing of such beliefs? In what ways can schooling serve to shape positive beliefs about mathematics and its practice/value? Initial work is currently being done in the calculus reform movement to acquire information about student beliefs as they change and emerge in calculus programs (Ferrini-Mundy, in progress). A. Questionnaire data. Some data on beliefs already exist (Dossey, Mullis, Gorman, & Latham, 1994; McKnight, et al, 1987). The one caveat that must be issued here is that all questionnaire data must be taken with a grain of salt (or, better, triangulated against other data sources): people can hold apparently contradictory beliefs, and the resolution of the conflict depends on having appropriate contextual knowledge. (A non-mathematics example: the vast majority of Americans believe that schools are in bad shape, but that the school their children attend is just fine.) For example, the 1983 NAEP revealed that significant majorities of those polled believed that (1) math helps you think, and (2) math is mostly memorizing. The apparent conflict disappears when one understands that the comment about mathematics and thinking is largely a reflection of social rhetoric, while the comment about memorization is largely a reflection of students' classroom experiences. B. One can use tasks designed to elicit particular kinds of behavior, e.g., tasks like the "remainder" problem above. C. One can make videotapes of students working such problems, and conduct follow-up interviews with the students regarding both their overt beliefs and the reasons that they did why they did on problem solving tasks. In particular (See Category 5) , there exist data and methods from some of the cross-cultural studies (e.g., Stevenson, Stigler, & Lee's work, and from the upcoming Third International Mathematics and Science Study (TIMSS)) suggesting some dimensions of beliefs that should be explored. At a more fundamental level, issues regarding the origins of beliefs (in experience and in culture) are thorny, and means of triangulating on their presence and their impact on performance are not well developed. This is an arena that could use more work, via special studies. 4.1.5 Category 5: Practices and Contextual Issues. The linkage between beliefs and practices is close. To recall Lampert's comment, "Beliefs about how to do mathematics and what it means to know it in school are acquired through years of watching, listening, and practicing." The students'

Chp. 4: Student Outcomes and Assessment
– 24 –
experiences, indeed the nature of schooling, are also shaped by cultural assumptions. Indeed, the cross-cultural work mentioned above highlights the fact that some things Americans have taken for granted about educational practice are assumptions, not matters of fact. This undervaluing and underutilization of the mathematical sciences by American society only increases the difficulty of assisting students to maximize their potential. Some evidence of these contextual issues emerging from the literature are: • Societal beliefs about the importance of mathematics and the need to focus on it in the school curriculum. Students in some Asian countries may receive twice the number of hours of mathematics instruction per year than their American counterparts. Yet, parents and administrators, when asked where there needs to be more emphasis and harder work, will respond "mathematics." In contrast, American will typically respond that adequate attention is devoted to mathematics instruction, and that more time should be devoted to reading (Stevenson, Lee, and Stigler, 1986). • Lesson coherence and emphases on thinking rather than rote skills. Cross-cultural research indicates that in typical American classes, as much as half of a one-hour mathematics lesson may be lost to activities other than mathematics; that lessons are disjointed, with as many as half a dozen different topics being covered; that students spend typically large amounts of time working a series of small exercises, which are often redundant. In contrast, Asian classes tend to be much more coherent, with extended and thematic discussions of a small number of carefully chosen problems. (Note: some of these practices correspond to the goals of some calculus reform projects as well. (Douglas, 1986)) There are numerous facets of instruction to be discussed: opportunity for student initiative, for collaborative work, for work on extended projects (rather than a multiplicity of exercises), a focus on connections rather than memorization of procedures, etc. Data on all of these is required to get a good sense of American mathematical instructional practice. Only initial attempts have been started to develop such indicators at the undergraduate level (Becker and Pence, 1994). In the U.S., there is a growing literature on mathematics instruction that is designed to create "communities of mathematical practice." Yackel and Cobb and their colleagues (1990) have explored issues of classroom discourse and community in lower elementary classrooms. Lampert (1989) and Ball (1988) provide examples of such communities (and extensive analyses thereof) at the upper elementary level, Bransford, et al. (1988) at the middle school level, and Schoenfeld (1985) at more advanced levels. (There are, as well, analogs in physics, such as Minstrell's (1989) work.) Hence, although this work is still in early conceptual stages, there are a fair number of techniques available for examining practice, and for delineating ways in which classroom practices shape mathematical understandings. Here we describe four approaches.

Chp. 4: Student Outcomes and Assessment
– 25 –
A. Using tasks that call for particular mathematical practices. Say, for example, that one is interested in mathematical communication. Here is a task used by the California Assessment Project Here is one example of an interesting question type, taken from A question of thinking (Pandey, 1989).
Imagine you are talking to a student in your class on the telephone and want the student to draw some figures. [They might be part of a homework assignment, for example]. The other student cannot see the figures. Write a set of directions so that the other student can draw the figures exactly as shown below.
To adequately answer this question, one must both understand the geometric representation of the figures and be able to communicate using mathematical language. Data on student work indicated that only 15% of California's graduating seniors could do a good job on this task – thus revealing a serious problem. (Indeed, the problem was that students were not being asked to communicate mathematically, so that they never developed the relevant skills.).
B. Questionnaires. Students and teachers can be asked to delineate the percentage of class time devoted to collaborative work; to communication of meaningful results, orally and in writing; to conceptual issues; to debate and dialogue; to working on extended problems and/or projects; etc. An inventory of typical student work can also be compiled (Dossey, Mullis, Gorman, & Latham, 1994).
C. Student portfolios. At randomly selected schools, portfolios of student work can be collected (Stenmark, 1991). Analytic descriptions of the contents can be compiled, providing an implicit picture of instructional practices. (An extreme case: if the only available student materials are collections of "homeworks" consisting of "exercises number 1 through 35, odd," one gets one picture of instruction. If students have available extended essays and project reports, then one gets a different picture of the nature of students' mathematical experiences.)
D. Videotape analyses and/or classroom visits. As indicated above, there is a growing body of work on the analysis of classroom practices. Do students engage in

Chp. 4: Student Outcomes and Assessment
– 26 –
collaborative work? One can find out by sitting in on classrooms, or watching videotapes. Do they know how to engage in collaborative work? It is easy to find out – one need only select four students from a classroom at random and ask them to work together on a problem. One can tell in the first three minutes of their work whether they have had experience working as members of collaborative groups.
Speaking more broadly, there is a growing body of expertise in the analysis of live or videotaped instruction, for purposes of identifying instructional practices and their consequences. As mentioned above, Ball, Bransford, Cobb, Lampert, and Schoenfeld have all done some such analyses. In addition and perhaps more directly germane, (a) James Stigler has been doing work for the Third International Mathematics and Science Study in which he is analyzing videotapes of classroom instructional practices from various nations; (b) John Frederiksen and colleagues did extensive work for the National Board for Professional Teaching Standards in which he delineated analytical frames for examining teaching practices; and (c) Joan Ferrini-Mundy has overseen an Exxon-funded project for the National Council of Teachers of Mathematics, looking at ways "reform practices" in line with the NCTM Standards are or are not being implemented in ostensibly "reform" classrooms." Each of these people would be a valuable resource for characterizing the kinds of information that can reliably be obtained from samplings of classroom practices. 4.1.6 Concluding remarks This section has offered one way of characterizing mathematical cognition – not the only one, of course, but one that has gained a fair amount of acceptance over the past decade. For the most part, the intention here has been to "describe the problem space:" to outline the main dimensions of mathematical competence that one would like to be able to characterize – at all levels. Of course, (a) we have not yet specified the specific mathematical content that one would like to capture, at various levels (see the next section of this chapter) and (b) this characterization is ideal, in that some of the information is quite expensive to gather and we do not yet have reliable techniques for gathering other information. Needless to say, serious compromises will have to be made in the implementation of any reasonably cost-effective indicator system – but one should understand the ideal, in order to understand just how serious various compromises are. 4.1.7 Recommendations: Initial pilot work should be undertaken to develop ranges of competencies that describe undergraduate mathematics experience in terms of the:

Chp. 4: Student Outcomes and Assessment
– 27 –
• knowledge base; • process strategies, heuristics, used; • evidence of student metacognitive changes; • beliefs and dispositions held by students and faculty; • instructional practices, cultural values, and educational context.
Alternate forms of developing a knowledge based might be considered, drawing on NAEP models, TIMSS models, or student growth models. The model developed should carefully avoid the problem of discretizing the very facets and losing their interconnectedness. Once a workable model(s) has been developed, a sampling plan should be developed for employing that model in assessing student outcomes in undergraduate mathematics at two- and four-year colleges and research universities. 4.2 ISSUE 2
WHAT LEVELS OF MATHEMATICAL PERFORMANCE (FROM REMEDIAL ARITHMETIC THROUGH PRECALCULUS TO CALCULUS AND BEYOND) MIGHT PROFITABLY BE ASSESSED, FOR WHICH STUDENTS? The phrase "collegiate mathematics" covers the spectrum from remedial arithmetic through college algebra through precalculus, and then the classic lower division sequence starting with calculus. In addition, "calculus" is now foliated and "precalculus" means many different things to many different people. Hence the first major issue with regard to the establishment of an indicator system is the decision about "assessment targets:" at what levels will one try to seek information? Here are the three possible approaches: A. Employ assessments for all the "course plateaus" widely taught at the college level. B. Employ assessments at various plateau levels. For example, one might decide to
explore student competency at:
• basic skills (rudimentary abilities at the level, say, of the NAEP high school assessments)
• "high literacy" for graduating high school students (see, e.g., the kinds of tasks that have been produced by the Balanced Assessment project, or the more complex tasks used by the New Standards Project)

Chp. 4: Student Outcomes and Assessment
– 28 –
• calculus (whether "reform" or not) • lower Division (multivariate, linear algebra)
C. Develop a series of long-term interactive projects spaced across the curriculum which require careful reflective thought from students.
Approach A is cumbersome and expensive. It may provide both more and less information than one would like – more in the sense that fine-grained distinctions at each course plateau are not likely to be necessary or useful, and less in that the data gathered do not necessarily provide relevant information about particular groups of people in whom we should be interested – e.g., those who intend to be mathematics teachers. Approach B cuts down on cumbersomeness and expense, and is much more feasible on those grounds. However, it too is silent on the issue of mathematics constituencies --- the question of which students should know which mathematics, and how much of it they do know. A truly informative indicator system would address such issues as well. Approach C requires coordination and consistent attention to commonly shared goals and practices by a faculty. It also requires faculty members to have a strong understanding of the content of each of the courses in the curriculum if the interaction and connections are to be maximized. Hence it is essential to return to Question A in the introduction to this chapter: In which student populations are we interested, and what kinds of information do we wish to gather about them? It seems reasonable to consider the separate needs of the following groups identified in the introduction:
1. the population at large (where issues of broad mathematical, scientific, and
technological literacy are paramount); 2. those who will use some amount of mathematics for technical careers
(including career tracks in two-year colleges); 3. those who use mathematics in the service of other majors or disciplines; 4. those who will teach mathematics at the elementary or secondary level; 5. those who will go on to careers in mathematics.
The balance of this section will delineate the kinds of information that would be appropriate to gather about each of these populations. Here, as in the discussion of Issue 1, we shall focus on the kinds of information that would be of greatest use; issues of efficiency, or where one might use proxies effectively, will be dealt with afterwards. It should be noted, however, that much of the fine-grained information that would be expensive to gather at the national level is also very useful at the local level – e.g., institutions invested in calculus reform would want for themselves the kinds of

Chp. 4: Student Outcomes and Assessment
– 29 –
information about the effectiveness of instruction that would also be useful to summarize for purposes of national indicators, and students themselves will profit from good feedback. Hence, with a systemic approach – encouraging institutions to gather information that is useful to them, and then collecting such information – it might be possible to tap into some rich data sources at relatively small expense. What we propose is a system of indicators targeted to populations, with information gathered by matrix sampling (as is the current NAEP). It may not be well understood, but the fact is that no single student takes the whole NAEP mathematics exam; students take perhaps 45 minutes to an hour of NAEP questions, and data from these items are combined through statistical imputation with data from others' performance on these and the remaining items in the NAEP item pool to produce summary scores for the entire populations. In sum: we recommend that members of the different populations should be identified, and then performance data related to those particular populations should be gathered. 4.2.1 Indicators For Group 1: The Collegiate Population At Large We note by way of introduction that the issue of "quantitative literacy" has, periodically, been an issue of great interest at a large number of academic institutions; it has also, for the most part, been unresolved. Institutions of higher education vary in the mathematics they require for admission, and for which they will give credit. Some offer at most one pre-calculus course, for which credit may or may not given. Others offer a long sequence of courses, starting with "pre-algebra" and working their way toward college-level mathematics. Various institutions have tried, in various ways, to define "quantitative literacy" requirements or interdisciplinary statistics programs (BMS, 1994) – often by having students take one of a list of courses that meet the requirement. Such attempts have often taken place in a policy vacuum, without there being adequate reference points for a comparison. Hence attempts to develop or disseminate indicators might well have a large constituency. Others are attempting to change this long term practice of a course to guarantee quantitative literacy by establishing goals, similar to writing goals, for the undergraduate experience to guarantee some modicum of quantitative literacy in the student body by time of matriculation (CUPM, 1998). This report calls for experiences to guarantee that students are able to:
• interpret mathematical models such as formulas, graphs, tables, and schematics, and draw inferences from them.
• represent mathematical information symbolically, visually, numerically, and verbally.
• use arithmetical, algebraic, geometric, and statistical methods to solve problems.

Chp. 4: Student Outcomes and Assessment
– 30 –
• estimate and check answers to mathematical problems in order to determine reasonableness, identify alternatives, and select optimal results.
• recognize that mathematical and statistical methods have limits. (CUPM, 1998) For the population at large, it seems reasonable to focus on two levels, which might be called "basic skills" and "mathematical or statistical literacy" respectively. There is some question as to whether one would wish to separate these two. Given a proper definition of mathematical or statistical literacy, basic skills play a minor but contributory role: one can check for their presence as students engage in tasks that are contextually meaningful. (That is, there is no need to have a separate test that asks students to factor algebraic expressions; a proper literacy test could rest on such foundations, and see whether student can perform the relevant algebraic manipulations when needed in the service of other things.) Indeed, the separation of basic skills from mathematical literacy has some negative entailments. Basic skills tests tend to reify the importance of decontextualized symbolic skills, perhaps giving them a higher profile than they should have. And, such assessments can be misused by those who believe in rigid hierarchies of mathematical thinking, as tests of "prerequisite skills." This kind of misuse can block students from mathematics in which they might profitably engage. On the other hand, such skills are easy to assess, and there already exist assessments of them – e.g., the NAEP mathematics exams or, as a proxy, the SAT/ACT Mathematics exams. In addition, it might well be possible to use aspects of the National Adult Literacy Survey (NALS). NALS, while also not intended as a collegiate assessment, provides information about various uses of mathematics – e.g. in interpreting graphs, filling out forms, etc. These "baseline competencies" expand the scope of competencies explored in the other two exams (Kirsch et al., 1994). Here we turn our attention to the kinds of indicators that might be used to determine general mathematical literacy – the kinds of literacy that might be appropriate for two- or four-year college graduates who do not specialize in areas that demand specific mathematical content. There is relevant antecedent intellectual work, and the potential (modulo cost, of course) to put a system in place. The ideas and examples given here are drawn from two main sources: the Balanced Assessment Project and the New Standards Project. The Balanced Assessment Project has compiled a task bank of assessment items that reflect the broad spectrum of mathematical competencies described in the first part of this chapter. Many of the tasks developed by Balanced Assessment, while targeted for 10th or 12th graders, tap into the broad kinds of mathematical literacy required of college graduates. Indeed, a significant number of the Balanced Assessment items have been used by the New Standards Project, which has a network of agreements with States and large school districts, to (a) provide "reference examinations" for purposes of standardization, and (b) develop systems by which local assessments are calibrated

Chp. 4: Student Outcomes and Assessment
– 31 –
against the reference exams. (In this way, local information can be used appropriately for local accountability and enrichment purposes, while data are also provided for larger-scale statistical purposes.) A comparable network, using a sampling at the college level, could provide relevant information for a broadly-based indicator system. As an indication of the kinds of mathematical competencies that one might explore with an appropriate set of items, we provide and discuss four examples (each beginning on a new page).

Chp. 4: Student Outcomes and Assessment
– 32 –
Example 1: A simple task designed to explore students' abilities at mathematical modeling using simple linear functions.
SHOPPING CARTS
The diagram below shows a drawing of a single shopping cart. It also shows a drawing of 12 shopping carts that have been "nested" together.
The drawings are 124 th real size.
length
(a) Create a rule that will tell you the length S of storage space needed for carts when you know the number N of shopping carts to be stored. You will need to show how you built your rule; that is, we will need to know what information you drew upon and how you used it.

Chp. 4: Student Outcomes and Assessment
– 33 –
(b) Now create a rule that will tell you the number N of number of carts that will fit into a space S meters long. Brief Discussion This task calls for simple modeling using linear functions, as well as working from scale diagrams. To answer part (a), the students must realize that there is a linear relationship that determines overall length. When a new cart of length L is inserted into a chain of carts, there is an "inserted part" I and a non-inserted part X. Only the non-inserted part adds length to the chain; hence a chain of N carts has length (L + (N-1)X). The values of L and X must be determined by using a proportionality relationship, with the relevant proportions being measured off the scale diagram. To answer part (b), the students need to invert the function determined in part A, and deal with "greatest integer" functions. They also need to explain their answers, and to make reasonable judgments about the degree of precision appropriate for the task.

Chp. 4: Student Outcomes and Assessment
– 34 –
Example 2: A data analysis task – making sense of "real world" information.
THE TAXICAB PROBLEM
You work for a business that has been using two taxicab companies, Company A and Company B. Your boss gives you a list of (early and late) "Arrival times" for taxicabs from both companies over the past month. The list is given below. Your job is to analyze those data using charts, diagrams, graphs, or whatever seems best. You are to: i. make the best argument that you can in favor of Company A; ii. make the best argument that you can in favor of Company B; iii. write a memorandum to your boss that makes a reasoned case for choosing one company or the other, using the relevant mathematical tools at your disposal.
Company A Company B 3 min 30 secs Early 3 mins 45 sec Late 45 sec Late 4 mins 30 secs Late 1 min 30 secs Late 3 mins Late 4 mins 30 secs Late 5 mins Late 45 sec Early 2 mins 15 sec Late 2 mins 30 secs Early 2 mins 30 sec Late 4 mins 45 secs Late 1 min 15 secs Late 2 mins 45 secs late 45 secs Late 30 secs Late 3 mins Late 1 min 30 secs Early 30 sec Early 2 mins 15 secs Late 1 min 30 secs Late 9 mins 15 secs Late 3 mins 30 secs Late 3 mins 30 secs Late 6 mins Late 1 min 15 secs Late 4 mins 30 secs Late 30 secs Early 5 mins 30 secs Late 2 mins 30 secs Late 2 mins 30 secs Late 30 secs late 4 mins 15 secs Late 7 mins 15 secs Late 2 mins 45 secs Late 5 mins 30 secs Late 3 mins 45 secs Late

Chp. 4: Student Outcomes and Assessment
– 35 –
3 mins Late 4 mins 45 secs Late

Chp. 4: Student Outcomes and Assessment
– 36 –
Brief Discussion The task here is to make sense of "messy" real-world data. The data may be analyzed and graphed as follows.
4 3 2 1 0 1 2 3 4 5 6 7 8 9 10
Minutes early Minutes late
Frequency
������������������������������������
���������������������������������������������
������������������������������������������
����������������������������������������������������
������������������������������������������������������������������������
������������������������������������������������������������
������������������������������������������������������������������������������������
������������������������������������������������
����������������������������������������������������������������
������������������������������������������
������������������������������������
������������������������������������������
4
5
1
2
3
4 3 2 1 0 1 2 3 4 5 6 7 8 9 10
Minutes early Minutes late
Frequency
���������������������������������������
������������������������������������
���������������������������������������������������������������������������
������������������������������������������������������������������������������������������������������������������������������
������������������������������������������������������������������������������������������������������������������������������������
������������������������������������������������������������������������������������������������������������������������������������������������
����������������������������������������������������������������������
������������������������������������������
4
5
1
2
3
Company A
Company B
Company A Company B Mean 2 mins 3 secs 3 mins 14 secs Median 1 min 53 secs 3 mins 15 secs Range 12 mins 45 secs 6 mins 30 secs SD 3 min 11 secs 1 min 40 secs From this mode of data presentation it is easy to see that Company A's cabs are earlier on average than Company B's, but they are less consistent in their arrival times. It's better to order a cab from Company B – but order it for 5 minutes early, so it arrives when you need it. This, however, is a "clean" solution and not at all typical of what student produce -- often barely relevant tables or graphs considering the percentage of time one company is early or late, etc. The problem taps into student's ability to choose appropriate representation; to use them well; to draw sound conclusions from them;

Chp. 4: Student Outcomes and Assessment
– 37 –
and to make a good case based on their analyses.

Chp. 4: Student Outcomes and Assessment
– 38 –
Example 3: A more formal algebraic task requiring the development and use of a formula, as well as clear exposition.
TRI-TEX LOGO (MSEB, 1993b)
Tri-Tex Corporation has the following logo:
yellow
red
blue
It's going to put a large-scale mosaic of the logo on the side of its corporate headquarters building. A 2' x 2' scale model of the logo uses: 144 yellow tile pieces 144 blue tile pieces 288 red tile pieces. When the logo is placed on the side of the building, it will also have a border which consists of a single band of long black tiles. It takes 40 of the black tiles to make a border for the 2' x 2' scale model. The design committee has to send an order to the purchasing department. You're writing the memo for the design committee. • How many tiles of each color will the purchasing department have to order if the full-scale mosaic is 4' x 4'? What if it's 6' x 6'? • Tri-Tex's president says he'll decide later just how big the mosaic will be, but he wants everything set up in advance so the purchasing department can send out the order as soon as he makes up his mind. Your job is to write a two-part memo to the purchasing department. (a) In part 1 of the memo, tell how the purchasing department can do a simple calculation to find out how many yellow, blue, red, and black tiles they need to purchase, for any size design. The instructions should be as simple and direct as possible.

Chp. 4: Student Outcomes and Assessment
– 39 –
(b) In part 2 of the memo, explain how you arrived at the answer you did, so the people in the purchasing department can understand why your instructions give the right answer. •• Do this only if you have the time: Suppose the tile store has lots of yellow, blue, and black tiles, but it only has 6000 red tiles. You want to make the largest logo you can, using all the tiles that are available. What's the size of the largest logo you can make? Brief Discussion
Here we have a modeling situation, as was the case with Example 1. This version of the task does not explicitly ask students to provide formulas, while others do; hence this version provides an opportunity to see if the students realize that formulas are an effective means of communicating mathematically, while the version that tells them to produce a formula provides an opportunity to see if they can produce one. There are various ways to attack the problem. If one knows that the area of a planar figure grows in proportion to the squares of its dimensions, then one can write a formula directly; if not, one can compute the areas and derive formulas in that manner. Modeling, algebraic fluency, knowledge of area and proportionality, and the ability to communicate using mathematical language are among the skills highlighted by this task.

Chp. 4: Student Outcomes and Assessment
– 40 –
Example 4: An exercise in mathematical definition-application.
EFFECTIVE TAX RATES
The following question is taken from the 1992 NAEP examination (Dossey, Mullis, & Jones, 1993). It is one of the extended student-constructed response items.
This question requires you to show your work and explain your reasoning. You may use drawings, words, and numbers in your explanation. Your answer should be clear enough so that another person could read it and understand your thinking. It is important that you show all your work.
One plan for a state income tax requires those persons with income of $10,000 or less to pay no tax and those persons with income greater than $10,000 to pay a tax of 6 percent only on the part of their income that exceeds $10,000. A person's effective tax rate is defined as the percent of total income that is paid in tax. Based on this definition, could any person's effective tax rate be 5 percent? Could it be 6 percent? Explain your answer. Include examples if necessary to justify your conclusions.
Brief Discussion This task requires students to read the definition of "effective tax rate" and then place this definition into use in answering the question. This task could easily be used with a range of individuals from those who represent the population of undergraduates at large to those with future plans for mathematics in their lives, as it deals with consumer understanding and daily-living problem solving. The problem is not a high-powered problem in its demands on the student for a solution, but when scored on a 0 – 6 rubric in the 1992 NAEP, only 3 percent of the nation's 12th graders could perform in the top two levels combined. Nearly two-thirds of the students were unable to get started on the item.

Chp. 4: Student Outcomes and Assessment
– 41 –
Example 5: An exercise in mathematical definition-making.
DEFINING SQUARENESS Below you will find a collection of rectangles.
(a) Define a mathematical measure that allows you to tell which rectangle is
the "most square" and which is the "least square." (b) Define a different measure that achieves the same result. (c) Is one measure "mathematically superior" to the other? Argue why, and
be prepared to defend your choice to the class.
R
RR
R
R1
24
3
5
Brief Discussion Of the four tasks described here, this is the most deeply mathematical, in that it calls for making definitions and exercising mathematical judgment about their quality. This task could easily be an exercise for advanced undergraduates; it has, in fact, been a source of engagement for faculty as well. Various measures – the ratio of one dimension to another; the ratio of the area to that of a square with the same perimeter; the ratio of adjacent angles cut by the diagonals – have interesting properties, some of which generalize to other problems ("cubeness," "n-gonness") better than others. We include this task here to indicate that high-powered mathematical thinking need not depend on high-powered formalism.

Chp. 4: Student Outcomes and Assessment
– 42 –
Summary discussion: Indicators for the collegiate population at large. At the beginning of this discussion we noted the possible bifurcation of indicators into those that tease out "basic skills" and those that focus on mathematical literacy. It should be noted that all five of the tasks given immediately above call for a fair amount of basic mathematical skills: one must know how to create and manipulate linear functions, compute areas, compute statistical parameters of distributions, perform symbolic manipulations, etc. However, such manipulations are not ends in themselves; they get selected and employed in the service of larger tasks. Thus, separating them out is a pragmatic decision: one might choose to do so because indicators of basics are easily available, or one might choose to focus on their use in the service of larger mathematical aims. As it stands now, the mechanisms for gathering and reporting information using such items are not readily in place – but there are no major obstacles, other than money, to keep them from being put into place. The NAEP assessments, if more open-ended responses are included, will allow for the kinds of data-gathering proposed here. New Standards has liaison agreements with various states and districts. Balanced Assessment and New Standards have developed scoring procedures that provide rich bodies of information not only at the indicator level, but also to students and teachers. Hence the issue would be one of systemic liaison: finding a "provider" of assessments and a mechanism for scoring that is relatively low-cost (because universities profit from the information as well), which then provides distillations of the relevant information for the indicator system. 4.2.2 Indicators For Group 2: Those Who Will Use Some Amount Of
Mathematics For Technical Careers (Including Career Tracks In Two-Year Colleges)
Parallel to the growth in need for effective measures of "quantitative literacy" is the need for measures of mathematical knowledge related to emerging markets for students who will apply their mathematics in professional-technical settings. Most of these students will have formal mathematical training at the post-secondary school level, be it in a school, the armed forces, or in a company-related professional development program. Steen and Forman (1995) and Forman (1995) have outlined many of the needed characteristics such assessments might need, but leave open the question of the overall curricular format such students may need or experience. They consider the divisions into mathematics for life and work. The mathematics for life deals with much of the same content that was addressed for individuals in Group 1 above. The mathematics for work directly addresses the

Chp. 4: Student Outcomes and Assessment
– 43 –
needs of students in Group 2. They argue that the main focus of mathematics for this group of students should be the preparation for the world of work. In doing so, the program, and its assessments, should closely resemble the tasks they would face in a typical job setting. However, at the same time, such programs should provide the basis for continued study in mathematics. This is perhaps the largest challenge, as such programs historically have been rather dead-end tracked. The task becomes one of melding old skills into problem solving, reasoning, and making connections in new settings. Students must learn to model situations rich in numerical or spatial data, or ones representing uncertainty. Combined with these needs are the more central requirements identified in the Department of Labor's Secretary's Commission on Achieving Necessary Skills (SCANS, 1991) report. This report called for students competent in the following areas:
• Resources: Identifies, organizes, plans, and allocates resources. • Interpersonal: Works with others. • Information: Acquires and uses information. • Systems: Understands complex inter-relationships. • Technology: Works with a variety of technologies.
Technicians need to be flexible workers who can adapt to the changing needs of the workplace. As such, their mathematical educations must provide them with a basis for further growth and development. There must be a fundamental basis of numeric, algebraic, and geometric content to this course of study. Many programs must also contain a significant amount of trigonometry, statistics, or even calculus (Collins, Gentry, & Crawley, 1993). Their development of these topics may be based in a few concrete examples and then computer algebra system supported investigation and applications of more advanced formats. Central to this work is the ability of the individuals involved to both use and adapt algorithmic procedures to solve problems. However, the study of algorithms must not be the meaningless study of rote procedures, but rather the careful analysis of expandable routines that provide the student with a wide variety of applications, as well as a basis for the construction of additional procedures based on the central ones studies in depth. Content should be introduced in the study of real-world related problem situations. The focus should be on the development of 'big ideas" rather than the splintering of the curriculum into a myriad of courses dealing with minute, vocation-specific courses with little breadth of application outside the narrow field.
Central to these competencies is the ability to use mathematics productively. Two examples of open-ended problems of a high-order of mathematical

Chp. 4: Student Outcomes and Assessment
– 44 –
understandings, but typically confronted by those that have less than a collegiate education in mathematics are the following (AMATYC, 1995):
Lynn walked into her office on Monday morning to find a memo marked "URGENT." As she set her brief case down, she glanced at the contents and was relieved to see that it was the request that she had been anticipating. The company that employs Lynn had begun to make a new line of components to be shipped to other companies and used in manufacturing. It is Lynn's job, as a time study analyst, to determine the standard for the amount of time required to package these components. The memo requested that Lynn provide a standard as soon as possible for placing hardware components in a bag. It went on to say that the company was already receiving calls for the product and needed to establish standards in order to properly price the items. Lynn was prepared. She had already been on the production line and taken data (a sample of the data appears in the table below) from which she could prepare the standard. Now she had to analyze the data to develop a formula or system of curves to serve as a model for predicting the time required to bag the components. She would then have to test the model and, if it proved to be satisfactory, write a report. (p. 31)
Study Number
Time (min.)
Weight of Components
(lbs.)
Bag Size
Number of Components
1 0.264 6.62 4 11 2 0.130 1.15 2 6 3 0.186 5.61 3 8 4 0.169 2.91 2 6
Table. Time Required to Place Hardware in a Bag
A second problem, relating a more military oriented situation, is:
Robotic devices are often used where reasons of safety or convenience make it impractical to rely on human control. To estimate its location, a robot measures the angles to various known landmarks and then uses this information with a built-in computer program to calculate its likely position. Since the information available to the robot is often somewhat uncertain ( a common circumstance known informally as 'noisy data,' often due to imprecision in measurements), the robot's position can be identified only with a small region, not at an exact location.

Chp. 4: Student Outcomes and Assessment
– 45 –
For example, suppose a robot is moving over a flat field to find land mines left over from a war zone. Three distant trees are used as the known landmarks, forming a triangle whose base is 2520 feet long with vase angles of 65°30' and 52°40' with the third tree. The field to be searched is approximately rectangular, situated mostly within the triangle formed by the three trees but with some area extending outside the triangle. The sensors on the robot can determine angles to the known landmarks with an accuracy of ±2°, but they have no way of measuring distance. How accurately can the robot determine its position when it is near the center of the triangle formed by the trees, when it nearly one of the trees, and when it is outside the triangle? In which part of the field will the robot's calculations pinpoint its position with greatest accuracy? A fourth tree is located outside the original triangle at a position that forms angles of 38°50' and 95°10' with the two base trees. If this information were added to the robot's 'known landmark' data file, how much more accurate would that make its estimation of position? (Steen and Forman, 1995, p. 231)
Any set of indicators for Group 2 should consist, at the minimum, of indicators which provide information on the students' proficiency in applying standard procedures, their ability to problem-solve in a variety of settings (algebraic, geometric, uncertainty, . . . ), their preparation for various levels of additional postsecondary education, and their preparation in terms of life-skills. Special emphasis needs to be given to the development of ways of relating student performance on such items to a hierarchy of expectations. One example of such a problem, requiring students to visualize motion, determine relative positions of objects over time and calculate an intersection point, if any is the following item, slightly reworded, taken from the 1992 NAEP examination (Dossey, Mullis, & Jones, 1993):

Chp. 4: Student Outcomes and Assessment
– 46 –
The darkened segments in the figure above show the path of an object that starts at point A and moves to point C at a constant rate of 1 unit per second. Please answer the following questions about the situation, noting that the object's distance from point A or from point C, is the shortest distance between the object and the respective point. a) Sketch the graph of the distance of the object from point A over the 7-second period. b) The sketch the graph of the distance of the object from point C over the same period.
c) On your graph, label point P as the point where the distance of the object from point A is equal to the distance of the object from point C. d) Between what two consecutive seconds is the object equidistant from points A and C? Possible Solution: Students need to realize that the graph of the distance of the object from point A is linear only during the first four seconds. At the end of the fifth second it is critical for students to observe that the distance of the object from point A is equal to the length of the hypotenuse of a right triangle with sides of length 4 and 1 and that distance is equal to 42 +12 = 17 ≈ 4.1 by the Pythagorean relationship. In a like manner, at the end of the sixth and seventh seconds the
distance from point A is 42 + 22 = 20 = 2 5 and 42 + 22 = 25 = 5 respectively. When the seven resulting (time, distance) ordered pairs are plotted

Chp. 4: Student Outcomes and Assessment
– 47 –
on the axes provided and the graph of the distance of the object from point A is sketched, students should have drawn a non-linear path. The non-linearity may be observed from the change in slope of the path that occurs between the points (4,4) and (5, 4.1) and thereafter. The path of the distance of the object from point C, on the other hand, in non-linear for the first four seconds and linear during the final three seconds. Another facet of this task is for students to understand that the distance of the object from point A is equal to the distance of the object from point C at the point where the two curves intersect, which occurs between the third and fourth seconds. (a) and (b)
(c) P = 3 1
8 , 3 18( )
Seconds Distance from Point A
Distance from Point C
0 0 5 1 1 18 ≈ 4.2 2 2 13 ≈ 3.6 3 3 10 ≈ 3.2 4 4 3 5 17 ≈ 4.1 2 6 20 ≈ 4.5 1 7 5 0
(d) Between 3 and 4 seconds. The responses to this question might be evaluated according to the following rubric established for use in the NAEP assessments:

Chp. 4: Student Outcomes and Assessment
– 48 –
0 = No response There is no response. 1 = Incorrect Response The work is completely incorrect or
irrelevant. Or the response states, " I don't know."
2 = Minimal The response demonstrates a minimal understanding of the problem posed but does not suggest a reasonable approach. Although there may or may not be some correct mathematical work, the response is incomplete, contains major mathematical errors, or reveals serious flaws in reasoning. Examples are absent.
3 = Partial The response contains evidence of a conceptual understanding of the problem in that a reasonable approach is indicated. However, on the whole, the response is not well developed. Although there may be serious mathematical errors or flaws in the reasoning, the response does contain some correct mathematics. Examples provided are inappropriate.
4 = Satisfactory The response demonstrates a clear understanding of the problem and provides an acceptable approach. The response also is generally well developed and coherent but contains minor weaknesses in the development. Examples provided are not fully developed.
5 = Extended The response demonstrates a complete understanding of the problem, is correct, and the methods of solution are appropriate and fully developed. Responses scored 5 are logically sound, clearly written, and do not contain any significant mathematical errors. Examples are well chosen and fully developed.
The student work for each of the six levels of scoring related to the problem above follow. Note the ways in which the scoring rubric has been altered to fit to the nature of the individual problem and the way in which each successive level provides greater assessment information to the teacher (Dossey, Mullis, & Jones, 1993, pp. 158-162).

Chp. 4: Student Outcomes and Assessment
– 49 –
Scoring guide and sample student responses
Score & Description
Extended Complete, correct answer, (must show change in slope exactly at (4,4) and (4,3)). Satisfactory
Both graphs are correct, (Change in slope need not occur exactly as (4,4) and (4,3)). P is located correctly or the time of equidistance is correct.
Partial
At least one graph is correct (must show change in slope, but curve is not required). P is not located or is located incorrectly and the time of equidistance is incorrect or missing OR One or both graphs incorrect, but P is located correctly for their graph.
Minimal
At least 2 points are plotted correctly on at least one graph that is not just a reiteration of the position graph; i.e., a plot of distance versus time.
Incorrect/Off Task The work is completely incorrect, irrelevant, or off task

Chp. 4: Student Outcomes and Assessment
– 50 –
Extended - Student Response 11. The darkened segments in the figure above show the path of an object that starts
at point A and moves to point C at a constant rate of 1 unit per second. The object's distance from point A (or from point C) is the shortest distance between the object and the point. In the space below, complete the following steps. a) Sketch the graph of the distance of the object from point A over the 7-second period. b) Then sketch the graph of the distance of the object from point C over the same period.
Satisfactory - Student Response 11. The darkened segments in the figure above show the path of an object that starts
at point A and moves to point C at a constant rate of 1 unit per second. The object's distance from point A (or from point C) is the shortest distance between the object and the point. In the space below, complete the following steps. a) Sketch the graph of the distance of the object from point A over the 7-second period. b) Then sketch the graph of the distance of the object from point C over the same period.

Chp. 4: Student Outcomes and Assessment
– 51 –
11. The darkened segments in the figure above show the path of an object that starts
at point A and moves to point C at a constant rate of 1 unit per second. The object's distance from point A (or from point C) is the shortest distance between the object and the point. In the space below, complete the following steps. a) Sketch the graph of the distance of the object from point A over the 7-second period. b) Then sketch the graph of the distance of the object from point C over the same period.
Partial - Student Response 11. The darkened segments in the figure above show the path of an object that starts
at point A and moves to point C at a constant rate of 1 unit per second. The object's distance from point A (or from point C) is the shortest distance between the object

Chp. 4: Student Outcomes and Assessment
– 52 –
and the point. In the space below, complete the following steps. a) Sketch the graph of the distance of the object from point A over the 7-second period. b) Then sketch the graph of the distance of the object from point C over the same period.
11. The darkened segments in the figure above show the path of an object that starts
at point A and moves to point C at a constant rate of 1 unit per second. The object's distance from point A (or from point C) is the shortest distance between the object and the point. In the space below, complete the following steps. a) Sketch the graph of the distance of the object from point A over the 7-second period. b) Then sketch the graph of the distance of the object from point C over the same period.

Chp. 4: Student Outcomes and Assessment
– 53 –
Minimal - Student Response 11. The darkened segments in the figure above show the path of an object that starts
at point A and moves to point C at a constant rate of 1 unit per second. The object's distance from point A (or from point C) is the shortest distance between the object and the point. In the space below, complete the following steps. a) Sketch the graph of the distance of the object from point A over the 7-second period. b) Then sketch the graph of the distance of the object from point C over the same period.
Incorrect/Off Task - Student Response 11. The darkened segments in the figure above show the path of an object that starts
at point A and moves to point C at a constant rate of 1 unit per second. The object's distance from point A (or from point C) is the shortest distance between the object and the point. In the space below, complete the following steps. a) Sketch the graph of the distance of the object from point A over the 7-second period. b) Then sketch the graph of the distance of the object from point C over the same period.

Chp. 4: Student Outcomes and Assessment
– 54 –

Chp. 4: Student Outcomes and Assessment
– 55 –
4.2.3 Indicators For Group 3: Those Who Use Mathematics (through calculus
at least) in the Service of Other Majors or Disciplines For students whose career goals include areas that will make substantial use of mathematics (not only in mathematics but perhaps in other disciplines), the next major plateau is that of the calculus. Goals for a three- or four- semester sequence of calculus courses were described in the first portion of the work of the NSF Working Group on Assessment in Calculus (Schoenfeld et al., 1997). We provide a brief summary here, to indicate at least one major direction in which reform efforts are moving. The Working Group achieved a strong consensus about "what counts in calculus." Items A through D below indicate the scope of calculus instruction, and hence the range of issues that must be dealt with via assessment.
A. Content Goals for Calculus.
There was general agreement that the following content areas should be emphasized:
• introductory concepts, including subsets of ←2 and ←3 and simple
transformations of these spaces; vectors, etc.;
• functions and representations of functions, including numerical, graphical, symbolic and algorithmic representations;
• limits and continuity from an intuitive and constructive point of view;
• the derivative of a function as a function that gives the relative rate of change or the slope of a tangent;
• parametric representation of curves;
• the Mean Value Theorem in an intuitively clear form, such as: "If f' > 0 on an interval, then f is increasing on that interval;"
• the integral conceived of as an accumulation of many small quantities that provides a means of calculating: a total change from a rate of change; area; volume; and other geometrical and physical quantities;
• both parts of the Fundamental Theorem of Calculus, with an emphasis on the conceptual distinction between indefinite and definite integrals;
• integration by parts and straightforward substitutions; the use of integral tables for more complex integrals;

Chp. 4: Student Outcomes and Assessment
– 56 –
• numerical integration and numerical differentiation;
• conventional third semester topics with an emphasis on surfaces and vector calculus.
There was, also, general agreement that the following content areas should be de-emphasized:
epsilon-delta arguments about limits, continuity, etc. the mean value theorem in its classical form. tests for convergence of series beyond comparison with a geometric series. techniques of integration (other than simple substitution and integration by parts). B. Process Goals for Calculus. As indicated above, process goals were seen by the NSF Working Group on Assessment in Calculus as being every bit as important as content goals. There was uniform agreement that there should be an emphasis on teaching skills of an order higher than solving template problems, and that students should learn:
• to deal with situations that are unfamiliar, but mathematically related to
topics they have studied.
• to experiment with examples to discover relationships, and to make and test conjectures.
• to express problem situations in terms of functions.
• to construct and analyze models – discrete and continuous, empirical and theoretical, and understand how to use them.
• to make successive approximations to the solution of a problem.
• to use top-down, divide-and-conquer design to solve complex problems.
• to combine intuition, generalization, and logical arguments to find solutions and to explain why they are correct (here the emphasis was on the explanation rather than on formal logic).
• to form mental images or representations of mathematical processes such as forming the inverse of a function or taking its derivative.

Chp. 4: Student Outcomes and Assessment
– 57 –
• to visualize mathematical objects. They should regard curves and surfaces as important and useful objects in their own right, not as the end products of tiresome exercises.

Chp. 4: Student Outcomes and Assessment
– 58 –
C. Student Products. In various calculus courses, students are asked to produce markedly different kinds of work. Hence it is a non-trivial issue to design an indicator system that provides an adequate mirror of this diversity. Some courses, of course, require only that students hand in various "end of the chapter" exercises," and have final exams that are, in essence, collections of such exercises. Capturing that type of student product is easy. However, some calculus instruction now places a premium on students' development of mathematical models and of write-ups describing their work, some courses require extensive reports of exploratory activities; others of "laboratory work" in mathematics (often computer-based); and so on. There is strong sentiment that in addition to being able to formulate and solve a problem using the concepts and techniques of calculus, students should be able to describe the process of solving it, and be able to communicate the solution both orally and in writing. Whatever indicator system is devised should offer ways to document the types, frequency, and quality of the products students are expected to produce. D. The scope of situations students are expected to be able to deal with. As with products, there is an issue of scope that goes beyond the content and process descriptors for calculus courses. Are students expected to learn meaningful applications in areas outside the hard sciences, including management, life, and social sciences? Are students expected to learn how to obtain both exact and approximate solutions to complex problems, and to know the advantages and disadvantages of either approach?
The four categories briefly delineated above – content, process, products, scope – provide a description of basis vectors in the assessment space. That is, any indicator system that promises to capture the reality of calculus instruction today and in the years to come must attend to the range of issues described in that list. It should be noted that the indicator/assessment issues are essentially the same as for general literacy, just with an "upwards" shift in content. The bottom line is this: if you want to know what students can do, you need to provide opportunities for students' engagement with the mathematics. Along those, lines, it should be noted that there are various ways to gather information about student performance.

Chp. 4: Student Outcomes and Assessment
– 59 –

Chp. 4: Student Outcomes and Assessment
– 60 –
4.2.3.1 Various types of data for indicators. The calculus report describes three categories of approaches to the gathering of information under these headings; Category 1, Various Pencil-and-Paper Assessment Tasks; Category 2. Performance Assessments of Various Types; Category 3. Portfolio Assessment. Descriptions are as follows. Category 1: Various Pencil-and-Paper Assessment Tasks Multiple-choice and short answer items.
Such items are familiar, and it might seem that there is little more that can or should be said about them. However, there are significant issues of design, in terms of crafting multiple-choice and short answer items that tap into the dimensions A through D discussed above. For example, one might wish to judiciously use items which carefully bind with other items to form families which probe the student's knowledge of a particular item in the course from a conceptual, procedural, and problem solving point of view. For example, consider the following three items taken from the Second International Mathematics Study (Crosswhite, et. al, 1986).
Item A
(x3
1
2
∫ − x) dx is equal to
A 1 34
B 2
C 2 14
D 3E 6

Chp. 4: Student Outcomes and Assessment
– 61 –
Item B
The line l in the figure is the graph of y = f(x).
f(x) dx−2
3
∫ is equal to
A 3 B 4 C 4.5 D 5 E 5.5
Item C
The graph of the function f is shown above for 0 ≤ x ≤ 10.
f(x) dx0
a
∫ attains its greatest value when a is equal to
A 0 B 2 C 3 D 6 E 10

Chp. 4: Student Outcomes and Assessment
– 62 –
Item A presents an assessment of students' command of the procedural aspects of applying the power rule and finding the value of the definite integral presented. Over a year of study of AP calculus, students moved from a 15 percent to a 68 percent level of performance. Item B samples students' knowledge of the conceptual meaning of a definite integral through the presentation of a question that asks for the interpretation of a particular definite integral in a situation where the integral is a measure of area under the curve specified by a function f. Performance on this item for AP students improved from 22 to 53 percent correct over a year's study. Task C presents students with a question asking for them to identify the point a in a function's domain at which the value of a definite integral on [0, a ] will be maximized. On this item, which calls for students to make a number of connections and to confront a situation they have not practiced in class, the performance went from 7 to 26 percent correct over the period of a year's study. The combination of information from these three items provides a great deal of knowledge about a given student, or a group of students, their conceptions of important aspects of the calculus. Multiple choice items can provide such information quickly and rather inexpensively, but the items, their relation to one another, and their ability to identify common misconceptions, such as response B in the last item above, are central to the decision to use such items and to interpret the results obtained
Other items of a similar nature, but reflecting more contextual meaning, are those being developed for a quantitative version of the Graduate Record Examination slated for students who have completed the calculus as part of their undergraduate experience (Tucker, 1995). Some sample items proposed for this assessment are as follows:
The graph records the rate at which water flowed out of a storage tank in gallons per hour, over a 12-hour period. Which of the following is the best estimate of the total number of gallons that flowed out of the tank during that period?

Chp. 4: Student Outcomes and Assessment
– 63 –
A 1,200 B 2,500 C 5,000 D 8,000 E 10,000
The graph shows a manufacturer's profit P as a function of x, the number of items produced and sold. At which of the eight marked points on the graph does the profit per item have the greatest value?
Given f (x) = e
x2 − x , find a second degree polynomial p such that:
p(0) = f(0) p'(0) = f'(0) p"(0) = f"(0)
These, and other items, calling for students to apply their quantitative knowledge in tabular, graphical, symbolic, and verbal settings will greatly change the nature of the Graduate Record Examination's quantitative section over time for those who have studied the calculus.

Chp. 4: Student Outcomes and Assessment
– 64 –
Open-Ended Items. Open-ended items provide for a deeper look into a student's knowledge base, to see their ability to handle the processes of problem-solving, reasoning, communication, and making connections. This form of assessment also provides products of the student's own thinking, not their ability to identify or select from among the instructor's ideas of what the student's thinking might be. The following description is adapted from the Calculus Working Group report:
Open-ended items ("essay questions") are items that have more than one correct answer or that have multiple paths to a correct solution. In responding to such items, students are often asked not only to show their work, but also to explain how they got their answer or why they chose the method they did. Needless to say, there is a wide range of ways in which such items are used, and in the kinds of information one can glean from them. At the more routine end of the spectrum we simply ask to see students' work on standard exercises: say on typical max-min, related rates, or volume problems. Their work provides evidence of mastery of basic concepts and some subsidiary skills (e.g. finding an algebraic representation of a situation described in words,...). However, if the problems are isomorphs of text examples and homework exercises, they provide little evidence of students' ability to think. At the other end of the spectrum, a 20-minute essay question can provide students with some opportunity to experiment, explore, or document some important abilities such as explaining an important idea. One need not be limited by the routine or the algorithmic in assessment. Consider, for example, this exercise from the Harvard Calculus Project's Calculus (Hughes-Hallett & Gleason, 1994). It appears as a homework exercise (which is, of course, one form of assessment), but might serve just as well as a test or interview item.
Match the stories with three of the following graphs and write a story for the remaining graph. (a) I had just left home when I realized I had forgotten my books so I went
back to pick them up. (b) Things went fine until I had a flat tire. (c) I started out calmly, but sped up when I realized I was going to be late.

Chp. 4: Student Outcomes and Assessment
– 65 –
time
time
distance from home
time
distance from home
time
distance from home
distance from home
i ii
iii iv
Figure 1. Which story goes with which graph? The content of this problem is elementary – it comes, after all, at the very beginning of the course. However, its style signals a departure from standard approaches to content "mastery." First, it lets students know they will be held accountable for a major theme in the course: students are expected to become familiar with different representations of mathematical phenomena (in this case, graphical and verbal), and to be able to interpret them and translate between them. Second, it emphasizes qualitative reasoning in a course that is typically considered to be purely quantitative. Third, the open-ended character of the last part of the problem – "write a story for the remaining graph" – provides students with the opportunity to generate their own stories. There is clearly no single "right answer." Also, the stories students generate are likely to provide some insights into their understandings and misconceptions. In their somewhat open-ended character, problems such as this one can provide opportunities to delve into student understandings, both for purposes of diagnosis and instruction. In general, open-ended items that call for qualitative interpretations, for modeling, and other deep mathematical skills, can provide a fair amount of information about students' abilities to deal with the non-algorithmic aspects of mathematics. (Schoenfeld, et al., pp. 21–24)

Chp. 4: Student Outcomes and Assessment
– 66 –
Category 2. Performance Assessments of Various Types. Performance Tasks A good deal has been said about performance tasks in Section 1 and in the general literacy section (Section 4.2.1); in responding to the needs of Group 3, we only need translate that information into situations that draw on the content of the calculus and related courses taken by this group of students. Ample evidence of such projects is included in the MAA series on projects for calculus and in a number of the reform calculus texts. Investigations and Projects It may seems that gathering information about students' extended investigations, or their course projects, is completely out of bounds for a national indicator system – but that need not necessarily be the case. An idea being developed by New Standards is that assessment time can be used for authentication . That is, students spend lots of time putting together projects, but who knows for certain whose work they really are (parents? siblings? tutors'?)? One way to determine that student are conversant with the material they claim to be their own is to examine them on the contents of those materials to see what they know. Observations and interviews Here too, one tends to think of such things as research tools – but a system of sampling nationwide could provide some national indicators of just what % of students are familiar with various ideas, and in what ways. Category 3. Portfolio Assessment. What's central in the use of portfolios, in terms of indicators, is the observation made above concerning investigations and projects: assessment time need only be devoted to authentication. The key here is that we need a handle on what students are actually doing with regard to portfolios, etc., in various mathematics programs around the country. Documenting such practices is one way of reifying their importance! What follows is some general information about portfolios.
While the use of portfolios has been a common practice in art and writing for a long time, they have only recently been used as a method to assess student progress in mathematics. One state, Vermont, is beginning to use portfolios in writing and mathematics on a statewide basis to assess K-12 students'

Chp. 4: Student Outcomes and Assessment
– 67 –
growth and understanding over time (Vermont Department of Education, 1992). What goes into a portfolio should, obviously, depend on the instructional goals of each situation. Typically, a portfolio includes a spectrum of student work -- some of which is optional (e.g., "Choose two pieces that you think exemplify your work at its best, and explain why you think they do.") and some of which is mandatory (e.g., students in a particular course must include one laboratory report, one open-ended exploratory problem, and one report of an extended collaborative project). Typically students are asked to include in the portfolio a "cover letter" for reviewers, which explains why they have chosen the entries they have, and what the reviewer should look for in them. Writing such a letter can be a powerful occasion for student reflection. . . . A portfolio in calculus might include some of the following items:
• responses to open-ended questions; • reports of individual or group projects; • work from another subject area that relates to calculus; • a problem made up by the students; • research reports about some facet of calculus; • computer-generated examples of student work; • student self-assessment reports; • journal excerpts; • a mathematical autobiography; • tests or test scores; • instructor's interview notes or observation records.
In contrast to most testing situations, which document what students can not do, portfolios allow students to document what they can do. This medium enables students to demonstrate the learning and understanding of ideas beyond the knowledge of facts and algorithms. Work in a portfolio can show the ability to solve problems, to reason and to communicate mathematically, and to make connections. Portfolios can show growth over time and students' disposition toward mathematics. Portfolios can be used to assess individual students or to evaluate entire courses or major programs. Collectively, portfolios can reflect the emphases of a calculus program. While more cumbersome and difficult to manage than pencil-and-paper tests, portfolios offer a bigger window through which to view students' mathematical understandings and abilities as well as their growth.

Chp. 4: Student Outcomes and Assessment
– 68 –
Once again, we note a dual role for such assessments. On the one hand, they provide students with the opportunity to document what they know, and what they can do. On the other hand, such extensive documentation of student work provides faculty with a wealth of information about what is effective in their instruction, and what might profit from more attention or a different approach. (Schoenfeld et al., 1997)
In sum: the issues for calculus are very much the same as for the "general literacy" plateau. 4.2.4 Indicators For Group 4: Those Who Will Teach Mathematics At The
Elementary Or Secondary Level Here again, we have a case of "more of the above" – the broad set of issues concerning indicators related to those who intend to be school teachers are the same as those for the constituencies discussed in sections 4.2.1 through 4.2.3, while the domain coverage is somewhat different. On the content side, we may lean heavily on a recent report entitled A Call for Change from the Mathematical Association of America (Leitzel, 1991); correspondingly on the process side, we may lean heavily on the NCTM Professional Standards for Teaching Mathematics (NCTM, 1991). Functionally, there are two separate sets of issues concerning indicators. The first major set of issues concerns the development of direct assessments. There the pragmatic task would be to take the ideas expressed in the volumes mentioned above and turn them into an effective indicator system. For example, A Call for Change lists six standards common to the preparation of mathematics teachers at all levels:
1. Learning Mathematical Ideas 2. Connecting Mathematical Ideas 3. Communicating Mathematical Ideas 4. Building Mathematical Models 5. Using Technology 6. Developing Perspectives.
It then lists specific content standards for the elementary, middle, and secondary grades. Those who intend to be K-4 teachers are expected to have a core of experiences described within four broad standards:

Chp. 4: Student Outcomes and Assessment
– 69 –
1. Nature and use of number 2. Geometry and measurement 3. Patterns and functions 4. Collecting, representing, and interpreting data.
These are expanded as follows for intending teachers for the middle grades:
1. Number concepts and relationships 2. Geometry and measurement 3. Algebra and algebraic structures 4. Probability and statistics 5. Concepts of calculus.
For teachers of grades 9-12, the following standards are described:
1. Number concepts and properties 2. Geometry 3. Functions 4. Probability, statistics, and data analysis 5. Continuous change 6. Discrete processes 7. Mathematical structures.
On the process side, the NCTM Professional Standards for Teaching Mathematics provides the following set of standards for teaching mathematics:
1. Worthwhile mathematical tasks 2. The teacher's role in discourse 3. Students' role in discourse 4. Learning environment 5. Analysis of teaching and learning.
Indicators can and should be developed to trace the experiences that mathematics students intending to be teachers have along these dimensions. Assessments that provide appropriate information should measure preservice teachers' abilities to verbally handle questions dealing with aspects of the mathematics they will teach: Why is it when you multiply some fractions the answer gets smaller

Chp. 4: Student Outcomes and Assessment
– 70 –
and in other cases it gets bigger? Indicators should also sample the students' abilities to function with the standard manipulative materials used to represent mathematical concepts: Make a pentagon, having an area of 3.5 square units, on your geoboard. They should also include opportunities for students to illustrate their ability to apply technology in the solution of problems: Find a function f that represents the data given in the table below.
x 1 2 3 4 10 f(x) 4 5 8 13 85
All teachers should be able to apply relevant levels of mathematics to understanding mathematical situations and using that understanding to predict or control the situation at hand. Those preparing for secondary school mathematics teaching should be able to complete the following problem developed as part of the Project CALC project at Duke University (Smith, 1993):
It is a calm spring day in southeast Iowa at the Ottumwa air traffic control radar installation––except there are some small, locally intense thunderstorms passing through the general area. Two aircraft are in the vicinity of the station: American Airlines 1003 from Minneapolis to New Orleans is approaching from the north-northwest and United Airlines 366 from Los Angeles to New York is approaching from the west-southwest. Both are on paths which will take them directly over the radar tower. There is plenty of time for the controllers to adjust the flight paths to insure a safe separation of the aircraft. Suddenly, lightning strikes a power substation five miles away, knocking out the power of the ATC installation. There is, of course, a gasoline powered auxiliary generator, but it fails to start. In desperation, a mechanic rushes outside and kicks the generator; is sputters to life. As the radar screen flickers on, the controllers find that both flights are at 33,000 feet. The American flight is 32 nautical miles from the tower and approaching it on a heading of 171° at a rate of 405 knots. The United flight is 44 nautical miles from the tower approaching it on a heading of 81° at a rate of 465 knots. Here are some questions to guide your discussion and analysis of the situation:

Chp. 4: Student Outcomes and Assessment
– 71 –
• At the instant of the first observation, how fast is the distance between the planes decreasing?
• How close will the planes come to each other? • Will they violate the FAA's minimum separation requirement of 5
nautical miles? • How many minutes do the controllers have before the time of closest
approach? • Assuming that the tower computer can carry out your calculations in
seconds–once the controllers ask the right question–is there enough time to direct one of the planes to another flight path or another altitude? Should the controllers do so?
• If there is not enough time to avert disaster, should the controllers
run away from the tower as fast as possible?
Your report for this project is not just a list of answers to these questions––you must explain your analysis. (Smith, 1993)
The second major set of issues concerns the status and character of proxies for indicators – tests designed to provide measures of individuals' (mathematical) competency for teaching. As we write, there is one current and one future set of indicators, and they are very different in style and content. The currently used indicator is the Praxis Test developed by ETS. Praxis a test of student mathematical competence that is currently used by some states (e.g., California) as an entry examination for programs in teacher preparation. (Students in California are not allowed to do their student teaching unless they have passed the Praxis, or earned a waiver from it). Praxis is intended by its developers to be a test of the relevant mathematical content knowledge – of statistics and probability, calculus, the ability to write proofs, etc. There are, however, alternative approaches. A second direction in which one might look (but very expensive) is toward the certification procedures being developed by the National Board for Professional Teaching Standards (NBPTS, 1995). The NBPTS is now under some significant political pressure to develop subject matter tests, and those items may indeed come to resemble those on the Praxis. However, the contractor for NBPTS test development (ETS) has also explored the idea of developing teaching tasks that require mathematical

Chp. 4: Student Outcomes and Assessment
– 72 –
competency – e.g., having candidates explain typical student misconceptions about a topic and plan a lesson to address them. Though currently designed for "master teachers," their work along these lines might shed light on the mathematical knowledge appropriate for potential teachers as well. 4.2.5 Indicators For Group 5: Those Who Will Major In the Mathematical
Sciences Here we shall first talk about available methods, and then discuss a concept that is being developed. There is little available to assess the competence of mathematics majors save for the Graduate Record Examination (GRE) advanced mathematics examination – and there are reasons to have serious reservations about that examination. In recognition of that fact, ETS put together a New Tests Initiatives (NTI) Committee whose responsibility is to recommend significant changes in the examination. However, a push to computerize such large scale examinations (which would preclude the kinds of essay questions being explored by the NTI committee) make it unlikely that a more appropriate option will be available in the near future. The issues are these. The current GRE advanced mathematics examination offers 65 questions to be worked in less than three hours. It puts a premium on speed and cleverness, and leaves unaddressed issues such as the ability to make coherent chains of argument, to communicate mathematically, and to write airtight proofs – the kinds of abilities that might be revealed by appropriately chosen "essay questions" in mathematics. However, essay questions require human grading, and (since scoring is not as precise, and there are far fewer problems on an exam) the scores assigned are less "defensible" than those on the conventional multiple choice exams. Given current constraints on and directions at ETS, it is unclear whether such an examination – which the NTI committee would provide direct rather than correlational evidence of mathematical competency – will be implemented by ETS. In the meantime all we have is a weak proxy, and we will face serious development issues if we wish to tap into "what counts." Along the lines of "what counts," it is worth discussing an approach to the charting of students' mathematical growth that has been put in place at the united States Military Academy at West Point. Where there is a consistent curriculum, one can focus on major mathematical strands and look for development of the threads that connect them– e.g., increased sophistication in mathematical modeling, better ability to explain assumptions and show how they play out in a model, the ability to make more coherent and more extended arguments. In what follows we describe one example in significant detail. The reader is invited to imagine a series of such examples spread out over a student's career. A portfolio of such projects provides potential documentation of

Chp. 4: Student Outcomes and Assessment
– 73 –
increased knowledge and sophistication. Through matrix sampling, one might imagine the collection of such data as part of an indicator system. At West Point, faculty have identified a series of goals they have for student accomplishment across the full range of the curriculum. Documenting such accomplishment is accomplished through a series of projects which are evaluated across the 4-course core curriculum required of all students. In the first course, students address a number of problems through project work in teams of two or three cadets. These projects, such as the one designed for second semester freshmen shown below, are completed over a two- to five-day period of time and then graded according to a rubric which reflects aspects each of the threads. Selected projects, such as the environmental problem illustrated, are repeated across the core courses to be examined through different lenses provided by each of the courses. Such a set of related problems allows for the students to later write a reflective analysis of the relative aspects of the various models presented through difference equations, differential equations, probabilistic models, and statistical models. While these project problems are not entirely open-ended, they do provide the students considerable latitude in the selection of methods and modes of reporting. Each project is required to be submitted in terms of an project précis, a technical explanation of the problem model and solution, and a computation appendix showing the actual computation of the solution. The "Bridge Jumping" example given in full below is taken from materials developed by Joe Myers, Dan Grey, Mike Jaye, and Steve Ressler as part of the Academy's interdisciplinary Lively Applications Package (1993).
BRIDGE JUMPING
Situation In bridge jumping, a participant attaches one end of a bungee cord to himself, attaches the other end to a bridge railing, and then drops off of the bridge. In this problem, the jumper will be dropping off of the Royal Gorge Bridge, a suspension bridge that is 1053 feet above the floor of the Royal Gorge in Colorado. The jumper will use a 200 foot long bungee cord. It would be nice if the jumper had a safe jump, meaning that the jumper does not crash into the floor of the gorge or run into the bridge on the rebound. In this problem you are going to do some analysis of the fall. Assume that the jumper weighs 160 lbs. The jumper will free-fall until the bungee cord begins to exert a force that acts to restore the cord to its natural position. In order to determine the spring constant of the bungee cord, you found that a mass weighing 4 lbs. stretches the cord 8 feet. Hopefully, this spring force will help to slow the descent sufficiently so that the jumper does not hit the floor of the gorge.

Chp. 4: Student Outcomes and Assessment
– 74 –
Throughout this problem, we will assume that down is the positive direction. Requirement 1 Before the bungee cord begins to retard the fall of the jumper, the only forces that act on the jumper are his weight and the force due to wind resistance. A. If the force due to wind resistance is 0.9 time the velocity of the jumper,
then use Newton's Second Law to write a differential equation that models the fall of the jumper.
B. Solve this differential equation and find: 1. a function that describes the jumper's velocity (as a function of time). 2. a function that describes the jumper's position (as a function of time). C. What is the velocity of the jumper after the jumper has fallen 200 feet? D. What is the terminal velocity of the jumper, if any?

Chp. 4: Student Outcomes and Assessment
– 75 –
Requirement 2 After a bit more research, you've found that the force due to wind resistance is not linear, as assumed above. Apparently, the force due to wind resistance is more closely modeled by 0.9v + 0.0009v2. A. Write a new differential equation governing the velocity of the jumper
(prior to the bungee cord coming into effect). B. You should notice that the new equation is not longer as easy to solve.
Nonetheless, you believe that you can determine the velocity of the jumper after 4 seconds by using a numerical solution technique. Choose a suitable stepsize, and estimate the velocity of the jumper after 4 seconds.
C. Find the terminal velocity, if any. D. How do your results compare with those found under the first
assumption. E. What is the relationship between velocity and position? F. What is the velocity of the jumper after the jumper has fallen 200 feet? Requirement 3 For the last part of our analysis, we'll consider what happens after the bungee cord comes into play. When the jumper reaches the point 200 feet below the bridge, the bungee cord begins to stretch. As we know, it takes some force to stretch the bungee cord, and the cord exerts an equal and opposite force upward. Hooke's law tells us that the force of the bungee cord will be directly proportional to the amount that it is stretched; that is F = ks, where F is the force exerted by the bungee cord, k is a constant of proportionality, and s is the distance that the cord is stretched beyond its normal length. to further retard the speed of the jumper, assume that there is a drag force due to air resistance. We'll assume that this force is an in Requirement 1; that is, assume that the force due to air resistance is equal to 0.9 times the velocity of the jumper. A. Write a differential equation that models the jumper's motion after the
bungee cord begins to stretch. What are the conditions that will allow you to solve the differential equation?
B. Solve the differential equation and find:

Chp. 4: Student Outcomes and Assessment
– 76 –
1. a function that describes the jumper's velocity (as a function of time). 2. a function that describes the jumper's position (as a function of time). C. Does the jumper crash into the floor of the gorge? If not, then what is the
distance from the floor of the gorge when the jumper begins to move upward?
D. How close to the bridge does the jumper come on the first rebound?
Explain the assumptions that you make in solving this portion of the problem?
E. How far below the bridge will the jumper be once the bouncing stops? Requirement 4 What assumptions have you made in your model? What effect will these assumptions have on your results? How could you refine your model? Requirement 5 How long should the bungee cord be if the jumper wants to touch the water on his jump? Make an attempt to find the length of the cord that would make the jumper's velocity zero at the time when the jumper reaches a point 1053 feet below the bridge. Find reasonable bounds on the length and discuss how you might solve this problem.

Chp. 4: Student Outcomes and Assessment
– 77 –
Needless to say, this is just one of many kinds of projects one could use in order to gain a longitudinal trace of students' developing mathematical sophistication. Many of the "reform" calculus, differential equations, and linear algebra courses offered nationwide offer opportunities for extended student projects; such projects could be used to chart student's developing mathematical sophistication. 4.2.6 Summary For the most part, there exist conceptual frameworks for the development of indicators for each of the populations that have been described in this section. Indicators of general mathematical literacy, of technical competence, of content and process fluency with calculus, and of the content knowledge required of teachers and mathematics majors are conceptually straightforward and within reach. Indicators of some of the process dimensions relevant for teaching, and of increased mathematics sophistication for mathematics majors, are not quite as accessible, but would yield to a significant development effort. In sum: were there a huge supply of money and time, we could develop and employ very good indicators at all of these levels – the knowledge is there, and the techniques are mostly available. The issue is cost.

Chp. 4: Student Outcomes and Assessment
– 78 –
4.2.7 Recommendations The initial work in determining indicators of undergraduate mathematics should focus on gathering relevant information for the following students populations:
1. the population at large (where issues of broad mathematical, scientific, and
technological literacy are paramount); 2. those who will use some amount of mathematics for technical careers
(including career tracks in two-year colleges); 3. those who use mathematics in the service of other majors or disciplines; 4. those who will teach mathematics at the elementary or secondary level;
5. those who will go on to careers in mathematics. Further, data collected from these groups should reflect the various assessment categories detailed in the recommendation tied to Issue 1, but do so through assessments that reflect the nature of population and the goals held for that population. For example, measures of knowledge reachable by traditional forms of assessment, by student constructed response formats, by extended project work, by portfolio methods, and by observations and interviews. Each of these approaches has some relevance to each of the populations, the degree to which cost and effort extend to each must be determined by a financial cost-benefit analysis in the construction of a set of national indicators.

Chp. 4: Student Outcomes and Assessment
– 79 –
4.3 ISSUE 3
IN WHICH ARENAS CAN THE ASSESSMENT SYSTEM "MAKE DO" WITH PROXIES, AND IN WHICH ARENAS IS DIRECT ASSESSMENT NECESSARY IN ORDER TO OBTAIN RELIABLE INFORMATION? HOW MIGHT DIRECT INFORMATION BE GATHERED? WHAT CURRENT CANDIDATES EXIST FOR USE AS EITHER DIRECT ASSESSMENT OR PROXIES?
The issues here are thorny. What we know how to do well is to measure by proxy: that is, in general know how to tailor tests to meet certain technical standards. Such tests can be made "reliable" in the technical sense, and they will correlate at some level with the things we care about. But, the field is increasingly coming to view such tests as inadequate. As mentioned above, the GRE Board has been working on revisions of the GRE advanced mathematics content examination to include "essay questions" because of the sentiment that the current format (despite having been designed to test for "cleverness" and "insight") does not provide adequate evidence of inventiveness, of the ability to put together coherent chains of reasoning, to write convincingly, etc. And the NAEP assessments were not constructed to support performance standards. The problem, if course, is that the costs of gathering, analyzing, and summarizing performance data are huge. Hence, an approach that seems reasonable is to:
a. identify those arenas in which proxies might work, and would be relatively uncontroversial; b. identify mechanisms for various kinds of sampling to get at other kinds of information.
With regard to (b), this might be done by looking at program- or course-based information on a sampling basis, asking for evidence about
classroom tests student projects portfolio assessments value-added assessments.

Chp. 4: Student Outcomes and Assessment
– 80 –
We begin with a discussion of various assessment technologies and approaches. Some have argued that contemporary mathematics assessments should abandon the historical use of a content by process matrix approach to developing assessments. It is argued that this approach tends to "discretize" mathematics into a number of watertight compartments rather than foster the view that mathematics is a set of integrated content and process knowledge. A discrete item matrix clearly affects the ability of the assessment to test students' knowledge of connections in mathematics since a given item has to be classified in a specific fashion (Silver, et al., 1991). Still others argue that the imposition of a process dimension on the examination sends the message that students who do not achieve on concept items will have little chance to study or test-on "higher-order" thinking skills, such as problem-solving (Resnick, 1987; Romberg, Zarinnia, and Collis, 1990). Still others argue that the areas might be better set by looking at a tools area, a connections/integration area, and a problem solving area, giving the focus to ways in which the mathematics is used, rather than trying to specify thought processes (de Lange, 1991). In addition to these content issues there is also the fact that classical test theory was strongly rooted in behaviorism and trait psychology, and that a major motivation for the creation of standard assessment technologies was the desire to spread students out, rather than to assess what they know as a basis for improving instruction and student learning. A desire to improve instruction and student learning lay at the foundation of the National Council of Teachers of Mathematics' Curriculum and Evaluation Standards for School Mathematics (NCTM, 1989). This document and its companion documents focusing on teaching, Professional Standards for the Teaching of Mathematics (NCTM, 1991), and assessment, Assessment Standards for School Mathematics (NCTM, 1995), provide a basis for examining the role of assessment in mathematics in light of new goals for mathematics instruction. The recent Principles and Standards for School Mathematics of NCTM is an important update of the earlier NCTM standards reports. The NCTM standards are extended by the Standards for Introductory College Mathematics Before Calculus developed by the American Mathematical Association of Two Year Colleges (AMATYC) in 1995. Other documents calling for change in assessment in mathematics education are the Mathematical Sciences Education Board's Counting on You (MAA, 1991), Measuring Up: Prototypes for Mathematics Assessment (MSEB, 1993a), and Measuring What Counts: A Conceptual Guide for Mathematics Assessment (MSEB, 1993b). All of these documents call for the infusion of "authentic assessments" into measures of students' growth in mathematics. These calls are joined by calls from state departments of education (e.g. Badger, 1989; Pandey, 1989, 1991),

Chp. 4: Student Outcomes and Assessment
– 81 –
other professional groups (e.g., Kulm, 1990, Stenmark, 1989), and individuals (e.g., Cole, 1990; Feinberg, 1990, Lesh, Lamon, Gong, and Post, 1992, Linn and Dunbar, 1990; Newman, 1991, Norris, 1989, Pandey, 1991, Resnick, 1987, Resnick & Resnick, 1989, and Snow, 1989). All of these call for making a closer match between the desired learner outcomes of education and the forms of assessment used. For instance, students' ability to form connections between mathematics and mathematics need not be assessed with multiple choice questions relating all of the needed information, but perhaps, through the completion of a project that requires students to collect the relevant data, form a display showing the patterns, and write an argument detailing the pattern of focus. Likewise, student selection and application of problem solving strategies cannot be observed through short-answer questions. teachers need to be able to observe and evaluate students' progress during the act of problem solving in order to have a solid record of the students' productive usage of heuristics. Objective tests offer little opportunity to observe students' ability to communicate in mathematics. this can only come through extended open–ended responses or project–type work in mathematics. Those calling for change in assessment in mathematics education suggest that a full range assessment program for a mathematics classroom would involve features of each of the following forms of assessment:
Observations Group Work Oral Questions Portfolios Written Tasks Standardized Tests Class Presentations Student Interviews Extended projects Performance Tasks Take-Home Tasks Criterion Referenced Tests Homework Journal
When looking at such a list, those steeped in classical test theory note the preponderance of forms of "subjective" assessments. However, they do not stop to think about the very fact that the selection of items for a supposedly objective test is very subjective in itself. It is only the scoring of the items on objective tests that is objective in nature. And, the scoring is not part of the discipline; the selection of the items is! It is through assessment that expectations are communicated to students. Students know that if it is important, it is assessed – in the ways that teacher think it is important. If all that is asked for are fill-in-the-blanks or select the correct answer, then the conception of mathematics conveyed to students is one of the regurgitation of memorized facts. If all is asked for is the computation of

Chp. 4: Student Outcomes and Assessment
– 82 –
an answer or a manipulation of symbols, the conception is one of mathematics as a procedural subject. If the assessment contains a balanced set of tasks requiring students to reason, solve problems, and communicate their findings for tasks across a wide panorama of mathematics, students come to see mathematics as a dynamic discipline. Changing the response format for students is only one of the changes needed in assessments in mathematics. Students should also have access to technology, e.g. calculators, computers, and resource materials, during some assessments. Such tools provide students appropriate support in testing conjectures, exploring alternative solution methods, and checking computational work in realistic settings. 4.3.1 Devising Dimensions for Mathematics Assessments Given the various arguments against the reliance on classical models for assessments constructed from specification matrices employing traditional computational and selection types of items, new models must be developed for the assessment of undergraduate mathematics. The question becomes one of how to balance content and process in realistic situations. Beyond this, there is the question of what assessment should be made of students' attitudes and beliefs (McLeod and Adams, 1989; Gable, 1986). The definition of "process" and how to measure it in mathematics can take many forms. One approach is to employ a Pólya–like approach. The stages that Pólya presented were Understanding the Problem, Devising a Plan, Carrying Out the Plan, and Looking Back (Pólya, 1945). This format has been modified to apply to scoring open-ended extended student-constructed response items in a number of assessment projects. It is possible to create an analytic rubric for scoring a problem that would present scores for each of the dimensions: modeling and formulating of the problem, manipulating and transforming the symbolic or spatial model; inferring and drawing conclusions from the data or evidence; and communication of the results. Scoring of extended student-constructed response items in the Population 3, terminal secondary school grade, portion of the Third International Mathematics and Science Study (TIMSS) will provide both a content related score and a score which relates to the solution path the student selected for the problem. A "process x action" scoring scheme developed by the Balanced Assessment project takes a similar approach. That scheme is one of four described by the project in its scoring materials. Other methods (detailed point

Chp. 4: Student Outcomes and Assessment
– 83 –
scoring, holistic scoring, holistic within category) reflect different ways of capturing "the knowledge base" as described in Section 4.1.1 above. Others have argued for a student-growth model (Giordano, 1994a). this is a model that argues for the assessment of students across a number of dimensions which interact with the content strands of the curriculum (algebra, analysis, combinatorics, probability, statistics,...) as the horizontal woof does with the longitudinal warp threads in a fabric. These dimensions along which students growth are measured over time agree well with the process goals of the NCTM and AMATYC standards. They include the strands crossed with the long–term, program–wide threads of mathematical reasoning, mathematical modeling, scientific computing, mathematical communication, and history of mathematics. In this approach mathematical reasoning is assessed through measures that describe students' abilities to interrelate numerical, graphical, verbal, and symbolic representations; to synthesize knowledge; to form conjectures; to apply deductive and inductive processes; and to infer in situations involving uncertainty. Mathematical modeling is measured through students' abilities to recognize when a quantitative, spatial, or probabilistic model may be useful; their ability to apply the modeling process; their identification of assumptions made in the process; and their capabilities at testing a model for sensitivity. Scientific computing is measured through observing student's use of technology as an aid in learning and doing mathematics; their ability to use technology to transform data into useful formats and operate on it in those formats; their ability to interrelate the meaning of information in different representations as presented and handled by technology; and their ability to recognize the capabilities and limitations of computational technology. Mathematical communication is assessed through analysis of the student's ability to read, listen, write, speak, and represent mathematics in clear and logical modes and through students ability to translate information from one mode to another in displaying ones thinking and reasoning. The history of mathematics thread is intended to assess a student's growth in seeing mathematics as a humanity. Students should show evidence of recognition of mathematics as a continuous human endeavor; have knowledge of key chronology and personalities involved; and understand the roles of mathematics both as a discipline in its own right and through a service function to other disciplines. 4.3.2 Classical Assessment Forms In this section we describe some of the forms of assessment that are available, and the kinds of information that can usefully be obtained from them. Some forms of assessment that can be used in collecting information from students to improve learning and inform teaching also provide ways of both selecting and

Chp. 4: Student Outcomes and Assessment
– 84 –
ranking students for identification and evaluation purposes. Historically, the tools of classical test theory, multiple-choice items, true-false items, and short response items have been employed in the name of reliability and because they were both quick and easy to administrate. Many also argued that they were objective forms of assessment – not, as we have noted, considering that the very selection of the items forming these assessments was a very subjective process at heart. The classical forms of items that call for the students to choose or select a response, such as the multiple-choice, true-false, or matching item, are appropriate items for quickly and inexpensively determining whether students have met the specific learning outcome that is being assessed. Multiple choice items can be used to measure the following outcomes:
• Knowledge of terminology What means the same as...? Which statement best defines the term...? • Knowledge of specific facts What is the name of...? What is the main difference between...? • Knowledge of conventions What is the one of the following rules applies to...? Which statement indicates the correct usage of...? • Knowledge of trends and sequences What will be the effect of...? What would be the shape of the curve for...? • Knowledge of classification and categories What are the classifications of...? Which one of the following is an example of...? • Knowledge of criteria What criteria were used by ….to judge...? Which one of the following is not an important criterion for...? • Knowledge of methodology What is the most important difference between method...and...? Which one of the following would be necessary to establish...? • Knowledge of principles and generalizations Which of the following principles best explains...? Which of the following best summaries the principle of...?

Chp. 4: Student Outcomes and Assessment
– 85 –
• Knowledge of theories and structures Which of the following best describes the structure of...? Which assumptions necessarily lead to...? (Gronlund, 1968, pp. 28-29)
Multiple choice items can be structured to get beneath the first level of recognition and selection. For example, the State of California created a number of what were called "enhanced" multiple-choice items that required students to connect a number of concepts and representations, as well as principles in selecting an answer. One such item is the following (Pandey, 1991):
T
• A piece of cardboard shaped like an equilateral triangle, with each side 6 cm in length, is rolled to the right a number of times. If the triangle stops so that the letter "T" is again in the upright position, which one of the following distances could it have rolled? A. 24 cm B. 30 cm C. 60 cm D. 90 cm True-False items have two general formats. The first asks students to judge a declarative sentence as being either true or false. The second asks students to either explain why if true or correct if false. These items are best used to determine whether students have the command of a fairly prescribed set of facts or knowledge about a specific concept or generalization. Matching items are a modification of a multiple-choice item. Instead of listing the correct answer and a list of distractors with each item, a master list of correct answers and distractors is assembled to serve several different items. This items format should only be used if all of the responses in the matching list could serve as a plausible response for a given item. Student Performance-Based Items With the changing views of assessment, the reasons of quick and easy must also be balanced against authentic and valid. What forms of assessment provide what kind of information for the teacher, the student, the decision maker? Contemporary views of mathematics as a dynamic interconnected discipline is not well captured by the traditional items which only call for students to select from a list of alternatives or to declare an item as true or false. Mathematics

Chp. 4: Student Outcomes and Assessment
– 86 –
cannot be represented by a single unique hierarchical structure composed of discrete, unconnected items. Knowing mathematics involves "sense making," the ability to negotiate meaning along with others from a contextualized situation. Likewise assumptions about learning have an effect on learning and assessment. Assessment items should allow students to demonstrate their mathematical power. Such items should require the students to illustrate active involvement with the content in a situated setting. These items would be noted by their emphasis on students doing mathematics, representing and communicating mathematics, and valuing mathematics as a way of thinking and problem solving. Stenmark (1991) notes that these items take on the qualities of essential, rather than tangential; authentic, rather than contrived; rich, rather than superficial; engaging, rather than uninteresting; active, rather than passive; feasible, rather than infeasible; equitable, rather than inequitable; and open, rather than closed (p. 16). Authentic performances are those that allows students to illustrate their command of process as well as content. Such items provide a broad sampling of the processes of problem-solving, reasoning, communicating, and connecting of their knowledge of mathematics and its applications. Such items can be used well with both individuals and groups. These methods range from open-ended questions to long-term project and journals. Open-ended questions span the range from students supplying the result of a numerical computation, the name of a mathematical object, or writing a short description of a mathematical situation to situations that provide students with a truly open-ended and then follow to see what paths the student follows in working with the information provided and their own knowledge of the situation at hand. Short, student-constructed response items are very similar to multiple choice items, with the exception that the student is not provided with any alternatives from which to choose. The student must carry out the task at hand and provide either a short numerical result or a verbal description. These items can been expanded a bit by asking students to supply a longer explanation responding to a situation, describing why a given result holds. Such items can be evaluated on a three–point rubric, perhaps one that indicates inability to perform (0), ability to note the critical aspect of the situation at hand (1), and ability to completely describe the situation, giving reasons for why the situation is either correct or incorrect (2). The following item dealing with graphical presentation of information illustrates such an item.

Chp. 4: Student Outcomes and Assessment
– 87 –
17. The pictograph shown above is misleading. Explain why.
Answer:
Such an approach could be used to ask students to describe their understanding of the stages in an algorithms use, to explain how they arrived at their answer in a problem, to provide extensions to a problem situation, or to test their ability to use technology to illustrate a given property or algorithm. Such work can be graded using an analytic scoring scale (Charles, et al., 1987). Understanding the 0: Complete misunderstanding of the problem Problem 1: Part of the problem misunderstood/misinterpreted 2: Complete understanding of the problem Planning a 0: No attempt, or totally inappropriate plan Solution 1: Partially correct plan base on part of the problem
being interpreted correctly 2: Plan could have led to a correct solution if
implemented correctly Getting an Answer
0: No answer, or wrong answer based on an inappropriate plan
1: Copying error; computational error; partial answer for a problem with multiple answers
2: Correct answer and correct label for the answer

Chp. 4: Student Outcomes and Assessment
– 88 –
Longer versions of this form of item can be used, such as the longer rubric form of item illustrated earlier in the path of object situation from the NAEP and a where a 6-point rubric was applied to evaluate the students' performances. The choice of open-ended item format and rubrics can run the gamut (Stenmark, 1991; Balanced Assessment, 1995; Dossey, et al., 1993; MSEB, 1993a, 1993b; New Standards Project, 1995). Other forms for student work include observations, interviews, and questions. Teachers must be prepared to involve the student in discourse as part of assessing students. Communication is one of the prime processes included in the processes at the heart of the goals for student learning. Observations should focus on students' abilities to organize, select, extend, and use concepts, principles, algorithms, tools, and relationships. They can also provide important information about students' dispositions toward mathematics and learning in general. Communication, especially students' use of justification and reasoning, is easily observed in students' production of examples, in their discussions with peers, and in their presentations. Finally, observations and interviews can be used to assess students' work in groups. Portfolios are suggested as a means of observing students' work over time. Most forms of assessment are cross-sectional, bound-in-time, measures. They tell little about the students' growth with respect to long-term objectives. Students can be asked to maintain a portfolio of their work, illustrating their projects, assignment
work, reports, and daily work. The materials in a portfolio can also be used to judge students' attitudes toward, valuing of, and self-confidence in mathematics.

Chp. 4: Student Outcomes and Assessment
– 89 –
In a like manner there are a number of questions about the evaluation of portfolios of student work. One clearly can develop a rating scale for each of the four main process skills and product a four-tuple describing a student's ability to problem-solve, to reason, to communicate, and to connect mathematics (apply math) both to other mathematics and to disciplines outside mathematics. Such an evaluation clearly speaks to the student's ability to recognize, formulate, solve, compute, and communicate the aspects of a given problem and its resolution. It should reflect students' growth in the selection and use of strategies. Over time, one should have a reflection of students' growth in the understanding and use of concepts, principles, procedures, and in their valuing and confidence in approaching mathematics. Other argue of the use of holistic levels approach to the evaluation of students' portfolios. Level 4 might indicate a portfolio that indicates a high level of student understanding and creative use of strategies to correctly solve problems and present the associated results. Such a portfolio has a clarity of communication and reflects the student's ability to assess his or her own work. The entire work suggests that the student has grown in both their knowledge of mathematics and their value of it. Level 3 indicates a solid plateau of work with above average explanations of its meaning. Students at this level reflect good understanding and have a positive outlook on mathematics and its value. Students at Level 2 have an adequate handle on mathematics, but their work displays some misunderstandings, with few extensions beyond the minimal classroom requirements for their performance. Their explanations are minimal in nature and display a limited command of the ability to communicate in mathematical situations. Level 1 portfolios reflect little creative work and little or no original student thinking (Stenmark, 1991). There are many other views on the use of portfolios in the learning and teaching of mathematics (Gearhart and Herman, 1995; Mathison, 1995; NCTM, 1995). 4.3.3 Summary As is clear, there are trade-offs concerning the ease of gathering and interpreting information and the meaningfulness and utility of such information. Currently accessible proxies do a poor job on all aspects of mathematical competence beyond simple subject matter mastery, and they do not necessarily do well at that. Various other methods are reliable to varying degrees, offer differing kinds of information, and tend to be much more expensive - but it may well be that judicious matrix sampling using such methods may allow us to draw a highly textured picture of national mathematical accomplishment. The art will be in balancing the use of various methods, to gain the information we need. In the

Chp. 4: Student Outcomes and Assessment
– 90 –
recommendations below we provide a tabular synopsis of the dimensions of such assessment methods. 4.3.4 Recommendation These various forms of assessment considered in Section 4.3 all have possibilities to contribute to the overall information about a student's learning of mathematics in a way that will help inform one's teaching. However, there is considerable variation in the nature and type of information that they present. Each has its good and bad features from an information, expense, effort, and student point of view. Any complete assessment of a student will probably make use of several of these forms. The following table helps compare and contrast the contributions that each of these forms of assessment makes to the overall information about the improvement of learning and the informing of teaching (Pandey, 1991). Decisions must be made about the balance of easy to collect, but high-inference data to be used in indicator models with the amount of more authentic data which inform instruction and curriculum development through their low-inference nature. Type of Assessment Approach
Feature Multiple-Choice Open-Ended Projects Portfolios Time per Task
1-2 minutes 5-45 minutes 2-5 hours variable
Correct Answer
One Many Many NA
Who Creates Responses
Teacher Student Student Student
Scoring Answer key Judging Judging Judging View of Mathematics
Static Instrumental
Static/ Dynamic
Dynamic Conceptual
Dynamic Conceptual
Model of Instruction
Behavioral Cognitive Cognitive Cognitive
Student Self- Assessment
Little Some Much Much
Collaboration No No Yes Maybe Use to Teacher
Little Very Much Very Much Extensive
Manipulatives Seldom Seldom Yes Yes Technology Seldom Yes Yes Yes Cost in Money or Time
Little More Considerable High

Chp. 4: Student Outcomes and Assessment
– 91 –
References
American Mathematical Association of Two-Year Colleges. (1995). Standards for introductory college mathematics before calculus. Cobleskill, NY: SUNY at Cobleskill.
Badger, E. (1989). On their own: Student response to open-ended tests in mathematics. Quincy, MA: Massachusetts Department of Education.
Balanced Assessment Project. (1995). Taking assessment to task. In Assessment in Practice, 2(1), p. 8-9.
Balanced Assessment Project. (in process). A framework for balance. Berkeley, CA; Balanced Assessment Project.
Ball, D. (1988). Unlearning to teach mathematics. For the learning of mathematics, 8(1), 40-48.
Barton, P., & Jenkins, L. (1995). Literacy and dependency: The literacy skills of welfare recipients in the United States. Princeton, NJ: Educational Testing Service.
Becker, J. R., & Pence, B. J. (1994). The teaching and learning of college mathematics: Current status and future directions. In J. J. Kaput and E. Dubinsky. (Eds.). Research issues in undergraduate mathematics learning: Preliminary analyses and results (Mathematical Notes #33). Washington, DC.: Mathematical Association of American.
Board on Mathematical Sciences. (1990). A challenge of numbers: People in the mathematical sciences. Washington, DC.: National Academy Press.
Board on Mathematical Sciences. (1991). Moving beyond myths: Revitalizing undergraduate mathematics. Washington, DC.: National Academy Press.
Board on Mathematical Sciences. (1994). Modern interdisciplinary university statistics education. Washington, DC.: National Academy Press.
Bransford, j., Hasselbring, T., Barron, B., Kulewicz, S., Littlefield, J., & Goin, L. (1988). The use of macro contexts to facilitate mathematical thinking. In R. Charles and E. Silver (Eds.), The teaching and assessing of problem solving. (pp. 125-147). Reston, VA: NCTM.
Brown, A. (1987). Metacognition, executive control, self-regulation, and other more mysterious mechanisms. In F. Reiner & R. Kluwe (Eds.). Metacognition, motivation, and understanding (pp. 65-116). Hillsdale, NJ: Lawrence Erlbaum.

Chp. 4: Student Outcomes and Assessment
– 92 –
Burkhardt, H. (1988). Teaching problem solving. In H. Burkhardt, S. Groves, A. Schoenfeld, & K. Stacey (Eds.). Problem solving–A world view (Proceedings of the problem solving theme group, ICME 5) (pp. 17-42). Nottingham, England, Shell Centre.
Charles, R., Lester, F., O'Daffer, P. (1987). How to evaluate progress in problem solving. Reston, VA: NCTM.
Cole, N. (1990). Conceptions of educational achievement. Educational Researcher, 19 (April), 2–7.
Collins, T. W., Gentry, D. K., & Crawley, V.O. (1993). Gaining the competitive edge: Critical issues in science and engineering technician education. Washington, DC.: National Science Foundation.
Committee on the Undergraduate Program in Mathematics. (1965). A general curriculum in mathematics for colleges. Berkeley, CA: CUPM.
Committee on the Undergraduate Program in Mathematics. (1981). Recommendations for a general mathematical sciences program. Washington, DC.: Mathematical Association of America.
Committee on the Undergraduate Program in Mathematics. (1991). The undergraduate major in the mathematical sciences. Washington, DC.: Mathematical Association of America.
Cronbach, L. J. (1960). Essentials of psychological testing (Second Edition). New York, NY: Harper and Brothers, Publishers.
Crosswhite, F. J., Dossey, J. A., Swafford, J. O., McKnight, C. C., Cooney, T. J., Downs, F. L., Grouws, D. A., Travers, K. J., & Weinzweig, A. I. (1986). Second International Mathematics Study detailed report for the United States. Champaign, IL: Stipes.
CUPM Subcommittee on Quantitative Literacy. (1998). Quantitative literacy in the undergraduate curriculum. Washington, D.C.: Mathematical Association of America.
de Lange, J. (1991). Higher order thinking and higher order (un-)teaching. Paper presented at the Third UCSMP International Conference on Mathematics Education, University of Chicago, IL, November 1, 1991.
Dossey, J. A., Mullis, I. V. S., & Jones, C. O. (1993). Can students do mathematical problem solving? Results from constructed–response questions in NAEP's 1992 mathematics assessment. Washington, DC: National Center for Education Statistics.
Dossey, J. A., Mullis, I. V. S., Gorman, S., & Latham, A. (1994). How school mathematics functions: Perspectives from the NAEP 1990 and 1992 assessments. Washington, DC: National Center for Education Statistics.
Douglas, R. (Ed.). Toward a lean and lively calculus (MAA Notes #6). Washington, DC: MAA.
Feinberg, L. (1990). Multiple–choice and its critics: Are the alternatives any better? The College Board Review, 157 (Fall), 13–17, 30–31.
Ferrini-Mundy, J. (in progress). Evaluation of the Harvard Consortium Calculus Project. Durham, NH: University of New Hampshire Mathematics Department.

Chp. 4: Student Outcomes and Assessment
– 93 –
Forman, S. (1995). Report of Working Group 3. In LaCampagne, C., Blair, W., & Kaput, J. (Eds.). The algebra initiative colloquium. (2 vols). Washington, DC.: U.S. Department of Education.
Frederiksen, N., Mislevy, F. J., & Bejar, I. I. (Eds.). (1993). Test theory for a new generation. Hillsdale, NJ: Erlbaum.
Fullan, M. (1993). Change forces: Probing the depths of educational reform. London, England: The Falmer Press.
Gable, R. K. (1986). Instrument development in the affective domain. Boston, MA: Kluwer.
Garofalo, J., & Lester, F. (1985). Metacognition, cognitive monitoring, and mathematical performance. Journal for Research in Mathematics Education, 16, 163-176.
Gearhart, M., & Herman, J. L. (1995). Portfolio assessment: Whose work is it? Issues in the use of classroom assignments for accountability. Evaluation Comment, Winter, 1995, pp. 1–16. (Center for the Study of Evaluation, UCLA).
Ghiselli, E. E. (1964). Theory of psychological measurement. New York, NY: McGraw–Hill.
Giordano, F. (1994a). Core mathematics at USMA. West Point, NY: United States Military Academy.
Giordano, F. (1994b). Results of the 1994 Mathematical Contest in Modeling. The UMAP Journal, 15, 187-206.
Greeno, J.G., Pearson, P. D., & Schoenfeld, A.H. (1997). Assessment in Transition: Monitoring the nation's educational progress. Stanford, CA: The National Academy of Education. Background Studies, 151-215.
Gronlund, N. E. (1965). Measurement and evaluation in teaching. Toronto, Ontario: Collier–Macmillan Limited.
Gronlund, N. E. (1968). Constructing achievement tests. Englewood Cliffs, NJ: Prentice–Hall.
Heller, J., & Hungate, H. (1985). In E. A. Silver, (Ed.). Teaching and learning mathematical problem solving: Multiple research perspectives (pp. 83-112). Hillsdale, NJ: Lawrence Erlbaum.
Hughes-Hallet, D., & Gleason, A. (1994). Calculus. New York, NY: John Wiley & Sons, Inc.
Kirsch, I. S. (1994). Adult literacy in America. Washington, DC.: U. S. Department of Education.
Kulm, G. (Ed.). (1990). Assessing higher order thinking in mathematics. Washington, D.C.: American Association for the Advancement of Science.
Lampert, M. (1989). Choosing nd using mathematical tools in classroom discourse. In J. Brophy (Ed.), Advances in research on teaching (pp. 223-264). Greenwich, CT: JAI Press.
Lampert, M. (1990). When the problem is not the question and the solution is not the answer: Mathematical knowing and teaching. American Educational Research Journal, 27, 29-63.

Chp. 4: Student Outcomes and Assessment
– 94 –
Leitzel, J. R. C. (Ed.). (1991). A Call for Change: Recommendations for the mathematical preparation of teachers of mathematics. Washington, DC: MAA.
Lesh, R. (1983). Metacognition in mathematical problem solving. Unpublished manuscript. Available from author at National Science Foundation.
Lesh, R. (1985). Conceptual analyses of problem solving performance. In E. A. Silver, (Ed.). Teaching and learning mathematical problem solving: Multiple research perspectives (pp. 309-330). Hillsdale, NJ: Lawrence Erlbaum.
Lesh, R., Lamon, S., Gong, B., & Post, T. R. (1992). Using learning progress maps to improve instructional decision making. In R. Lesh & S. Lamon, (Eds.), Assessment of authentic performance in school mathematics (343-375). Washington, DC: American Association for the Advancement of Science.
Lindquist, M. M., Dossey, J. A., & Mullis, I. V. S. (1995). Reaching standards: A progress report on mathematics. Princeton, NJ: Educational Testing Service.
Linn, R. L., & Dunbar, S. B. (1990). the nation's report card goes home: Good news and bad about trends in achievement. Phi Delta Kappan, 72 (October), 127–133.
McKnight, C. C., Crosswhite, F. J., Dossey, J. A., Kifer, E., Swafford, J. O., Travers, K. J., & Cooney, T. J. (1987). The underachieving curriculum: Assessing U. S. school mathematics from an international perspective. Champaign, IL: Stipes.
McLeod, D. B., & Adams, V. M. (Eds.). (1989). Affective and mathematical problem solving: A new perspective. New York, NY: Springer-Verlag.
Marshall, S. (1990). The assessment of schema knowledge for arithmetic story problems: A cognitive science perspective. In G. Kulm. (Ed.). Assessing higher order thinking in mathematics (pp. 155-168). Washington, DC: American Association for the Advancement of Science.
Mathematical Association of America. (1983). Recommendations for the mathematical preparation of teachers. MAA Notes #2. Washington, DC.: MAA.
Mathematical Association of America. (1991). A call for change: Recommendations for the mathematical preparation of teachers of mathematics. Washington, DC.: MAA.
Mathematical Sciences Education Board. (1991). Counting on you: Actions supporting mathematics teaching standards. Washington, DC: National Academy Press.
Mathematical Sciences Education Board. (1993a). Measuring up: Prototypes for mathematics assessment. Washington, DC: National Academy Press.
Mathematical Sciences Education Board. (1993b). Measuring what counts: A conceptual guide for mathematics assessment. Washington, DC: National Academy Press.
Mathisen, S. (1995). Using student portfolios in mathematics: Issues in the reform of assessment. Linkages: Reviews of Research and Practice, 2, p. 1-4 (College of Education, University of Illinois at Urbana-Champaign).

Chp. 4: Student Outcomes and Assessment
– 95 –
Minstrell, J. (1989) Teaching science for understanding. In L. B. Resnick & L. E. Klopfer (Eds.), Toward the thinking curriculum: Current cognitive research. Washington, DC: Association for Supervision and Curriculum Development.
Mislevy, R. J. (1993). Foundations of a new test theory. In N. Frederiksen, F. J. Mislevy, & I. I. Bejar (Eds.), Test theory for a new generation (19–40). Hillsdale, NJ: Erlbaum.
Myers, J., Grey, D., Jaye, M., & Ressler, S. (1995). Bungee Cord Jumping. Lexington, MA: The Consortium for Mathematics and Its Applications.
National Academy of Education. (1993). Setting Performance Standards for Student Achievement. Stanford, CA: Author.
National Assessment Governing Board. (1995). Mathematics framework for the 1996 National Assessment of Educational Progress. Washington, DC: NAGB.
National Board for Professional Teaching Standards. (1995). School -site portfolio. Princeton, NJ: ETS.
National Center for Education Statistics. (1992). National assessment of college student learning: Issues and concerns. Washington, DC.: U. S. Department of Education.
National Center for Education Statistics. (1994a). A preliminary study of the feasibility for national policy of instructional "good practice" indicators in undergraduate instruction. Washington, DC.: U. S. Department of Education.
National Center for Education Statistics. (1994b). The national assessment of college student learning: Identification of the skills to be taught, learned, and assessed.. Washington, DC.: U. S. Department of Education.
National Council of Teachers of Mathematics. (1981). Guidelines for the preparation of teachers of mathematics. Reston, VA: Author.
National Council of Teachers of Mathematics. (1989). Curriculum and evaluation standards for school mathematics. Reston, VA: Author.
National Council of Teachers of Mathematics. (1991). Professional standards for the teaching of mathematics . Reston, VA: Author.
National Council of Teachers of Mathematics. (1995). Assessment standards for school mathematics. Reston, VA: Author.
National Council of Teachers of Mathematics. (2000). Principles and standards for school mathematics. Reston, VA: Author.
National Science Foundation. Indicators of science and mathematics education: 1992. Washington, DC: NSF.
New Standards Project. (1995). Performance standards. (Draft 4.1). Pittsburgh, PA: Learning Research and Development Center.

Chp. 4: Student Outcomes and Assessment
– 96 –
Newell, A. (1983) The heuristic of George Pólya and its relation to artificial intelligence. In R. Groner, M. Groner, & W. Bishof (eds.). Methods of heuristics (pp. 195-243). Hillsdale, NJ: Lawrence Erlbaum.
Newman, F. M. (1991). Linking restructuring to authentic student achievement. Phi Delta Kappan, 72 (February), 458–463.
Norris, S. P. (1990). Can we test validity for critical thinking? Educational Researcher, 19 (April), 2–7.
Pandey, T. (Ed.). (1989). A question of thinking: A first look at students' performance on open–ended questions in mathematics. Sacramento, CA: California Department of Education.
Pandey, T. (Ed.). (1991). A sampler of mathematics assessment. Sacramento, CA: California Department of Education.
Polya, G. (1945). How to solve it. Princeton, NJ: Princeton University Press.
Resnick, L. B. (1987). Education and learning to think. Washington, DC: National Academy Press.
Resnick, L. B., & Resnick, D. P. (1989). Assessing the thinking curriculum: New tools for educational reform. In B. R. Gifford and M. C. O'Connor (Eds.), Future assessments: Changing views of aptitude, achievement, and instruction. Boston, MA: Kluwer Academic Publishers.
Rissland, E. (1985). Artificial intelligence and the learning of mathematics: A tutorial sampler. In E. A. Silver, (Ed.). Teaching and learning mathematical problem solving: Multiple research perspectives (pp. 147-176). Hillsdale, NJ: Lawrence Erlbaum.
Romberg, T. A., Zarinnia, E. A., & Collis, K. F. (1990). A new world view of assessment in mathematics. In G. Kulm, (Ed.), Assessing high order thinking in mathematics (pp. 21–38). Washington, DC: American Association for the Advancement of Science.
Schoenfeld, A. (1985). Mathematical problem solving. New York, NY: Academic Press.
Schoenfeld, A. (1992). Learning to think mathematically: Problem solving, metacognition, and sense making in mathematics. In D. A. Grouws. (Ed.). Handbook of research on mathematics teaching and learning (pp. 334-370). New York, NY: Macmillan.
Schoenfeld, A., Dubinsky, E., Gleason, A., Harnisch, D., Kaput, J., Kifer, S., Moore, L., Newman, R., Swafford, J. (1997). Student assessment in calculus. Washington, DC: Mathematical Association of America. MAA Notes Number 43.
Secretary's Commission on Achieving Necessary Skills. (1991). What work requires of schools: A SCANS report for AMERICA 2000. Washington, DC: United States Department of Labor.
Silver, E. A. (1979). Student perceptions of relatedness among mathematical verbal problems. Journal for Research in Mathematics Education, 10, 195-210.
Silver, E. A. (1981). Recall of mathematical problem information: Solving related problems. Journal for Research in Mathematics Education, 12, 54-64.

Chp. 4: Student Outcomes and Assessment
– 97 –
Silver, E. A. (1982). Thinking about problem solving: Toward an understanding of metacognitive aspects of problem solving. Paper presented at the Conference on Thinking, Suva, Fiji, January.
Silver, E. A. (Ed.). (1985). Teaching and learning mathematical problem solving: Multiple research perspectives. Hillsdale, NJ: Lawrence Erlbaum.
Silver, E. A., Branca, N., & Adams, V. (1980). Metacognition: The missing link in problem solving? In R. Karplus (Ed.). Proceedings of the Fourth International Congress on Mathematical Education (pp. 429-433). Boston, MA: Birkhäuser.
Silver, E. A., Kenney, P. A., & Salmon-Cox, L. (1991). The content and curricular validity of the 1991 NAEP mathematics items: A retrospective analysis. Pittsburgh, PA: Learning Research and Development Center.
Snow, R. E. (1989). toward assessment of cognitive and conative structures in learning. Educational Researcher, 18 (December), 8-14.
Steen, L. A. (1988). Calculus for a new century (MAA Notes #8). Washington, DC: MAA.
Steen, L. A., & Forman, S. L. (1995). Mathematics for work and life. In I. Carl (Ed.). Prospects for school mathematics(pp. 219-241). Reston, VA: NCTM.
Stenmark, J. K. (Ed.). (1989) Assessment alternatives in mathematics: An overview of assessment techniques that promote learning. Berkeley, CA: EQUALS Project, Lawrence Hall of Science.
Stenmark, J. K. (Ed.). (1991 ) Mathematics assessment: Myths, models, good questions, and practical suggestions. Reston, VA: NCTM.
Stevenson, H., Lee, S., & Stigler, J. (1986). Mathematics achievement of Chinese, Japanese, and American children. Science, 231 693-699.
Stodolsky, S. S. (1985). Telling math: Origins of math adversion and anxiety. Educational Psychologist, 20, 125-133.
Tucker, A. (February, 1995). New GRE mathematical reasoning test. Focus, 15(1), 14-16.
Vermont Department of Education. (1992). Looking beyond "The answer"(Report of Vermont's Mathematics Portfolio Assessment Program). Montpelier, VT: Vermont Department of Education.
Yackel, E., Cobb, P., Wood, T., Wheatley, G., & Merkel, G. (1990). The importance of social interaction in children's construction of mathematical knowledge. In T. Cooney & C. Hirsch (Eds.). Teaching and Learning Mathematics in the 1990s (1990 Yearbook of the NCTM) (pp. 21-21). Reston, VA: NCTM.