CHAPTER IV RESULTS AND DISCUSSION
11
RESULTS AND DISCUSSION CHAPTER IV These experiments involved the search for suitable conditions to convert low- density polyethylene with lignite to oil products in high yield by using Ni-Mo/Alumina as catalyst. The low-density polyethylene was selected for this study, because a large quantity of demand for thermoplastic in the world where some part of this would cause the environment’s problem. The catalyst Ni-Mo/Alumina was selected, because Ni and Mo were the active component which give high activity for hydrocracking as well as for hydrogenation reaction. The alumina was chosen as support because it was acidic which was appropriate also for cracking hydrocarbon and was easily impregnated with Ni and Mo by Ni being maintained at high metal dispersion. 4.1 Ultimate and Proximate Analysis of Coal The ultimate analysis comprised of determinations of percentage of carbon, hydrogen, nitrogen and sulfur. The proximate analysis was the most widely used method for analyzing coal. The proximate analysis expressed percentage of ash, volatile matter and fixed carbon. The results of ultimate analysis and proximate analysis were shown as Tables 4.la n d 4.2 respectively. Table 4.1: Ultimate analysis of lignite coal Time %c %H %N %s 1 35.204 3.462 1.420 4.040 2 35.308 3.622 1.517 3.893 Average 35.256 3.542 1.468 3.967
Transcript of CHAPTER IV RESULTS AND DISCUSSION

R E S U L T S A N D D IS C U S S IO NC H A P T E R IV
T hese experim ents involved the se a rc h for suitable conditions to convert low- density polyethylene with lignite to oil p roduc ts in high yield by using Ni-Mo/Alumina as catalyst. The low-density polyethylene w as se lec ted for this study, b e c a u se a large quantity of d em and for therm oplastic in the world w here som e part of this would c au se the environm ent’s problem . The catalyst Ni-Mo/Alumina w as se lected , b e c a u se Ni and Mo w ere the active com ponen t which give high activity for hydrocracking a s well a s for hydrogenation reaction. The alum ina w as ch o sen a s support b ec a u se it w as acidic which w as appropria te also for cracking hydrocarbon and w as easily im pregnated with Ni and Mo by Ni being m aintained at high metal dispersion.
4.1 U ltim ate a n d P ro x im a te A n a ly s is o f C oal
The ultimate analysis com prised of determ inations of p ercen tag e of carbon, hydrogen, nitrogen and sulfur. The proxim ate analysis w as the m ost widely u sed m ethod for analyzing coal. The proxim ate analysis e x p re sse d percen tage of ash , volatile m atter and fixed carbon.
The results of ultimate analysis and proxim ate analysis w ere shown a s Tables 4 .l a n d 4.2 respectively.
Table 4 .1 : Ultimate analysis of lignite coal
Time % c %H %N % s1 35.204 3.462 1.420 4.0402 35.308 3.622 1.517 3.893
A verage 35.256 3.542 1.468 3.967
37
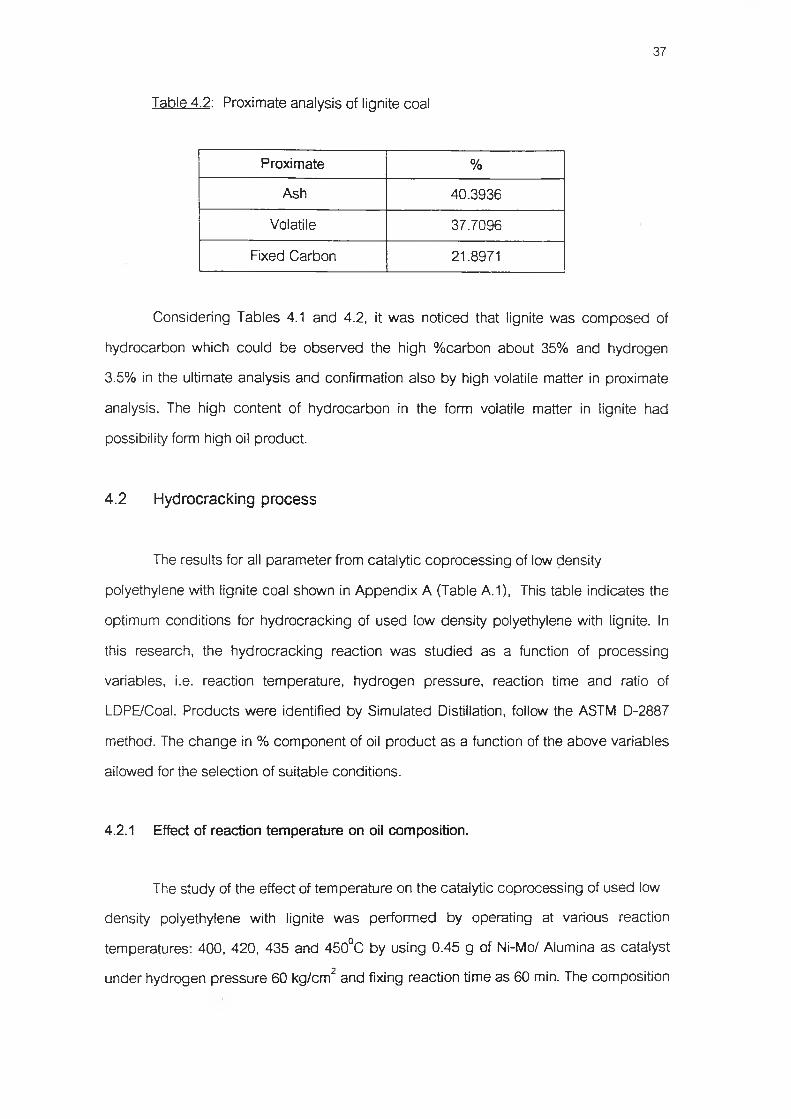
Table 4 .2 : Proxim ate analysis of lignite coal
Proxim ate %Ash 40.3936
Volatile 37.7096Fixed Carbon 21.8971
C onsidering Tables 4.1 and 4.2, it w as noticed that lignite w as co m p o sed of hydrocarbon which could b e observed the high % carbon abou t 35% and hydrogen 3.5% in the ultimate analysis and confirmation also by high volatile m atter in proxim ate analysis. The high con ten t of hydrocarbon in the form volatile m atter in lignite had possibility form high oil product.
4 .2 H y d ro c rack in g p r o c e s s
The results for all p aram eter from catalytic co p ro cessin g of low density polyethylene with lignite coal shown in A ppendix A (Table A.1), This table ind icates the optimum conditions for hydrocracking of u sed low density polyethylene with lignite. เท this research , the hydrocracking reaction w as stud ied a s a function of processing variables, i.e. reaction tem perature, hydrogen p ressu re , reaction time and ratio of LDPE/Coal. P roducts w ere identified by Sim ulated Distillation, follow the ASTM D-2887 m ethod. The c h a n g e in % com ponen t of oil p roduct a s a function of the ab o v e variables allowed for the selection of su itab le conditions.
4.2.1 Effect o f reaction temperature on oil composition.
The study of the effect of tem peratu re on the catalytic cop rocessing of u sed low density polyethylene with lignite w as perform ed by operating at various reaction tem peratures: 400, 420, 435 and 4 5 0 °c by using 0.45 g of Ni-Mo/ Alumina a s catalyst under hydrogen p re ssu re 60 kg/cm 2 and fixing reaction tim e a s 60 min. The com position
38
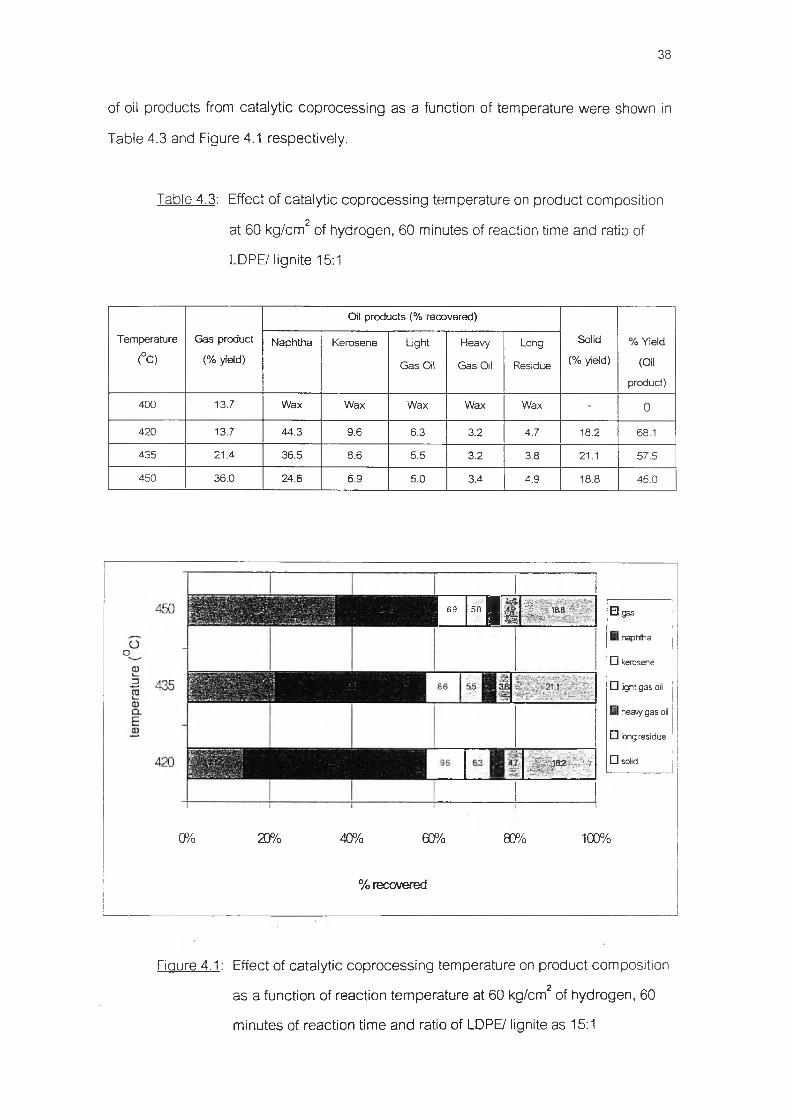
of oil p roducts from catalytic co p ro cessin g a s a function of tem perature w ere shown in Table 4.3 and Figure 4.1 respectively.
Table 4 ,3 : Effect of catalytic co p ro cessin g tem perature on product com position at 60 kg/cm 2 of hydrogen, 60 m inutes of reaction time and ratio of LDPE/ lignite 15:1
Temperature
(°C)
Gas product
(% yield)
Oil products (% recovered)
Solid
(% yield)% Yield
(Oil
product)
Naphtha Kerosene Ught
Gas Oil
Heavy
Gas Oil
Long
Residue
400 13.7 Wax Wax Wax Wax Wax - 0
420 13.7 44.3 9.6 6.3 3.2 4.7 18.2 68.1
435 21.4 36.5 8.6 5.5 3.2 3.8 21.1 57.5
450 36.0 24.8 6.9 5.0 3.4 4.9 18.8 45.0
6.9 5.0 i mÜ l
n i | î i & 8 1
ฒ เ382-i f นุI
ElgasI naphtha
Q kerosene n light gas oil
I heavy gas oil □ tong residue D solid
CP/o 20% 40% 60% 80% 100%
% recovered
Figure 4 .1 : Effect of catalytic co p ro cessin g tem peratu re on product com position a s a function of reaction tem pera tu re at 60 kg/cm2 of hydrogen, 60 m inutes of reaction time and ratio of LDPE/ lignite as 15:1
39
From the Table 4.3 and Figure 4.1; th e effect of reaction tem peratu re on the catalytic cop ro cessin g of u sed low density polyethylene with lignite coal under 60 kg/cm 2 of hydrogen an d 60 min of reaction time. When the reaction tem peratu re increases from 420 to 4 50°c , the thermal cracking of long chain hydrocarbon from LDPE and lignite firstly broke down with high tem peratu re to form lower hydrocarbon such as g a se s (0 ,-0 5) kerosene and g a s oil. N aphtha, kerosene and g a s oil w ere converted also to g a se s . N evertheless therm al and catalytic c rack s w ere the com petitive reactions, but Ni-Mo/Alumina w as not so active a s zeolite. For th ese reasons the p e rcen tag e of g aseo u s product increased with an in crease reaction tem perature. The p e rcen tag e of recover of naphtha d e c re a s e s largely with an increase reaction tem perature from 44% to 24%, b e c a u se catalytic w as dom inated by thermal cracking. เท the contrary, the increase of tem perature, the g a se o u s product increased largely from 13% to 36%, this confirmed the idea above.
เท conclusion, it w as found that, the optimum reaction tem perature w as 420°c b e c a u se it g ave high naphtha 44%, kerosene 9.6%, g a s oil 9.5% and low g a se o u s product 9.5%. This tem peratu re w as u sed to study for other variables.
4.2.2 Effect o f pressure o f hydrogen on oil composition
The study of the effect of hydrogen p re ssu re w as perform ed by various p ressu res a t 30, 45, 60 and 75 kg/cm 2. The catalytic coprocessing of low density polyethylene with lignite coal at the optimum reaction tem perature is 4 2 0 °c , 60 min of reaction time and ratio of LDPE/lignite a s 15:1. The com positions of p roducts from hydrocracking oil w ere shown in Table 4.4 and Figure 4.2 respectively.

40
Table 4 .4 : The effect of hydrogen p re ssu re on product com position at 420°c of reaction tem perature, 60 m inutes reaction time and ratio of LDPE/ lignite as 15:1.
P ressu re(kg/cm2)
G as product (% yield)
Oil p roducts (% recovered)Solid
(% yield)% Yield
(Oilproduct)
N aphtha K erosene Light G as Oil
Heavy G as Oil
LongR esidue
30 9.3 Wax Wax Wax Wax Wax - 045 10.9 34.9 7.9 5.1 3.7 5.4 32.1 57.160 13.7 44.3 9.6 6.3 3.2 4.7 18.2 68.175 20.7 38.3 8.6 5.3 3.6 3.6 19.9 59.4
Ë3 gas M naphtha D kerosene D light gas oil D heavy gas oil D tong residue o solid
CP/o 10% 20% 30% 4C% 5C% 60% 70% 8C% ๓% 10C%
% recovered
Figure 4 ,2 : The effect of hydrogen p re ssu re on product com position at 4 2 0 °c of reaction tem perature, 60 m inutes of reaction time and ratio of LDPE/ lignite coal a s 15:1 a s a function of hydrogen pressure .

41
increased the %yield of oil p roduct by 11% while at p ressu re of 75 kg/cm 2the %yield of oil product d e c re a se d . It w as m entioned before that the thermal and catalytic cracking seem ed having the sa m e rate of reaction. W hen hydrogen concentration increased it would prom ote the catalytic reaction by increasing more hydrogen free radical. Thus catalytic cracking could b e occurred than therm al cracking at 75 kg/cm 2 of hydrogen p ressu re a s a result, a d e c re a se d the %yield of oil product, naphtha, kerosene, g a s oil, but g a seo u s p roduct increased , w hereas solid increased which it confirm ed more reaction a t the su rface of lignite. The hydrocracking reaction could not o ccu r at 30 kg/cm 2. However, a s se e n in Table 4.4 and Figure 4.2, w hen the hydrogen p ressu re w as increased from 30 to 75 kg/cm 2, the p e rcen tag e of recovered of naphtha w as increased until hydrogen p re ssu re at 75 kg/cm 2 in which the p e rcen tag e of recovered w as seem ed d ec reased .
The optimum hydrogen p ressu re condition w as 60 kg/cm 2 of hydrogen for high p ercen tag e yields of the oil p roduct w as 68.1% and the highest product distribution w as44.3 % and 9.6 % recovered of naphtha and kerosene respectively.
4.2.3 Effect of reaction time on oil composition
The effect of reaction time on the p e rcen tag e recovered of reaction system s, Coal/LDPE w as carried out for the reaction time by fixing the condition a t 4 2 0 °c of reaction tem perature, 60 kg/cm 2 of hydrogen and ratio of LDPE/Lignite coal a s 15:1. The com position of the oil p roduct w as analyzed and p resen ted in Table 4.5 and Figure 4.3 respectively.
From Table 4.5 and Figure 4.3 it show ed that w hen the reaction time increased from 30 to 60 min, the % yields of oil and % naphtha increased , w hereas other com ponents being the sam e quantities. After reaction time more than 60 min, we observed the d e c reas in g of % yield of oil and % naphtha, in the contrast w e noticed the increasing of long resid u e and solid. The experim ents w ere fixed the tem pera tu re and p ressu re of hydrogen, so the thermal and catalytic cracking w ere occurred the sam e

42
phenom ena w hen the reaction time increased to 60 min. We obtained the maximum % yield, % naphtha and low est %solid, it m ean s that this appropria te condition cause . Thermal cracking (changing long hydrocarbon to m oderate chain) co rrespond ing to catalytic cracking the m oderate chain hydrocarbon from thermal cracking in the sam e time. When the reaction tim e m ore than 60 min the catalytic reaction w as nearly faster than thermal cracking an d long time also c a u se d coking at the surface of catalyst; a s a result w e observed the % decreasing of % naphtha, kerosene and % yield.
เท the sa m e w ay w e observ ed also that w hen the longer time of reaction, the overall %of m odera te long chain su ch a s kerosene, g a s oil and long residue d e c reased , while % solid increased , it m ean that this time cau sed the d e c re a se the activity of catalytic cracking, but thermal cracking still working.
Table 4 ,5 : The effect of reaction time on product com position a t 420°c of reaction tem perature, 60 kg/cm 2 of hydrogen and ratio of LDPE/lignite a s 15:1
Time
(min)
Gas product
(% yield)
Oil products (% recovered)
Solid
(%yield)% Yield
(Oil
product)
Naphtha Kerosene Ught
Gas Oil
Heavy
Gas Oil
Long
Residue
30 13.4 26.1 8.3 7.5 6.3 14.4 24.0 62.6
60 13.7 44.3 9.6 6.3 3.2 4.7 18.2 68.1
90 17.1 18.1 8.2 6.5 5.5 11.7 32.9 49.8
120 18.4 15.2 5.5 6.5 5.5 15.1 33.8 47.8
180 20.9 11.5 4.6 7.2 6.0 15.0 37.8 44.5

43
ggESBnaphiha□ kerosene
D light gas oil
□ heavy gasd
□ long residue
□ residue
CP/o 20% 40% 60% 80% 100%% recovered
Figure 4 .3 : Oil p roduct a s a function of reaction time, at 4 2 0 °c ofreaction tem perature, 60 kg/cm 2 of hydrogen and ratio of LDPE: lignite a s 15:1.
The optimum of reaction time w as 60 min, b e c a u se this time gave the h ighest %yield of oil 68.1 and % naph tha 44.3 a t condition of 4 2 0 °c of reaction tem perature,60 kg/cm 2 of hydrogen and ratio of LDPE: lignite a s 15:1.
4.2.4 Effect o f ratio o f LDPE/lignite on oil composition
The study of the effect of ratio of LDPE/Coal on catalytic cop rocessing of u sed low density polyethylene with lignite coal w as perform ed by operating at various ratios of LDPE/lignite: 15:.0.5, 15:1, 15:2.5, 15:3 and 15:5, using 0.45g of Ni-Mo/Alumina as catalyst, at condition of 4 2 0 °c of reaction tem perature, 60 min of reaction time and 60 kg/cm 2 of hydrogen.

44
The product com position ch an g ed with ratio of LDPE/lignite. Shown in Table 4.6, the increasing ratio of LDPE/lignite had not a beneficial effect on % yield of oil product distribution. Therefore, a s se e n in Table 4.6 the ratio of LDPE/lignite of 15:1 a good condition. The b e s t p e rcen tag e yield w as 68.1 low-density polyethylene with lignite converted to oil p roduct using Ni-Mo/Alumina catalyst as in Figure 4.4.
Table 4 ,6 : The effect of ratio of LDPE/ lignite on product com position at 4 2 0 °c of reaction tem perature, 60 kg/cm 2 of hydrogen and 60 m inutes of reaction time.
Ratio
(LDPE'Coal)
Gas product
(% yield)
Oil products (% recovered)
Solid
(%yield)% ท eld
(Oil
product)
Naphtha Kerosene Light
Gas Oil
Heavy
Gas Oil
Long
Residue
15:0.5 21.3 38.3 8.3 6.4 3.8 7.0 14.9 63.9
15:1 13.7 44.3 9.6 6.3 3.2 4.7 18.2 68.1
15:2.5 14.7 37.5 8.0 5.1 2.8 3.4 28.5 56.8
15:3 13.7 24.5 5.6 3.6 2.1 2.7 47.8 38.4
15:5 12.7 18.6 3.9 2.5 1.4 2.6 58.3 27.7
When the ratio of LDPE: lignite w as d e c re a s e d from 15:1 to 15:5, the p e rcen tag e of recover of naph tha w as increased until the ratio of LDPE: Lignite a t 15:1 the p ercen tag e of naph tha d e c re a se s with d ec reas in g ratio of LDPE: lignite, which considering from th ese results a s d ec reasin g ratio of LDPE: lignite from 15:1 to 15:5 so that the cracking reaction could be occu rred be tte r than the higher ratio of LDPE: lignite, b e c a u se long m olecular chains from lignite coal could be cracked to short m olecular chains. Thus the p e rc e n ta g e of recovered of n aph tha in creases with d ec reasin g ratio of LDPE: lignite.

45
Elgas El naptha
D kerosene□ light gas oil
D heavy gas oil
□ long residue D residue
CP/o 20% 40% 60% . 80% 100%% recovered
Figure 4 .4 : The effect of ratio of LDPE: Lignite on product com position at condition of 420°c of reaction tem perature, 60 kg/cm 2 of hydrogen and 60 m inutes of reaction time.
When the ratio of LDPE/ lignite d e c re a se d at the sam e condition, we observed that the % naphtha, kerosene, g a s oil and long residue also d ec re a sed w hereas %solid increased. It m ean that w hen w e used m ore lignite, it seem ed that catalyst might contact directly with lignite and causing coking at the su rface of catalyst, as a result w e noticed clearly the % decreasing from 63.9 to 27.7 % of %yield of oil and 44.3 (the optimum) to18.6 % of naphtha.
The optimum ratio of LDPE: lignite w as 15:1 at the condition of 420°c of reaction tem perature, 60 kg/cm 2 of hydrogen and 60 min of reaction time, It gave the highest 68.1% yield of oil, 44.3% naphtha, 9.6% kerosene, 14% g a s oil and 18.2% solid.
46
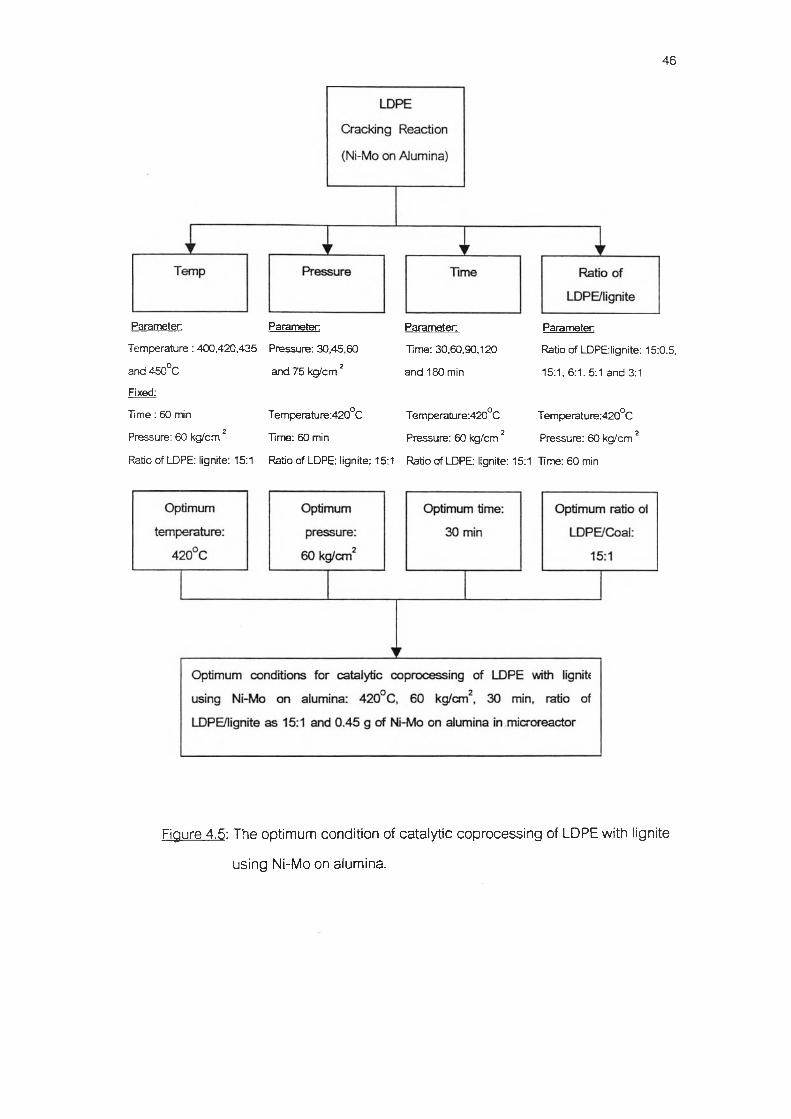
Parameter
Temperature : 400,420,435
and 450°cFixed:
Parameter
Pressure: 30,45,60
and 75 kg/cm 2
Parameter
Time: 30,60,90,120
and 180 min
Parameter
Ratio of LDPEIignite: 15:0.5,
15:1, 6:1. 5:1 and 3:1
Time : 60 min
Pressure: 60 kg/cm 2
Ratio of LDPE: lignite: 15:1
Temperature:420°c
Time: 60 min
Ratio of LDPE: lignite: 15:
Tempe rature:420°c
Pressure: 60 kg/cm2
1 Ratio ๙ LDPE: lignite:
T emperature:420°c
Pressure: 60 kg/cm 2
15:1 Time: 60 min
Figure 4 ,5 : The optimum condition of catalytic coprocessing of LDPE with ligniteusing Ni-Mo on alumina.


![DATA ANALYSIS, RESULTS AND DISCUSSIONshodhganga.inflibnet.ac.in/bitstream/10603/62097/11/11...[82] CHAPTER – IV DATA ANALYSIS, RESULTS AND DISCUSSION In this chapter obtained results](https://static.fdocuments.in/doc/165x107/5ec86e40997044603330e83f/data-analysis-results-and-82-chapter-a-iv-data-analysis-results-and-discussion.jpg)