![References - Information and Library Network Centreshodhganga.inflibnet.ac.in/bitstream/10603/37571/15/15_references.pdf · References 150 REFERENCES [1] http ... ... aerodynamic](https://static.fdocuments.in/doc/165x107/5b0139867f8b9ad85d8dc8e5/references-information-and-library-network-150-references-1-http-aerodynamic.jpg)
Chapter IV - Information and Library Network...
34
Chapter - IV
Transcript of Chapter IV - Information and Library Network...

Chapter - IV

TABLE 4.1 Houseless Popalation in Andhra Praderh
Source: Directorate of Census Operations, 'Andhra Pradesh.
13.
14,
15.
16.
17.
18.
19.
20.
21.
22.
23.
ANDHRA PRADESH
The table 4.1 vividly shows that the nval houseless population varies from
1261 in Vijayanagm to 1 1,119 in Karimnagar and the total houseless population in
the state is 97,101. The urban houselesa population varies, h m 270 in Vijayanapam
97,101 1 66,837 1 1,63,938 ]
Kurnool
Mahbubnagar
Rang8 Reddy
Hyderabad
Nizamabad
Adilabad
Karimnagar
Warangal
~ ~ a m m a m
Nalgonda
4,303
7,647
4,997
0
3,885
5,684
4,855
11,119
8,296
4,003
4,522
1,472
1,276
13,619
14,441
662
1,138
1,598
3,543
2,618
791
1,608
5,775
8,923
18,616
14,441
4,547
6,822
6,453
14,662
10,914
4,794
6,130
to 14,441 in Hyderabad followed by Rangareddy district with 13,619. The total
houseless population in Andhra Pradesh is 1,63,938 with highest at 18,616 in
Rangareddy dishict and lowest at 1,531 in ~ija- district.
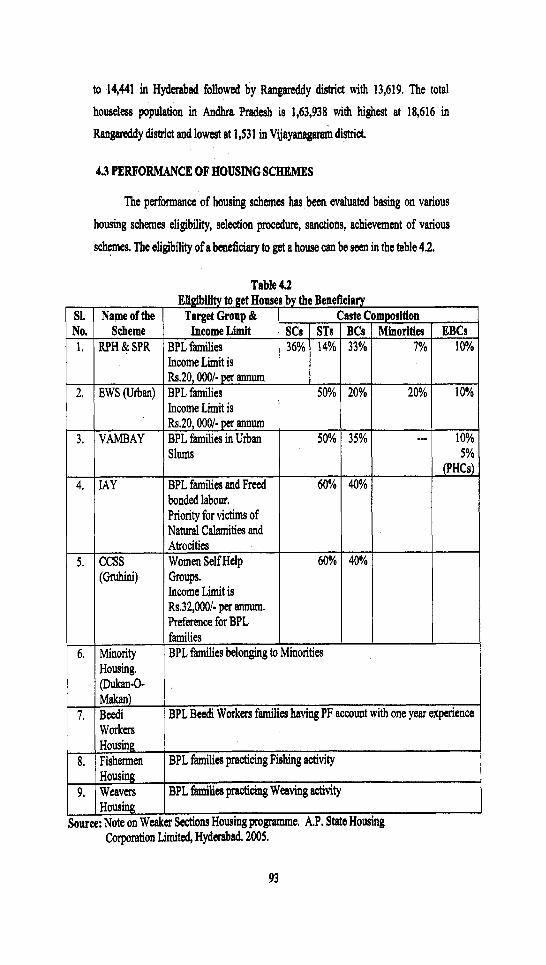
43 PERFORMANCE OF HOUSING SCHEMES
The performance of housing schemes has been evaluated basing on various
housing schemes eligibility, selection procedure, sanctions, achievement of various
schemes. The eligibility of a beneficiary to get a house can be seen in the table 4.2.
Table 43
3.
4.
5.
6.
7.
8.
9.
Source: Corporation Limited, Hyderabad. 2005.
VAMBAY
IAY
CCSS (Gruhini)
Minority Housing, (Dukan-0- Makan) Beedi Workers Housing Fishermen Housing Weavers Housing Note on Weaker
Rs.20,000/- per mum BPL families in Urban Slums
BPL families and Freed bonded labour. Priority for victims of Natural Calamities and Atrocities Women Self Help Groups. Income Limit is Rs.32,000/- per mum. Preference for BPL families BPL families belonging to Minorities
BPL Beedi Workers families having PF account with one year experience
BPL families practicing Fiehing activity
BPL families practicing Weaving activity
Sections Housing programme. A.P. State Housing
50%
60%
60%
35%
40%
40%
--- -
10% 5%
(PHCs)

43.1 Hauling SeBe- and unit coct of houses
In Andbra Mesh the unit cast of house various brn scheme to scheme and
place to place. The datsils of Maus housing schmk and nspective unit cost of
houscs have beem pmmted in the table 4.3.
Table 43 Variour Housing Schemes md Unit Cost of Houses in Andhra Pradesh
I I I I I I I
Source: Note on Weaker Section8 Housing Programme. A.P. State Housing Corporation Limited, ~~derabad.hO<
-

The table 4.3 explicitly show that the unit cost of house varies from Rs.7,500
for SPR to Rs.60,000 fix megacities under VAMBAY housing scheme. It is also high
at Rs.50,000 for Namak Mazdoor Awaas Yojana scheme and megacities under
VAMBAY housing Rs.45,OOO for special scheme for weavers housing (Central),
Rs.40,OOO for Indiramma urban housing, municipalities under VAMBAY etc.
The State Government subsidy for housing is minimum at Rs.3000 for
Indiramma urban and urban permanent housing and maximum at Rs.13,200 for
Indiramma rural followed by special housing for fisherman at Rs.10,000. It is
interesting to note that the subsidy is Rs.7,000 for SPR, RPH, Special Housing and
Indiramma Rural Housing Schemes.
The Government of India subsidy varies h m Rs.9,375 for CCSS (Gruhini) to
Rs.45,000 for Namak Mazdoor Awaas Yojana followed by Rs.40,000 for special
housing for weavers (central).
The total subsidy for housing schemes varies from Rs.3000 for Indiramma
(urban) to Rs.45,000 for Namak Mazdoor Awaas Yojana.
The loan for various housing schemes ranges from Rs.8,000 for special
housing for weavers housing (Central) to Rs.35,000 for UPH and Indiramma urban
followed by Rs.30,000 for special housing (state).
The beneficiary contribution varies between Rs.500 for majority of housing
schemes to Rs.6,000 for megacities under VAMBAY hosing scheme.
433 Selection procedure
The houses are sanctioned by prescribed selection procedure and the
procedure various from scheme to scheme and authorities to authorities and
sanctioning authorities. The details of selection procedures are presented in the
table 4.4.

Selection Procedure of Different Housing Schemes in AP Name of the
Scheme SPR & RPH MLA Quota Distri"n
Quota State Reserve Quota
EWS Rlrbm)
IAY Housing
Special Housing Beedi Workers Fishmen Weavcrs
Selection Authorftiea
MLA -50% District h-&rgc Minister - 50% Allocation by Chief Minister
E m p o w d Committee Constituted by Government
Grama Sabha
Sanctioning Authorities
District Collector District Collector
Distrin Collector
District Collector
District Collector
Asst. Commissioner of Labour Asst. Director of Fisheries Asst. Director H&T
GO1 VAMBAY I I
SPR & RPH
In SPR (Semi Permanent Rural Housing) & RPH (Rural Permanent Housing)
scheme, 50 per cent are selected under the MLA quota and district in-Charge Minister
and sanctioned by district collector. The remaining 50 per cent houses are allotted by
Chief Minister and sanctioned by district collector.
GO1 Commissioner of F i s h ~ e s Commissioner of Handlooms & Textiles
Municipal Authorities
Minority Housing
EWS (Eeonomlcally Weaker Section)
District Collector CCSS (Gruhini)
In case of EWS (Urban), houses are selected by empowarad committea
constituted by the Government and the District Collector sanctions the selected
houses.
PD, DRDA
Source: Note on Weaker Sections Housing Programme. A .P. State Housing Corporation Limited, Hyderabad. 2005.
Selection Committee appointed by District Collector
IAY Housing Scheme
District Collector
In this scheme houses are selected by Gramasabha and the selected houses are
sanctioned by District Collector. Special housing for Beedi workers will be selected
by Adstant Commissioner of Labour, for Fisherman Houses are by Assistant

Dinctor of Fishers and s a c r i d by GO1 Cammissionex of Fishers, for weaver
h o w by &Assistaut Director of H & T and sanctioaad by commhioner of H & T.
VAMBAY (Valmlld Ambedksr AWMS Yojana)
In VAMBAY scheme, houses are selected by municipal authorities and GO1
sanctions the selected houses.
CCSS (GRIHINI) (Credit-Cum Suhidy Scheme)
Houses are allotted to member under Gruhini scheme by PD, DRDA and
sanctioned by District Collector,
MINORITY HOUSING
Under this scheme, members are selected by selection committee appointed by
District Collector and sanctioned by him.
43.3 Achievement of Rural Urban Housing Programmes in Andhrn Pradesh
Andhra Pradesh State has started accepting housing as a basic need, which
should be encouraged and supported by Government. Since 1957, immediately after
formation of Andhra Pradesh State, the State has started acquiring land and
distribution of house sites for weaker sections of the society. And about 24 lakh of
house sites are distributed so far, which is a continuous process. In response to the
Central Government's responsibility of providing shelter to low income groups, the
Andhra Pradesh Housing Board was established in1960, which is active in urban
centers and providing houses, in addition to this agency, the Development Authorities
also taking up housing projects with external financial help. In 1971, Andhra Pradesh
State Co-operative Housing Building Societies Federation Limited was established
with an objective. to provide houses to rural poor, SC and STs in particular. The
organization has implemented housing schemes on the house sites already allotted.
The Government of A.P. has mobilized resources about Rs. 10.00 crores through Life
Insurance Corporation and constructed 4,57,651 h o w in the rural areas of the State.
In the same year, another organimtion by name "Andhra Pradesh State Police
Housing Corporation" with an aim to provide houses to police personnel. Generally
kP.S.P.H,C constructs houses to police constables who were covered under LIC
category. This ~hisgmidon comtmd about 21,926 bows.
97

Duriqg 1971 4 1, undg Sited and Service programme, basic infrastructure like
water supply, intemal roads, approach etc., were provided along with construction
assistance of Rs.400 per unit for eaection of a shelter and 3,64,338 such shelters were
provided till 1981. In 1981, the financial assistance for shelter was raised to b.lOOO
and 6,12,880 such sheltem have come up within 2 years (1981-83). In 1983, the
Oovemment of A.P. has taken a decision to provide only permanent houses to rural
and urban poor, with the involvement of beneficiaries in execution of schemes which
brought drastic changes in thinking about housing and due to this very reason the A.P.
State reached peak heights in providing houses to poor in the country. The success of
social housing programmes through A.P. State Housing Corporation, which started its
modest beginning in 1979, provided permanent housing in the cyclone prone districts
of Andhra Pradesh. Later in 1981, the implementation of Weaker Section Housing
programme entrusted to this organization and so far this organization is able to
provide 43,22,266 houses with an amount of Rs.3021.31 crores to both urban and
rural areas which is very impressive achievement in physical terms.
To have a planned development and to reduce the squatting on public land in
urban centers, the Government of Andhra Pradesh has established another
organization, Andhra Pradesh Urban Development and Housing Corporation
(A.P.U.D. & H.C.) to look in to housing need of urban poor. Recently, this
organization has come up with very good proposal, which integrates urban
development programmes with housing.
However, the A.P.U.D. & H.C. has been merged with A.P.S.H,C.L. to have
single window system. Thus, the Government of A.P. is working towards fulfilling
the housing need to poorer sections of the society. As a result of the combined efforts
of the housing schemes, which were implemented in the State have resulted in
meeting the housing requirement, a basic need intensely wanted by people. The
progress recorded in this aspect is quite impressive. So, the A.P. Government
approached with a commitment to meet the people's basic need to housing.

Over a period of 23 yaars, h 1983-84 to 2004-05, the State patronaged to
construct as m a y as 52,64,760 houses for the needy people, most of whom
d t u t e s the weaker seetiom in the nnal areas. The housing schemes were rural
oriented programmes in A.P., as it was evidenced that 91.46 per cent of houses were
cmstmcted in mid areas. While it is only 8.54 per cent of the total number of houses
was constructed in the urban ltreas during the period of 1983-84 to 2007-08,
Houses have been sanctioned to respondents of both rural and urban and the
sanctioned houses were completed. The details of year-wise achievement of rural and
urban housing programmes in Andhra Pradesh during 1983 -2004 to 2007-2009 have
been presented in the table 4.5.

Table 4.5 Achievement of Rarrl and Urban Houmlng Prognmrnes of Andbra h d e s h
Source: A.P. State Housing Corporation Limited, Hyderabad.
The total number of houses, which ware cmatn~otcd prior to 1983-84, both for
the rural and utban, was 51,565. This figure shot up to 1, 38,227 during the year
1988-89. It may be notiad in the Table 4.4 that the State Governments performance
for two years, 1989-90 and 1990-91 was unimpressive as these two years accounted
for relatively less number of h m were comcted. The reason perhaps for this was
the transition period of introduction of the new economic policy.
From 1990-91, the momentum of house construction picked up rather fast and
cdntinued up to 1998-99, that year accounted for the completion of construction of
3,74,563 houses. Thereafter the total m b e r of houses construction rose up in 2001-
02. While, it started rising during the year 2003-04, to the tune of 3,75,425.
The Housing scheme in A.P. is a continuous programme. The State
Government has been according utmost priority to provide shelter to dl those who do
not have shelter over their heads. The total number of houses constructed up to 2007-
08, both in rural urban areas was 11,35,683,
The growth rate of achievement of rural housing programme during 1983-84
to 2008-09 is 8.78 and urban housing programme was 9.08. The overall growth rate of
achievement was 8.80. It is concluded that growth rate is fractionally higher in urban
and lower in rural programmes. Fig.4.1 Bar Diagram showing achievement of Rural
and Urban Housing Programmes of Andhra Pradesh,

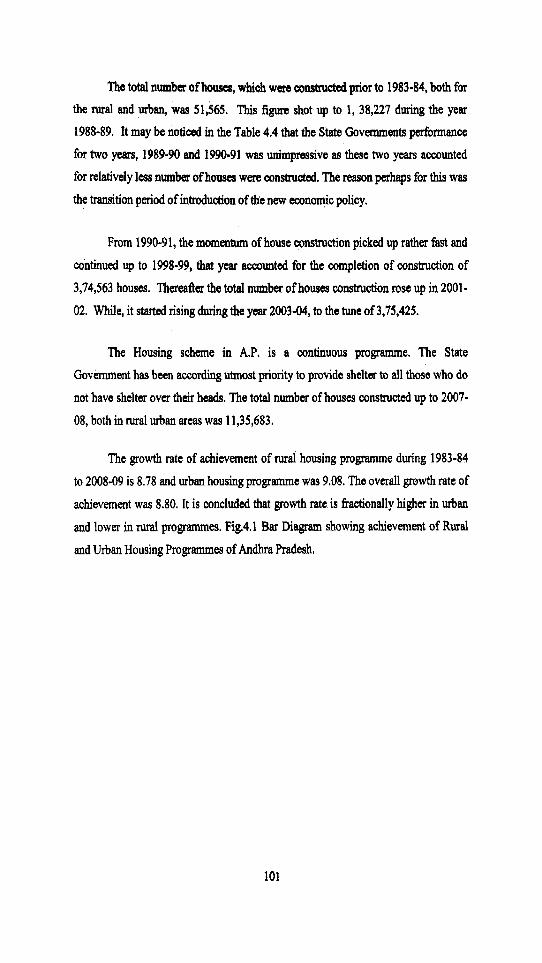
4 3 . 4 ~ d ~ a f m 1 r a ~ 1 d r a m e
The particulars of nmk of houw sanctioned, eampletcd, estimated cost and axpenditure w i n naal bowing under RPH an presented in the table 4.6.
Tnbh 4.6 Statewnt Shonhtg You Wbe Smclbns & Complatloar ha R d Emhg uuder
RPH (Rad PHMnunt Hourlng)
19 20 21 22 23 24
2000-2001 2001-2002 2002-2003 2003-2004 2004.2005 2005-2006
191742 95624 143661 255220 303161 314717
TOM CnadTbtrl
CompollPdGtorrtbrdc Source: A.P. State H o w i q Capordon Limited, Hydaabad,
914024 247029S
5.422
1304125 3743759 5.210
60418 66632 66356 172346 272370 275902
91288.75 197813.935
9.633
639B1.68 133448.2931
9,6%
1342 1.94 6693.68 10056.27 17865,4 21221.27 22030.19
4229.26 4664.24 4644.92 12064.22 19065.9 19313.14

The table 4.6 quite obviously show thrd dming 1983-1990, 7,61,728 how
were sanctioned with an eetimated cost of Rs.20,963.87 lakhe and 5,%,328 houses
were completed with an expadim of Rs. 19,749.8 lakhs. During the period 1985-86,
highest number of houses (1,20216) bousas was d o n c d and lowest (71866)
number of h o w sanctioned in 1989-1990. Highest numk of housw (1,01,732)
houses were completed in 1987-88 and lowest (38,673) houses wore completed in
1983-84.
During 1990-2000, under RPH 16,71,906 housa wna sanctioned with an
atihated cost of Ra85.560.88 lakhe nd 9,59,916 houses were mple tcd with an
expenditure of Rs.49,716.78 lakhs. The highest n u m k of houses (2,58,989) was
sanctioned in 1999-2000 and highest nmbcr of houses (2,02,276) was completed in
1998-1999. The table shows no uniformity either in sanctioned or completed houscs.
During 2000-2006, the RPH scheme sanctioned 13,04,125 houses with am
estimated cost of Rs.91,288.75 lakhs and completed 9,14,024 houses with an
expenditure of R~63~981.68 lakhs. The table shows that t h m is a steady increase in
bath the number of houses sanctioned and completed.
By and large, the RPH scheme sanctioned 37,43,759 houses dwing 1983-2006
with an estimated cost of Rs.1,97,813.5 l a b s and completed 24,70,298 houses with
an expenditure of Rs.1,33,448.29 lakhs.
The table also shows that there is 5.21 per ccnt growth rate in sanctioned
houses, 5.42 per cent growth in completed houses, and 9.63 per ccnt in estimated cost
end 9.65 per cent in expenditure. Fig.4.2 Bar Diagram showing year wise completion
and expenditure in rural housing under RPH.


~ t u n ~ i n d h a p s i a s & S P R a n ~ h h t s b l e 4 . 7 .
Tabb 47 Statewnt Sbowhg Yew Wiac Srnctlonr & Compbtim la Rural AbPtlag undw
SPR (Sad Pmamlcnt Rnnl Hourlag)
19 20 21 22 23 24
2000-2001 2001-2002 2002-2003 2003-2004 20062005 2005-2006
TOM G m d Tdrl Compound Growth rate
63915 31875 47887 85074 I01054 104906
Soam A.P. State Housing Corporation Limital, Hydmbsd.
43~711 1218131
5313
20140 2221 1 22119 57449 90790 91958
304677 $23445
SA22
4474.05 223 1.25 3352.09 5955.1 8 7073.78 7343.42
1409.8 1554.77 a 1548.33 ,
402 1.43 6355.3 . 6437,76
30429.77 68268.806
8.903
2132739 4W3.927
9.342

The table 4.7 abows that dmiDg 1983-1990,2,24,733 hausss wae sanctioned
with an estimated coat of Rs.8,713.56 l a b and 1,98,780 how wwo oomplstad with
an axpanditure of Rs, 6,968.66 lakhs. H i number of how at 40,073 how(w was
sanctioned in 1985-86 and loweat at 23,935 houses in 1989-1990. Like wise, highest
number of h o w at 33,911 houses was completed in 1987-88 and lowcst at 12,892
houses were completed in 1983-84.
During 1990-2000, the SPR scheme sanctionad 539,307 houses with an
estimated cost of Rs.29,125.47 l a b and campletd 3,19,988 houses with an
expenditure of Rs.17,357.88 lakhs. The highest numba of houses at 92,949 was
sanctioned in 1996-1997 and highcai numba of houses at 67,426 was completed in
1998- 1999.
During 2000-2006, the SPR schcme sanctioned 4,34,711 haws with an
estimated cost of Rs.30,429.77 lakhs and completed 3,04,677 house! with an
expendim of Rs.21,327.39 lakhs. The table shows gradually and steadily incnased
rate in the houses completed.
On the whole, the SPR scheme sanctioned 12,18,751 houses during 1983-2006
with an estimated cost of Rs.68,268.81 lakhs and completed 8,23,445 houses with an
expenditure of R11.45~653.93 lakhs.
The table also shows that thm is 5.21 per cent growth rate in sanctioned
houses, 5.42 per cent growth in completed houses, and 8.90 per cent in estimated cost
and 9.34 per cent in expenditure. Fig.4.3 Bar Diagram showing year wise completed
and expenditure in ntral housing under SPR.

Fib43 :ar Di- ShD- Y c r W i u (btnpkld m d Expmdilwe in R d M m @ l g S P R .

~ ~ ~ ~ f ~ b c r o f h o v s G g s r a c t i o a a d , c o m p I e t s d ~ r a t d o o s t a n d cqmditurc towards in rural houshg \mder IAY an prcgaatcd in the table 4.8.

The We 4.8 obviously shows tirat during 1985-1990, 1,07,651 houses were
sanctiod with an t&m&d cm of Ra9.217.73 lakha and 91,823 housw, wcm
completed with an ucpadianr: of Rs.8,933.47 lrkha Ddng the paid 1987 to 89
highest number of houses at 55,016 houses was sanctioned in 1988-89 and lowest at
6,129 houses in 1987-1988. Hi@ number of houses at 44,208 houses was
completed in 1988-89 and loweart at 5,740 housas wac oompleted in 1987-88.
During 1990-2000, bra IAY sohama sanctioned $76,017 houses w i l an
estimated cost of Rs.58,903.99 lakits and oompleted 4,80,327 hwses with an
expenditure of Rs.78,855.41 lakhs. The hi* n w b a of houses at 91,934 wns
sanctioned in 1997-1998 and highest number of houses at 90,096 was complated in
1999-2000. No uniformity is fund either in the sanctioned or completed houses,
During 20062006, the IAY scheme sanctioned 8,31,344 houses with an
estimated cost of Rs.1,80,496.4 and completed 5,92,890 houses with an expenditure
of Rs.1,31,060.65 lakhs. The table shows that t h a t is an increase in both the number
of houses sanctioned and completed.
In total, the IAY scheme sanctioned 15,15,012 housaa during 1985-2006 with
an estimated cost of Rs.2,48,618.17 lakhs and completed 1 1,65,040 houses with an
expenditure of Rs.2,18,849.53 lakhs.
The table also shows that t h i s 10.67 per cant growth mta in sanctioned
houses, 10.56 per cent growth in completed how, and 14.49 per cent is estimated
cost and 13.8 per cent in expenditure. Fig.4.4 Bar Diagram showing year wise
completion and expenditure in Rural Housing under IAY.


TbepaticularsofnrmbarofhousaMadionsd,aanpletad,~ttdcostarsd
expenditure tow& in d housing d a Baedi Workas Housing am pmwated in
the table 4.9.
T8Me 4.9 Statement Sbowhg Year Wbe SIllrdlom & Complttion~ In Runl Hoaslng under
Sonrct: AP State Housing Corpotation Limited, Hyderabad.
During 1 991 -2000,1,11,258 bouses w*a sanctioned with nn estimated mt of
Rs.19,524.25 laldss and all the houws (loo"/,) wwae con#wtd. The highna number
of houses sanctioned and construded was in 1996.97.

Dudq 2000-06, 325471 housca ware adoned with an &mated cost of
Rs.11,628.95 lrlchs ad 27,325 hotma wsrs d with an cxpcdturt of
R~.9,82525 25, The him m p m k of houses satdonad and cMlstructad is in 2005-2006.
During 1991-2006, 1,43,729 houses wat sanctioned with an estimated cost
Rs.31,153.2 lakhs and 129093 h o w were cansEructad with an expenditure of
Rs.27,418.1 lakhs.
The growth is positive at 5.41 indicating i n m i n g mnd in the sanctioning of
houses. But growth rate is negative at -6.63 indicating declaiming trend in the
wnstruction of houses against tho sanctioned houses. Tbe growth rate of estimated
cost and expendim an positive at 5.53 and 4.79 indicating incnase in estimated mt
and expenditure. Fig.4.5 Bar Diagram showing year wise completion and Expenditure
in Rural Housing under Bsadi Workers Housing.
4 3 1 Sanctlou~ and cornpledon of Wcrvcn Hoarlng rcheme
The particulars of number of houses sanctioned, completed, estimated cost and
expenditure towards in rural housing under Wcavm Housing am presented in the
table 4.10.


Year
1983-84
Expcndftun (RS, a LW) .
537
Sradoned
8950
Constructed
8950
E8tbtadCott
537
Duriqg 1983-94 35646 bauscs watt sawid with m osth!ed cost of
Rs.2282.4975 lalrbs aad 35426 hum wan conmctd with an expenditure of
R9.2268.48 lekha. The largest mnnbar of amtructcd houses is obswd of 15,790 in
1986-87.
Duriug 1990-2000,1,65,983 bows wese smdomd with an athated cost of
Rs.22,009.3725 lakbs and 1,51337 h o w wan construdad with an expenditure of
Rs.20,302.49 la&. In 1990-91, 1991-92, 199697 and 1997.98 higher number of
holrse~ wen mctioned and cons!n~ctcd.
Duxing 2000-06, 32349 how wen sanctioned with an estimated cost of
Rs.2,142.905 lakhs and 28,915 h o w wen comtmctal with an expenditure of
Rs.1,914.55 lakhs. Highest number houses w m sanctioned and constructed in 2005-
06.
The total number of houses sanctioned is 2,33,878 with an estimated cost of
R9.26,434.775 and 2,15,878 houses wan ocvnstnrcted with an expenditure of
Rs.24,485.52 lakhs.
The growth rate in the sanctioning of houses is mere 0.09 and shows minute
growth, The growth in the conshucted houses shows negatively at 4.13 and indicates
declining trend in the construction of houses. The growth rate of estimated cost and
expenditure of houses an 1.58 and 1.46 shows minute p w t h . Fig.4.6 Bar Diagrnm
showing year wise completion and expenditure in rural housing under Weavers
Housing.


The particulars of number of hum sanctioned, canpi& astimdsd cost and
eqcdhlre towards in d housing unda W e a m Housing arc pmntcd in the
table 4.1 1.
Tibk 4.11 Statement Showing Year Wise Smctloui Q CompkClonr la RPnl 1- under
F b h m
During 1990-2000,84,658 houses were aandioned with an gtimalsd coot of
Rs.8,023.01 lakhs and 71859 housca w a e oo& with an ~xpd tu re of
Rs.6,719.975. Higheat nlmrba of houses mcrioncd and comWWJ is at 32,500 and
29,500 in 1996-1997 and at 25,000 and 18,430 in 1998-99.
Ytar
1990-91
2005-06
TOM
Crmd Total
Compound Growth Rite
S a n ~ e d
1540
Source: AP State Housing Copation Limited, Hydaabed.
20000
56622
141280
5.41
Cmrb9ctsd
1540
12020
34213
106069
5.22
E#thtU! Cwt
166.32
4700
121168,4825
1Eqrepdltpre m,inw)
166.32
2824.1
7718,0675
20891A925
639
14468.0425
7.30

During 2000.06, S6,622 hoaws wae sanctianed with am estimated cost of
R9.12,868,4825 lakh and 34,213 housed ware Coassbuckd witll an expanditwe of
Rs.7,748.0675 lalths. The highest mrmbar of hoPsas swctionecl and amsbuctbd is at
25,880 and 13395 in 2003-04 and at 20,000 and 12,020 in 2 0 0 M .
During 1990-2006,1,41,280 howme was sanctioned with m athated cost of
Rs.20,891.4925 and 1,06,069 houses wsra ooastmtd with an expenditure of
Rs.14,468.0425 lalrhs.
The growth rate of h o w sanctioned and constructad am 5.41 and 5.22
showing avcmge growth rate of 5 pa cent. The growth rate of estimahd cost and
expenditure are 6.39 and 7.30 showing average growth. Fig.4.7 Bar Diagnun showing
year wise completion and Expenditure in Rural Housing undn Fisherman.


The particulars of number of houses snnctional, completed, estimated wst and
expenditure towards in mJ housing under lndimmmn Housing Programme ~tlc
presented in the table 4.12.
ladiramma Hous ln~ Scheme In Different Phases
Undcr phase-I, 20,30,705 houses were sanctioned with UI cstimnted cost
2
3
Rs.6,95,516.47 lakhs and 14,97,789 were complctcd with an expcnditwc of
No 1
Rs.5,12,992.73 lakhs. Under phase-11, 19,X1.819 houses wcn: sanctioned with nn
Complctcd
1497789
Source: www.housing.gov.ap.in
2007-08
2008-10
Total
estimated cost of Rs.6,78,773.00 lakhs and 11,39,460 hous~s wm completed with an
expenditure of Rs.3,90,265.05 lakhs. In the samc way, during 2008.10, 16,44,326
houses were sanctioned with an estimated cast of Rs.5,63,181.66 lakhs and 4,57,462
Sanctiontd
2030705
Year
2006-07
Fstimatc cost is. in Llkhs )
695516.47
11
111
were houses were completed with an expenditure of Rs.1,56.680.73 lakhs. In Tod,
Phase
1
Erprndlturc (Rs. in Lakhs)
512992.13
during 2006-2010 under all the three phases 56.56.850 houses w m sanctioned wit11
1981819
1644326
5656850
an estimated of Rs,19,37,471.13 lakhs and 30,94,711 houses were completed with an
expenditure of Rs.10,5Y,938.51 lekhs. Fig, 4.8 Bnr Diagram shuwing yeur wise
1139460
457462
309471 1
completed and expenditure in rum1 housing under Indirmmn.
678773.00
563181.66
1937471.13
390265.05
156680.73
105W58.51

I I 1 I I J
Source: A.P. State Housing Cotporntion Limited, Hydaabad.2010.
Tnble 4.13 Statement Sbowbg Schema Wise Saa- Canapktrd and Expendlturs of
The table 4.12 shows that VAMBAY scheme mnctioned 99,221 howes dwing
2001-06 and completed 99,188 houses with an expenditure of Rs.45934.47 lalcha by
keeping 33 houses pending for further construction and completion in urban arm.
The RGK scheme during 2005-10 sanctioned 23,104 howca with an
expenditure of Rs.20,022.60 lakhs. It is worth mentioning that 22,352 houses were
completed.
4
5
6
The iHSDP scheme sanctioned 25,170 houses during 2005-10 and completed
18,015 houses with an expenditure of Rs.18,%8.75 lakhs, However, 7,155 howw
were pending. .
2006-07
2
2008-10
Indiramma Phase1 lndiramma P b I l lndiramma Phase-UI
In total all these schemes have sandioned 1,47,495 howca and 1,39455
houses wae completed with an expenditure of Rs.84,925,82 lakhs.
Totd
Under Indimmn PhasaI ( 2 0 7 ) , 1,52,130 h o m were sanctioned and
86,589 houses were cmtmtcd with the expenditure of b.2J97.67 labs. But
65,541 houses wae pading. 1,44,876 houses wm sandonsd with an exparditwe of
152130
144876
77067
374073
86589
79061
31648
196698
2597.67
2371.83
9 3 1 4
5900.94
Rs.2,371.83 lslchs lmda ~adinmma ~basa-n (mo7-08), But d y 79,061 bous*l wat
completcd and 65,815 imuscm were paadinlt So also Mda PhruaIU (2008-lo),
77,067, homes wen aanctiontd with Rs.931.44 1- but 46,019 houses were
pending.
By and large, under INDIRAMMA housing scbanc, 3,74,073 houses ware
sanctioned with an amount of Rs.5,900.94 lakhs and 1,%,698 hauses wen completed
and 1,77,375 houses ware patding.
The progress in housing and allocation of fimd8 hr d how schemes in
Andhm Pradesh is not adequate.
The hypothesis is rejected
Number of schanes like RPH, SPR, IAY, WEAVERS, BEEDI WORKERS,
FISHERMEN, VAMBAY, ROK, MSDP and INDIRAMMA implanmted in A.P,
with lot of M. Hence the Hypothesis i.c. "Allocation of funds for rural housing
schemes in Andhra Pradesh is not adequate" and is njccted.

REFERENCES
1. Directorate of Census Opcmtiaas, Andbra Mesh. 2. Note on Weaker Section Hwshrg P r o m AP Sw Housiq Corpontion
Litad, Hydcfabd.
3. A.P.State Housing Corporation, Hydaabad.
4. www.housing.gov,ap.in


![BIBLIOGRAPHY - Information and Library Network Centreshodhganga.inflibnet.ac.in/bitstream/10603/1345/12/12_bibliography… · BIBLIOGRAPHY [A] Prlmary Source8 Heidegger, Martin, Being](https://static.fdocuments.in/doc/165x107/5e99466f17d640690f57dd7a/bibliography-information-and-library-network-bibliography-a-prlmary-source8.jpg)