Useful Expressions Work It Out Challenge Let’s Sing Comic Time Review III.

UNITED NATIONS CONFERENCE ON TRADE AND DEVELOPMENTGENEVA
TRADE AND DEVELOPMENTREPORT, 2016
UNITED NATIONSNew York and Geneva, 2016
Chapter III
THE CATCH-UP CHALLENGE: INDUSTRIALIZATION AND STRUCTURAL CHANGE
Structural transformation forinclusive and sustained growth


The Catch-up Challenge: Industrialization and Structural Change 57
In recent years there has been a renewed interest in the role of industrialization in promoting sustained economic growth and development, reflected in Goal 9 of the 2030 Agenda for Sustainable Development which calls for promoting inclusive and sustainable industrialization. Five important factors have contrib-uted to this revival of interest. First, many developing countries have failed to deepen and diversify their existing industrial capacity in a more open global economy; indeed, several of them have experienced a premature decline in the share of manufacturing in their gross domestic product (GDP). Second, there is a perception that export-led growth strategies in developing countries face more constraints than in the past, in particular due to the slower growth of global demand, especially from industrialized coun-tries. Third, many developing countries continue to remain vulnerable to external trade and financial shocks. Fourth, and related to the latter point, there has been an end to the enormous windfall gains from primary exports generated by the commodity price boom during the first decade of the 2000s, which saw accompanying growth and investment spurts. And lastly, further deindustrialization in several developed countries is being observed with growing concern.1
In the “classic” pattern of structural transfor-mation, there is a decline in the relative share of
the primary sector in GDP and a rise in the share of industry (which comprises, in addition to manu-facturing, mining and quarrying, construction and utilities) (Kuznets, 1973). When a certain level of per capita income is reached, the share of industry in GDP stops growing while that of services rises. At the same time, industry’s share of employment falls as productivity increases, even as the share of employment in services continues to rise.
Historically, growth rates of industry have been closely related to those of GDP, and within industry, manufacturing has been critical. A broad and robust domestic manufacturing base has been the key to successful economic development, since it helps generate virtuous and cumulative linkages with other sectors of the economy, drives technological progress, and has the strongest potential for produc-tivity gains. Thus, as manufacturing grows, primary production typically tends to become more efficient as a result of the greater use of capital and technol-ogy (including knowledge and technical skills) that not only contribute to productivity gains in manu-facturing, but also to the development of the other subsectors of an economy. The services sector can emerge to supplement manufacturing activities from a certain level of per capita income onwards, and it may even grow to dominate the economy. However,
Chapter III
THE CATCH-UP CHALLENGE: INDUSTRIALIZATION AND STRUCTURAL CHANGE
A. Introduction
Trade and Development Report, 201658
it is also possible that the expansion of services (in both output and employment terms) may occur even before a sufficiently diversified and dynamic indus-trial base is established, reflecting an interruption of the industrialization process.
In developing countries, the drive towards man-ufacturing was originally based on the observation that these countries faced a structural disadvantage in global trade relations: as the prices of developing-country exports (mainly primary commodities) tended to fall relative to those of developed-country exports (mainly manufactures) there was a decline in developing countries’ terms of trade, which tended to perpetuate the income gap between rich and poor countries (the “Prebisch-Singer hypothesis”, discussed also in chapter IV). Industrialization was expected to alter global trade patterns, resulting in changes in the international division of labour in a way that would be more favourable for developing countries. Diversification into manufacturing was expected to reduce developing countries’ dependence on the production and export of primary commodities
and ease the balance-of-payments constraints on development by either replacing imports or by gen-erating additional export earnings (Prebisch, 1964).
Therefore, in the context of industrialization, this chapter gives particular emphasis to manufac-turing, which, it is argued, is more likely to generate the linkages needed to sustain a virtuous circle of growth and structural transformation. Section B makes the case for the development of manufacturing as the means to structural transformation and income growth. Section C provides an assessment of changes in the economic structures of developing countries over the past few decades. Section D identifies dif-ferent trajectories of structural change, and discusses why industrialization efforts, in terms of enlarging the share of manufacturing in total employment and value added, have been more successful in some develop-ing countries than in others. Section E examines the potential contributions of the primary sector and services to the process of structural change. The final section draws a number of conclusions for policies in support of accelerated structural transformation.
B. The case for developing manufacturing industries
1. The virtues of manufacturing
The expansion of manufacturing activities can be considered as evolving through a process of “cumulative causation” (Myrdal, 1957; Kaldor, 1957, 1958) in which demand and supply factors interact: the expansion of manufacturing activities creates employment, incomes and demand, on the one hand, and accelerates increases in productivity on the other; this in turn boosts income and demand growth. Continuous upgrading of productive capacities in manufacturing, which is part of this process, can lead to productivity gains through entry into new areas of economic activity, the application of more advanced technologies, the production of more sophisticated
goods, and/or the insertion into international value chains at rising levels of skill.2
The immense appeal of manufacturing lies in its potential to generate productivity and income growth (Kaldor, 1966), and because such gains can spread across the economy through production, investment, knowledge and income linkages. Several linkages deserve mention here. To begin with, expanding production can help build “backward” linkages (to source inputs for production), and “forward” link-ages insofar as the produced goods are used in other economic activities (Hirschman, 1958). Intersectoral linkages emerge as knowledge and efficiency gains spread beyond manufacturing to other sectors of the economy, including primary and service activities
The Catch-up Challenge: Industrialization and Structural Change 59
(Cornwall, 1977; Tregenna, 2008; UNIDO, 2009). Investment linkages are created when investments in productive capacity, new entrepreneurial ventures and the related extensions of manufacturing activities in one enterprise or subsector trigger additional investments in other firms or sectors, which other-wise would not occur because the profitability of a specific investment project in a certain area of manufacturing activity often depends on prior or simul-taneous investments in a related activity (Rodrik, 2004). Income linkages emerge from rising wage incomes generated from industrial expansion; these add to the virtuous cycle through “consumption linkages”. Income link-ages also operate through supplementary government revenues (i.e. “fiscal linkages”), which may therefore expand public expenditure (Hirschman, 1986). The creation of such income linkages can strengthen the self-reinforcing aspect of industrialization through increasing domestic demand and therefore GDP growth.
Static economies of scale (i.e. lowering unit costs owing to increasing scale of production) tend to be substantial in manufacturing. In addition, there is scope for exploiting dynamic economies of scale when capital accumulation goes hand in hand with the use of increasingly sophisticated technologies, with knowledge acquisition through learning-by-doing and with the development of tacit skills and know-how. Spillovers of skill acquisition and technological learning across manufacturing firms, and from manufacturing to other sectors through both direct and indirect channels, in turn generate further productiv-ity increases. A combination of these factors enables climbing the technology ladder through continuous upgrading of products, processes, organi-zational patterns and market possibilities (Schumpeter, 1961; Gerschenkron, 1962; Amsden, 2001).
Sustainable industrial catch-up and acceleration of structural transformation require a high rate of investment in productive capacity and technological
capabilities for several reasons. First, in order to benefit from static scale economies, firms need to increase their productive capacity. Second, effi-
ciency gains that can result from improved allocation of factors of production and competition among manufacturing subsec-tors depend on the extent to which existing firms thrive and new firms emerge. This process is not possible without invest-ment in new machinery and equipment. Third, productivity gains depend to a large extent on the introduction of new
technologies that are embodied in machinery and equipment, which necessitates the periodic replace-ment of outdated machinery and equipment. These firm-level requirements add up to the need to increase investment rates and achieve some minimum level of per capita investment in the economy as a whole. Of particular importance is public investment in such crucial areas as transport and logistics, and telecom-munications infrastructure, as well as the provision of power and water and other related utilities, as these indirectly boost the productivity of economic activities in all sectors and help accelerate the pace of structural transformation.
The justification for the growth of manufactur-ing is not only economic, but also geopolitical and social. In today’s globalized economy, a country that lacks a significant manufacturing sector may eventu-
ally face demand obstacles to growth and chronic balance-of-payments constraints, making it vulnerable to decisions of external financial agents and to policy conditions set by official creditors. Moreover, industriali-zation allows the accumulation of technological capabilities that are important for any autono-mous development strategy. In most developed countries,
industrialization has also played a significant role in generating important social changes, including the expansion of a more formal organization of production and work. The developmental State – an important actor in all successful industrialization experiences – has played a catalytic role in promoting the rise of domestic entrepreneurs, and in fostering
Manufacturing activities create employment, incomes and demand, and accelerate productivity growth; this in turn boosts incomes and increases demand.
Sustainable industrial catch-up and acceleration of structural transformation require a high rate of investment in productive capacity and technological capabilities.
Trade and Development Report, 201660
the growth of urban, formal, increasingly skilled and potentially better organized working classes (see chapter VI). To the extent that these are associated with more cohesive and integrated societies, indus-trialization bolsters national consolidation and the stability of nation States, which in turn promote the development process (List, 1856).
However, one caveat deserves to be pointed out: historically the expansion of manufacturing has tended to rely on patterns of production that damage the environment through pollution and lead to degradation and overexploitation of natural resources and excessive carbon emissions associated with climate change. Indeed, some observers have argued for a shift to services-based growth pre-cisely in order to avoid the environmental problems that have emerged in some rapidly industrializing countries. But such problems are not intrinsic to the industrialization process: they depend crucially on the choice of technologies, as “green” technologies are now available for a wide range of manufactur-ing production processes (Pegels and Becker, 2014). This also underlines the importance of facilitating the cheap and effective transfer of such technologies to developing countries (TDR 2008).
2. Knowledge linkages and productivity growth
The nature of technology and the knowledge acquisition for manufacturing change at different stages of industrial development. At the early stages, the skill levels required by the existing manufacturing subsectors may be relatively low, although on-the-job learning and experience can improve productivity. But from a certain stage of manufacturing develop-ment onwards, it is no longer advisable to rely solely on an abundant supply of low-skilled labour; ade-quately trained manpower and qualified personnel, including at various levels of management, become increasingly important. In order to be effective for sustained productivity and output growth, investment in productive capacity and technological upgrading therefore need to be combined with improvements and adaptation of workers’ skills, management know-how and entrepreneurial competence.
Knowledge acquisition refers to the accumu-lation of capabilities embodied in machinery and
equipment as well as in people in the form of tacit know-how and skills (Lall, 1992, 2003; Malerba, 2002). Such knowledge contributes to productivity gains in two ways. First, access to already existing knowledge (information, tacit know-how and skills) helps enhance the efficiency and competitiveness of enterprises’ existing economic activities and processes. Second, the accumulation of new knowl-edge helps raise productivity, including through the introduction of new products, processes and organi-zational forms of doing business, which become more important as manufacturing output begins to expand. Such new knowledge supports further diversification of manufacturing activities, which in turn require a wider range of capabilities – including through learning-by-doing and research and development (R&D) – that promote innovation.
Different kinds of manufacturing activities across various levels of technological intensity – low, medium and high – also have diverse implications for fostering further knowledge and skill acquisition. Generally, when learning takes place in design and engineering activities that feed a broader spectrum of sectors, industrial production leads to steep learning curves that promote greater intersectoral linkages and flows of knowledge. These can improve efficiency both in manufacturing and other related subsectors of the economy. In countries where advanced production technologies and new products are developed, the increase in the capital that embodies those technolo-gies and the acquisition of skills on how best to use them advance in parallel. The situation is different in most developing countries, where technologies can be imported but the know-how and skills to optimize the use of such technologies have to be developed domestically. Moreover, imported technologies often have to be adapted to the specific requirements and possibilities of each country. Thus, develop-ing countries that have a lower capacity to develop new technologies by themselves generally face the challenge of combining adaptation of available tech-nologies with developing the know-how and skills for dealing with increasingly advanced technical equipment. While the use of acquired new knowl-edge in industry is an important source of upgrading, the dynamics are likely to be weaker in the case of participation in global value chains (GVCs) where technology-intensive inputs, product design and production processes are largely controlled by lead firms based outside the country or countries where the production takes place.
The Catch-up Challenge: Industrialization and Structural Change 61
Technological learning can occur at various levels, from school education and vocational training to learning-by-doing and R&D at the firm level, as well as in public or publicly supported institutions (Nübler, 2014). As in the case of investment, where publicly provided infrastructure complements and is often a precondition for the viability of private investment, the public sector can make a crucial contribution to productivity growth by offering education, professional training and support to R&D. Equally important for learning are public information and coordination services that help private entrepre-neurs assess the opportunities and risks of specific
investment projects planned and undertaken by oth-ers, including in the area of public infrastructure (Rodrik, 2004).
In a dynamic process of upgrading in manu-facturing, investment, technological advance and knowledge and skills acquisition are complementary: when there is an increase in one element, it also raises the marginal contributions of the others (Nelson and Winter, 1973; Dahlmann, 1979). Moreover, productiv-ity growth is also cumulative over time, in that initial productivity increases in manufacturing activities generate further output and productivity increases.
C. Trends in structural change since 1970
1. Long-term trends
Over the past four and a half decades, the global economy as a whole has undergone signifi-cant changes in economic activities across sectors and regions. Developing countries increased their share of global industrial output (in current prices) from 15 per cent in 1970 to 28 per cent in 2002; it jumped dramatically thereafter to more than half by 2014. Developing Asia accounted for two thirds of that increase.
This shift in the distribution of industrial pro-duction to the advantage of developing countries resulted partly from an overall increase in their share of global output, and partly from the continuous decline of industry as a proportion of domestic value added in developed countries. In developed countries, the reduction of the share of industry in GDP was due almost entirely to manufacturing, the share of which fell from 26 per cent to 14 per cent of GDP. This decline was matched by the expansion of services, which since 2009 have generated 75 per cent of these countries’ national income (chart 3.1). The transition economies and Latin America witnessed a similar trend of deindustrialization, with shares of services
rising and those of industry and agriculture falling (in the latter case, from already relatively low lev-els). Asia presents a different picture. In this region, agriculture accounted for a significant proportion of GDP in 1970: slightly more than 30 per cent in East and South-East Asia, 40 per cent in South Asia and 20 per cent in West Asia. By 2014, the share of this sector had declined by between 25 and 15 percentage points in all these subregions. The main counterpart was the increase in the share of services, while the weight of industry remained roughly constant, or increased slightly as in South-East Asia. In West Asia, the share of industry has remained high and has even increased in recent years, largely driven by mining and the effect of higher global prices of crude oil and natural gas. Finally, in Africa as a whole there has been little change in the production structure, with the share of agriculture declining only slightly to the moderate benefit of industry, while the share of the services sector has remained stable at around 50 per cent of GDP.
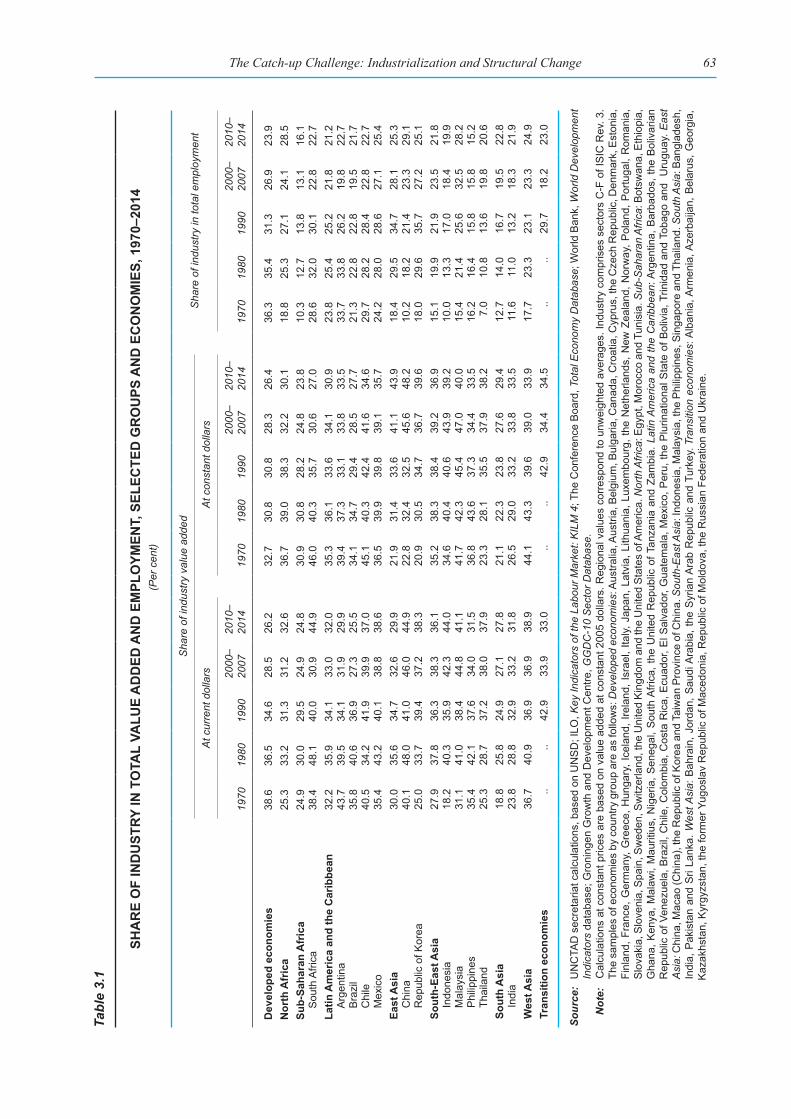
In terms of employment, most developing regions have experienced a sizeable increase in the share of industrial employment since 1970 (table 3.1), although for many countries this has been due to construction rather than to manufacturing. The

Trade and Development Report, 201662
Chart 3.1
SHARE OF ECONOMIC SECTORS IN TOTAL VALUE ADDED, BY COUNTRY GROUP, 1970−2014(Per cent at current dollars)
Source: UNCTAD secretariat calculations, based on UNCTADstat.
0
10
20
30
40
50
60
70
80
1970 1975 1980 1985 1990 1995 2000 2005 2010
Developed economies
20140
10
20
30
40
50
60
70
80
1970 1975 1980 1985 1990 1995 2000 2005 2010
Transition economies
2014
0
10
20
30
40
50
60
70
80
1970 1975 1980 1985 1990 1995 2000 2005 2010
Africa
20140
10
20
30
40
50
60
70
80
1970 1975 1980 1985 1990 1995 2000 2005 2010
Latin America and the Caribbean
2014
0
10
20
30
40
50
60
70
80
1970 1975 1980 1985 1990 1995 2000 2005 2010
East Asia
20140
10
20
30
40
50
60
70
80
1970 1975 1980 1985 1990 1995 2000 2005 2010
South-East Asia
2014
0
10
20
30
40
50
60
70
80
1970 1975 1980 1985 1990 1995 2000 2005 2010
South Asia
Agriculture, hunting, forestry, fishing Industry Services
20140
10
20
30
40
50
60
70
80
1970 1975 1980 1985 1990 1995 2000 2005 2010
West Asia
2014
The Catch-up Challenge: Industrialization and Structural Change 63
Tabl
e 3.
1
SHA
RE
OF
IND
UST
RY IN
TO
TAL
VALU
E A
DD
ED A
ND
EM
PLO
YMEN
T, S
ELEC
TED
GR
OU
PS A
ND
EC
ON
OM
IES,
197
0–20
14 (P
er c
ent)
Sha
re o
f ind
ustry
val
ue a
dded
Sha
re o
f ind
ustry
in to
tal e
mpl
oym
ent
At c
urre
nt d
olla
rsA
t con
stan
t dol
lars
1970
1980
1990
2000
–20
0720
10–
2014
1970
1980
1990
2000
–20
0720
10–
2014
1970
1980
1990
2000
–20
0720
10–
2014
Dev
elop
ed e
cono
mie
s38
.636
.534
.628
.526
.232
.730
.830
.828
.326
.436
.335
.431
.326
.923
.9N
orth
Afr
ica
25.3
33.2
31.3
31.2
32.6
36.7
39.0
38.3
32.2
30.1
18.8
25.3
27.1
24.1
28.5
Sub-
Saha
ran
Afr
ica
24.9
30.0
29.5
24.9
24.8
30.9
30.8
28.2
24.8
23.8
10.3
12.7
13.8
13.1
16.1
Sou
th A
frica
38.4
48.1
40.0
30.9
44.9
46.0
40.3
35.7
30.6
27.0
28.6
32.0
30.1
22.8
22.7
Latin
Am
eric
a an
d th
e C
arib
bean
32.2
35.9
34.1
33.0
32.0
35.3
36.1
33.6
34.1
30.9
23.8
25.4
25.2
21.8
21.2
Arg
entin
a43
.739
.534
.131
.929
.939
.437
.333
.133
.833
.533
.733
.826
.219
.822
.7B
razi
l35
.840
.636
.927
.325
.534
.134
.729
.428
.527
.721
.322
.822
.819
.521
.7C
hile
40.5
34.2
41.9
39.9
37.0
45.1
40.3
42.4
41.6
34.6
29.7
28.2
28.4
22.8
22.7
Mex
ico
35.4
43.2
40.1
38.8
38.6
36.5
39.9
39.8
39.1
35.7
24.2
28.0
28.6
27.1
25.4
East
Asi
a 30
.035
.634
.732
.629
.921
.931
.433
.641
.143
.918
.429
.534
.728
.125
.3C
hina
40.1
48.0
41.0
46.0
44.9
22.8
32.4
32.5
45.6
48.2
10.2
18.2
21.4
23.3
29.1
Rep
ublic
of K
orea
25.0
33.7
39.4
37.2
38.3
20.9
30.5
34.7
36.7
39.6
18.0
29.6
35.7
27.2
25.1
Sout
h-Ea
st A
sia
27.9
37.8
36.3
38.3
36.1
35.2
38.3
38.4
39.2
36.9
15.1
19.9
21.9
23.5
21.8
Indo
nesi
a18
.240
.335
.942
.344
.034
.640
.440
.643
.939
.210
.013
.317
.018
.419
.9M
alay
sia
31.1
41.0
38.4
44.8
41.1
41.7
42.3
45.4
47.0
40.0
15.4
21.4
25.6
32.5
28.2
Phi
lippi
nes
35.4
42.1
37.6
34.0
31.5
36.8
43.6
37.3
34.4
33.5
16.2
16.4
15.8
15.8
15.2
Thai
land
25.3
28.7
37.2
38.0
37.9
23.3
28.1
35.5
37.9
38.2
7.0
10.8
13.6
19.8
20.6
Sout
h A
sia
18.8
25.8
24.9
27.1
27.8
21.1
22.3
23.8
27.6
29.4
12.7
14.0
16.7
19.5
22.8
Indi
a23
.828
.832
.933
.231
.826
.529
.033
.233
.833
.511
.611
.013
.218
.321
.9W
est A
sia
36.7
40.9
36.9
36.9
38.9
44.1
43.3
39.6
39.0
33.9
17.7
23.3
23.1
23.3
24.9
Tran
sitio
n ec
onom
ies
....
42.9
33.9
33.0
....
42.9
34.4
34.5
....
29.7
18.2
23.0
Sour
ce:
UN
CTA
D s
ecre
taria
t cal
cula
tions
, bas
ed o
n U
NS
D; I
LO, K
ey In
dica
tors
of t
he L
abou
r Mar
ket:
KIL
M 4
; The
Con
fere
nce
Boa
rd, T
otal
Eco
nom
y D
atab
ase;
Wor
ld B
ank,
Wor
ld D
evel
opm
ent
Indi
cato
rs d
atab
ase;
Gro
ning
en G
row
th a
nd D
evel
opm
ent C
entre
, GG
DC
-10
Sec
tor D
atab
ase.
N
ote:
C
alcu
latio
ns a
t con
stan
t pric
es a
re b
ased
on
valu
e ad
ded
at c
onst
ant 2
005
dolla
rs. R
egio
nal v
alue
s co
rres
pond
to u
nwei
ghte
d av
erag
es. I
ndus
try c
ompr
ises
sec
tors
C-F
of I
SIC
Rev
. 3.
The
sam
ples
of e
cono
mie
s by
cou
ntry
gro
up a
re a
s fo
llow
s: D
evel
oped
eco
nom
ies:
Aus
tralia
, Aus
tria,
Bel
gium
, Bul
garia
, Can
ada,
Cro
atia
, Cyp
rus,
the
Cze
ch R
epub
lic, D
enm
ark,
Est
onia
, Fi
nlan
d, F
ranc
e, G
erm
any,
Gre
ece,
Hun
gary
, Ice
land
, Ire
land
, Isr
ael,
Italy,
Jap
an, L
atvi
a, L
ithua
nia,
Lux
embo
urg,
the
Net
herla
nds,
New
Zea
land
, Nor
way
, Pol
and,
Por
tuga
l, R
oman
ia,
Slo
vaki
a, S
love
nia,
Spa
in, S
wed
en, S
witz
erla
nd, t
he U
nite
d K
ingd
om a
nd th
e U
nite
d S
tate
s of
Am
eric
a. N
orth
Afri
ca: E
gypt
, Mor
occo
and
Tun
isia
. Sub
-Sah
aran
Afri
ca: B
otsw
ana,
Eth
iopi
a,
Gha
na, K
enya
, Mal
awi,
Mau
ritiu
s, N
iger
ia, S
eneg
al, S
outh
Afri
ca, t
he U
nite
d R
epub
lic o
f Tan
zani
a an
d Za
mbi
a. L
atin
Am
eric
a an
d th
e C
arib
bean
: Arg
entin
a, B
arba
dos,
the
Bol
ivar
ian
Rep
ublic
of V
enez
uela
, Bra
zil,
Chi
le, C
olom
bia,
Cos
ta R
ica,
Ecu
ador
, El S
alva
dor,
Gua
tem
ala,
Mex
ico,
Per
u, th
e P
lurin
atio
nal S
tate
of B
oliv
ia, T
rinid
ad a
nd T
obag
o an
d U
rugu
ay. E
ast
Asi
a: C
hina
, Mac
ao (C
hina
), th
e R
epub
lic o
f Kor
ea a
nd T
aiw
an P
rovi
nce
of C
hina
. Sou
th-E
ast A
sia:
Indo
nesi
a, M
alay
sia,
the
Phi
lippi
nes,
Sin
gapo
re a
nd T
haila
nd. S
outh
Asi
a: B
angl
ades
h,
Indi
a, P
akis
tan
and
Sri
Lank
a. W
est A
sia:
Bah
rain
, Jor
dan,
Sau
di A
rabi
a, th
e S
yria
n A
rab
Rep
ublic
and
Tur
key.
Tra
nsiti
on e
cono
mie
s: A
lban
ia, A
rmen
ia, A
zerb
aija
n, B
elar
us, G
eorg
ia,
Kaz
akhs
tan,
Kyr
gyzs
tan,
the
form
er Y
ugos
lav
Rep
ublic
of M
aced
onia
, Rep
ublic
of M
oldo
va, t
he R
ussi
an F
eder
atio
n an
d U
krai
ne.

Trade and Development Report, 201664
exception is Latin America and the Caribbean, where the share of industrial employment has remained virtually stable. Other than in sub-Saharan Africa, industry in the other developing regions/subregions accounts for between 20 and 30 per cent of total employment.
Within the industrial sector, with the excep-tion of East Asia, there was a general reduction in the share of manufacturing in value added (at cur-rent prices), although this started at different points in time (chart 3.2A). In 1970, only the transition economies and East Asia exhibited a higher share of manufacturing in GDP than developed countries. But the situation has reversed since then, and after 2000 only in West Asia and Africa were the shares of manufacturing in GDP clearly smaller than those of the developed economies. From this point of view, it would seem that most developing economies have narrowed the “industrialization gap”, with the share of manufacturing in total value added closer to or even higher than that of developed economies, although this convergence has been occurring within an overall declining trend. This structural change had already started for the developed countries in
the 1960s and 1970s, with a secular decline in the share of manufacturing employment (table 3.2). Since then, deindustrialization has spread to developing countries. Contributory factors to this general trend include “financialization” in the global economy, which generated macroeconomic instability and increasing inequality in income distribution. This has contributed to the slowdown of aggregate demand in the context of stagnating wage incomes and low quality and informal employment, which are associated with weaker productivity performance, underconsumption and lower levels of investment (see chapter II).
This downward tendency also reflects a broader global trend of falling prices of manufactured goods relative to the general price level, resulting, in particular, from faster productivity growth. Hence, measured at constant prices, the decline in the share of manufacturing in GDP in several regions has been much less steep over time, whereas that share has continued to grow in some Asian regions (chart 3.2B). The even sharper increase in the share of manufactur-ing in East Asia in constant prices (driven mainly by China) suggests an additional reason for this trend:
Chart 3.2
SHARE OF MANUFACTURING IN TOTAL VALUE ADDED, BY COUNTRY GROUP, 1970−2014(Per cent)
Source: UNCTAD secretariat calculations, based on UN DESA, Statistics Division, National Accounts Main Aggregates database.
0
5
10
15
20
25
30
35
40
1970 1975 1980 1985 1990 1995 2000 2005 2010
A. At current dollars
Developed economies Transition economies Latin America and the Caribbean AfricaEast Asia South-East Asia South Asia West Asia
20140
5
10
15
20
25
30
35
40
1970 1975 1980 1985 1990 1995 2000 2005 2010
B. At constant 2005 dollars
2014

The Catch-up Challenge: Industrialization and Structural Change 65
Tabl
e 3.
2 SHA
RE
OF
MA
NU
FAC
TUR
ING
IN T
OTA
L VA
LUE
AD
DED
AN
D E
MPL
OYM
ENT,
SEL
ECTE
D G
RO
UPS
AN
D E
CO
NO
MIE
S, 1
970–
2014
(P
er c
ent)
Sha
re o
f man
ufac
turin
g in
tota
l val
ue a
dded
Sha
re o
f man
ufac
turin
g
in to
tal e
mpl
oym
ent
At c
urre
nt d
olla
rsA
t con
stan
t dol
lars
1970
1980
1990
2000
2007
2011
2014
1970
1980
1990
2000
2007
2011
2014
1970
1980
1990
2000
2007
2011
Dev
elop
ed e
cono
mie
s26
.422
.820
.618
.316
.114
.814
.617
.317
.016
.316
.516
.716
.014
.626
.823
.920
.716
.914
.312
.8
Nor
th A
fric
a20
.817
.020
.019
.216
.516
.717
.318
.215
.716
.919
.117
.717
.317
.312
.613
.814
.414
.012
.911
.9
Sub-
Saha
ran
Afr
ica
12.7
14.8
15.6
12.2
11.1
9.9
9.4
12.7
13.8
13.7
11.9
11.3
11.3
9.4
5.8
7.2
8.3
8.3
8.6
8.4
Sou
th A
frica
23.0
21.8
23.7
19.2
16.1
13.3
13.3
16.2
20.4
19.5
18.7
18.3
16.9
16.4
13.3
16.5
14.7
13.6
13.3
11.6
Latin
Am
eric
a an
d th
e C
arib
bean
21.7
20.8
21.6
18.1
16.6
14.9
13.7
18.6
18.6
17.8
17.4
17.3
16.3
13.7
15.5
15.4
15.3
13.2
12.4
11.5
Arg
entin
a33
.327
.024
.516
.119
.917
.914
.626
.423
.822
.020
.522
.323
.021
.523
.521
.417
.812
.212
.512
.1B
razi
l27
.431
.025
.516
.216
.613
.910
.921
.121
.418
.217
.217
.115
.514
.513
.312
.714
.712
.012
.811
.5C
hile
18.6
14.4
19.0
19.6
13.0
11.9
12.4
21.9
18.3
18.1
15.9
15.1
14.1
13.2
20.1
17.3
17.5
13.1
11.4
9.8
Mex
ico
18.9
18.6
19.7
20.5
17.4
17.1
17.7
16.4
16.8
17.0
19.0
16.8
16.4
16.7
18.0
19.9
20.0
19.6
16.2
15.6
East
Asi
a28
.334
.934
.231
.929
.329
.429
.3..
21.6
28.3
34.2
31.2
33.6
29.3
13.9
22.5
24.3
20.9
21.2
21.5
Chi
na30
.436
.131
.033
.232
.631
.128
.3..
27.4
36.3
42.5
32.7
34.8
34.9
7.8
13.8
14.9
14.5
18.4
18.7
Rep
ublic
of
Kor
ea17
.523
.127
.129
.028
.231
.430
.37.
915
.820
.325
.929
.732
.332
.713
.622
.227
.420
.317
.618
.2
Sout
h-Ea
st A
sia
17.7
22.3
24.5
27.0
25.8
23.4
22.5
16.5
21.1
23.8
26.8
26.6
25.7
22.5
11.4
14.4
15.6
16.3
15.4
14.0
Indo
nesi
a9.
212
.420
.825
.224
.522
.221
.65.
710
.418
.824
.224
.222
.822
.57.
99.
211
.612
.712
.012
.4M
alay
sia
16.4
21.6
21.8
28.7
26.4
24.5
24.2
12.3
15.5
21.1
27.7
27.5
25.3
24.9
9.9
13.7
17.7
24.4
19.6
18.1
Phi
lippi
nes
27.7
27.6
26.7
24.5
22.8
21.1
20.5
28.3
28.6
26.1
24.9
23.1
22.6
23.4
12.0
11.6
10.1
9.9
9.1
8.4
Thai
land
15.9
21.5
27.4
28.6
30.7
29.2
27.7
15.8
21.1
25.2
28.4
30.4
29.3
28.4
5.4
8.3
9.8
13.6
15.1
13.9
Indi
a16
.219
.320
.519
.019
.518
.117
.212
.714
.217
.318
.419
.920
.320
.39.
49.
110
.511
.411
.911
.6
Sour
ce:
UN
CTA
D s
ecre
taria
t cal
cula
tions
, bas
ed o
n U
NS
D; a
nd G
roni
ngen
Gro
wth
and
Dev
elop
men
t Cen
tre, G
GD
C-1
0 S
ecto
r Dat
abas
e.N
ote:
C
alcu
latio
ns a
t con
stan
t pric
es a
re b
ased
on
valu
e ad
ded
at c
onst
ant 2
005
dolla
rs. R
egio
nal v
alue
s co
rres
pond
to u
nwei
ghte
d av
erag
es. M
anuf
actu
ring
corr
espo
nds
to s
ecto
r D o
f IS
IC
Rev
. 3. T
he s
ampl
es o
f eco
nom
ies
by c
ount
ry g
roup
are
as
follo
ws:
Dev
elop
ed c
ount
ries:
Den
mar
k, F
ranc
e, G
erm
any,
Ital
y, J
apan
, the
Net
herla
nds,
Spa
in, S
wed
en, t
he U
nite
d K
ingd
om
and
the
Uni
ted
Sta
tes
of A
mer
ica.
Nor
th A
frica
: Egy
pt a
nd M
oroc
co. S
ub-S
ahar
an A
frica
: Bot
swan
a, E
thio
pia,
Gha
na, K
enya
, Mal
awi,
Mau
ritiu
s, N
iger
ia, S
eneg
al, S
outh
Afri
ca, t
he U
nite
d R
epub
lic o
f Tan
zani
a an
d Za
mbi
a. L
atin
Am
eric
a an
d th
e C
arib
bean
: Arg
entin
a, th
e B
oliv
aria
n R
epub
lic o
f Ven
ezue
la, B
razi
l, C
hile
, Col
ombi
a, C
osta
Ric
a, M
exic
o, P
eru
and
the
Plu
rinat
iona
l S
tate
of B
oliv
ia. E
ast A
sia:
Chi
na, t
he R
epub
lic o
f Kor
ea a
nd T
aiw
an P
rovi
nce
of C
hina
. Sou
th-E
ast A
sia:
Indo
nesi
a, M
alay
sia,
the
Phi
lippi
nes,
Sin
gapo
re a
nd T
haila
nd.

Trade and Development Report, 201666
the dramatic increase in volumes of manufactured goods in this subregion must have played a role in the overall decline in the relative prices of manufactures.
In developed countries, the shares of manu-facturing in both total employment and GDP first increased with the expansion of real income, then peaked at some point, after which they started to decline, with a concomitant increase in the share of services, following an inverse U-shaped curve. The phase of “deindustrialization” is a normal consequence of the development process, owing to changes in the composition of demand and greater productivity gains in manufactures than in most other economic sectors (TDR 2003). The dynamics of demand, which at earlier stages of development encourage industrialization by rapidly expanding the demand for manufactures, tend to favour the expan-sion of services as income levels keep growing.3 The relatively high productivity in manufacturing leads to a reduc-tion in the share of that sector in total employment, followed by a reduction in total value added, particularly in nominal terms, as higher productivity gains in manufacturing tend to reduce the relative prices of manufactures. This combination of demand and technological factors explains why, in the developed countries, the share of manufacturing in employment peaked before its share in nominal value added, which in turn preceded its peak in real value added (Rodrik, 2015).
However, as UNCTAD has also noted (TDRs 1995, 2003), deindustrialization in developed econo-mies, particularly in some European economies, has not been completely smooth and spontaneous to the extent that it has been associated with institutional and financial transformation and regressive income distribution. These factors slowed down the growth of aggregate demand and constrained the capacity of services to productively absorb labour released from industry, leading to higher and persistent underem-ployment or unemployment rates (Palma, 2005).4 Even so, such a process of deindustrialization in developed economies has generally occurred when the prior process of industrialization had already raised overall productivity in the economy, dissemi-nated technological capacities and consolidated a domestic market.
The experience of developing and transition countries has been much more varied. The transition economies experienced the most dramatic reduction in the share of manufacturing in GDP in the second half of the 1980s and in the 1990s; indeed, manu-facturing was particularly affected by the economic crisis. The subsequent recovery of GDP growth fol-lowing the 1998 crisis in the Russian Federation benefited all sectors, and led to the stabilization of the share of manufacturing in GDP at constant prices (chart 3.2B).
By the 1970s, countries in the Latin America and Caribbean region had developed substantial indus-trial capacity, including in manufacturing in some countries such as Argentina and Brazil (table 3.2). Thereafter, there were steep declines in the shares of manufacturing in value added. The abandonment of long-standing industrialization strategies, beginning
in the Southern Cone in the late 1970s, followed by aggres-sive structural adjustment were clearly factors contributing to such an outcome. The declin-ing trends were generalized throughout the region follow-ing the debt crisis in the 1980s and the policy conditionalities imposed by the International
Monetary Fund (IMF) and the World Bank. In some countries, deindustrialization trends were temporarily masked by large real devaluations in the late 1980s and late 1990s, as higher relative prices of manufac-tures (among other tradable goods) concealed falling production in real terms. Conversely, after 2003, real exchange rate appreciation accentuated the reduc-tion of the share of manufacturing in GDP at current prices, even though growth in manufacturing recov-ered and the decline in manufacturing value added was less marked (in constant price terms).
The steep variations in the shares of manufac-turing in total value added in West Asia can also be partially explained by shifts in relative prices (chart 3.2A). Thus, the declining share of manufactur-ing in the 1970s was not because of low real growth rates of the sector (which averaged around 7 per cent per annum), but rather because of the huge increase of the mining sector’s share in nominal terms as a result of rising oil prices, which reduced the shares of all the other sectors. The subsequent increase in the share of manufacturing until the late 1990s was
With the exception of East Asia, there has been a general reduction in the share of manufacturing in total value added.
The Catch-up Challenge: Industrialization and Structural Change 67
partly due to greater dynamism in this sector, espe-cially in Turkey, and partly reflected a reversal in oil prices. Similarly, the region experienced significant deindustrialization during the 2000s (measured as a share of GDP at current prices). However, during this period the growth of manu-facturing accelerated to around 6 per cent per annum and its share in GDP increased slightly (at constant prices, chart 3.2B).
Africa remains largely de-pendent on the primary sector, with a low share of manufactur-ing in GDP, fluctuating between 12 per cent and 15 per cent (at current prices) until the 2000s. However, at constant prices, the fluctuations have been less pronounced. Since 2008, the share of manufacturing has stagnated at around 10 per cent of GDP, at both constant and current prices (chart 3.2). It is worth noting that this has occurred in the context of a significant accelera-tion of manufacturing production in the region. In sub-Saharan Africa (excluding South Africa), the growth rates of manufacturing jumped from an annual average of 0.2 between 1990 and 2000 to 5 per cent between 2001 and 2008, and to 7.6 per cent between 2009 and 2014. This does not necessarily indicate that a sus-tained process of industrialization is under way, since the starting point was low. For this to happen, manu-facturing growth should be supported by a significant expansion of investment, and should last long enough to trigger the dynamics of structural transformation.
Most Asian countries present a rather different picture. The shares of manufacturing in GDP con-tinued to grow at current prices until the mid-2000s in South-East Asia and until 2010 in East Asia, and are now the highest in the world. At constant prices, these shares have grown even faster in East Asia or decreased slightly in South-East Asia, reflecting the change in relative prices of manufactures, noted earlier, and pointing to the significance of volumes of production emanating from East Asia. Similarly, the share of manufacturing in South Asia shows a marginal increase and then a decline at current prices, but an increase at constant prices. Nevertheless, that share remains relatively low by both measures, at around 17 per cent of GDP.
These examples illustrate that a proper evaluation of industrialization or deindustrialization processes
must be based on an understanding of their broader economic context. It is evident that a falling ratio of manufacturing in value added may reflect the abso-lute regression of that sector, with an associated loss of production capabilities, knowledge and expertise
and the weakening of produc-tion linkages. Or it could simply result from the fact that, even if it is growing, other sectors are growing faster. The nature and implications of these different processes cannot be assessed without taking into account the existence or absence of a strong investment drive to support sus-tained economic growth, and the
generation of productive, income and knowledge linkages, as discussed in the remainder of this chapter.
2. Impact of structural change and investment on aggregate productivity
(a) Productivity growth and structural change
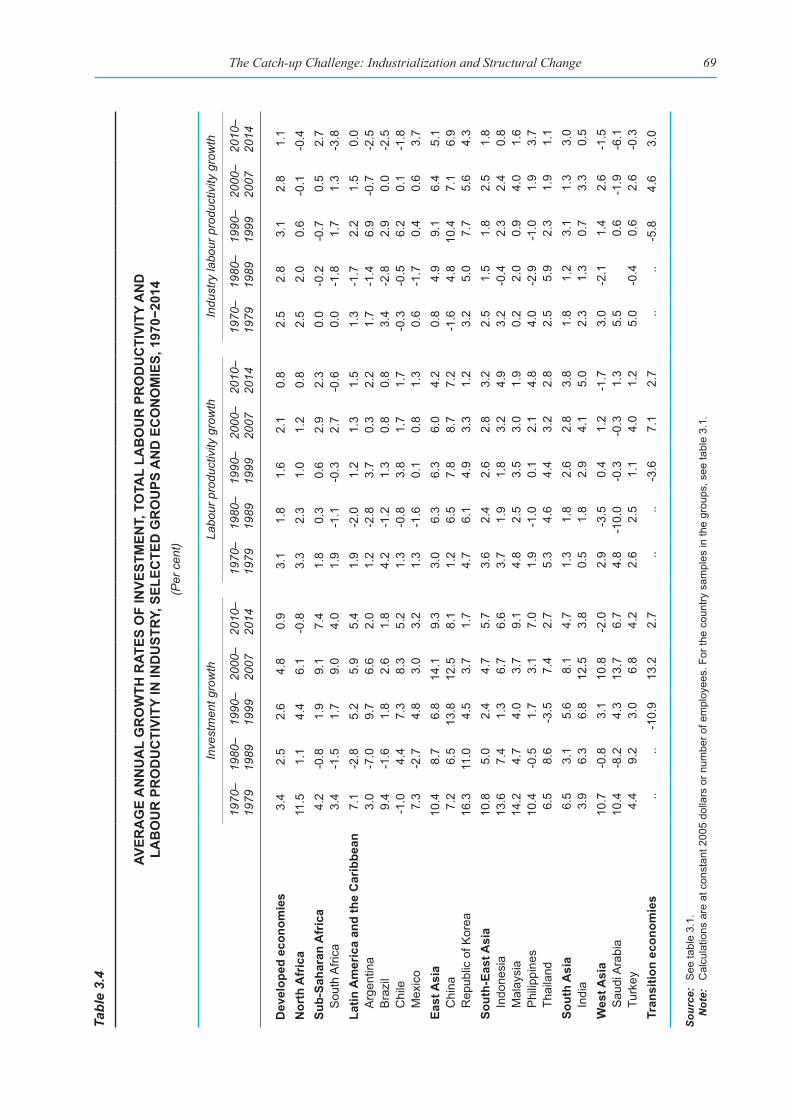
As noted above, changes in the sectoral compo-sition of output and employment have to be seen in relation to patterns of investment, growth and pro-ductivity. With regard to the crucial macroeconomic elements of structural transformation since 1970, namely the growth of GDP, industry value added, employment, labour productivity and investment, there were substantial differences across developing regions, but also a marked contrast between the pre- and post-1980 periods for most groups of developing economies (tables 3.3 and 3.4). Overall, during the 1970s the majority of developing economies experi-enced some structural change, supported by industry output and employment growth and also by increased labour productivity.5 Since the 1970s, except for East Asia and South Asia (and sub-Saharan Africa in the post-2000 period), no developing region/subregion was able to maintain annual GDP growth rates at similar levels to those experienced in the 1970s. GDP growth in Latin America, West Asia and North Africa fell sharply in the 1980s with concomitant slumps in industrial output growth, demonstrating thereby the close connection also between value-added growth in industry and the overall growth rate of an economy.6
Industrialization processes depend on the strength of the investment drive and the generation of production, income and knowledge linkages.

Trade and Development Report, 201668Ta
ble
3.3
AVER
AG
E A
NN
UA
L G
RO
WTH
RAT
ES O
F TO
TAL
VALU
E A
DD
ED, V
ALU
E A
DD
ED IN
IND
UST
RY
AN
D T
OTA
L EM
PLO
YMEN
T, S
ELEC
TED
GR
OU
PS A
ND
EC
ON
OM
IES,
197
0−20
14(P
er c
ent)
Tota
l val
ue a
dded
gro
wth
Indu
stry
val
ue a
dded
gro
wth
Em
ploy
men
t gro
wth
1970
–19
7919
80–
1989
1990
–19
9920
00–
2007
2010
–20
1419
70–
1979
1980
–19
8919
90–
1999
2000
–20
0720
10–
2014
1970
–19
7919
80–
1989
1990
–19
9920
00–
2007
2010
–20
14
Dev
elop
ed e
cono
mie
s4.
12.
71.
53.
41.
23.
62.
30.
63.
50.
21.
00.
9-0
.11.
30.
3N
orth
Afr
ica
6.1
4.5
3.4
4.5
2.4
7.3
4.3
2.9
4.1
1.1
2.8
2.2
2.4
3.3
1.6
Sub-
Saha
ran
Afr
ica
5.0
3.5
2.9
5.2
5.6
5.2
3.0
1.7
5.5
6.3
3.1
3.3
2.3
2.3
3.0
Sou
th A
frica
2.6
1.9
1.5
4.1
2.2
1.4
0.7
0.2
3.2
0.8
0.7
3.0
1.8
1.4
2.8
Latin
Am
eric
a an
d th
e C
arib
bean
5.0
0.7
3.5
3.8
3.5
5.6
0.0
3.6
4.0
2.6
3.1
2.8
2.3
2.6
2.1
Arg
entin
a2.
6-1
.14.
93.
53.
02.
5-2
.25.
14.
21.
81.
41.
71.
23.
20.
8B
razi
l8.
72.
52.
13.
42.
08.
91.
21.
83.
01.
64.
53.
70.
82.
61.
2C
hile
2.4
2.7
5.9
4.2
4.3
1.3
3.4
6.3
2.2
3.2
1.2
3.5
2.1
2.5
2.6
Mex
ico
6.4
1.7
2.9
2.6
2.8
7.1
1.5
3.2
1.7
2.1
5.1
3.3
2.9
1.8
1.5
East
Asi
a6.
98.
45.
38.
76.
69.
49.
25.
210
.76.
33.
62.
81.
51.
51.
2C
hina
4.6
9.4
9.5
10.2
7.7
7.8
9.7
13.0
11.1
8.1
3.4
2.9
1.7
1.5
0.5
Rep
ublic
of K
orea
8.6
8.9
6.2
4.8
3.0
13.0
9.8
6.1
5.9
3.3
3.9
2.8
1.3
1.5
1.8
Sout
h-Ea
st A
sia
7.3
5.4
4.9
5.1
4.8
8.8
5.4
5.3
4.4
3.9
3.6
3.0
2.3
2.3
1.6
Indo
nesi
a7.
45.
44.
04.
75.
69.
55.
45.
33.
74.
83.
73.
52.
21.
50.
7M
alay
sia
8.6
5.6
6.6
4.8
5.2
8.2
6.4
7.1
3.7
4.1
3.8
3.1
3.1
1.8
3.3
Phi
lippi
nes
5.9
1.6
2.9
4.9
5.8
8.0
-0.1
2.2
3.9
6.2
4.0
2.7
2.8
2.8
1.0
Thai
land
6.9
7.2
4.3
5.3
2.9
9.1
9.3
5.0
6.1
0.9
1.6
2.6
-0.1
2.1
0.2
Sout
h A
sia
3.0
4.7
4.8
5.6
5.8
3.9
5.6
5.8
6.8
6.8
1.6
2.9
2.3
2.8
2.0
Indi
a2.
35.
35.
37.
06.
23.
76.
75.
38.
05.
11.
83.
52.
42.
91.
2W
est A
sia
7.4
0.8
4.0
5.2
0.3
7.7
0.6
5.3
4.4
-1.8
4.5
4.3
3.6
4.0
2.1
Sau
di A
rabi
a10
.7-3
.72.
23.
55.
210
.6-6
.12.
22.
54.
95.
96.
32.
53.
83.
9Tu
rkey
4.5
4.1
2.9
4.9
4.7
5.4
6.6
3.5
5.3
4.7
1.9
1.6
1.9
0.9
3.5
Tran
sitio
n ec
onom
ies
....
-6.1
7.5
3.3
....
-9.8
8.7
2.8
....
-2.5
0.4
0.5
Sour
ce:
See
tabl
e 3.
1.N
ote:
C
alcu
latio
ns a
re a
t con
stan
t 200
5 do
llars
or n
umbe
r of e
mpl
oyee
s. F
or th
e co
untry
sam
ples
in th
e gr
oups
, see
tabl
e 3.
1.
The Catch-up Challenge: Industrialization and Structural Change 69
Tabl
e 3.
4
AVER
AG
E A
NN
UA
L G
RO
WTH
RAT
ES O
F IN
VEST
MEN
T, T
OTA
L LA
BO
UR
PR
OD
UC
TIVI
TY A
ND
LA
BO
UR
PR
OD
UC
TIVI
TY IN
IND
UST
RY, S
ELEC
TED
GR
OU
PS A
ND
EC
ON
OM
IES,
197
0−20
14(P
er c
ent)
Inve
stm
ent g
row
thLa
bour
pro
duct
ivity
gro
wth
Indu
stry
labo
ur p
rodu
ctiv
ity g
row
th
1970
–19
7919
80–
1989
1990
–19
9920
00–
2007
2010
–20
1419
70–
1979
1980
–19
8919
90–
1999
2000
–20
0720
10–
2014
1970
–19
7919
80–
1989
1990
–19
9920
00–
2007
2010
–20
14
Dev
elop
ed e
cono
mie
s3.
42.
52.
64.
80.
93.
11.
81.
62.
10.
82.
52.
83.
12.
81.
1N
orth
Afr
ica
11.5
1.1
4.4
6.1
-0.8
3.3
2.3
1.0
1.2
0.8
2.5
2.0
0.6
-0.1
-0.4
Sub-
Saha
ran
Afr
ica
4.2
-0.8
1.9
9.1
7.4
1.8
0.3
0.6
2.9
2.3
0.0
-0.2
-0.7
0.5
2.7
Sou
th A
frica
3.4
-1.5
1.7
9.0
4.0
1.9
-1.1
-0.3
2.7
-0.6
0.0
-1.8
1.7
1.3
-3.8
Latin
Am
eric
a an
d th
e C
arib
bean
7.1
-2.8
5.2
5.9
5.4
1.9
-2.0
1.2
1.3
1.5
1.3
-1.7
2.2
1.5
0.0
Arg
entin
a3.
0-7
.09.
76.
62.
01.
2-2
.83.
70.
32.
21.
7-1
.46.
9-0
.7-2
.5B
razi
l9.
4-1
.61.
82.
61.
84.
2-1
.21.
30.
80.
83.
4-2
.82.
90.
0-2
.5C
hile
-1.0
4.4
7.3
8.3
5.2
1.3
-0.8
3.8
1.7
1.7
-0.3
-0.5
6.2
0.1
-1.8
Mex
ico
7.3
-2.7
4.8
3.0
3.2
1.3
-1.6
0.1
0.8
1.3
0.6
-1.7
0.4
0.6
3.7
East
Asi
a10
.48.
76.
814
.19.
33.
06.
36.
36.
04.
20.
84.
99.
16.
45.
1C
hina
7.2
6.5
13.8
12.5
8.1
1.2
6.5
7.8
8.7
7.2
-1.6
4.8
10.4
7.1
6.9
Rep
ublic
of K
orea
16.3
11.0
4.5
3.7
1.7
4.7
6.1
4.9
3.3
1.2
3.2
5.0
7.7
5.6
4.3
Sout
h-Ea
st A
sia
10.8
5.0
2.4
4.7
5.7
3.6
2.4
2.6
2.8
3.2
2.5
1.5
1.8
2.5
1.8
Indo
nesi
a13
.67.
41.
36.
76.
63.
71.
91.
83.
24.
93.
2-0
.42.
32.
40.
8M
alay
sia
14.2
4.7
4.0
3.7
9.1
4.8
2.5
3.5
3.0
1.9
0.2
2.0
0.9
4.0
1.6
Phi
lippi
nes
10.4
-0.5
1.7
3.1
7.0
1.9
-1.0
0.1
2.1
4.8
4.0
-2.9
-1.0
1.9
3.7
Thai
land
6.5
8.6
-3.5
7.4
2.7
5.3
4.6
4.4
3.2
2.8
2.5
5.9
2.3
1.9
1.1
Sout
h A
sia
6.5
3.1
5.6
8.1
4.7
1.3
1.8
2.6
2.8
3.8
1.8
1.2
3.1
1.3
3.0
Indi
a3.
96.
36.
812
.53.
80.
51.
82.
94.
15.
02.
31.
30.
73.
30.
5W
est A
sia
10.7
-0.8
3.1
10.8
-2.0
2.9
-3.5
0.4
1.2
-1.7
3.0
-2.1
1.4
2.6
-1.5
Sau
di A
rabi
a10
.4-8
.24.
313
.76.
74.
8-1
0.0
-0.3
-0.3
1.3
5.5
0.6
-1.9
-6.1
Turk
ey4.
49.
23.
06.
84.
22.
62.
51.
14.
01.
25.
0-0
.40.
62.
6-0
.3Tr
ansi
tion
econ
omie
s..
..-1
0.9
13.2
2.7
....
-3.6
7.1
2.7
....
-5.8
4.6
3.0
Sour
ce:
See
tabl
e 3.
1.N
ote:
C
alcu
latio
ns a
re a
t con
stan
t 200
5 do
llars
or n
umbe
r of e
mpl
oyee
s. F
or th
e co
untry
sam
ples
in th
e gr
oups
, see
tabl
e 3.
1.

Trade and Development Report, 201670
Uneven patterns of output growth, employment generation and productivity dynamics emerged in developing countries from the 1980s onward. These provide another important insight: that rates of growth of GDP, investment, industry, employment and productivity have all tended to move together in cases of successful structural change. There were similar growth rates of industrial employment for several countries, but Asian countries already showed considerably higher rates of growth of output and employment in industry (table 3.3), supported by rapid productivity growth in industry (table 3.4).
Within any economy, productivity levels can vary considerably, depending on the economic activ-ity, the size of the firm and the degrees of formality and informality of employment. Labour produc-tivity tends to be particularly high in the mining sector (which includes hydrocarbons), as the bulk of mining production is undertaken by large, capital-intensive firms. Typically, the productivity level of manufacturing tends to be well above the national average, although this varies, as microenterprises and informal jobs displaying relatively lower productivity coexist with large firms that use high-technology and skilled labour and therefore have higher productivity. The lowest output per worker is gen-erally in agriculture, especially in Asian and African countries where most producers are small peasants who use less mechanized technologies. Finally, the productivity of services depends on the type of activity. In general, finance, insurance, real estate, business services, and transport, storage and communications have relatively high levels of productivity (though initially this may simply reflect price movements), while community, social and personal services and government services tend to have much lower output per worker. Productivity in trade, restaurants and hotels is quite varied, but tends to be rather low in most developing countries, where a large segment of informal commerce exists.
Such variation suggests that aggregate produc-tivity can be enhanced by reallocating employment from lower productivity to higher productivity activities, both within and between sectors. Clearly, the potential for this is greater in countries and regions where much of the labour force is employed
in low-productivity activities, as is generally the case in Africa and Asia today, and was the case in Latin America around 1950. This potential was well exploited in Latin America until 1980, when the decline in the share of agriculture in total employ-ment (from 55 per cent in 1950 to 32 per cent in 1980) was matched by an increase in shares of all the other sectors. Since 1980, however, the share of agriculture in total employment has been further declining, with employment redistributed mostly to low-productivity services. In a sample of Latin American countries covering most of regional output and population, aggregate productivity increased steadily until 1980, but has stagnated or declined in almost all sectors since then (chart 3.3A), reflecting, inter alia, a weakening of investment.
African countries also managed to increase aggregate productivity until 1980, thanks to a combi-nation of productivity growth in industry and modern services, and to some – though limited – reallocation of employment from agriculture to (mostly) “other
services”. Even though produc-tivity levels in these services were relatively low, they were nevertheless much higher than in agriculture (chart 3.3B). These factors weakened or disappeared between 1980 and 2000, as agriculture stopped losing its share of employment, and productivity in most modern sectors (with the exception of
transport and communications) slowed down. There was a recovery in the 2000s, with a moderate decline in the share of agriculture in total employment along with some improvements in productivity, mostly in agriculture and low-productivity services. Since these sectors still employ 82 per cent of the popula-tion in these countries, any improvement in their productivity levels is of macroeconomic significance. By contrast, output per worker in mining is around 20 times the average, but it employs less than 1 per cent of the labour force in these countries.
Over the past half century, Asian countries experienced the greatest structural change as well as a stronger increase in productivity levels, although these started from very low levels (chart 3.3C). Whereas in the early 1960s, agriculture accounted for 77 per cent of the region’s total employment, by 2010 this had fallen to 42 per cent, largely due to
Growth rates of GDP, invest-ment, industry, employment and productivity have all tended to move together in cases of successful struc-tural change.

The Catch-up Challenge: Industrialization and Structural Change 71
Chart 3.3
EMPLOYMENT, VALUE ADDED AND PRODUCTIVITY BY ECONOMIC SECTOR IN SELECTED COUNTRY GROUPS, VARIOUS YEARS
(Per cent and constant PPP dollars per employee)
Source: UNCTAD secretariat calculations, based on Groningen Growth and Development Centre, GGDC-10 Sector Database. Note: FIRE = finance, insurance, real estate and business services, TSC = transport, storage and communications – both categories
represent higher productivity service groups. Other services comprise community, social and personal services and government services, as well as trade, restaurants and hotels which are relatively lower productivity groups. Other industries comprise mining and quarrying, construction and utilities. Calculations are based on weighted regional averages for the sample of economies, as listed below. Africa: Botswana, Egypt, Ethiopia, Ghana, Malawi, Morocco, Nigeria, South Africa, the United Republic of Tanzania and Zambia; Asia: China, India, Indonesia, the Republic of Korea, Taiwan Province of China and Thailand; Latin America: Argentina, the Bolivarian Republic of Venezuela, Brazil, Chile, Colombia, Costa Rica, Mexico and the Plurinational State of Bolivia.
AgricultureManufacturingOther industriesFIRE, TSCOther services
Employment share by sector (Per cent of total employment)
AgricultureManufacturingOther industriesFIRE, TSCOther services
Total
Productivity by sector(Thousands of 2005 PPP dollars)
Value added share by sector(Per cent of total value added)
0102030405060708090
100
1950 1960 1970 1980 1990 2000 201005
101520253035404550
1950 1960 1970 1980 1990 2000 20100
102030405060708090
100
1950 1960 1970 1980 1990 2000 2010
A. Latin America
0102030405060708090
100
1966 1974 1982 1990 1998 2006 20100
10
20
30
40
50
60
1966 1974 1982 1990 1998 2006 20100
102030405060708090
100
1966 1974 1982 1990 1998 2006 2010
B. Africa
0102030405060708090
100
1963 1969 1975 1981 1987 1993 1999 2005 20100
5
10
15
20
25
30
1963 1969 1975 1981 1987 1993 1999 2005 20100
102030405060708090
100
1963 1969 1975 1981 1987 1993 1999 2005 2010
C. Asia
AgricultureManufacturingOther industriesFIRE, TSCOther services
Trade and Development Report, 201672
China, where it shrank from 82 per cent to 35 per cent during that period. The resulting shift in the employment structure involved increases in the shares of both industry and services, but the effect of these changes on aggregate productivity was not significant before 1975 because differences in sec-toral productivity were not very large; for example, productivity in manufacturing was only 2.2 times that of agriculture in 1963. A much more important driver of productivity growth was the rising produc-tivity within the different sectors. It was particularly high in manufacturing and modern services, and comparatively low in agriculture. Indeed, by 2010, productivity in manufacturing was eight times that of agriculture in the sample covered in this analysis. Therefore, the subsequent shifts from agriculture to other sectors generated a larger overall productivity effect. In East Asia, the process of structural change continued even after a certain level of industrializa-tion had already been reached owing to considerable
upgrading within the industrial sector and the emer-gence of strong intra- and intersectoral linkages, which favoured the expansion of different services sectors. This process was driven not only by consist-ently high rates of investment (see below), but also by strong export performance and growing domestic demand in these countries, as real wages rose in response to productivity gains. South-East Asia, too, achieved strong labour productivity growth in industry. Coupled with an increase in the share of industry in GDP, this led to faster overall productivity growth than in the other regions. However, in other parts of Asia, such as South Asia, industrialization has continued to be dominated by low productivity activities, reducing the potential for productivity catch-up with developed countries.
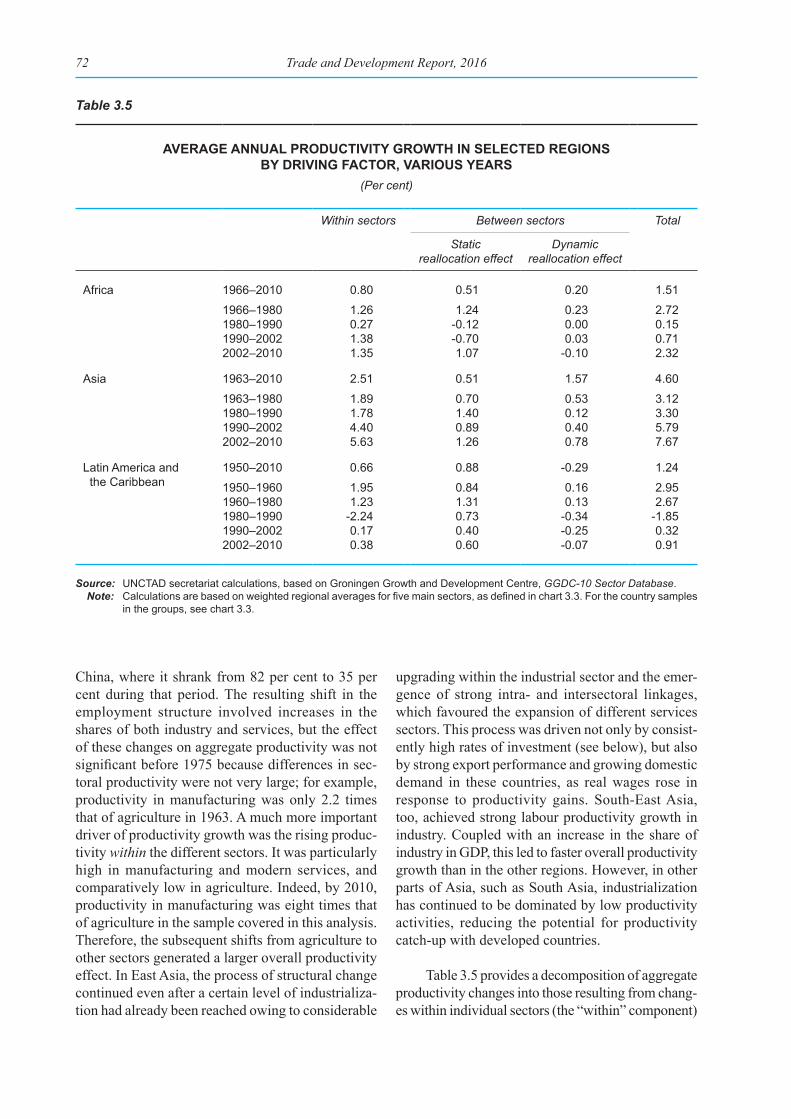
Table 3.5 provides a decomposition of aggregate productivity changes into those resulting from chang-es within individual sectors (the “within” component)
Table 3.5
AVERAGE ANNUAL PRODUCTIVITY GROWTH IN SELECTED REGIONS BY DRIVING FACTOR, VARIOUS YEARS
(Per cent)
Within sectors Between sectors Total
Static reallocation effect
Dynamic reallocation effect
Africa 1966–2010 0.80 0.51 0.20 1.51
1966–1980 1.26 1.24 0.23 2.721980–1990 0.27 -0.12 0.00 0.151990–2002 1.38 -0.70 0.03 0.712002–2010 1.35 1.07 -0.10 2.32
Asia 1963–2010 2.51 0.51 1.57 4.60
1963–1980 1.89 0.70 0.53 3.121980–1990 1.78 1.40 0.12 3.301990–2002 4.40 0.89 0.40 5.792002–2010 5.63 1.26 0.78 7.67
Latin America and the Caribbean
1950–2010 0.66 0.88 -0.29 1.24
1950–1960 1.95 0.84 0.16 2.951960–1980 1.23 1.31 0.13 2.671980–1990 -2.24 0.73 -0.34 -1.851990–2002 0.17 0.40 -0.25 0.322002–2010 0.38 0.60 -0.07 0.91
Source: UNCTAD secretariat calculations, based on Groningen Growth and Development Centre, GGDC-10 Sector Database.Note: Calculations are based on weighted regional averages for five main sectors, as defined in chart 3.3. For the country samples
in the groups, see chart 3.3.
The Catch-up Challenge: Industrialization and Structural Change 73
and those resulting from shifts in employment across sectors (the “between” component). The impact of employment shifts across sectors is further decom-posed into the effect of moving across sectors with different levels of productivity (the static reallocation effect) and the impact of moving across sectors with varying productivity growth rates (the dynamic real-location effect).7 The decomposition of productivity growth in the various regions confirms the previous discussion. Overall, such growth in Africa and Latin America was slower than in Asia and less even, stopping or even regressing in some periods, unlike the sustained increases in Asia. In both Africa and Latin America, the slowdown in GDP growth and declining investment ratios had a negative effect on within-sector productivity in the 1980s and 1990s. In Africa, this was compounded by a lack of gains and some losses from employment reallocation across sectors, as labour stopped moving out of agriculture. There was some recovery in the 2000s, partly driven by employment shifts to sectors with higher labour productivity. In Latin America, the period between 1980 and 2002 saw employment shift towards relatively low-productivity services at the expense of both agriculture and manufacturing, where the share in total employment fell from 16 to 13 per cent between 1990 and 2002.8 The recovery in Latin America after 2002 was also weaker, with aggregate productivity increases remaining well below the rates achieved in the 1950s and 1960s.
In Asia, all the components made sizeable positive contributions to productivity growth over the different periods, but within-sector productivity was important throughout, and was dominant in every period. In the 1990s and 2000s, productivity grew in all sectors, including agriculture, boosted by high investment levels in the countries concerned, which in turn generated various linkages and positive effects of economies of scale, learning-by-doing and other factors mentioned in the previous section. In coun-tries such as China, the process of continued growth of agricultural value added, despite an absolute fall in agricultural employment, was accompanied by the absorption of additional workers in productive employment in non-agricultural sectors. However, this remains an important challenge in countries such as India, where around half the workforce is still employed in agriculture.
Clearly, sustained productivity growth requires a combination of within-sector improvements and
between-sector employment reallocation towards higher productivity activities, both of which are driven by investment. This combination has proved difficult to maintain in most developing regions other than emerging Asia.
(b) Productivity growth, investment and knowledge acquisition
A necessary condition and driving force for productivity growth and structural change is capital accumulation. Indeed, the varying rates of capital accumulation in selected economies in different regions largely explain the variations in their pro-ductivity performances (see tables 3.4 and 3.6). Real investment fell markedly in the 1980s in sub-Saharan Africa and Latin America and the Caribbean (table 3.4). This was associated with drastic policy changes involving the retreat of the developmental State (including a continuous decline in public invest-ment), along with trade and capital account opening and widespread market deregulation, in particular of the financial sector. Such changes were expected to prepare the ground for a broad recovery led by private investment, but this never gained momen-tum (TDR 2003; Palma, 2011). Since the 1980s, investment-to-GDP ratios have been the lowest in sub-Saharan Africa and Latin America, and although they increased in the 2000s, they did not return to their earlier levels.
An acceleration of investment helps develop-ing countries reach a critical mass of activities in certain industrial sectors which then contributes to steady technological advances and diversification (OECD, 2012). This becomes particularly evident from an analysis of per capita investment (in con-stant 2005 United States dollar terms), which reveals the significance of absolute levels of investment in determining an economy’s capacity for growth and structural change (table 3.6). Following a long period of stagnation, per capita investment in sub-Saharan Africa rose by 46 per cent to an average of $515 in 2010–2014. However, this was only 31 per cent more than its level of the 1970s, and less than 8 per cent of the average for developed countries. In South Asia, per capita investment during the same period increased threefold from its level of the 1970s, but even so it amounted to only $532, too low to be effec-tive in supporting a process of dynamic productivity growth. In Latin America and the Caribbean, per

Trade and Development Report, 201674Ta
ble
3.6
PER
CA
PITA
INVE
STM
ENT
AN
D IN
VEST
MEN
T-TO
-GD
P R
ATIO
, SEL
ECTE
D G
RO
UPS
AN
D E
CO
NO
MIE
S, 1
970–
2014
Per
cap
ita in
vest
men
tIn
vest
men
t-to-
GD
P ra
tio
at c
urre
nt d
olla
rs
In c
onst
ant 2
005
dolla
rsA
s a
perc
enta
ge o
f dev
elop
ed e
cono
mie
sP
er c
ent
1970
-19
7919
80-
1989
1990
-19
9920
00-
2007
2010
-20
1419
70-
1979
1980
-19
8919
90-
1999
2000
-20
0720
10-
2014
1970
-19
7919
80-
1989
1990
-19
9920
00-
2007
2010
-20
14
Dev
elop
ed e
cono
mie
s4
135
4 68
34
901
6 80
66
687
100.
010
0.0
100.
010
0.0
100.
027
.524
.722
.223
.421
.0
Nor
th A
fric
a 3
91 4
86 3
96 5
26 5
279.
510
.48.
17.
77.
924
.927
.923
.422
.922
.1
Sub-
Saha
ran
Afr
ica
392
349
354
352
515
9.5
7.5
7.2
5.2
7.7
19.7
17.8
19.0
19.6
23.4
Sou
th A
frica
921
849
637
841
1 19
522
.318
.113
.012
.417
.928
.124
.817
.516
.919
.4
Latin
Am
eric
a an
d th
e C
arib
bean
830
1 02
01
284
1 70
71
578
20.1
21.8
26.2
25.1
23.6
22.2
21.3
22.6
23.1
21.3
Arg
entin
a1
084
793
895
921
1 61
226
.216
.918
.313
.524
.122
.517
.315
.415
.617
.5B
razi
l 9
64 9
60 8
36 8
381
251
23.3
20.5
17.1
12.3
18.7
21.4
21.2
19.0
17.7
20.3
Chi
le 3
77 4
22 9
681
404
2 43
39.
19.
019
.720
.636
.416
.918
.924
.420
.622
.7M
exic
o1
144
1 23
51
294
1 65
51
832
27.7
26.4
26.4
24.3
27.4
21.8
21.3
20.7
21.7
21.5
East
Asi
a 7
231
379
2 58
13
423
4 53
817
.529
.552
.750
.367
.924
.726
.830
.127
.628
.0C
hina
54
104
235
595
1 53
81.
32.
24.
88.
723
.027
.429
.031
.537
.144
.4R
epub
lic o
f Kor
ea 6
421
610
4 32
05
631
6 54
415
.534
.488
.182
.797
.927
.430
.636
.131
.029
.8
Sout
h-Ea
st A
sia
595
1 13
01
958
1 65
02
530
14.4
24.1
39.9
24.2
37.8
18.3
22.1
27.5
22.1
25.7
Indo
nesi
a 6
8 1
41 2
69 2
76 4
601.
63.
05.
54.
16.
916
.421
.323
.521
.031
.9M
alay
sia
345
655
1 36
01
242
1 76
78.
314
.027
.818
.226
.424
.632
.739
.124
.324
.8P
hilip
pine
s 1
83 2
24 2
24 2
38 3
204.
44.
84.
63.
54.
824
.324
.724
.520
.620
.0Th
aila
nd 2
49 3
97 9
01 6
67 9
076.
08.
518
.49.
813
.626
.428
.736
.024
.225
.3
Sout
h A
sia
172
184
208
356
532
4.2
3.9
4.2
5.2
8.0
18.7
22.5
23.7
26.3
27.8
Indi
a 5
2 7
0 1
12 2
06 4
051.
31.
52.
33.
06.
118
.723
.325
.429
.933
.3
Wes
t Asi
a2
379
1 82
51
536
2 60
83
938
57.5
39.0
31.3
38.3
58.9
22.5
24.3
22.6
20.9
21.8
Tran
sitio
n ec
onom
ies
....
366
501
828
....
7.5
7.4
12.4
....
20.5
23.2
23.6
Sour
ce:
UN
CTA
D s
ecre
taria
t cal
cula
tions
, bas
ed o
n U
NS
D; a
nd U
NC
TAD
stat
.N
ote:
In
vest
men
t cor
resp
onds
to g
ross
fixe
d ca
pita
l for
mat
ion.
Reg
iona
l val
ues
are
unw
eigh
ted
aver
ages
. For
the
coun
try s
ampl
es in
the
grou
ps, s
ee ta
ble
3.1.

The Catch-up Challenge: Industrialization and Structural Change 75
capita investment during the period 2010–2014 was higher than most other developing regions, averaging $1,578, but showed no increase from the previous decade and relatively little increase since the 1990s. South-East Asia, which experienced both more rapid GDP growth and more extensive structural change over the entire period, saw a nearly fivefold increase in per capita investment, from $595 in the 1970s to $2,530 in 2010–2014. However, the most outstand-ing per capita investment growth was in East Asia, from only $723 in the 1970s to $4,538 in 2010–2014, thus almost catching up with the developed-country average of $6,687. China, which experienced the most dynamic structural change in the post-1970 period, saw per capita real investment increase nearly 30-fold. Even so, its per capita investment at $1,538 is not particularly high, being close to that of Latin America and only around one-fourth that of the Republic of Korea or the developed economies.
While the rate of investment is a decisive factor for productivity growth, there is no strict correlation between the two, since productivity is influenced also by a number of other factors, such as capacity utilization and price developments. Moreover, the impact of investment on overall productivity also depends on the distribution of investment between construction and machinery and equipment, as well as the technology content and scope for technological learning through such investment. The latter is in turn influenced by skills development, education and train-ing, and product and process development, and how well these are linked to actual productive operations.
As noted in section B above, technological learning and R&D activities are essential to sup-port a dynamic process of productivity growth. The capacity for this form of knowledge acquisition grows with the level of productivity already achieved; it is greater in countries where productivity is already relatively high. As this normally occurs with rising fiscal revenues, public and publicly sponsored educa-tion, training and R&D can also play an important role. However, it is difficult to establish a direct relationship between productivity growth, knowledge acquisition and public policies that support them, as skills and technological know-how are difficult to quantify. As an approximation, expenditure on public and publicly sponsored R&D as a share of GDP may serve as an indication of the importance governments attach to knowledge acquisition for productivity growth and structural change.
Comprehensive data on public R&D spending are lacking, but it appears to have been rising in most regions and in most developing economies over the past 10 years. It has been the highest and has risen the fastest in East Asia, where productivity growth has also been the most rapid. In China it rose from 0.6 per cent to 2 per cent of GDP between 1996 and 2013, and in the Republic of Korea from an already high level of 2.2 per cent to 4.5 per cent, far above the average of 2.4 per cent for North America and Western Europe. In all other developing regions such spending has remained below 1 per cent of GDP. In sub-Saharan Africa, the region with the lowest level of productivity and relatively low productivity growth rates, it has stagnated at 0.4 per cent of GDP (UNESCO Institute of Statistics, 2016).9
However, at the country level, the relation-ship between R&D and productivity growth is not straightforward. Available indicators such as R&D as a percentage of GDP, or patents of residents, are input-output indicators that seek to measure knowledge flows and linkages indirectly, and may not be sufficient to derive a nuanced picture of learning linkages across and within countries. Several developing countries considerably increased their public R&D spending in the 2000s, but this is not reflected in higher productivity growth. Similar efforts with R&D activities appear to have varying effects on the evolution of productivity. For example, in 2010 several developing countries, such as India, Kenya, Morocco, South Africa and Turkey, invested 0.7–0.8 per cent of their GDP in R&D activities, but with varying effects on the acquisition of technological capabilities (beyond the obvious scale effects). This is mainly due to the presence or absence of learning linkages. Manufacturing in India, although stalled at 17 per cent of GDP, is more technologically diversified than that of Kenya or Morocco. This results in a relatively larger share of private sector R&D invest-ment in India, which is evident in some of the more dynamic manufacturing subsectors, hence promoting technological activities in the industry as a whole. These matching R&D investments from the private sector may not automatically occur in other countries where the industrial base is not as diversified. Similarly, the considerably higher share of R&D spending in Brazil compared with other Latin American countries is not reflected in corresponding faster productivity growth in this country over the longer term.
Even taking into account the lag effects between R&D investments and industrial performance, the

Trade and Development Report, 201676
positive impact of the former on industrial productiv-ity growth seems to be contingent on two important factors. First, R&D spending should be targeted and invested in industrial activities that are relevant to the local context. That is, it matters where the R&D spending is channelled and how that contributes to tacit know-how accumulation and skills building.
Second, R&D spending should assist in raising industrial productivity in the presence of the relevant learning linkages. Public R&D may be geared for use in a specific industrial subsector, and this know-how may not spill over into other sectors, or there could be weak linkages between R&D and the practical application of its outcomes.
D. Successful and stalled industrialization and premature deindustrialization
Developing economies have had varying degrees of success in creating production linkages over time, and in harnessing trade relations and inter-national competitiveness to augment those linkages (discussed in chapters II and IV). Initial conditions and institutional legacies have been contributory fac-tors, but policy choices have also played an important role, particularly in terms of their impact on the pace and direction of capital accumulation and technologi-cal upgrading (Amsden, 2001; TDR 2003).
The previous section has shown how individual countries and regions have performed in terms of structural transformation, investment and produc-tivity. Still, in an interdependent global economy, development is not a purely internal process; it is also affected by and measured against those economies that have exploited first-mover and other advantages to reach the top of the development ladder.
Using a broad brush approach, it is possible to identify three different trajectories of industrializa-tion. Catch-up industrialization, with robust growth of production, investment, income, and technological and trade linkages built around a large and increas-ingly diversified manufacturing sector gives rise to a strong catch-up growth dynamic resulting in nar-rowing the productivity gap with lead economies. Stalled industrialization is characterized by stagnant shares of industrial output and employment, and spo-radic growth episodes that generate linkages that are
not large or strong enough for industrial growth to withstand shock and setbacks resulting in continued vulnerability. In general, such a trajectory results in a widening productivity gap with lead economies. Finally, there is premature deindustrialization in which the shares of industrial output and employ-ment fall prematurely, at levels of per capita income much lower than those at which developed economies started to deindustrialize. This is accompanied by delinking along several dimensions and a sharp drop in relative productivity levels.
Such a categorization is not intended to be definitive, nor does it suggest that countries are per-manently locked into pursuing one path or another. These stylized trajectories, like other similar analyses (Palma, 2005, 2008; Tregenna, 2015), are intended to highlight the heterogeneity of industrialization experiences as a basis for learning from successes and failures and designing appropriate industrial policy responses (discussed in chapter VI).
1. Catch-up industrialization
The first trajectory describes what could be called the “classical” path of sustained catch-up industrialization in which the shares of industry (particularly manufacturing) in both income and

The Catch-up Challenge: Industrialization and Structural Change 77
employment rise as per capita income increases in the early phases of economic expansion. After certain thresholds of industrial activity and per capita income are reached, industry’s share of output continues to rise, but its share of employment declines as labour productivity in this sector (and most of all in manufacturing) increases more rapidly than in other sectors. As discussed in the previous section, the share of industry in aggregate value added then tapers off (and pos-sibly may even decline) at a relatively high level of per capita income, leading to a transition to a greater share of services in both output and employment. A natural process of deindustrialization follows, as industrial productivity continues to grow but demand patterns shift towards services. This was the pattern followed in today’s developed economies and later in the East Asian newly industrializing economies (NIEs), which, on some assessments, have already begun to deindustrialize along the lines of the developed economies (Ramaswamy and Rowthorn, 1997).
In several countries, the value added and employment shares of industry in general, and manu-facturing in particular, increased smoothly from the 1970s (tables 3.1 and 3.2). The distinctive feature of East Asia in this respect is not so much the share of industry in employment and output but the share of manufacturing. Some other countries (e.g. Brazil and Turkey in the 1970s) have exhibited a similar pattern for brief periods, but none has sustained it over the longer term. Moreover, East Asia is the only region which has significantly narrowed the productivity gap with developed economies, both in aggregate terms and in terms of industrial development. For example, prior to the 1950s the Republic of Korea, which had little industrialization, a shortage of local skills and a small, underdeveloped market, rapidly became a high-income country by the 1990s, with a diversified economy, making it a stellar example of industrial catch-up in the late twentieth century. While its example has been widely discussed, and its success was as much due to a favourable configura-tion of geopolitical circumstances as to domestic policies, it is still relevant for illustrating the nature of the linkages that matter in generating a success-ful trajectory of economic expansion combined with desirable structural change.
The Republic of Korea, started out with a GDP per capita of only $150 at current prices in 1960 (sig-nificantly lower than that of Brazil at $208, Malaysia at $229 and Chile at $550), and by the 1980s, it had achieved a per capita income of over $10,000,
reaching $20,500 by 2010 (Lee, 2013). The share of manufactur-ing in value added increased from 17 per cent in 1970–1971 to 31 per cent in 2010–2014 (at current values), while the share of manufacturing in employ-ment rose from only 8 per cent in 1963 to a peak of 27 per cent in the early 1990s, declining thereafter to around 18 per cent,
when the country had already achieved a relatively high per capita income (table 3.2).
Industrialization in the Republic of Korea was driven by manufacturing, beginning with lower technology and light industries in the 1960s and then moving on to more heavy industries and high-technology sectors. A smooth transition through these sectors occurred with strong credit and R&D support from the State, as well as both general and targeted State support for firms to compete in export markets. Additional support was provided through investment in broader infrastructure, particularly the provision of physical infrastructure (e.g. roads, internet, water and electricity) and relevant knowledge infrastructure (e.g. human capital, R&D laboratories and university centres of excellence). Thereafter, the Government began to grant special tax incentives for private investment. Imitation was followed by internalization of technological change and the development of new products and processes in different competitive seg-ments, marking the entry of the country’s firms into global markets (Lee et al., 1988; Rodrik, 2014). The Republic of Korea’s export structure thus diversified from low- to medium- to high-technology categories, making it one of the few emerging economies to have created a widely sophisticated technological base.
While export performance is often considered the major reason for the Republic of Korea’s suc-cess, also critical were the roles of domestic demand and related distributional changes, particularly land reform, that enabled positive income linkages, especially in the early stages of industrialization (Studwell, 2013). Indeed, these were essential factors which contributed to balanced economic growth by
Initial conditions and institutional legacies have contributed to creating production linkages, but policy choices have also played a major role.

Trade and Development Report, 201678
creating a domestic market for the mass production of industrial goods.10
During the first period of industrialization in the Republic of Korea (up to the mid-1970s), along with very rapid productivity growth (more than 8 per cent a year) in a manufacturing sector dominated by labour-intensive industries, there was an even more rapid expansion of employment in the sector. Subsequently, the changing structure of manufacturing led to con-tinued rapid productivity growth in the 1980s and 1990s, but at declining rates of employment expan-sion. The manufacturing sector was strong enough to continue enhancing productivity even after the 1998 and 2008 crises, but without further increases in its employment (chart 3.4). It therefore seems to have entered a “positive deindustrialization process” at an already advanced level of per capita income and manufacturing. China is another country that has been able to maintain rapid productivity and employment growth in manufacturing for several decades, and even to the present day (chart 3.4).
2. Stalled industrialization
Catch-up industrialization is much less common than cases of stalled industrialization, where shares of manufacturing value added and employment have stagnated at modest levels. Many developing economies, at different levels of per capita income, have experienced this to a greater or lesser extent. Their development paths have not excluded growth spurts, but rarely have these been led by manufactur-ing activity which has never reached the levels (in terms of employment or output shares) observed in East Asia. In most of the countries, manufacturing has reached a mid-level threshold which has proved difficult to exceed; productivity growth has tended to fluctuate sharply, though rarely has it matched even the weakest periods in East Asia, and when it has increased, that expansion has not been accompanied by a sustained rise of employment in manufacturing (chart 3.4).
In some countries the enclave nature of manufac-turing (e.g. in assembly plants) has likely prevented the emergence of backward and forward linkages, and, in many instances, employment generation in manufacturing has been inadequate to create the
required demand and income linkages. Moreover, investment levels, even if increasing, may still be too low to provide the big push required to trigger a self-sustaining process of expanding production capacities and domestic demand, and spread across a sufficiently wide spectrum of activities necessary for developing synergies between production and knowledge generation.
While, on the whole, the industrialization process has paused or frozen at levels of industrial income and employment that are too low to enable the forces of cumulative causation to work, specific variations exist. In some countries, such as India and Mexico, output and employment manufacturing shares have stagnated for prolonged periods. In oth-ers, such as many countries in sub-Saharan Africa, there has been very slow expansion of manufacturing activity and employment even before a solid base for sustained industrialization could be established. In yet other countries, such as a few in South-East Asia, industrialization trajectories have been interrupted for several periods following a major crisis. These pat-terns have been surprisingly common across a range of developing countries. Indeed, it is estimated that at least 30 countries are experiencing stalled catch-up growth (World Bank, 2012; Lee, 2013).
India provides an example of the first variant of stalled industrialization. In the 1950s and 1960s, its manufacturing sector went through the easier stages of diversification linked to a strategy of import-sub-stituting industrialization. However, there was little subsequent momentum, as a result of which its core manufacturing (especially in capital goods sectors), which was developed in the initial decades of indus-trialization, remained underutilized, first due to lack of demand, and later to an absence of linkages char-acteristic of the growth of manufacturing (Raj, 1975; Bhalla and Ma, 1990). The share of manufacturing in total employment increased by only 2 percentage points over four decades, from 9.4 per cent in 1970 to 11.6 per cent in 2011, while the share in manufactur-ing value added stagnated at 17–21 per cent over the same period. From 1980 onwards, low-technology, labour-intensive sectors in manufacturing, such as food and beverages and textiles, showed marginal declines in output shares, but continued to have simi-lar shares of employment. Even the more dynamic apparels sector saw only a 1 percentage point increase in output share between 1980 and 2005, while the employment share increased by 6 percentage points.

The Catch-up Challenge: Industrialization and Structural Change 79
Chart 3.4
AVERAGE ANNUAL GROWTH RATES OF EMPLOYMENT AND PRODUCTIVITY IN MANUFACTURING, SELECTED COUNTRIES AND REGIONS, VARIOUS YEARS
(Per cent)
Source: UNCTAD secretariat calculations, based on Groningen Growth and Development Centre, GGDC-10 Sector Database. Note: Average annual growth rates correspond to the periods indicated in the respective charts. Regions show weighted averages.
For group compositions, see chart 3.3.
1952–1962
1962–1975
1975–1990
1990–2002
2002–2010
02468
10121416
0 1 2 3 4 5 6 7 8 9
Prod
uctiv
ity
Employment
China
1960–19751975–1990
1990–2002
2002–2010
0
2
4
6
8
10
0 1 2 3 4 5 6
Prod
uctiv
ity
Employment
India
1961–1980
1980–1997
1997–2002
2002–2012
-2
0
2
4
6
8
10
0 1 2 3 4 5 6 7
Prod
uctiv
ityEmployment
Indonesia
1963–1975
1975–1990
1990–1997
1997–2003 2003–2010
0
2
4
6
8
10
12
0 1 2 3 4 5 6
Prod
uctiv
ity
Employment
Asia
1966–19801980–1990
1990–2000 2000–2010-2
0
2
4
6
8
10
0 1 2 3 4 5
Prod
uctiv
ity
Employment
Africa
1950–1960 1960–1980
1980–1990
1990–2002
2002–2010
-4
-2
0
2
4
6
8
10
0 1 2 3 4 5
Prod
uctiv
ity
Employment
Latin America
1965–1990
1990–2002
2002–2010
0
2
4
6
8
10
12
0 1 2 3 4 5 6 7 8 9 10 11 12
Prod
uctiv
ity
Employment
Botswana
1960–1980
1980–1994
1994–2002
2002–2011
-2
0
2
4
6
8
10
-1 0 1 2 3 4 5
Prod
uctiv
ity
Employment
South Africa
1960–1980
1980–1994
1994–2002
2002–2011-4
-2
0
2
4
6
8
10
0 1 2 3 4 5 6 7 8 9 10 11 12
Prod
uctiv
ity
Employment
United Republic of Tanzania
1975–1990
1990–19971997–2002
2002–2011
0
2
4
6
8
10
-2 -1 0 1 2 3 4 5 6 7 8 9 10
Prod
uctiv
ity
Employment
Malaysia
1963–1975
1975–19901990–1997
1997–2002
2002–2010
0
2
4
6
8
10
-2 -1 0 1 2 3 4 5 6 7 8 9 10 11 12
Prod
uctiv
ity
Employment
Republic of Korea
1960–1975
1975–1990
1990–1997
1997–2002
2002–2010
-2
0
2
4
6
8
10
0 1 2 3 4 5 6
Prod
uctiv
ity
Employment
Thailand
1950–1975
1975–19821982–1990
1990–2002 2002–2010
-4
-2
0
2
4
6
8
10
-4 -3 -2 -1 0 1 2 3 4 5
Prod
uctiv
ity
Employment
Argentina
1950–1970 1970–1980
1980–1990
1990–2002
2002–2010
-4
-2
0
2
4
6
8
10
-1 0 1 2 3 4 5 6 7
Prod
uctiv
ity
Employment
Brazil
1960–1980
1980–1987
1987–1994 1994–2001
2001–2011
-4
-2
0
2
4
6
8
10
0 1 2 3 4 5 6
Prod
uctiv
ity
Employment
Mexico
Trade and Development Report, 201680
In medium- to high-technology sectors, such as motor vehicles and other transport equipment, chemical products and rubber and plastic products, the shares of output and employment in 2014 were similar to their levels in 1980.
Weakening production linkages within industry, as well as between agriculture and industry, which had been developed in the earlier period, never reached the necessary threshold to create knock-on effects on employment, income and demand in India. The limited domestic market (despite a large population), in turn, affected the ability to create the economies of scale needed for the country to become more globally com-petitive (Dasgupta and Singh, 2006; Kannan and Raveendran, 2009). Meanwhile, linkages and activities in other manufactur-ing sub-sectors, especially those related to engineering and design and high-technology products (e.g. for energy production), have been relatively weak (with the partial exception of the pharmaceutical sector). Thus, sectoral gains in pro-ductivity have not been associated with the creation of large and high-quality employment in the overall economy.
The services sector in India has grown faster than the other sectors, to become the dominant sector in the economy. However, disaggregating services shows that while some categories (e.g. business services, software and services relating to informa-tion and communication technologies) have been growing at an average annual rate of 10 per cent since the early 1990s, other subsectors have grown more slowly. As a result, although the share of ser-vices in GDP is almost 60 per cent, its share in total employment is only around 30 per cent (Kotwal et al., 2011; Ghosh, 2015), with the largest proportion of employment remaining in very low productivity and poorly remunerated activities. These patterns of growth also explain the great variation in levels of productivity across and within the different sectors of the Indian economy. The weighted coefficient of variation in sectoral labour productivity is 0.69 – the highest in Asia (Klyuev, 2015) – pointing to consider-able potential to increase economy-wide productivity by shifting resources from low-productivity to higher productivity sectors and subsectors of the economy.
Mexico provides another example of stalled industrialization, although at a higher industrial share in GDP than India. Its manufacturing grew at an aver-age annual rate of around 7.5 per cent in the post-war period, with improvements in both employment and, to a lesser extent, productivity. By 1970–1980, the shares of industry and manufacturing sectors in total value added were around 40 per cent and 19 per cent respectively. But they have barely changed since then (tables 3.1 and 3.2). The manufacturing sector was
severely hit by the debt crisis in the early 1980s, when its growth stagnated and produc-tivity shrank until 1987. Policy reorientation and the process of joining the North American Free Trade Area (NAFTA) with the United States and Canada led to some improvement in productivity during the period 1987–1994, and to a more sig-nificant recovery in employment
growth in the second half of the 1990s, along with a surge of production by assembly plants (maquilado-ras). However, without an acceleration of investment, neither labour productivity nor employment creation grew in the 2000s (chart 3.4). The inability to achieve sustained industrial growth is reflected in the sluggish growth of manufacturing productivity, at an aver-age of only 0.2 per cent per annum between 1970 and 2012; indeed, the overall economy showed no increase in productivity during this period.
Rapid trade and financial liberalization – which made the economy an important maquila exporter with only limited domestic production linkages – a recurrently overvalued exchange rate and the chang-ing role of the public sector have all been factors contributing to the poor growth performance of Mexico’s economy. A key feature of that economy has been the contrast between rapid export growth and weak investment growth (TDR 2002; Moreno-Brid et al., 2005; Moreno-Brid and Ros, 2009). The period following the NAFTA agreement, characterized by trade and financial liberalization, led to a strong increase in manufacturing exports, from only 10 per cent of total exports in 1981 to more than 80 per cent in the early 2000s, decreasing only slightly thereafter. However, as exports increased, imports kept pace, resulting in an increase in the imports-to-GDP ratio from 12.9 per cent in 1981 to 31 per cent in 2010. With domestically produced intermediate goods
Catch-up industrialization is much less common than cases of stalled industrializa-tion, where shares of manu-facturing value added and employment have stagnated at modest levels.

The Catch-up Challenge: Industrialization and Structural Change 81
accounting for only 25 per cent of total value added, few backward and forward production linkages could be established (Palma, 2005). The declining investment rate of the 1980s was reversed during the 1990s, but the investment-to-GDP ratio has been stagnant at 20–21 per cent since then. Thus, despite preferential access to the largest and most dynamic market in the industrial world and large inflows of foreign investment, the Mexican economy has been unable to establish the linkages needed to stimulate a dynamic process of industrialization and economic growth. This is largely due to a delinking of the exporting sectors from the domestic economy (Cruz, 2015; Palma, 2005).
Some countries in South-East Asia, such as Indonesia and Thailand, experienced a hybrid, stalled industrialization process, with positive structural transformation between the 1960s and the 1997–1998 Asian crisis. Until the crisis, this transformation was accompanied by rising investment rates and con-tinuous increases in employment and productivity across a broad range of industrial sectors, particu-larly manufacturing (chart 3.4). The 1997–1998 crisis resulted in slower indus-trial growth and sluggish formal sector employment growth for these economies. Investment rates collapsed and have never fully recovered, and the indus-trial dynamics have been altered quite profoundly. Moreover, similar to Mexico, there has been an apparent disconnect between their strong export performance and production and learning linkages (Aswicahyono et al., 2011). Although growth gradually recovered after the crisis, the effects of the crisis on the key drivers of industrial growth have been profound, including a significant fall in investment rates from their very high levels and subsectoral shifts within manufacturing. In Indonesia, the post-crisis period saw an increase in the output shares of agriculture-based food and beverages and rubber products, and resource-based petroleum products. In Thailand, the output share of high-technology categories, such as machinery, computing equipment and optical instru-ments, grew from 0.2 per cent in 1982 to 8.1 per cent in 1996, but was still around 8 per cent in 2006. Thus, these countries still face the challenge of creat-ing a positive nexus between technological change, investment and demand in the sectors that are already
developed to some extent but have yet to realize their full potential for expansion and growth.
These countries display the dualism of a dynamic “modern” economy coexisting with a relatively stagnant and more informal economy. For instance, agricultural employment shares in Indonesia and Thailand, are still above 30 per cent, and productivity varies considerably across the different sectors of their economies. This is indicative of unexploited opportu-nities to boost economy-wide productivity and growth by shifting resources from low-productivity agriculture to higher productivity industrial and modern services sectors (Amarase et al., 2013; Chuenchoksan and Nakornthab, 2008; Lathapipat and Chucherd, 2013). However, such shifts do not occur on their own; they require proactive industrial policies to encourage them.
Other stalled industrializers – albeit at the oppo-site end of the spectrum from those in South-East Asia – include several economies in sub-Saharan Africa.11 Starting from a much lower industrial base than the rest of the developing world, countries in the region took a step forward in expanding this sector, including
manufacturing activities, dur-ing the period of accelerated growth between 1960 and 1975, when industrial growth rates exceeded those in the developed world (de Vries et al., 2015).12 Subsequent structural adjust-ment policies had varying nega-tive impacts on manufacturing in many countries in the region (UNIDO and Government of the
United Republic of Tanzania, 2012). In this context, struggling local enterprises were unable to generate the resources needed to kick-start investment (which dropped precipitously until well into the 2000s)13 or survive competition from foreign firms, while the few better performing State-led manufacturing firms attracted foreign buyers. In the region as a whole, the share of industry in total value added decreased slow-ly from its peak of 30 per cent in 1980, while the share of manufacturing value added fell by about 15 per cent to single-digit levels in the 2010s. Meanwhile, the share of industrial employment stagnated at below 10 per cent in the post-1970 period before reaching 12 per cent in the 2010s.
Since the manufacturing sectors of many of the countries in sub-Saharan Africa did not develop to
Proactive industrial policies are needed to encourage the shifting of resources from low-productivity agriculture to higher productivity industrial and modern services sectors.

Trade and Development Report, 201682
a sufficient scale and level of sophistication during the import substitution period, the growth-pulling potential of this sector could not be realized, and it has never reached the scale needed to drive a cumula-tive process of linkage building.14 Increasing returns and cumulative productivity increases have not been captured, export capacity has remained subdued, and there has been limited technological diffusion to other sectors of the economy. Moreover, learning-by-doing has been limited. In addition, strong forward and backward linkages with other sectors have not developed; indeed, linkages between agriculture and industry have become more fragmented over time, while limited employment generation in industry has pushed workers into low-technology services.
In both sub-Saharan Africa and the transition economies, the decline of industry, in general, and manufacturing in particular, has been concomitant with a reduction of per capita income, a situation referred to as “reverse deindustrialization” (Palma, 2005).
3. Premature deindustrialization
The strong economic growth rates and ambi-tious industrial policies that characterized much of the developing world in the 1960s and 1970s ena-bled some countries, particularly in Latin America, to achieve relatively high levels of manufacturing output and pro-ductivity. These countries more or less kept pace with the fast productivity growth rates in the developed economies. However, after the debt crisis and the “lost decade” of the 1980s, and the subsequent policy shift towards more market-friendly strategies, most of these countries expe-rienced continuous declines in manufacturing output and employment shares. Large, and sometimes unilateral, trade opening, coupled in some countries with cur-rency appreciation aimed at inflation control, strongly affected the profitability and viability of important segments of the manufacturing sector. In addition, regressive income redistribution and the retreat of the developmental State weakened domestic markets
and further affected the previous drivers of industri-alization. Hence, the strategies adopted for activat-ing a dynamic process of private capital accumula-tion and growth, based on a combination of increased foreign direct investment (FDI) and reduced public investment and State intervention, did not produce the expected results. Indeed, investment rates fell and growth was well below the post-war average in these economies during the 1980s and 1990s (TDR 2003; Palma, 2011).
Industrialization processes in Argentina, Brazil and Chile had advanced significantly since the 1930s and 1940s, so that by the first half of the 1970s, their manufacturing sectors accounted for 34, 31 and 20 per cent of total value added, respectively. However, by 2010–2014 these shares had dropped to 17, 13 and 12 per cent, respectively (table 3.2). To some extent, a similar trajectory, though with differences in timing, was followed by countries in North Africa, as well as several transition economies following the collapse of the former centrally planned system, which largely destroyed the bases of their significant industrial development.15
Since this process of relative shrinking of manu-facturing began at levels of per capita income that were much lower than the levels of income at which developed economies started to deindustrialize, this phenomenon has been termed “premature deindus-trialization”.16 Such a contraction in countries that had achieved a significant level of manufacturing
has often been associated with a political shock and a resulting change in policy direction.
In Latin America as a whole, the first stage of deindustrializa-tion in the 1980s saw a steep fall in productivity, as manufacturing firms initially adjusted produc-tion and real wages rather than employment. However, at the sec-ond stage, when it was clear that the previous industrialization pro-
ject had been abandoned, there was a general adjust-ment aimed at restructuring industrial activities and reducing employment. Such a “defensive strategy” (which included the closure of many firms) led to a recovery of productivity between 1990 and 2002, accompanied by absolute declines of employment in manufacturing in some countries (Porta et al.,
Unilateral trade opening, financial deregulation, regres-sive income redistribution and the retreat of the develop-mental State led to premature deindustrialization in several countries, notably in Latin America.

The Catch-up Challenge: Industrialization and Structural Change 83
2016). Economic recovery between 2003 and 2011 generated new employment in the manufacturing sector, but achieved only mediocre gains in produc-tivity growth (chart 3.4).17 With investment-to-GDP ratios remaining low, Latin America’s rate of capital accumulation has been the lowest among develop-ing regions in the post-1970 period. The continuous decline in public investment in the post-1980 period clearly, but only partly, contributed to this reduction (see also chapter V). Investment-to-GDP ratios in North Africa and the transition economies have also been stagnant, at best, and comparatively low in per capita terms (table 3.5).
In the context of increasingly competitive global markets, premature deindustrialization poses further challenges to successful transformation by reducing the incentives to invest, weakening the dynamics of employment generation in modern sectors of the economy, reducing demand and income linkages and
constraining the ability to benefit from economies of scale. In particular, the reduction in aggregate demand for domestically produced manufactured goods as a result of increased imports (in the absence of a concomitant increase of manufacturing exports) acts as a source of deindustrialization. As the dynam-ics of employment generation in the modern sector of the economy weakens, labour is often absorbed by the low-productivity primary sector, auxiliary services and/or the informal economy character-ized by low quality jobs and low wages. Hence, the economy is further deprived of possibilities to build income linkages. Under such conditions, investment and domestic production linkages to successfully substitute imported intermediary and capital goods are severely weakened if not completely destroyed. Financial liberalization becomes a further source of deindustrialization through its effect on the relative competitive position of the exchange rate (Patnaik, 2003).
1. The role of the primary sector in structural change
Historically, many countries managed to set in motion their industrialization process through vari-ous kinds of linkages with the production of primary commodities.18 However, resource-rich countries have faced specific challenges associated with the “natural-resource curse”, whereby their wealth of natural resources reduces incentives for structural change, and there are also instances of governance deficiencies, currency overvaluation and excessive external indebtedness.
However, there is nothing automatic about these connections, and the development outcome depends crucially on the management of the resources and
the revenues derived from them. The challenge is to be able to stimulate a process of dynamic interac-tion between the production and export of primary commodities and structural transformation involving economic diversification, including the expansion of manufacturing activities. Even when the goal is to reduce the share of the primary sector in GDP, the sector can itself make an important contribution to that change in various ways that can enhance the linkages so critical to the industrialization process (UNIDO, 2012).19 Forward production linkages in primary production are a potentially important source of raw material inputs for processing in domestic manufacturing industries. They can help increase processing activities as a first step in the expansion of the manufacturing sector. Primary production also requires a variety of inputs of goods and ser-vices, some of which can be supplied domestically
E. Making the primary and tertiary sectors work for structural transformation

Trade and Development Report, 201684
through backward linkages. Net exports of primary commodities can contribute to the foreign exchange earnings needed for financing capital goods imports for capacity expansion and technological upgrading in the manufacturing sector, thereby reducing the need for external borrowing. Higher incomes in the primary sector also help increase domes-tic demand for consumer goods, some of which can be produced domestically, thus generating demand linkages for domestic production. The primary sector, especially oil and natural gas and mining, is a major source of fiscal revenues for public investment and for the provision of public services, including education and vocational training, public utilities and business services (TDRs 2002 and 2005). Such public expenditure can finance economic diver-sification while also crowding in additional private investment.
All this depends crucially on economic policy. Even more than in other sectors, the lack of appropri-ate policies to deal with export-oriented commodity production can result in enclave-type activities (par-ticularly in extractive industries) and macroeconomic vulnerabilities. This generates particular types of weaknesses that have become evident at present after a decade of boom in global commodity prices and their subsequent decline. Thus, a period of higher prices and revenues from primary exports can support economic growth, but it can also lead to either more structural diversification or economic “reprimarization”.20
The number of countries where primary com-modities provide more than half of total export earnings increased from 108 in 2000 to 115 in 2014.21 Some reprimarization of the export structure took place in Africa, where the share of processed and unprocessed primary commodities in total merchan-dise exports increased marginally from 75 per cent in 2000 to 76 per cent in 2014, and more significantly in South America, where the share increased from 66 per cent to 75 per cent (see also chapter IV).22
A basic problem with such dependence on the primary sector is the instability of international commodity prices, which leads to booms and busts in export earnings. This introduces an element of
instability in public finances, and thus in public investment that relies on such revenues. In addition, a sharp rise of export earnings during boom periods can lead to exchange rate appreciations that reduce the incentive for domestic production of tradable
goods, and therefore constrain economic diversification. Both of these require specific fiscal and monetary management if industrialization is to proceed under such conditions.
In the 2000s, many gov-ernments sought to mitigate the potentially negative impact of the instability of export earnings
on public finances through new fiscal rules, such as limits on public expenditure and balanced or structur-al budget rules. These have generated mixed results. Some commonly cited successes are the structural balanced budget rule in Chile and the sustainable budget index rule in Botswana, which stipulates that current expenditure be financed only through non-resource revenues. Several governments established commodity funds (Aoun and Boulanger, 2015) to serve as a buffer against revenue volatility and as an instrument to smooth fiscal expenditure over time or for longer term savings for future generations, on the grounds that natural resources are finite.23 To prevent or reduce exchange rate appreciation that would affect the competitiveness of domestic manufactur-ing industries, many governments sought to manage the nominal exchange rate through currency market interventions (see chapter VI).
2. Making commodity export revenues work for structural transformation
The contribution of commodity earnings to government revenues is the critical fiscal linkage that could facilitate growth and diversification strategies. This is evident from the increase in public invest-ment in all the major commodity-producing regions following rising global prices of primary commodi-ties in the 2000s. The share of public investment in GDP increased in Latin America from 3.5 in 2000 to 4.1 per cent in 2014, in Africa from 5.1 to 6.1 per cent and in the transition economies from 2.7 to 4.3 per cent (IMF, 2015). Public revenues from primary
The primary sector is often a major source of fiscal revenues, which can finance economic diversification while also crowding in additional private investment.

The Catch-up Challenge: Industrialization and Structural Change 85
activities were used in ways that could contribute to economic diversification, such as funding public development banks and investing in technology development.24 With declining commodity prices, some of these spending pat-terns may be reduced or even reversed, which raises the ques-tion of the sustainability of such strategies.
The generation or strength-ening of linkages between the primary sector and manufac-turing is receiving renewed attention.25 Ideally, these activi-ties should develop backward and forward production linkages, in addition to consumption and fiscal linkages (Hirschman, 1958, 1986). Backward production linkages in the extrac-tive industries can be promoted mainly through local content requirements or recommendations. They aim at local employment creation and the development of domestic production capacity to supply the commodi-ties sector. In recent years, multinational enterprises (MNEs) themselves appear to have an interest in increasing linkages, as some inputs for their activities can be procured locally at lower cost, and also to fulfil corporate social responsibility requirements. But it is the role of governments to set or negotiate local content rules with MNEs, and promote cooperation between these firms and local firms to establish a network of efficient domestic suppliers. The potential for backward linkages appears to be even greater in agricultural production to the extent that efforts aimed at output and productivity increases in many countries lead to an increasing demand for relatively unsophisticated equipment and inputs that can often be provided by domestic firms (UNCTAD, 2015a).
Even the mining sector, which has frequently behaved as an economic enclave, can provide an important market for domestic production during the initial construction phase.26 State-owned enterprises (such as Petrobras in Brazil and Petronas in Malaysia for the oil sector, and Codelco in Chile for copper) have been instrumental in the success of local content poli-cies. However, like all such industrial policies, it is important to ensure that the benefits of these policies
are not captured by local elites through corruption practices, or that excessive domestic preferences do not encourage the development of inefficient domestic companies.
The classical approach to fostering production linkages between the primary sector and industry focuses on the pro-cessing of domestically avail-able raw materials instead of exporting unprocessed com-modities. This approach has been labelled “export substitu-tion”, as export restrictions can support such linkages. Some
examples where government policies have helped develop resource-based industrial production include diamonds beneficiation in Bostwana; the creation of a petrochemical pole based on abundant gas reserves in the Plurinational State of Bolivia; and the devel-opment of the leather industry in Ethiopia, Kenya and Namibia. Measures to discourage exporting the raw material have also supported domestic pro-cessing. For example, levies on unprocessed soya exports favoured the creation of an industry of soya-based biofuels in Argentina; export taxes applied in 2008 and the 2013 ban on the sale of raw minerals in Zambia helped develop refined copper and cop-per alloy production, and led to the building of three copper smelters; and an export ban on unprocessed nickel in Indonesia encouraged domestic value addi-tion (Ramdoo and Bilal, 2014).
Another strategy is to focus on the dynamic ben-efits for the manufacturing sector by improving the supply of domestic raw materials. This can reduce the
manufacturing sector’s depend-ence on imported raw material inputs, and, if supported by ade-quate industrial policy measures, it may serve as an incentive for starting new or expanding exist-ing industrial activities (UNECA and African Union, 2013). Such initiatives follow an integrated approach that seeks to develop
the primary sector in tandem with the manufacturing sector. They are based on the perception that efficient domestic supply chains can encourage investment in domestic manufacturing capacity. Although there appears to be some scope in a number of developing
Processing of domestically available raw materials, instead of exporting unprocessed commodities, promotes production linkages between the primary sector and industry …
… another strategy is to focus on fostering dynamism in the manufacturing sector by improving the supply of domestic raw materials.

Trade and Development Report, 201686
countries for increasing the extraction of base chemi-cals and base metals, the provision of raw material in sufficient quantity and quality for processing in a growing manufacturing sector is mainly a supply issue. Therefore, productivity-enhancing measures in agriculture can complement measures aimed at expanding manufacturing activities.
The insufficient integration of domestic supply chains is often a serious constraint on the expansion of manufacturing activities and even on the optimal use of existing production capacities, especially in poorer countries where agricultural productivity is especially low. But also, in many of these countries, the provision of agricultural raw materials to sectors such as food processing, textiles, clothing and leather goods is often far below their potential. As a result, large amounts of raw materials and intermediate goods that could be sourced locally have to be import-ed. Therefore, in their case a broader industrial policy would also focus on vertical integration of agriculture with industry (see box 6.1 in chapter VI). This may require changes in agricul-tural production and marketing structures and capacity-building among agricultural operators to better meet the requirements of manufacturers in related activi-ties. Additionally, an extension of the cultivated land area and an increase in agricultural pro-ductivity may be necessary, including, in particular, the installation of extended irriga-tion systems. For agricultural operators and domestic traders, this will imply adapt-ing traditional behaviour patterns to the exigencies of vertical integration, for example through the creation of larger operating units and the commercialization of agricultural activities.
Improving the efficiency of domestic supply chains needs to focus not only on quantity, but also on the quality of the agricultural inputs for manufac-turing firms. Compliance with international product standards requires strengthening national quality infrastructures by improving related regulatory and public services for conformity assessment and quality enhancement, as well as certification services. The promotion of compliance with standards and related learning and investment has to begin at the stage of raw material production.
3. The role of services in structural transformation
The shares of the services sector in both total value added and employment have grown consider-ably over the past few decades, not only in developed economies, where this has been a normal feature of long-term structural change, but also in many developing countries, where it has occurred at much earlier stages of industrialization and structural transformation. Therefore, the question arises as to whether developing economies can “leapfrog” to more advanced stages of industrial development by relying to a greater extent on services in structural transformation, and by shifting employment and income creation from activities in the primary sector directly to the tertiary sector.
Interest in the possibility of services-led growth may also result from the fact that export-led indus-trialization is becoming more difficult, as an ever
increasing number of produc-ers from developing countries compete in a global market that is expanding much more slowly than when some coun-tries successfully embarked on export-oriented industrialization (see chapter VI). There is, how-ever, little evidence of the highly heterogeneous service sector, by itself, playing the role of engine of growth without a strong man-ufacturing base. Some modern
services, such as those enabled by ICTs, can have positive impacts on structural transformation simi-lar to those that traditionally have been ascribed to manufacturing in terms of productivity and employ-ment growth and linkage creation, including through international trade (Dasgupta and Singh, 2005; Saéz et al., 2015). On the other hand, services embrace a broad range of activities, from mostly low-skilled and low-productivity consumer services to high-skilled and technology-intensive business services.
Optimistic views on the potential of the services sector to replace, to a significant extent, the manu-facturing sector as a driver of a dynamic process of structural transformation rely on observations on the evolution of productivity in developed countries over the past few decades. While the overall slowdown
The services sector is more likely to assume a supporting role in accelerating structural transformation in countries that have a dynamic manu-facturing industry with fast productivity and income growth.

The Catch-up Challenge: Industrialization and Structural Change 87
of productivity at the end of the 1970s and 1980s was generally perceived to result from the “tertiari-zation” of the economy, studies have shown that services in the United States, rather than slowing down productivity growth, have actually sustained overall productivity performance since the 1990s (Bosworth and Triplett, 2007; Inklaar and Timmer, 2008). With respect to developing economies, other studies have pointed out that the services sector has been contributing to aggregate productivity as much as manufacturing in many countries (Timmer and de Vries, 2009).
However, such studies need to be considered with caution. First, the increasing importance of services as a share of total employment could partly result from a “statistical illusion” (Andreoni and Gregory, 2013; UNIDO, 2013), since various activities, ranging from design and data processing to transport, cleaning and security, are increasingly contracted out by manufacturing firms to specialist service providers, so that the boundaries between services and manufacturing activities have changed over time (Di Meglio et al., 2015). Such services are not new to economies, but external provision by specialized service firms implies an accelerated expansion of the services sector and a deceleration of value-added growth in manufacturing. More impor-tantly, the expansion and upgrading of such services are largely dependent on the expansion and upgrading of the manufacturing activities they relate to.
Second, the heterogeneity of the tertiary sector implies that the ability of different kinds of services to boost productivity varies widely. The GGDC 10-Sector Database (Timmer et al., 2014) highlights considerable productivity variations across different service categories between 2000 and 2010 (table 3.7). In most countries of the sample, productivity is sig-nificantly higher in “finance, insurance, real estate and business services” and in “transport, storage and communications” than in other categories. The first category involves high-skilled services whose value added is significantly affected by price changes that are hard to represent realistically as “productivity” changes, while the second includes activities that have been progressively outsourced by manufactur-ing firms. Productivity levels in other categories such as “trade, restaurants and hotels”, “community, social and personal services” and “government services” are, in general, much lower. There are also signifi-cant disparities across countries, which imply that
achieving high productivity in different categories of services should not be taken for granted.
In any case, the composition of the services sec-tor matters in terms of its contribution to employment and productivity growth. Low productivity services, for example in hospitality and personal care, may help to create employment for surplus labour, but the gains in terms of overall productivity will be low. By contrast, high productivity services are, to a large extent, a reflection of the high productivity growth of industrial activities, and the rising wages and incomes that this helps to generate (Felipe et al., 2014). Thus, in most cases, service activities have not emerged sui generis, but as an offshoot of high-productivity manufacturing activities, and at the same time they may contribute significantly to productivity growth in those manufacturing activities.
The services sector therefore needs to rely on strong intersectoral interactions and interdependen-cies with a mature manufacturing sector. In India and countries in Africa, studies have highlighted the significant role played by services as inputs to the manufacturing sector, but they have also con-cluded that those countries still have the potential for diversifying their economies through stronger linkages between the two sectors (Hansda, 2005; Saéz et al. 2015). In countries where industrializa-tion has stalled, the movement of labour into service activities has generally resulted from inadequate employment creation in the economy as a whole. In African countries, for instance, labour shifted into the services sector as employment creation in manufac-turing weakened, and the services sector expanded by 12 percentage points, on average, between 2000 and 2012. However, much of the value added in services in Africa results from low-productivity activities (UNCTAD, 2015b).
Overall, the services sector is therefore more likely to assume a supporting role in accelerating structural transformation in countries that also have a dynamic manufacturing industry and fast productiv-ity and income growth, than in countries with stalled industrialization at a low level of industrial value added. This is because the level of income per capita is still too low to generate a substantial demand for more skill- and technology-intensive consumer ser-vices, and because manufacturing has not yet reached a stage where it would strongly drive a business service sector, or where the latter could significantly

Trade and Development Report, 201688
Table 3.7
RATIO OF MANUFACTURING PRODUCTIVITY TO SELECTED SERVICES PRODUCTIVITY, SELECTED ECONOMIES, 2000−2010
(Annual average)
Community, social and personal services
Finance, insurance, real estate
and business services
Govern-ment
services
Trade, restaurants and hotels
Transport, storage and communi-
cation
Ranking by productivity
of the manu-facturing
sector among services
Developed economiesJapan 1.7 1.3 1.3 1.7 1.1 1United States 1.9 0.6 1.7 1.7 1.0 2
AfricaBotswana 0.9 0.6 1.3 1.1 0.6 4Egypt .. 0.6 3.7 1.2 1.0 3Ethiopia 1.0 0.1 0.3 0.5 0.1 6Ghana 1.1 0.3 0.6 1.6 0.2 4Kenya 1.6 0.2 0.4 1.2 0.3 4Malawi 0.9 0.3 1.7 1.5 0.5 4Mauritius 1.7 0.5 1.0 0.9 0.5 4Morocco .. 0.1 2.3 1.4 0.7 3Nigeria 5.6 0.7 3.3 1.1 1.9 2Senegal 3.7 0.1 0.6 1.6 0.4 4South Africa 2.3 0.9 1.4 2.1 0.7 3United Republic of Tanzania 9.6 0.4 1.8 2.0 0.7 3Zambia 37.3 0.3 .. 1.2 0.8 3
Latin AmericaArgentina 5.3 3.2 3.7 2.7 1.3 1Bolivia (Plurinational State of) 1.1 0.5 .. 2.1 0.5 3Brazil 4.8 1.0 1.0 2.2 0.9 2Chile 2.0 0.8 .. 2.7 1.1 2Colombia 1.4 0.9 .. 2.9 1.0 2Costa Rica 1.6 1.3 1.3 1.8 1.0 2Mexico 4.5 0.6 1.3 1.3 0.6 3Peru 1.9 0.9 .. 2.2 1.6 2Venezuela (Bolivarian Republic of) 3.1 2.9 .. 3.6 2.4 1
AsiaChina 11.2 0.3 1.3 1.8 1.0 2China, Hong Kong 0.4 0.4 .. 0.6 0.6 5China, Taiwan Province of 1.2 0.8 0.7 1.1 0.7 4India 2.1 0.3 0.6 0.9 0.7 5Indonesia 1.5 0.7 3.9 2.7 1.9 2Malaysia 2.1 0.8 2.8 1.9 1.1 2Philippines 8.4 0.7 2.5 3.0 2.6 2Republic of Korea 1.6 2.3 .. 3.4 1.4 1Singapore 2.4 1.0 .. 1.2 1.2 1Thailand 0.6 2.3 10.9 2.5 1.0 2
Source: UNCTAD secretariat calculations, based on Groningen Growth and Development Centre, GGDC-10 Sector Database.
The Catch-up Challenge: Industrialization and Structural Change 89
contribute to productivity growth in manufacturing. This is in contrast to the nature and potential of the services sector at the onset of deindustrialization in developed economies, where manufacturing has already grown to account for a significant share of a country’s GDP.
On the other hand, some services may be less dependent on domestic linkages than others. With the expansion of global trade in services, develop-ing countries may also benefit from an expansion of service exports in niches that can be filled on the basis of static country endowments, such as sites of historical or scenic interest for tourism, or time zone
proximity, or language skills for call centres, account-ing and similar business services. The tourism sector has a strong export component, and can be a source not only of job creation but also of foreign exchange, and even for the generation of backward linkages to certain manufacturing activities. But while that sec-tor relies less on domestic demand, its development requires appropriate physical infrastructure, and it has weak potential for contributing, on its own, to overall productivity growth in an economy. Similarly, attracting offshore services of medium or high value added is likely to remain out of reach for developing countries that lack sufficient industrial and techno-logical capabilities (OECD, 2005).
Industrialization, and in particular the devel-opment of a dynamic manufacturing sector, has a dimension that reaches beyond the firm level and the level of individual prioritized subsectors, and even beyond the manufacturing sector as a whole. It has implications for society as a whole and not only for pioneers in individual manufacturing activities. While industrial development offers considerable potential for income growth across the entire econo-my, it also affects social and political structures. This chapter has suggested that public sector involvement in the process of industrialization is essential for both productivity growth and linkage creation. Another argument in favour of State involvement is based on the recognition that domestic infant industries need to be supported and protected from more advanced competitors until they develop their own capacities to compete.
Government support aimed at achieving sus-tained productivity growth and technological up-grading of products and processes needs to be based on a systematic assessment of the actions needed to address the most binding constraints on domestic manufacturers’ ability to accelerate productivity growth, diversify their production and move up the
technological ladder. Such assessment and the im-plementation of appropriate public policy measures require consultation between public and private sec-tor institutions.
Since the key to productivity growth and up-grading of manufacturing activities lies in sustained capital accumulation, a favourable macroeconomic policy stance and a well-functioning financial system that provides adequate long-term investment are of the utmost importance for the industrialization process and the realization of productivity gains (TDR 2003, chap. IV). Indeed, the deterioration of the macroeconomic and financial environment during the 1980s and 1990s was one, if not the main, reason for the slowdown of manufacturing and productivity growth in many developing countries.
The experiences of successful industrializers demonstrate that the promotion of structural trans-formation requires attention to different sources of growth, including boosting private and public invest-ment, fostering technological progress, strengthening domestic demand and increasing the capacity of domestic producers to meet the exigencies of interna-tional markets. This implies the need for interaction
F. Conclusions

Trade and Development Report, 201690
between several areas of public policy: macroeco-nomic management, financial policies, trade policies, technology policies and public education. Moreover, in order to foster cross-sectoral and cross-regional linkages, output and productivity growth in the primary sector, and thus agricultural policy and the management of rents from mining activities, should not be neglected.
The successful implementation of the 2030 Agenda for Sustainable Development in part rests on the full use of the available policy space for developing countries to expand their manufacturing sectors, accelerate productivity growth and actively support the creation of linkages between the most dynamic subsectors of manufacturing and the rest of their economies.
Notes
1 See for example, Bellofiore and Garibaldo, 2011; TDR 2014.
2 Within different categories of manufacturing, certain technological domains appear to be especially criti-cal for boosting manufacturing productivity, such as mechanical engineering, electricity and electri-cal devices, and information technologies (Nelson, 1993; Hobday, 1998; Bell, 2007; Cimoli et al., 2009).
3 It has been observed that part of the shift of employ-ment and value added from manufacturing to services actually results from the statistical conse-quences of outsourcing: a number of activities (e.g. transport, cleaning and maintenance, design and data processing) previously conducted by employ-ees of manufacturing firms (and as such accounted as manufacturing employment and value added) began to be delivered by separate structures offering services to large manufacturing firms (Dasgupta and Singh, 2006). More generally, complementarities between some services and manufacturing ensured a steady rise in services such as transportation, energy, communications, finance and public social services, which were able to generate “good quality” jobs in terms of productivity and remuneration.
4 This process was described as “negative deindustri-alization”, as opposed to “positive deindustrializa-tion” that occurred in the context of rapid growth and full employment (Rowthorn and Wells, 1987).
5 However, there were already a few countries that had started to show some signs of deindustrialization, along with problems in sustaining labour productiv-ity growth. For instance, countries such as Argentina, Bahrain, the Bolivarian Republic of Venezuela, Ghana, Saudi Arabia and South Africa experienced significant losses of industrial output (and also in
some cases employment) shares with no significant productivity gains in the subsequent decades.
6 These effects can be broadly corroborated with the growing per capita income differences during these decades, especially between the Asian countries, on the one hand, and the Latin American and African countries on the other, which led to a near doubling in the number of least developed countries from 25 in the 1980s to 49 by the 2000s (Ocampo and Vos, 2008).
7 Aggregate labour productivity (ΔP) is decomposed into three components following Timmer et al. (2014): ΔP = Σi (PiT – Pi0) Si0 + Σi (SiT – Si0) Pi0 + Σi (PiT – Pi0) ∗ (SiT – Si0), where Pi is the labour productivity level of sector i, Si is the share of sec-tor i in overall employment, and superscripts 0 and T refer to initial and final years. The first component reflects the changes in productivity within every sec-tor during the period under consideration (“within” factor). The second captures the effects of changing shares of employment in sectors based on the differ-ent productivity levels at the beginning of the period (“between”, static reallocation effect). The third component measures the joint effects of changes in employment shares and sectoral productivity growth (“between”, dynamic reallocation effect); its contribution is positive if employment shifts towards sectors that have rising productivity. It should be noted that the “within” and “between” effects for the whole period normally differ from the averages of the shorter periods, as is particularly evident in the case of Asia. This is because the “within” factor is calculated as the change in productivity per sec-tor times the share of employment in the starting year. For Asia, the long-term calculation is based

The Catch-up Challenge: Industrialization and Structural Change 91
on the situation in 1963, a time when the shares of employment in the sectors with the fastest growth of productivity were smaller. This, in turn, gives more prominence to the “dynamic-between” factor, which captures this structural change. Instead, taking subperiods, there is a higher “within” contribution because these are calculated with different initial employment shares, in which (particularly in Asia) the weight of the dynamic sectors is much higher. For the same reason, the “between-dynamic” is smaller, simply because the structural change over 50 years was larger than in any of its subperiods.
8 UNCTAD secretariat calculations based on Groningen Growth and Development Centre, GGDC-10 Sector Database.
9 See: http://www.uis.unesco.org/DataCentre/Pages/BrowseScience.aspx.
10 Significantly, more egalitarian agrarian relations and rising rural incomes in China, including in Taiwan Province of China, were also very important in ensuring large and dynamic domestic markets for industrial goods before the export push in both these economies.
11 Given the rather large and diverse range of countries in sub-Saharan Africa, in some countries a trend of stalled industrialization is observed, while others seem to be undergoing premature deindustrialization, discussed later.
12 This analysis is based on the Africa Sector Database (of the GGDC 10-Sector Database) that covers 11 sub-Saharan African countries for the period 1960–2010 (see: www.ggdc.net/asd).
13 Gross fixed capital formation in the whole of sub-Saharan Africa fell from an average of 26 per cent of GDP between 1976 and 1981 to only 16 per cent, on average, between 1984 and 2000 before recovering to 21 per cent in 2012–2014 (UNCTADstat).
14 Even countries that managed to maintain very rapid expansion of their manufacturing sector for long periods struggle to reach that critical point. For instance, Botswana’s manufacturing recorded a real average annual growth rate of 11 per cent between 1964 and 2014, but the starting point was so low that its share in GDP did not exceed 7 per cent in 2014.
15 The North African countries considered in table 3.1 (i.e. Egypt, Morocco, Tunisia) and Turkey are exam-ples of economies that attempted to maintain some degree of industrialization but with little structural change to sustain productivity growth. Growth rates were high in the 1970s but subsequently declined, and were subject to boom-bust cycles depending on the conditions of the global economy.
16 The term “premature deindustrialization” seems to have been first used by Wong (1998) when discuss-ing the increasing productivity of the ICT sector in Singapore to avoid reallocation of the labour force to services. UNCTAD (TDR 2003) has applied the term
to some sub-Saharan African and Latin American countries to emphasize the concerns about reduced manufacturing output and employment shares at lower levels of per capita GDP, and low or negative productivity growth. Palma (2005) and Dasgupta and Singh (2006) further conceptualized the term in relation to per capita income levels in developing countries.
17 One exception has been Argentina, where productiv-ity and employment soared during its rapid recov-ery in 2003–2011 (chart 3.4). Thanks to improved macroeconomic conditions, a revival of domestic demand and a competitive exchange rate, the num-ber of firms in the manufacturing sector increased by 42 per cent between 2002 and 2007, following the closure of 19 per cent of them between 1998 and 2002. However, reindustrialization lost steam following the reappearance of balance-of-payment constraints and an economic slowdown in 2008, which has been more pronounced since 2011. The government in place until 2015 applied some defen-sive measures aimed at protecting employment in manufacturing and containing imports of manufac-tures, and also used public procurement policies, central bank credit management and direct funding of high-tech projects to support the manufacturing sector. While these measures were effective in safe-guaring employment and technological capacities, they could not further advance the reindustrialization process (Porta et al., 2016).
18 See Furtado (1971) for Latin America, and Jomo and Rock (1998) for South-East Asia.
19 See also Szirmai and Verspagen, 2015. 20 Reprimarization refers to the increase of primary
commodities’ share in total GDP and/or exports. As discussed in section III.C, such increases in the share of the primary sector have different economic implications when they occur at the expenses of other sectors, and when they result from a more rapid growth of production and/or exports of primary com-modities than in other (also expanding) sectors, as frequently happens during commodity price booms.
21 However, the number of countries dependent on only one commodity declined from 44 to 35 in the same period (based on UNCTADstat).
22 It should be noted that the increase in the share of primary commodity exports resulted mainly from higher commodity prices, and not because other exports performed badly. In regions with high com-modity dependence, such as South America, West Asia and Africa, all categories of exports grew rapidly over this period.
23 A proper assessment of such funds will be possible only over a longer time horizon. So far, their per-formances have been mixed, depending on factors such as having a clear definition of objectives, the existence and adherence to fiscal and investment

Trade and Development Report, 201692
rules, flexibility in adverse circumstances, a clear division of responsibilities, ensuring of transparency and effective oversight (Sharma and Strauss, 2013).
24 For example, Ecuador has devoted part of its hydro-carbon rent to the creation of the “knowledge city” of Yachay, with the aim of creating a technological pole to support economic transformation.
25 See for instance the studies published by the Making the Most of the Commodities Programme, which are available at: http://www.commodities.open.ac.uk/mmcp. See also UNIDO and the Government of the United Republic of Tanzania, 2012; OECD et al.,
2013; ACET, 2014; and African Development Bank and the Bill & Melinda Gates Foundation, 2015.
26 During the construction phase, there is considerable demand for activities with potentially strong domestic ramifications. Industrial policies can help generate a network of domestic supply firms. In Mozambique, for instance, the official agency, Mozlink promoted the use of domestic small and medium-sized enterprises as suppliers of Mozal aluminium. In South Africa, 89 per cent of the mining sector’s spending takes place within the country, providing a market for the local manufacturing and services sectors (Kaplan, 2016).
References
ACET (2014). 2014 African transformation report: Growth with depth. African Center for Economic Trans-formation. Accra.
African Development Bank and the Bill & Melinda Gates Foundation (2015). Delivering on the promise: Leveraging natural resources to accelerate human development in Africa. Available at: http://www.afdb.org/fileadmin/uploads/afdb/Documents/Publications/Delivering_on_the_promise-Leveraging_natu-ral_resources_to_accelerate_human_development_in_Africa.pdf.
Amarase N, Apiatan T and Ariyapruchya K (2013). Thailand’s quest for economic growth: From factor accumulation to creative destruction. Discussion Paper No. 02, Bank of Thailand, Bangkok.
Amsden AH (2001). The Rise of “the Rest”: Challenges to the West from Late-Industrializing Economies. Oxford, Oxford University Press.
Andreoni A and Gregory M. (2013). Why and how does manufacturing still matter: Old rationales, new reali-ties. Revue d’Economie Industrielle, 144(4): 21–57.
Aswicahyono H, Hill H and Narjoko D (2011). Indonesian industrialization: A latecomer adjusting to crises. WIDER Working Paper No. 2011/53, United Nations University-World Institute for Development Economics Research (UNU-WIDER), Helsinki.
Aoun MC and Boulanger Q (2015). The new challenges for oil-based sovereign wealth funds. Note de l’IFRI. French Institute of International Relations (IFRI) and OCP Policy Center, February.
Bell M (2007). Technological learning and the develop-ment of production and innovative capacities in the industry and infrastructure sectors of the least devel-oped countries: What roles for ODA? Background Paper for UNCTAD’s Least Developed Countries Report. United Nations Conference on Trade and Development, Geneva.
Bellofiore R and Garibaldo F (2011). The global crisis and the changing European industrial landscape. International Journal of Management Concepts and Philosophy, 5(3): 273 – 289.
Bhalla AS and Ma Y (1990). Sectoral interdependence in the Chinese economy in a comparative perspective. Applied Economics, 22(8): 1063–1081.
Bosworth BP and Triplett JE (2007). The early 21st cen-tury U.S. productivity expansion is still in services. International Productivity Monitor, 14: 3–19.
Chuenchoksan S and Nakornthab D (2008). Past, present, and prospects for Thailand’s growth: A labor mar-ket perspective. Discussion Paper No. 06, Bank of Thailand, Bangkok.
Cimoli M, Dosi G, Nelson R and Stiglitz JE (2009). Institutions and policies shaping industrial devel-opment: An introductory note. In: Cimoli M, Dosi G and Stiglitz JE, eds. Industrial Policy and Development: The Political Economy of Capabilities Accumulation. New York, Oxford University Press: 19−38.
Cornwall J (1977). Modern Capitalism: Its Growth and Transformation. London, Martin Robertson.

The Catch-up Challenge: Industrialization and Structural Change 93
Cruz M (2015). Premature de-industrialisation: Theory, evidence and policy recommendations in the Mexican case. Cambridge Journal of Economics, 39(1): 113–137.
Dahlman CJ (1979). The problem of externality. Journal of Law and Economics, 22(1): 141−162.
Dasgupta S and Singh A (2005). Will services be the new engine of Indian economic growth? Development and Change, 36 (6): 1035–1057.
Dasgupta S and Singh A (2006). Manufacturing, services and premature deindustrialization in developing countries: A Kaldorian analysis. Research Paper No. 2006/49, United Nations University – World Institute for Development Economics Research (UNU-WIDER), Helsinki.
de Vries G J, Timmer M and de Vries K (2015). Structural transformation in Africa: Static gains, dynamic loss-es. Journal of Development Studies, 51(6): 674−688.
DiMeglio G, Gallego J, Maroto A and Savona M (2015). Services in Developing Economies: A new chance for catching-up? Working Paper Series No. 2015-32, Science Policy Research Unit (SPRU), University of Sussex, Brighton.
Felipe J, Mehta A and Changyong R (2014). Manufacturing matters…but it’s the jobs that count. Economics Working Paper Series No. 420. Asian Development Bank, Manila.
Furtado C (1971). La Economía Latinoamericana: Formación Histórica y Problemas Contemporáneos. Mexico, DF, Siglo XXI Editores SA.
Gerschenkron A (1962). Economic Backwardness in Historical Perspective. Cambridge, MA, Harvard University Press.
Ghosh J (2015). Growth, industrialization and inequal-ity in India. Journal of the Asia Pacific Economy, 20(1): 42−56.
Hansda SK (2005). Sustainability of services-led growth: An input output exploration of the Indian economy. Available at http://econwpa.repec.org/eps/ge/papers/0512/0512009.pdf.
Hirschman AO (1958). The Strategy of Economic Development. New Haven, CT, Yale University Press.
Hirschman AO (1986). Vers une économie politique élar-gie. Paris, Editions de Minuit.
Hobday M (1998). Latecomer catch-up strategies in elec-tronics: Samsung of Korea and ACER of Taiwan. In: Rowley C and Johngseok B, eds. Korean Businesses: Internal and External Industrialization. London, Frank Cass: 48–83.
IMF (2015). World Economic Outlook: Uneven Growth – Short- and Long-Term Factors. Washington, DC.
Inklaar R and Timmer MP (2008). GGDC productivity level database: International comparisons of out-put, inputs and productivity at the industry level. Research Memorandum No. GD-104. Groningen Growth and Development Centre, Groningen.
Jomo KS and Rock M (1998). Economic diversification and primary commodity processing in the second-tier
South-East Asian newly industrializing countries. Discussion Papers, No 136, UNCTAD, Geneva.
Kaldor N (1957). A model of economic growth. The Economic Journal, 67(268): 591–624.
Kaldor N (1958). Monetary policy, economic stability and growth, Memorandum submitted to the Committee on the Working of the Monetary System, June 23. Reprinted in: Kaldor N (1964), Essays on Economic Policy, Volume I, London, Gerald Duckworth & Company Limited: 128–153.
Kaldor N (1966). Causes of the Slow Rate of Economic Growth in the United Kingdom. Cambridge, Cambridge University Press.
Kannan KP and Raveendran G (2009). Growth sans employment: A quarter century of jobless growth in India’s organised manufacturing. Economic and Political Weekly, 44(10): 80−91.
Kaplan D (2016). Linkage dynamics and natural resources: Diversification and catch-up. In: Gehl Sampath P and Oyelaran-Oyeyinka B, eds. Sustainable Industrialization in Africa: Towards a New Development Agenda. London, Palgrave Macmillan: 66−84.
Klyuev V (2015). Structural transformation: How does Thailand compare? Working Paper No. 15/51, International Monetary Fund, Washington, DC.
Kotwal A, Ramaswami B and Wadhwa W (2011). Economic liberalization and Indian economic growth: What’s the evidence? Journal of Economic Literature, 49(4): 1152−1199.
Kuznets S (1973). Modern economic growth: Findings and reflections. The American Economic Review, 63(3): 247−258.
Lall S (1992). Technological capabilities and industrializa-tion. World Development, 20(2): 165−186.
Lall S (2003). Reinventing industrial strategy: The role of government policy in building industrial competi-tiveness. QEH Working Papers No. 111, University of Oxford, Oxford.
Lathapipat D and Chucherd T (2013). Labor market func-tioning and Thailand’s competitiveness. Discussion Paper No. 03, Bank of Thailand, Bangkok.
Lee K (2013). Schumpeterian Analysis of Economic Catch-Up: Knowledge, Path-Creation and the Middle-Income Trap. Cambridge, Cambridge University Press.
Lee J, Bae ZT and Choi DK (1988). Technology devel-opment processes: A model for a developing country with a global perspective. Research and Development Management, 18(3): 235−250.
List F (1856). National System of Political Economy. Philadelphia, PA, J.B. Lippincott & Co.
Malerba F (2002). Sectoral systems of innovation and production. Research Policy, 31(2): 247−264.
Moreno-Brid JC and Ros J (2009). Development and Growth of the Mexican Economy: A Historical Perspective. New York, Oxford University Press.
Moreno-Brid JC, Santamaría J and Riva Valdivia JC (2005). Industrialization and economic growth in

Trade and Development Report, 201694
Mexico after NAFTA: The road travelled. Develop-ment and Change, 36(6): 1095–1119.
Myrdal G (1957). Economic Theory and Underdeveloped Regions. London, Methuen.
Nelson RR (1993). National Innovation Systems: A Comparative Analysis. Oxford, Oxford University Press.
Nelson RR and Winter SG (1973). Towards an evolution-ary theory of economic capabilities. The American Economic Review, 63(2): 440−449.
Nübler I (2014). A theory of capabilities for productive transformation: Learning to catch up. In: Salazar-Xirinachs JM, Nübler I, Kozul-Wright R, eds. Transforming Economies: Making Industrial Policy Work for Growth, Jobs and Development. Geneva, International Labour Office: 113–149.
Ocampo JA and Vos R (2008). Uneven Economic Development. London, Zed Books.
OECD (2005). Growth in services: Fostering employ-ment, productivity and innovation. OECD Digital Economy Papers No. 94. Available at: http://www.oecd.org/general/34749412.pdf.
OECD (2012). Industrial Policy and Territorial Develop -ment: Lessons from Korea. Paris, OECD Development Centre.
OECD, African Development Bank, United Nations Economic Commission for Africa and the United Nations Development Programme (2013). Africa Economic Outlook 2013: Structural Transformation and Natural Resources. Paris, OECD Publishing.
Palma JG (2005). Four sources of “de-industrialization” and a new concept of the “Dutch Disease”. In: Ocampo JA, ed. Beyond Reforms: Structural Dynamics and Macroeconomic Vulnerability. Palo Alto, CA, Stanford University Press, and Washington, DC, World Bank and ECLAC: 71−117.
Palma JG (2008). De-industrialization, ‘premature’ de-industrialization and the Dutch disease. In: Durlauf SN and Blume LE, eds. The New Palgrave Dictionary of Economics Second Edition. London, Palgrave Macmillan: 401–410.
Palma JG (2011). Why has productivity growth stagnated in most Latin American countries since the neo-liberal reforms? In: Ocampo JA and Ros J, eds. The Oxford Handbook of Latin American Economics. New York, Oxford University Press: 568–607.
Patnaik P (2003). On the economics of “open economy” de-industrialization. V.V. Giri Memorial Lecture. Available at: http://www.networkideas.org/featart/nov2003/Open_Economy.pdf.
Pegels A and Becker B (2014). Implementing green industrial policy. In: Pegels A, ed. Green Industrial Policy in Emerging Countries, London and New York, Routledge: 38−68.
Porta F, Santarcángelo J and Schteingart D (2016). Industrial policy in Argentina, Brazil, Chile and Mexico: A comparative approach. Background paper
for UNCTAD’s Trade and Development Report, 2016. Geneva. Unpublished.
Prebisch (1964). Towards a New Trade Policy for Develop-ment. Report by the Secretary-General of the United Nations Conference on Trade and Development. United Nations Publications. Sales No. 64.II.B.4. New York.
Raj K (1975). Measurement of the direct and indirect employment linkages of agricultural growth with technical change. In: Heady EO and Whiting LR, eds. Externalities in the Transformation of Agriculture: Distribution of Benefits and Costs from Development. Ames, Iowa State University Press: 305–327.
Ramaswamy R and Rowthorn RE (1997). Deindustrialization: Causes and implications. In: Staff studies for the World Economic Outlook. Washington, DC, International Monetary Fund: 61–77.
Ramdoo I and Bilal S (2014). Extractive resources for development: Trade, fiscal and industrial considera-tions. Discussion Paper No. 156, European Centre for Development Policy Management, Maastricht.
Rodrik D (2004). Industrial policy for the twenty-first century. Discussion Paper No. 4767, Centre for Economic Policy Research, London.
Rodrik D (2014). An African growth miracle? Working Paper No. 20188, National Bureau of Economic Research, Cambridge, MA.
Rodrik D (2015). Premature deindustrialization. Working Paper No. 20935, National Bureau of Economic Research, Cambridge, MA.
Rowthorn RE and Wells JR (1987). De-industrialization and Foreign Trade. Cambridge, Cambridge University Press.
Saéz S, McKenna M and Hoffman B (2015).Valuing Trade in Services in Africa. In: World Economic Forum, World Bank, African Development Bank, Organisation for Economic Co-operation and Development. The Africa Competitiveness Report 2015. Geneva, World Economic Forum: 53–69.
Schumpeter JA (1961). The Theory of Economic Develop-ment: An Inquiry into Profits, Capital, Credit, Interest and the Business Cycle. Oxford, Oxford University Press.
Sharma N and Strauss T (2013). Special fiscal institutions for resource-rich developing economies: The state of the debate and implications for policy and practice. Research Report. Overseas Development Institute, London.
Studwell J (2013). How Asia Works: Success and Failure in the World’s Most Dynamic Region. New York, Grove Press.
Szirmai A and Verspagen B (2015). Manufacturing and eco-nomic growth in developing countries, 1950–2005. Structural Change and Economic Dynamics, 34: 46–59.
Timmer MP and de Vries GJ (2009). Structural change and growth accelerations in Asia and Latin America: A new sectoral data set. Cliometrica, 3(2): 165–190.

The Catch-up Challenge: Industrialization and Structural Change 95
Timmer MP, de Vries G and de Vries K (2014). Patterns of structural change in developing countries. Research memorandum No. 149, Groningen Growth and Development Centre, Groningen.
Tregenna F (2008). Sectoral engines of growth in South Africa: An analysis of services and manufactur-ing. Research Paper No. 2008/98, United Nations University – World Institute for Development Economics Research (UNU-WIDER), Helsinki.
Tregenna F (2015). Deindustrialisation, structural change and sustainable economic growth. Working Paper No. 32/2015, United Nations Industrial Development Organization (UNIDO), Vienna.
UNCTAD (2015a). The Least Developed Countries Report 2015: Transforming Rural Economies. United Nations Publication. Sales No. E.15.II.D.7, New York and Geneva.
UNCTAD (2015b). Economic Development in Africa Report 2015: Unlocking the Potential of Africa’s Services Trade for Growth and Development. United Nations Publication. Sales No. E.15.II.D.2. New York and Geneva.
UNCTAD (TDR 1995). Trade and Development Report, 1995. United Nations publication. Sales No. E.95.II.D.16. New York and Geneva.
UNCTAD (TDR 2002). Trade and Development Report, 2002: Global Trends and Prospects, Developing Countries in World Trade. United Nations publica-tion. Sales No. E.02.II.D.2. New York and Geneva.
UNCTAD (TDR 2003). Trade and Development Report, 2003: Capital Accumulation, Growth and Structural Change. United Nations publication. Sales No. E.03.II.D.7. New York and Geneva.
UNCTAD (TDR 2005). Trade and Development Report, 2005: New Features of Global Interdependence. United Nations publication. Sales No. E.05.II.D.13. New York and Geneva.
UNCTAD (TDR 2008). Trade and Development Report, 2008: Adjusting to the Changing Dynamics of the
World Economy. United Nations publication. Sales No. E.08.II.D.21. New York and Geneva.
UNCTAD (TDR 2014). Trade and Development Report, 2014: Global Governance and Policy Space for Development. United Nations publication. Sales No. E.14.II.D.4. New York and Geneva.
UNECA and African Union (2013). Economic report on Africa 2013: Making the most of Africa’s com-modities- Industrializing for growth, jobs and eco-nomic transformation. Addis Ababa, United Nations Economic Commission for Africa.
UNIDO and Government of the United Republic of Tanzania (2012). Tanzania industrial competi-tiveness report 2012. United Nations Industrial Development Organization, Vienna.
UNIDO (2009). Structural change and productivity growth: A review of implications for developing countries. Working Paper No. 08/2009, United Nations Industrial Development Organization, Vienna.
UNIDO (2012). Promoting industrial diversification in resource-intensive economies: The experi-ences of Sub-Saharan Africa and Central Asia Regions. United Nations Industrial Development Organization, Vienna.
UNIDO (2013). The Industrial Competitiveness of Nations: Looking back, forging ahead. Competitive Industrial Performance Report 2012/2013. United Nations Industrial Development Organization, Vienna.
Wong T (1998). Information technology and development in Singapore and its geographical effects. In: Tan FB, Corbet PS and Wong Y, eds. Information Technology Diffusion in the Asia Pacific: Perspectives on Policy, Electronic Commerce and Education. Hershey, PA, and London, Idea Group Publishing: 101–113.
World Bank (2012). China 2030: Building a Modern, Harmonious and Creative Society. Washington, DC, World Bank and Development Research Center of the State Council, People’s Republic of China.