CHAPTER III PRIMARY SCHOOLING IN WEST BENGAL AND KOLKATA...
20
CHAPTER III PRIMARY SCHOOLING IN WEST BENGAL AND KOLKATA Introduction This chapter provides a brief description of the state of West Bengal and the condition of primary education in the state. Additionally, a broad overview of primary education in the state and in Kolkata, where the study is conducted, is the scope of this chapter. Geographically, the state of West Bengal has an area of 88, 752 sq. kilometres. There are 21 districts divided into 339 administrative blocks, in which there are a total of37,910 villages. The total population of8,02,21,-171 or roughly 80.22 million (according to 2001 Census) makes West Bengal the fourth largest state in India in terms of population. 72 per cent of this population lives in villages and 23.6 percent of this population is Scheduled Castes and 5.6 per cent are Scheduled Tribes (Census 2001). A high-density population (904 persons/sq. km), fairly high population growth rate (a decadal population growth of 17.84 per cent), and a steadily growing process of urbanization are some of the other characteristic demographic features of the state. The state has a work participation rate of 36.8 per cent, with close to 29 million persons contributing to the worktorce. Cultivators and agricultural labourers (19.2 per cent and 25.0 percent respectively) make up 44.2 per cent of the total working population, the remaining 55.8 per cent consisting of people working in household industries and miscellaneous occupations (Census 2001). Linguistic diversity is another prevalent characteristic of this state. 98 per cent of the population speak in one or more of the five languages namely Bengali, Hindi, Santhali, Urdu and Nepali (West Bengal2002: 2). West Bengal has a literacy rate of 69.22 per cent. 77.58 of the literate population are men and 60.22 per cent women. The literacy rate evidently is still far short of 1 00 per cent literacy, but according to the census data, the proportion of literates in the population of West Bengal has always been higher then the con:esponding fi!,TUre for India (Ramachndran et al. 2003:7). The Total literacy Campaign (TLC) has been one of the major initiatives in this respect, 61
Transcript of CHAPTER III PRIMARY SCHOOLING IN WEST BENGAL AND KOLKATA...

CHAPTER III
PRIMARY SCHOOLING IN WEST BENGAL AND KOLKATA
Introduction
This chapter provides a brief description of the state of West Bengal and
the condition of primary education in the state. Additionally, a broad overview
of primary education in the state and in Kolkata, where the study is conducted,
is the scope of this chapter.
Geographically, the state of West Bengal has an area of 88, 752 sq.
kilometres. There are 21 districts divided into 339 administrative blocks, in
which there are a total of37,910 villages. The total population of8,02,21,-171 or
roughly 80.22 million (according to 2001 Census) makes West Bengal the
fourth largest state in India in terms of population. 72 per cent of this population
lives in villages and 23.6 percent of this population is Scheduled Castes and 5.6
per cent are Scheduled Tribes (Census 2001). A high-density population (904
persons/sq. km), fairly high population growth rate (a decadal population
growth of 17.84 per cent), and a steadily growing process of urbanization are
some of the other characteristic demographic features of the state. The state has
a work participation rate of 36.8 per cent, with close to 29 million persons
contributing to the worktorce. Cultivators and agricultural labourers (19.2 per
cent and 25.0 percent respectively) make up 44.2 per cent of the total working
population, the remaining 55.8 per cent consisting of people working in
household industries and miscellaneous occupations (Census 2001). Linguistic
diversity is another prevalent characteristic of this state. 98 per cent of the
population speak in one or more of the five languages namely Bengali, Hindi,
Santhali, Urdu and Nepali (West Bengal2002: 2).
West Bengal has a literacy rate of 69.22 per cent. 77.58 of the literate
population are men and 60.22 per cent women. The literacy rate evidently is
still far short of 1 00 per cent literacy, but according to the census data, the
proportion of literates in the population of West Bengal has always been higher
then the con:esponding fi!,TUre for India (Ramachndran et al. 2003:7). The Total
literacy Campaign (TLC) has been one of the major initiatives in this respect,
61
bringing an additional 6.6 million people into basic literacy since its launch in
1989 (Theobald and Charaborty 1996:2). Apart from the TLC, other mass
literacy campaif,TilS like the Post Literacy Programme (PLC) and the Continuing
Education Programme (CEP) are implemented being implemented in seven
districts of the state which has resulted in an increase of 11.52 per cent of
literate persons between 1991 to 2001 (West Bengal2002: 5).
In West Bengal the percentage of expenditure towards education is
23.73 per cent of the total budgeted expenditure of the state, and it ranks ih
among all the states and UTs in this respect (India 2002-03: 17). However, the
relationship between financial investment in education and number of children
enrolled in schools is worth noting. The World Bank Report on attaining the
Millenium Development Goals in India (2004), that looks at inter-state
increases in elementary enrolments over 1980-81 to 1999-2000 relative to the
growth of per child public spending over the same period, reveal that over the
years, during 1980-1999, West Bengal ranked seventh from the bottom out of
all the states, with respect to the number of additional students enrolled in
primary school per million additional rupees worth government expenditure on
elementary schooling. The situation does not seem to improve over the years. In
fact, the number of enrolled children in primary schoois in 2002-03 has
decreased in comparison to 2001-02. While the total number of children
enrolled in primary schools in 2001-02 was 1,01,51 ,362, in the year 2003-03 it
is 97,74,543 (India 2002-03), despite an increase in government spending on
education.
This is in contrast to other initially poor, low-enrolled states like
Madhya Pradesh and Rajasthan, which were able to enrol large numbers of
children in primary education with relatively small increases in public spending
on elementary education (World Bank 2004:76). The explanation for this as
provided in the report is that the launch of beneficial education schemes like
Education Guarantee Scheme in Madhya Pradesh, expanded the number of
schools especially in rural areas, at a relatively low cost, while such education
schemes were lacking in West Bengal, along with poor states like Bihar and
Uttar Pradesh. This resulted in lacunae within provisioning of education that
62
once again, reflected on the enrolm~nt status. Also, the fact that at present the
state has a significantly high rate of household expenditure on education, which
is 61.54 per cent to the total government expenditure (India 2002-03: 18), shows
that in West Bengal, individual spending on education is more than public
spending due to lack of adequate educational provisions in the schools.
The primary schools in West Bengal are either run by the governrnent,
or by private bodies with the governrnent grants and aid. These private bodies
include affluent patrons, local bodies like community clubs and elected bodies
like panchayats. A number of schools are also missionary schools run by
Christian priests or nuns. Organisations like Ramakrishna Mission, Chinrnaya
Mission and Missionaries of Charity also run schools in the state. The Left
Front Coalition government that is in power in the state and has been so since
1977, introduced the Education Policy of 1977 that contained several directives
that have since then been incorporated in the contemporary primary education
system. Free and compulsory education for all up to the elementary stage,
supply of free textbooks, paper, stationery and other contingencies to students
till class VIII, provision for mid-day meals till class IV and democratisation of
administrative bodies with representation of students and staff are some of the
policy measures that were expressed in the Education Policy of 1977 (Theooald
and Chakrabot1y 1996).
Between 1977 and 1992 there was an expansion m the number of
schools with the average distance between schools and living settlements being
reduced across the state (Wesst Bengal 1992). Free schooling till class IV with
provision of free textbooks to all students and free uniforms to girls till class IV,
opening of new schools with special focus on Dalit and Adivasi-inhabited areas,
increasing number of teacher appointments and improving of employment
conditions of teachers are some of the other salient features of the progress of
primary education till 1992 (Ramachandran et al. 2003). Though non-formal
education had been closed down in the state, other cost-effective methods of
alternative schooling have been adopted by opening of 'Shishu Shikhsha
Kendras' or SSKs, child education centres which are set up in any habitation
that has twenty or more children who do not access schooling. In terms of
63
providing students with education, some have stated that SSKs are more
effective than fonnal schools (Pratichi Education Report 2002), while others
point out flaws in the quality of teaching, which they claim is no different, or
sometimes worse, than fonnal schools (Rampal 2004: 48). The fact that SSKs
are being treated as alternatives to fonnal primary schooling rather than as
short-tenn measures for providing educational access is also a matter of concern
(Rampal 2004: 49)
Primary education in West Bengal is free for all children from the age
group 5-9. The primary schools are sometimes attached to secondary and
higher secondary schools. In addition to Bengali, four other languages are
recognised as media of instruction. They are Hindi, Urdu, Nepali and Oriya.
English is the second language that is introduced in class III (sometimes, even
in class II) and continues till class X. There is an external evaluation process
that takes place in standard II in which teachers from one school visit and
evaluate the learning achievement of the students in another school. This
external evaluation consists of both written and oral examinations. Besides this
external evaluation, the state follows a no-detention policy when it comes to
student evaluation from classes I-IV. The researcher's field experience has
shown, however, that an internal system of evaluation and assessment exists
from classes I-IV in some primary schools, especially schools under private
management. Also, as mentioned in the next chapter, students are sometimes
even detained in their final examinations if they are considered to be beneath
the minimum learning level of their class.
The West Bengal Board of Primary Education (WBBPE) was
established in I 973 but became operational only in 1990. It is responsible for
the management of primary education in West Bengal. It is a statutory body
comprising of elected representatives that advises the state government in all
matters relating to primary education. The WBBPE works through a number of
committees (Curriculum, Evaluation, Development and Finance) with
representatives from the Directorate of School Education, teachers, teacher
trainers, and Members of Parliament elected from the state. It supervises and
monitors school-related issues with respect to cuniculum, printing, publishing
64
and distribution of textbooks and other teaching aids, teacher transfers and
teacher training, and also recommending ofbudget estimates of District primary
School Councils to the Director of School Education (Theobald and
Chakraborty 1996: 36).
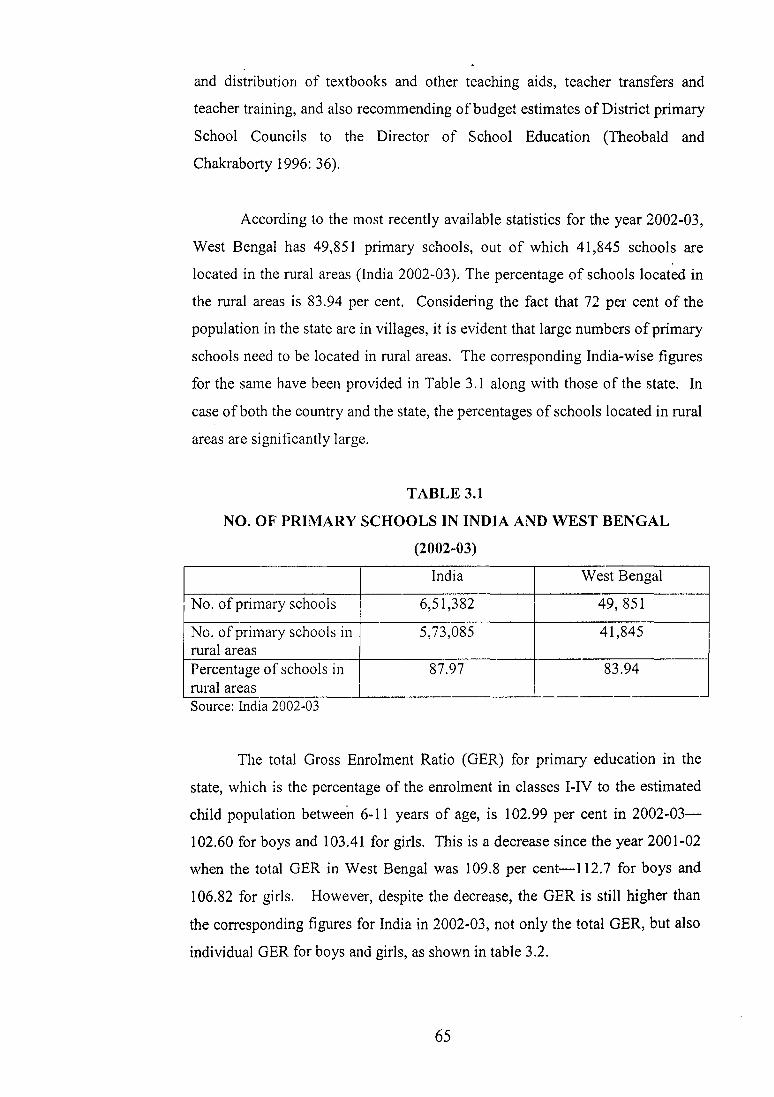
According to the most recently available statistics for the year 2002-03,
West Bengal has 49,851 primary schools, out of which 41,845 schools are
located in the rural areas (India 2002-03). The percentage of schools located in
the rural areas is 83.94 per cent. Considering the fact that 72 per cent of the
population in the state are in villages, it is evident that large numbers of primary
schools need to be located in rural areas. The corresponding India-wise figures
for the same have been provided in Table 3.1 along with those of the state. In
case of both the country and the state, the percentages of schools located in rural
areas are significantly large.
TABLE 3.1
NO. OF PRIMARY SCHOOLS IN INDIA AND WEST BENGAL
(2002-03)
India West Bengal
No. of primary schools 6,51,382 49,851
No. of primary schools in 5,73,085 41,845 rural areas Percentage of schools in 87.97 83.94 rural areas Source: India 2002-03
The total Gross Enrolment Ratio (GER) for primary education in the
state, which is the percentage of the enrolment in classes I-IV to the estimated
child population between 6-11 years of age, is 1 02.99 per cent in 2002-03-
102.60 for boys and 103.41 for girls. This is a decrease since the year 2001-02
when the total GER in West Bengal was 109.8 per cent-112.7 for boys and
106.82 for girls. However, despite the decrease, the GER is still higher than
the corresponding figures for India in 2002-03, not only the total GER, but also
individual GER for boys and girls, as shown in table 3.2.
65
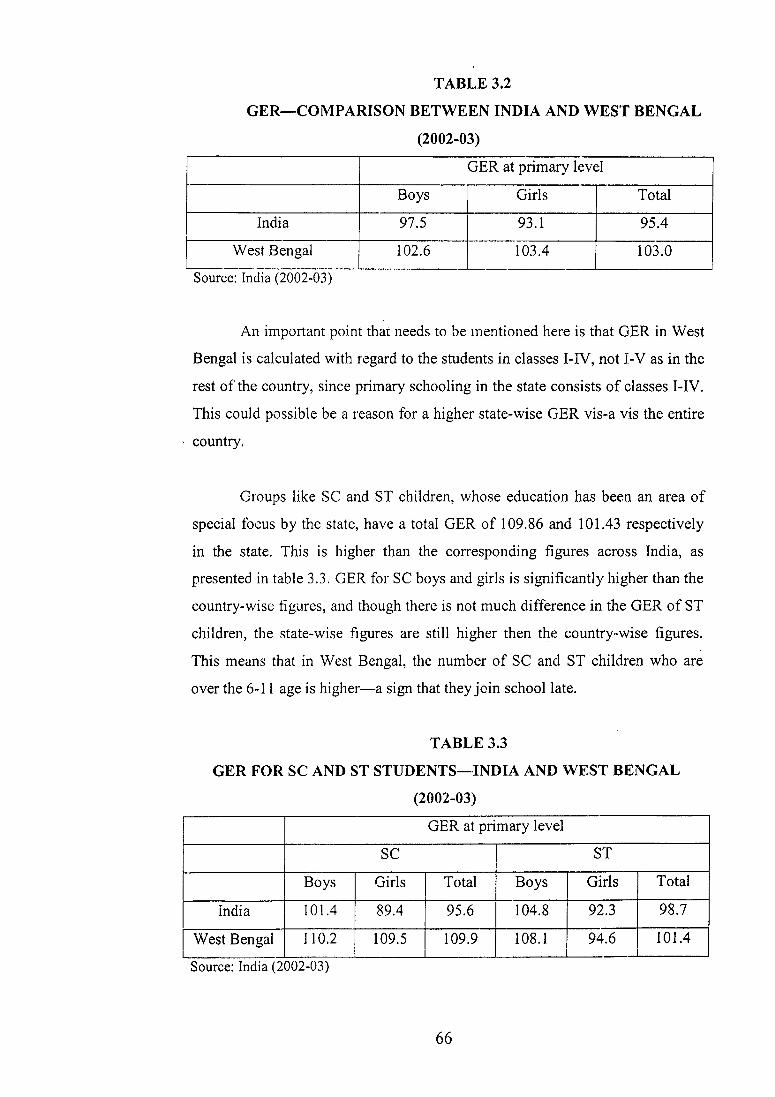
TABLE 3.2
GER-COMPARISON BETWEEN INDIA AND WEST BENGAL
(2002-03)
GER at primary level
Boys Girls Total
India 97.5 93.1 95.4
L. Wes~ Bengal 102.6 103.4 103.0
Source: Ind1a (2002-03)
An important point that needs to be mentioned here is that GER in West
Bengal is calculated with regard to the students in classes I-IV, not I-V as in the
rest of the country, since primary schooling in the state consists of classes I-IV.
This could possible be a reason for a higher state-wise GER vis-a vis the entire
, country.
Groups like SC and ST children, whose education has been an area of
special focus by the state, have a total GER of 109.86 and 101.43 respectively
in the state. This is higher than the corresponding figures across India, as
presented in table 3.3. GER for SC boys and girls is significantly higher than the
country-wise figures, and though there is not much difference in the GER of ST
children, the state-wise figures are still higher then the country-wise figures.
This means that in West Bengal, the number of SC and ST children who are
over the 6-11 age is higher-a sign that they join school late.
TABLE3.3
GER FOR SC AND ST STUDENTS-INDIA AND WEST BENGAL
(2002-03)
GER at primary level
sc ST
Boys Girls Total Boys Girls Total
India 101.4 89.4 95.6 104.8 92.3 98.7
West Bengal 110.2 109.5 109.9 108.1 94.6 101.4
Source: India (2002-03)
66
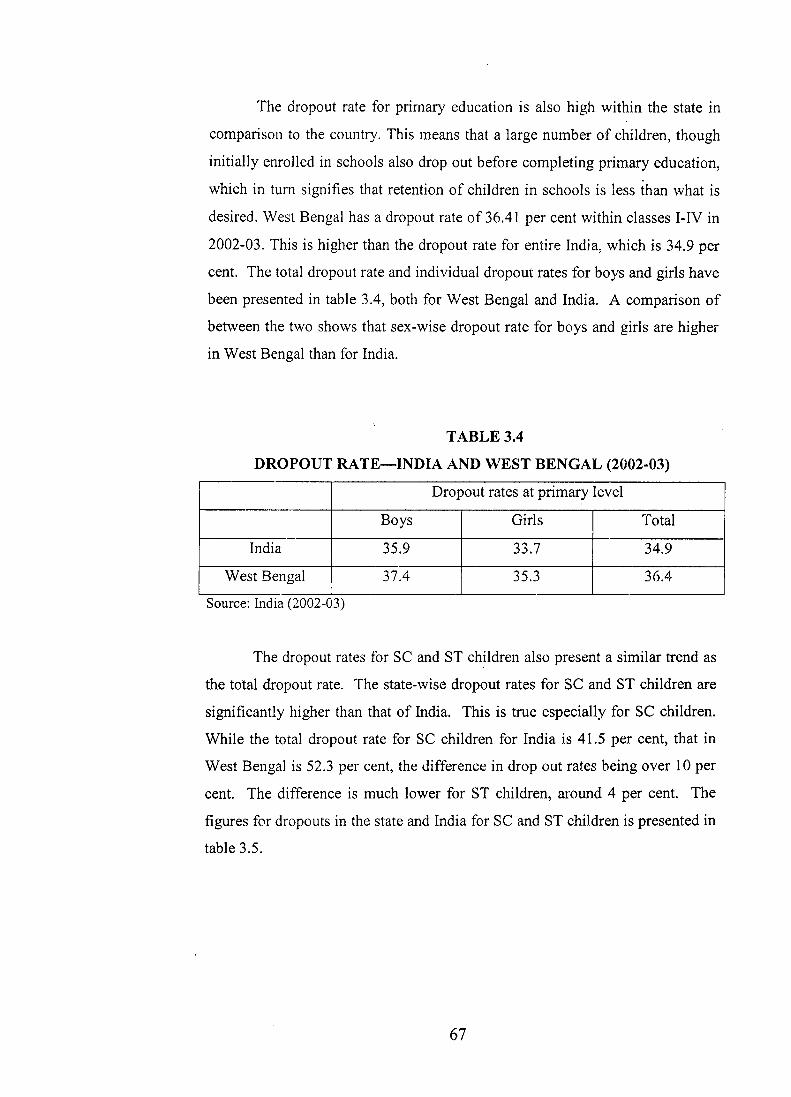
The dropout rate for primary education is also high within the state in
comparison to the country. This means that a large number of children, though
initially enrolled in schools also drop out before completing primary education,
which in tum signifies that retention of children in schools is less than what is
desired. West Bengal has a dropout rate of36.41 per cent within classes I-IV in
2002-03. This is higher than the dropout rate for entire India, which is 34.9 per
cent. The total dropout rate and individual dropout rates for boys and girls have
been presented in table 3.4, both for West Bengal and India. A comparison of
between the two shows that sex-wise dropout rate for boys and girls are higher
in West Bengal than for India.
TABLE3.4
DROPOUT RATE-INDIA AND WEST BENGAL (2002-03)
Dropout rates at primary level
Boys Girls Total
India 35.9 33.7 34.9
West Bengal 37.4 35.3 36.4
Source: lndta (2002-03)
The dropout rates for SC and ST children also present a similar trend as
the total dropout rate. The state-wise dropout rates for SC and ST children are
significantly higher than that of India. This is true especially for SC children.
While the total dropout rate for SC children for India is 41.5 per cent, that in
West Bengal is 52.3 per cent, the difference in drop out rates being over 10 per
cent. The difference is much lower for ST children, around 4 per cent. The
figures for dropouts in the state and India for SC and ST children is presented in
table 3.5.
67
TABLE 3.5
DROPOUT RATES FOR SC AND ST-INDIA AND WEST BENGAL
(2002-03)
Dropout rates at primary level
sc ST
Boys Girls Total Boys Girls Total
India 41.1 41.9 41.5 50.8 52.1 51.4
West Bengal 50.3 54.8 52.3 54.0 59.3 55.5
Source: India (2002-03)
In terms of facilities provided in schools, West Bengal seems to be
lagging considerably in comparison to all India average. The most recent
information available so far regarding basic schooling facilities in primary
schools appears in the Sixth All India Educational Survey (NCERT 1999). In
the subsequent tables (table 3.6 and 3.7), information has been presented
regarding school buildings, toilet and drinking water facilities provided in
primary schools respectively.
According to the NCERT survey, school buildings in several areas are
still not pucca and schools are held in partially pucca, kachcha building or
sometimes even in tents or open spaces: In India as well as in West Bengal.
The schooling infrastructure, especially at the primary level, often does not
meet even the basic criteria of quality education. In West Bengal only around
37 per cent school buildings are wholly pucca in comparison to the nation-wide
figures of around 65 per cent. The percentage of schools that are partially
pucca or kachcha is also higher in West Bengal in comparison to the country.
While in West Bengal, around 37 per cent of the buildings are partially pucca
and 20 per cent of them are completely kachcha, the corresponding figures are
around 19 per cent and 9 per cent for India. The percentage of schools in tents
or open spaces is fairly the same percentage in the state as well for India. The
India-wise and state-wise figures for school buildings in 1993 have been
presented in Table 3.6.
68
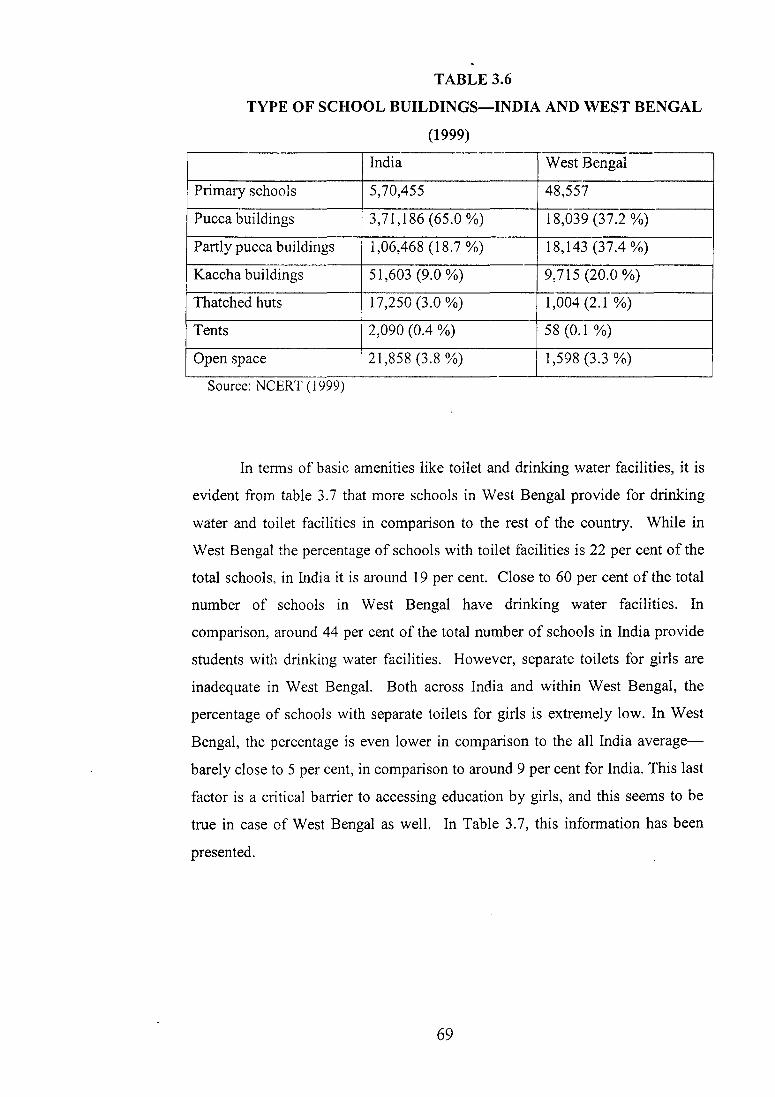
TABLE 3.6
TYPE OF SCHOOL BUILDINGS-INDIA AND WEST BENGAL
(1999) -----
India West Bengal
Primary schools 5,70,455 48,557 -
Pucca buildings 3,71,186 (65.0 %) 18,039 (37.2 %)
Partly pucca buildings 1,06,468 (18.7 %) 18,143 (37.4 %)
Kaccha buildings 51,603 (9.0 %) 9,715 (20.0 %)
Thatched huts 17,250 (3.0 %) 1,004 (2.1 %)
Tents 2,090 (0.4 %) 58 (0.1 %)
Open space 21,858 (3.8 %) 1,598 (3.3 %)
Source: NCERT (1999)
In terms of basic amenities like toilet and drinking water facilities, it is
evident from table 3.7 that more schools in West Bengal provide for drinking
water and toilet facilities in comparison to the rest of the country. While in
West Bengal the percentage of schools with toilet facilities is 22 per cent of the
total schools, in India it is around 19 per cent. Close to 60 per cent of the total
number of schools in West Bengal have drinking water facilities. In
comparison, around 44 per cent of the total number of schools in India provide
students with drinking water facilities. However, separate toilets for girls are
inadequate in West Bengal. Both across India and within West Bengal, the
percentage of schools with separate toilets for girls is extremely low. In West
Bengal, the percentage is even lower in comparison to the all India average-
barely close to 5 per cent, in comparison to around 9 per cent for India. This last
factor is a critical barrier to accessing education by girls, and this seems to be
true in case of West Bengal as well. In Table 3.7, this information has been
presented.
69
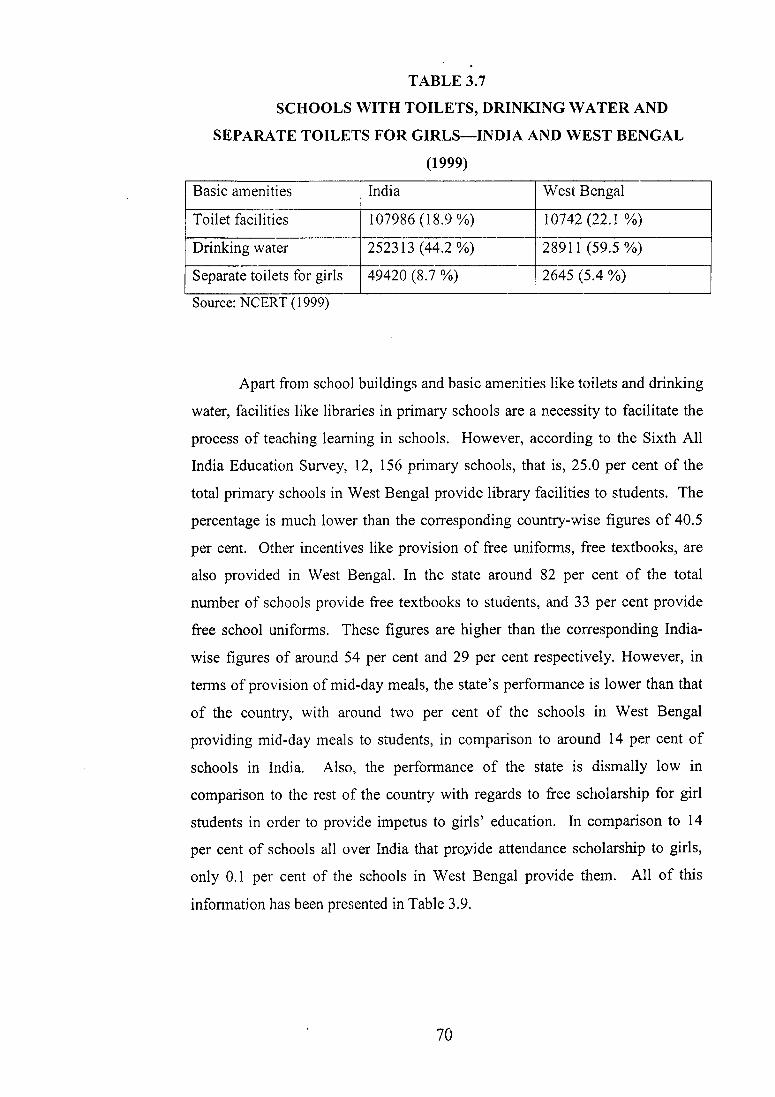
TABLE 3.7
SCHOOLS WITH TOILETS, DRINKING \VATER AND
SEPARATE TOILETS FOR GIRLS-INDIA AND WEST BENGAL
(1999)
Basic amenities India West Bengal
Toilet facilities 107986 (18.9 %) 10742 (22.1 %)
Drinking water 252313 (44.2 %) 28911 (59.5 %)
Separate toilets for girls 49420 (8.7 %) 2645 (5.4 %)
Source: NCERT ( 1999)
Apart from school buildings and basic amenities Eke toilets and drinking
water, facilities like libraries in primary schools are a necessity to facilitate the
process of teaching learning in schools. However, according to the Sixth All
India Education Survey, 12, 156 primary schools, that is, 25.0 per cent of the
total primary schools in West Bengal provide library facilities to students. The
percentage is much lower than the corresponding country-wise figures of 40.5
per cent. Other incentives like provision of free uniforms, free textbooks, are
also provided in West Bengal. In the state around 82 per cent of the total
number of schools provide free textbooks to students, and 33 per cent provide
free school uniforms. These figures are higher than the corresponding India
wise figures of around 54 per cent and 29 per cent respectively. However, in
terms of provision of mid-day meals, the state's performance is lower than that
of the country, with around two per cent of the schools in West Bengal
providing mid-day meals to students, in comparison to around 14 per cent of
schools in India. Also, the performance of the state is dismally low in
comparison to the rest of the country with regards to free scholarship for girl
students in crder to provide impetus to girls' education. In comparison to 14
per cent of schools all over India that prqyide attendance scholarship to girls,
only 0.1 per cent of the schools in West Bengal provide them. All of this
information has been presented in Table 3.9.
70
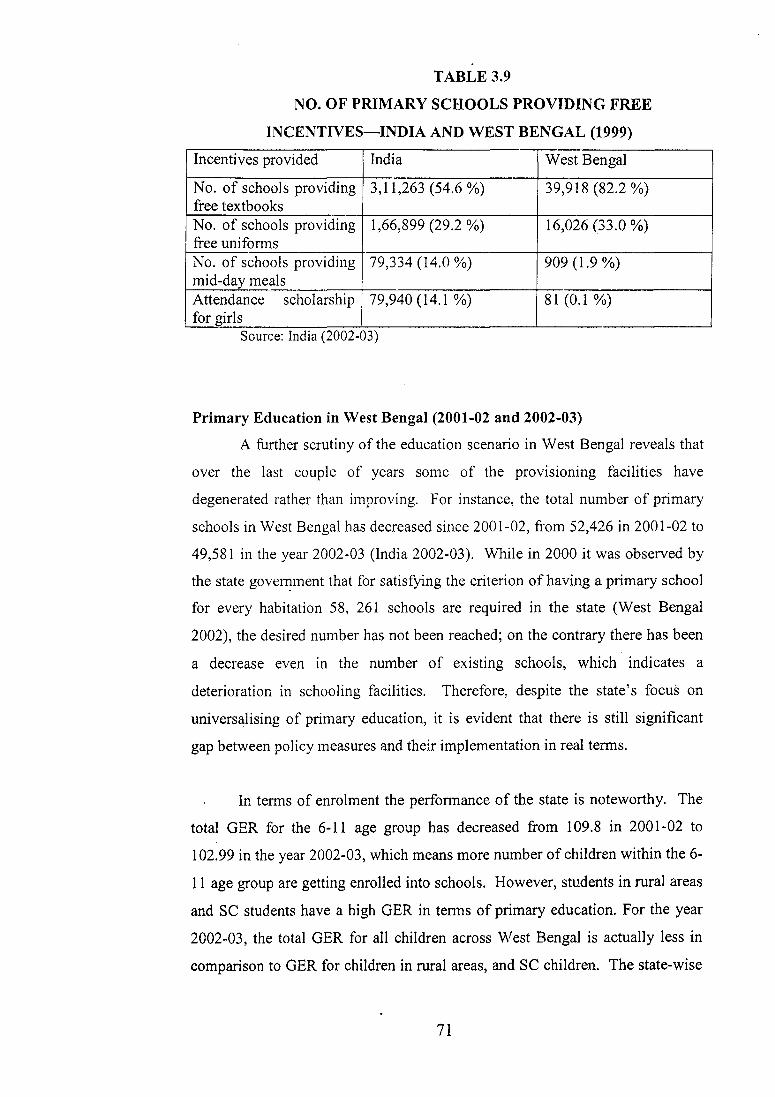
TABLE 3.9
NO. OF PRIMARY SCHOOLS PROVIDING FREE
INCENTIVES-INDIA AND WEST BENGAL (1999)
Incentives provided India West Bengal
No. of schools providing 3,11,263 (54.6 %) 39,918 (82.2 %) free textbooks No. of schools providing 1,66,899 (29.2 %) 16,026 (33.0 %) free uniforms No. of schools providing 79,334 (14.0 %) 909 {1.9 %) mid-day meals Attendance scholarship 79,940 (14.1 %) 81 (0.1 %) for girls
Source: Indta (2002-03)
Primary Education in West Bengal (2001-02 and 2002-03)
A further scrutiny of the education scenario in West Bengal reveals that
over the last couple of years some of the provisioning facilities have
degenerated rather than improving. For instance, the total number of primary
schools in West Bengal has decreased since 2001-02, from 52,426 in 2001-02 to
49,581 in the year 2002-03 (India 2002-03). While in 2000 it was observed by
the state gove~ment that for satisfying the criterion of having a primary school
for every habitation 58, 261 schools are required in the state (West Bengal
2002), the desired number has not been reached; on the contrary there has been
a decrease even in the number of existing schools, which indicates a
deterioration in schooling facilities. Therefore, despite the state's focus on
universalising of primary education, it is evident that there is still significant
gap between policy measures and their implementation in real terms.
In terms of enrolment the performance of the state is noteworthy. The
total GER for the 6-11 age group has decreased from 109.8 in 2001-02 to
102.99 in the year 2002-03, which means more number of children within the 6-
11 age group are getting enrolled into schools. However, students in rural areas
and SC students have a high GER in terms of primary education. For the year
2002-03, the total GER for all children across West Bengal is actually less in
comparison to GER for children in rural areas, and SC children. The state-wise
71
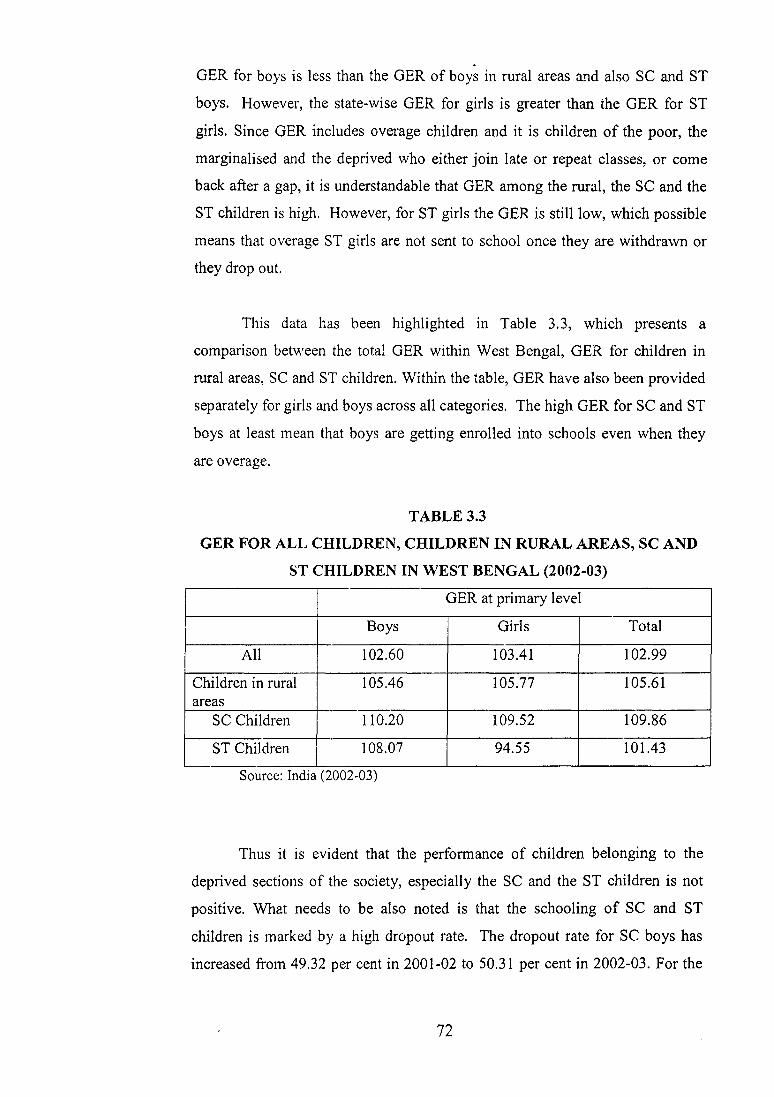
GER for boys is less than the GER of boys in rural areas and also SC and ST
boys. However, the state-wise GER for girls is greater than the GER for ST
girls. Since GER includes overage children and it is children of the poor, the
marginalised and the deprived who either join late or repeat classes, or come
back after a gap, it is understandable that GER among the rural, the SC and the
ST children is high. However, forST girls the GER is still low, which possible ·
means that overage ST girls are not sent to school once they are withdrawn or
they drop out.
This data has been highlighted in Table 3.3, which presents a
comparison between the total GER within West Bengal, GER for children in
rural areas, SC and ST children. Within the table, GER have also been provided
separately for girls and boys across all categories. The high GER for SC and ST
boys at least mean that boys are getting enrolled into schools even when they
are overage.
TABLE 3.3
GER FOR ALL CHILDREN, CHILDREN IN RURAL AREAS, SC AND
ST CHILDREN IN WEST BENGAL (2002-03)
GER at primary level
Boys Girls Total
All 102.60 103.41 102.99
Children in rural 105.46 105.77 105.61 areas
SC Children 110.20 109.52 109.86
ST Children 108.07 94.55 101.43
Source: Ind1a (2002-03)
Thus it is evident that the performance of children belonging to the
deprived sections of the society, especially the SC and the ST children is not
positive. What needs to be also noted is that the schooling of SC and ST
children is marked by a high dropout rate. The dropout rate for SC boys has
increased from 49.32 per cent in 2001-02 to 50.31 per cent in 2002-03. For the
72
girls it has decreased from 57.74 per cent in 2001-02 to 54.74 per cent in 2002-
03, but this is still a fairly high dropout rate. This indicates that in 2002-03,
more than half of the total enrolled SC children have dropped out from primary
schooling. The same is true for ST children. The total dropout rate for ST
students has increased from 54.95 per cent in 2001-02 to 55.54 per cent in 2002-
03. ForST boys, it has gone up from 53.63 per cent in 2001-02 to 53.70 per
cent in 2002-03. For the girls, the already high dropout rate of 57.71 per cent in
2001-02 has gone up to 59.26 per cent in the year 2002-03.
Thus, it can be said about education of SC and ST children that this is
still an area that needs improvement. Caste-concerns do exist in the state,
especially within districts with high concentration of Scheduled Castes and this
has been highlighted in recent studies (Pratichi Education Report 2002, Ghosh
and Rawal 2003). Stories of high-caste teachers unwilling to teach low-caste
students, or tales of high caste teachers inflicting severe physical punishments
on low-caste students are not uncommon. These relate why low caste students
are kept away from schools where higher caste students and teachers are present
(Pratichi Education Report 2002: 118).
Among the Scheduled Tribes, large-scale illiteracy still exists, and this
in tum affects the schooling of their children. Coupled with this is poverty and
exploitation by moneylenders and landowners. Thus, schooling of their
children occupies a low position in their priorities, involved as they are in a day
to day struggle for survival. Also, language and the other cultural factors among
the Scheduled Tribes that are distinctly different from the mainstream education
impatted in school result in a cultural barrier even if they have access to
schools, which further reflects in their inability to complete education and
finally, dropping out (Sujatha 1996, Nambissan 2003).
In tenns of school infrastructure, the perfonnance of the state is not very
encouraging. As mentioned earlier, there are schools in West Bengal without
buildings or partially kachcha buildings as per the NCERT survey ( 1999). This
corresponds with the findings of Theobald and Chakraborty (1996) in their
investigation into the nature of primary schooling in the state, where it was
73

observed by the authors that the school buildings are in a state of disrepair and
most of the classrooms (especially in the rural areas) are kachcha, built of wood
or some other non-permanent material, or partly pucca, that is, brick walls with
a corrugated iron or thatched roof. Basic teaching-learning aids are also missing
. at times, as pointed out by Basu (1996) in his study conducted in seven, primary
schools in the district of South 24 Parganas. He points out lack of basic
teaching aids like balckboards in schools and emphasies on the need for
separate single classrooms for separate sections, especially in areas with high
population density.
The state also does not seem to have adequate number of teachers for all
the students. In 2002-03, the state had a pupil-teacher ration of 30:1, which is
lower then the pupil-teacher ratio of 35:1 in 2001-02. However, this seems to be
more so due to a drop in the total number of children enrolled in schools from
101,51 ,362 to 97,7 4,543 in 2002-03, since the number of teachers in primary
schools dropped from 1, 64,000 in 2001-02 to 1,51,255 in 2002-03 (India 2001-
02, India 2002-03).
Also, even the 30:1 ratio is fairly high in comparison to other states and
UTs, since West Bengal ranks seventh from the top in terms of state-wise pupil
teacher ratio (India 2002-03). There seems to be a clear need for more number
of teachers across the state, especially keeping in mind the wide disparities that
sometimes is obscured by these state-wise figures. Chatterjee ( 1997), for
instance, in his study on the profile of school teachers in West Bengal
conducted a sample survey of teachers in the district of North 24 Parganas,
showed that teachers of rural schools have to take the responsibility of greater
number of students than their urban colleagues. In this study there were 18 rural
schools (19. 35 per cent of the total sample) with pupil-teacher ratio being
around 81-120 students per teacher. Basu ( 1996) in his study of quality
management in primary schools of South 24 Parganas district stated that an
additional number of 2, 218 teachers were required in the district to ensure a
pupil-teacher ratio of 50: 1 in the primary schools of the district.
74
There are also instances when teachers, though being employed to teach,
are not available for teaching. The Pratichi Report (2002), while discussing the
quality of schooling in West Bengal describes the active involvement of
teachers in state politics. This is a phenomenon that results in their neglecting
their teaching responsibilities, and results in a high teacher absenteeism rate in
schools. One incident mentioned in this report, for instance, is about a teacher
who, when interviewed by the researchers admitted that due to his
administrative responsibilities in the panchayat he missed school at least four
days in each month (Pratichi Report 2002: 17). However, teacher salaries form
part of government expenditure and allocation of funds towards teacher salaries
often affect the other infrastructure-related funds. A large portion of
infrastrurcture -related problems in primary schools in the West Bengal have
been ascribed to lack of financial resources, with 95 per cent of the total
primary education budget being allocated to teachers' salaries, leaving minimal
amounts to be spent on quality improvement programmes like
construction/repair of school buildings, or teacher training (Reddy 1998:36).
From the above discussion, it is evident that despite the initiatives taken
up by the state government, in almost every educational indicator there is a
scope of improvement. Over the past years, the state government has taken
major initiatives to make primary education available to all children and
implement the central schemes such as DPEP (District Primary Education
Programme, (launched in 1996-97 in the state) and Sarva Shiksha Abhiyan
(launched in 2000). There is also a sense of increasing accountability not only
on the part of the government but also the community towards improving the
overall quality of primary education .. There is an emphasis on measures of
quality improvement like providing of teachers' orientation programme, supply
of teaching-learning materials under various schemes, establishment of resource
centres and building up an effective monitoring system.
However, despite the state government's commitment to make primary
education available to all children, the status of primary education in West
Bengal is yet far off the mark in terms of universal access and retention.
Though student enrolment has increased over the years, there are still a large
75
number of children who drop out of schools with around 30 per cent of the total
population within the 5-9 age group not completing schooling (Nambissan
2003: 4). Problems related to lack of basic school infrastructure like school
buildings and classrooms and toilet and drinking water facilities abound. Large
pupil teacher ratios, especially in rural areas also impact the quality of teaching.
Also, lack of a proper inspection and monitoring system has been cited as a
major reason for non-implementation of educational measures in real terms
(West Bengal 1992, Basu, 1996, Chatterjee 1997).
After this discussion about the overall picture of education in West
Bengal, it is now important to focus the discussion on Kolkata, the city in which
the study was conducted. Kolkata (the renamed version of Calcutta since 2001)
is the capital of West Bengal. It has a history of more than 300 years, ever since
Job Charnock of the East India Company established the first Company factory
in Kolkata in 1690. Located on the eastern bank of the Hooghly river (an arm
of the Ganges), the city, once the capital of the British India, is an important
river port and the most important urban centre in Eastern India. During the
British reign, Kolkata was also the seat of education and centre of trade as well
as the major metropolis of the colonial period. Even during Independence,
Kolkata was known as the 'economic capital' of India (Nambissan 2003: 12).
However, ever since Independence, the city has gone into decline over the years
due to a number of reasons like degeneration of the economy due to industrial
stagnation, political upheavals, a steadily-growing population due to perpetual
inflow of migrants from rural areas, poor administrative set up and limited
infrastructure to accommodate the burgeoning population (Nambissan 2003:
12).
The core city of Kolkata is bound by the Hooghly river on the west, the
Salt Lakes on the east and marshes and swamps towards the south. The Calcutta
Municipal Corporation spreads over an area of 187.33 sq km. The metropolitan
area of about 800 sq kms extends along both sides of the river Hooghly from
Bandel I Kalyani in the north to Budge Budge in the south and from Howrah in
the west to Bidhan Nagar in the east. This urban agglomeration is home to a
population of around 10 million and has three municipal corporations (Calcutta,
76
Howrah, Chandannagore), 35 municipalities and several villages
(www.kolkatabeckons.com). One of the largest metropolises of the world,
Kolkata has a population of over 13 million (200 1 census), of which almost 48
per cent are migrants and slum-dwellers. In addition, there are pavement
dwellers who were estimated to be around 55,000 persons in 1987 (J agannathan
and Haldar 1988: 2602). Therefore, it can be inferred that around half of the
city's population comprise of poor people living in abject conditions of poverty.
The overall literacy rate in Kolkata is 81.3 per cent, which is higher
than the overall state literacy rate of 69.22 per cent (2001 census). However, the
progress of primary schooling appears to be considerably slow in the city (with
the attendance rates of children of 6-10 years of age having barely improved in
comparison to that of children of 11-14 years) in comparison to the rest of the
state, where a significantly larger proportion of younger children have entered
school (Nambissan 2003: 13). The propmiion of out-of-school children as
calculated by the State Resource Group for Urban Deprived Children in 1999,
as part of DPEP interventions in Kolkata, was 26 per cent of the children in the
5-9 group and 29 per cent in the 11-14 years group. These include children of
slum and pavement dwellers, children of migrant labourers, child labour and
children of sex-workers. In all, a total of 44, 600 children aged between 5-9
years were out of school (Cyril 1999).
The figures for the number of primary schools in Kolkata are not
absolute, because different official sources provide different statistics-for
instance, in the year 2000 there were 1, 435 primary schools in Kolkata
according to the Department of School Education of West Bengal, and 1, 608
schools according to the Calcutta Municipal Corporation (CMC) and the
District Primary School Council (DPSC) for Kolkata. However, the confusion
regarding number of schools notwithstanding, Nambissan (2003) in her study of
schooling in Kolkata has outlined the types of primary schools available in
Kolkata. The independent primary schools (from classes I-IV), are either under
the administration of the CMC or the DPSC, that is, government bodies, or by
other local bodies like community clubs etc. (Basu 1996). Apart from these,
there are primary schools that are attached to secondary or higher secondary
77
schools, tenned as 'composite schools' by Nambissan which, as per her
research, account for more than a quarter of Kolkata's primary schools (2003:
14), and which are managed by private management bodies (of these again there
are those that receive grants from the government and those that are fully
private). Besides these, there are certain 'English medium' schools of private
management that do not fall under the purview of the norms and regulations and
are not recognised by the government. In addition to there are non-formal,
alternative schools run by NGOs (including the Shishu Shiksha Kendras or
SSKs run by the CMC) for children who are not enrolled in regular primary
schools.
The enrolment of children in CMC and DPSC schools (from classes I
IV) in 1999 were around L9 lakh (West Bengal 2000), among whom, 49 per
cent of the DPSC school students and 53 per cent of the CMC students were
girls. However, gender difference was evident among the enrolled Scheduled
Caste children where 60 per cent of the total enrolled SC students were boys
and 40 per cent were girls (Nambissan 2003: 17). The student dropout rate is the
highest in cases of transition from primary to upper primary schools, that is in
or before class IV. This is due to lack of adequate number of upper primary
schools-a problem that is most persistent in Kolkata (and, in West Bengal)
with upper primary and higher levels of schooling not being available to the
majority of children (Narula and Majumdar 2001, Nambissan 2003). Children
studying in independent primary schools, therefore, tend to leave school before
class IV in order to seek admission in 'composite' schools. It was noted by the
researcher during her fieldwork that though primary schooling in the 'composite
schools' is free (following the state norms), upper-primary education is not, and
considerable amount of fees in the form of tuition fees, sports fees or science
fees are charged from students, most of whom cannot afford it. Nambissan also
states that for several economically disadvantaged children, access to education
just stops after class IV due to the fact that their families do not have the
financial resources to continue with their child's education in private, fee
charging composite schools (2003: 19)
78
/
With the already inadequate physical facilities of primary schooling in
West Bengal, it is evident that there is lack of proper infrastructure in the
schools of Kolkata. Though the schooling situation is relatively better in
Kolkata since it is an urban region, the facilities are still not enough for all the
population within the 5-9 age group. The All India Education Survey in 1999
showed 69.2 per cent of the primary schools lack a concrete building and 27.3
per cent of schools had two or fewer rooms for instructional purposes. In case
of the CMC and the DPSC schools studied by Nambissan, several were poorly
maintained in unhygienic situations. Children were often made to sit on the
floors of overcrowded classrooms. Even basic amenities like safe drinking
water were not available in several of the schools. School authorities were not
capable of immediately addressing these infrastructural problems due to limited
financial resources made available to them from the state government (2003:
21-22).
With an officially prescribed pupil-teacher ratio of 40: 1, the pupil
teacher ratio in the schools of Kolkata vary from 21: 1 to 100: 1, with some
educational circles having significantly greater population of children · in
comparison to others (Nambissan 2003: 28). However, despite the presence of
formally qualified teachers in the schools, the quality of teaching-learning in
schools is said to be affected by factors like irregular attendance of teachers,
indifferent manner of imparting education and also, discrimination by higher
class teachers towards children of slum and pavement dwellers (West Bengal
1992: 45). NGOs and voluntary organisations working for the education of the
deprived urban children in Kolkata cite lack of sensitivity towards the needs of
students and lack of accountability as reasons for poor quality of teaching.
Related factors like lack of a proper monitoring and inspection mechanism also
result in the indifferent manner of teaching (West Bengal 1992: 43).
Conclusion
It is evident that though considerable importance has been attached to
primary education in the state of West Bengal and the capital city, Kolkata,
there is still a lot to be achieved in terms of universal and quality education (in
terms of physical facilities as well as pedagogical processes) to all children
79
within the 5-9 age group for quality schooling. Efforts towards improving
access and quality are being made by the state government, but there are still a
large amount of rural and caste-based disparities. A significant proportion of the
children are still out-of school and even for those children who are in school,
the quality of education received needs to be improved. This is true especially
for the poor, marginalised and deprived sections of the children, and also for
children of sex-workers who are deprived of several opportunities in life. A
systematised and well-monitored system of implementation, proper allocation
of finances and accountability of the government towards the students, the
parents and the communities are required in order to ensure universal access,
quality and retention within primary education.
80


![Home | Welcome to West Bengal Judicial Academy Bengal Excise... · West Bengal Act of 2012 THE BENGAL EXCISE (AMENDMENT) ACT, 2012. [Passed by the West Bengal Legislature.] [Assent](https://static.fdocuments.in/doc/165x107/607fa9c0e387de78580b7626/home-welcome-to-west-bengal-judicial-bengal-excise-west-bengal-act-of-2012.jpg)