Chapter III A - INFLIBNETshodhganga.inflibnet.ac.in/bitstream/10603/101058/9/09_chapter 3.pdfDuring...
55
86 Chapter III A Simultaneous estimation of gefitinib (Iressa®) and its process-related impurities formed in quinazolinone route: Titrimetry v/s HPLC method
Transcript of Chapter III A - INFLIBNETshodhganga.inflibnet.ac.in/bitstream/10603/101058/9/09_chapter 3.pdfDuring...

86
Chapter III A
Simultaneous estimation of gefitinib (Iressa®) and its
process-related impurities formed in quinazolinone route:
Titrimetry v/s HPLC method
87
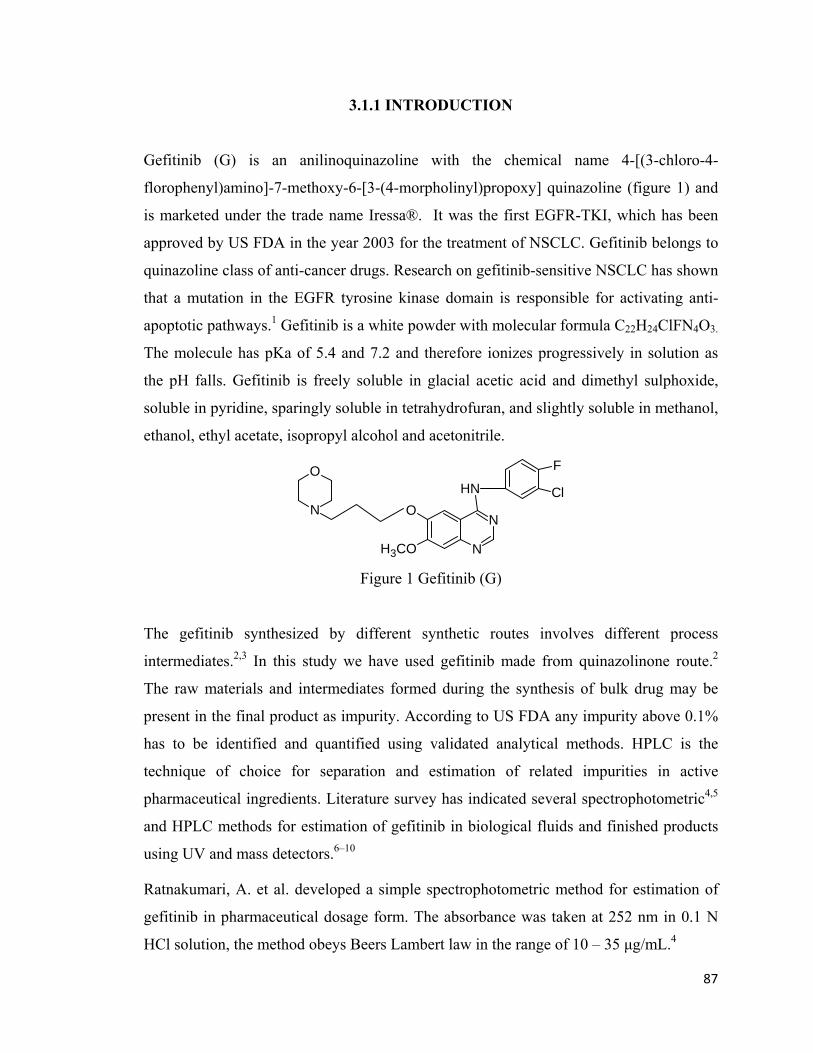
3.1.1 INTRODUCTION
Gefitinib (G) is an anilinoquinazoline with the chemical name 4-[(3-chloro-4-
florophenyl)amino]-7-methoxy-6-[3-(4-morpholinyl)propoxy] quinazoline (figure 1) and
is marketed under the trade name Iressa®. It was the first EGFR-TKI, which has been
approved by US FDA in the year 2003 for the treatment of NSCLC. Gefitinib belongs to
quinazoline class of anti-cancer drugs. Research on gefitinib-sensitive NSCLC has shown
that a mutation in the EGFR tyrosine kinase domain is responsible for activating anti-
apoptotic pathways.1 Gefitinib is a white powder with molecular formula C22H24ClFN4O3.
The molecule has pKa of 5.4 and 7.2 and therefore ionizes progressively in solution as
the pH falls. Gefitinib is freely soluble in glacial acetic acid and dimethyl sulphoxide,
soluble in pyridine, sparingly soluble in tetrahydrofuran, and slightly soluble in methanol,
ethanol, ethyl acetate, isopropyl alcohol and acetonitrile.
O
H3CO
N
N
HN
F
ClN
O
Figure 1 Gefitinib (G)
The gefitinib synthesized by different synthetic routes involves different process
intermediates.2,3 In this study we have used gefitinib made from quinazolinone route.2
The raw materials and intermediates formed during the synthesis of bulk drug may be
present in the final product as impurity. According to US FDA any impurity above 0.1%
has to be identified and quantified using validated analytical methods. HPLC is the
technique of choice for separation and estimation of related impurities in active
pharmaceutical ingredients. Literature survey has indicated several spectrophotometric4,5
and HPLC methods for estimation of gefitinib in biological fluids and finished products
using UV and mass detectors.6–10
Ratnakumari, A. et al. developed a simple spectrophotometric method for estimation of
gefitinib in pharmaceutical dosage form. The absorbance was taken at 252 nm in 0.1 N
HCl solution, the method obeys Beers Lambert law in the range of 10 – 35 μg/mL.4

88
It has been reported by Pravalika Reddy, P. et al. about the development of
spectrophotometric method for gefitinib by reacting it with oxidized product of 3-methyl-
1,2-benzothiazolinone hydrazone (MBTH) with ferric chloride and cerric ammonium
nitrate(CAN) and recording absorbance at 438 and 675 nm respectively.5
Kumar, V. K. et al. developed simple, precise, rapid and accurate reverse phase HPLC
method for the estimation of gefitinib in tablet dosage form. Gefitinib was separated on a
Hypersil BDS RP C18, (250 X 4.6 mm, 5 μm) column, mobile phase consisting of 0.02
M dipotassium hydrogen orthophosphate and methanol (10:90, v/v), the flow rate was 1.0
mL/min and monitored at 246 nm. The detector response was linear in the concentration
of 25-300 μg/mL. The limit of detection and limit of quantification was 0.125 μg/mL and
0.15 μg/mL respectively.6
Faivre, L. et al. developed simple HPLC-UV method for simultaneous estimation of
gefitinib and erlotinib in human plasma using sorafinib as internal standard. Compounds
are separated on a C8 column using acetonitrile and ammonium acetate (pH 4.5) with
flow rate 0.4 mL/min (gefitinib and erlotinib monitored at 331 nm and sorafinib at 249
nm). The calibration is linear in the range 20 – 1000 ng/ mL and 80 – 4000 ng/mL for
gefitinib and erlotinib respectively.7
Bai, F. et al. developed a highly sensitive liquid chromatography-electronspray tandem
mass spectrometry method for the measurement of gefitinib in human plasma using
deuterated gefitinib as the internal standard. Compounds were extracted from 500 µL of
plasma by 6.0 mL butyl methyl ether liquid–liquid extraction. Chromatographic
separation was achieved on a Phenomenex® Synergi MAX‐RP 80 Å C12 column
(75 × 2.0 mm, 4 µm) with an isocratic mobile phase of acetonitrile and 1.0% formic acid
(30:70, v/v). The analytes were detected with a triple quadrupole mass spectrometer using
positive ionization. Ions monitored in the multiple reaction monitoring mode were m/z
447.2 (precursor ion) to m/z 127.8 (product ion) for gefitinib and m/z 455.2 (precursor
ion) to m/z 136.0 (product ion) for D8‐ZD1839. The method was linear over range of
0.5–1000 ng/mL and the lower limit of quantification of gefitinib was 0.30 ng/mL.8
Guetens, G. et al. developed a specific and sensitive high performance liquid
chromatography method was for the quantitative determination of gefitinib

89
concentrations in plasma of treated healthy volunteers and patients with cancer. Plasma
samples were extracted, at basic pH, with methyl-t-butyl ether using deuterated gefitinib
as an internal standard. The extracts were chromatographed on an Inertsil ODS3 column
eluted with acetonitrile/ammonium acetate and quantified by mass spectrometric
detection. LOQ of the method was 0.5 ng/mL.9
Wang, L.Z. et al. developed a rapid and specific liquid chromatography–tandem mass
spectrometric (LC–MS/MS) method for simultaneous quantification of gefitinib and its
predominant metabolite, O-desmethyl gefitinib in human plasma. Chromatographic
separation of analytes was achieved on an Alltima C18 analytical column (150 X 2.1 mm,
5 μm) using acetonitrile and 0.1% formic acid in water (30:70, v/v) as mobile phase and
flow rate was 0.3 mL/min. The column effluents were detected by triple quadrupole mass
spectrometer using electro spray ionization (ESI) in positive mode. Linearity was
demonstrated in the range of 5–1000 ng/mL for gefitinib and 5–500 ng/mL for O-
desmethyl gefitinib. Developed method was used as a bioanalytical tool in a phase I
clinical trial to investigate the possible effect of hydroxychloroquine on the
pharmacokinetics of gefitinib.10
All reported methods are relatively expensive and involve tedious sample preparation
techniques. Not a single titrimetry method was reported for estimation of gefitinib. Also
all reported HPLC methods dealt with estimation of gefitinib and its metabolic impurities
but none of the method dealt with the estimation of process-related impurities of
gefitinib. Hence we have taken task of developing a simple titrimetry method for
estimation of gefitinib and HPLC method for simultaneous estimation of gefitinib and its
process-related impurities.
3.1.2 IMPORTANCE OF THE PRESENT WORK
We have developed fast, simple and cost effective nonaqueous titration methods for the
first time for estimation of gefitinib. The impurities present in gefitinib bulk drug was
isolated by preparative HPLC and characterized by using spectroscopic techniques. Since
the available literature doesn’t show any HPLC method for simultaneous estimation of
gefitinib and its process-related impurities and titration methods were not suitable for

90
estimation of impurities which is present in trace amount. In this present study, we have
developed RP-HPLC method for separation and estimation of gefitinib and its process-
related impurities formed during the synthesis of gefitinib in above mentioned method.
The developed methods were validated for specificity, linearity, precision, limit of
detection, limit of quantification and ruggedness as per ICH guidelines.
3.1.3 RESULTS AND DISCUSSION
3.1.3.1Titrimetric methods for estimation of gefitinib (G)
The methods are based on the principle that substances, which are weakly basic in
aqueous medium, exhibit enhanced basicity in non-aqueous media thus allowing their
easy determination. In the presence of perchloric acid, acetic acid will accept a proton
and forms CH3COOH2+, which can very readily give up its proton to react with a base, so
basic properties of G is enhanced and hence, titration between weak base G and
perchloric acid can be accurately carried out using acetic acid as solvent. (Figure 2)
O
H3CO
N
N
HN
F
ClN
O2CH3COOH2
+ +
O
H3CO
N
N
NH2+
F
ClNH
+
O
+ 2CH3COOH
2CH3COOH + 2HClO4 2CH3COOH2+ + 2ClO4
-
Figure 2 Probable neutralization reaction
The enhanced basicity of G in acetic acid medium is due to non-levelling effect of acetic
acid and hence the determination of G became easier. The procedure involves the titration
of G with perchloric acid with visual and potentiometric end point detection. Crystal
violet gave satisfactory end point for the concentrations of analyte and titrant employed.
During potentiometric titration we have observed that up to 5 mL titrant there was a
gradual increase in potential, after adding 6 mL of titrant there was slight decrease in
91
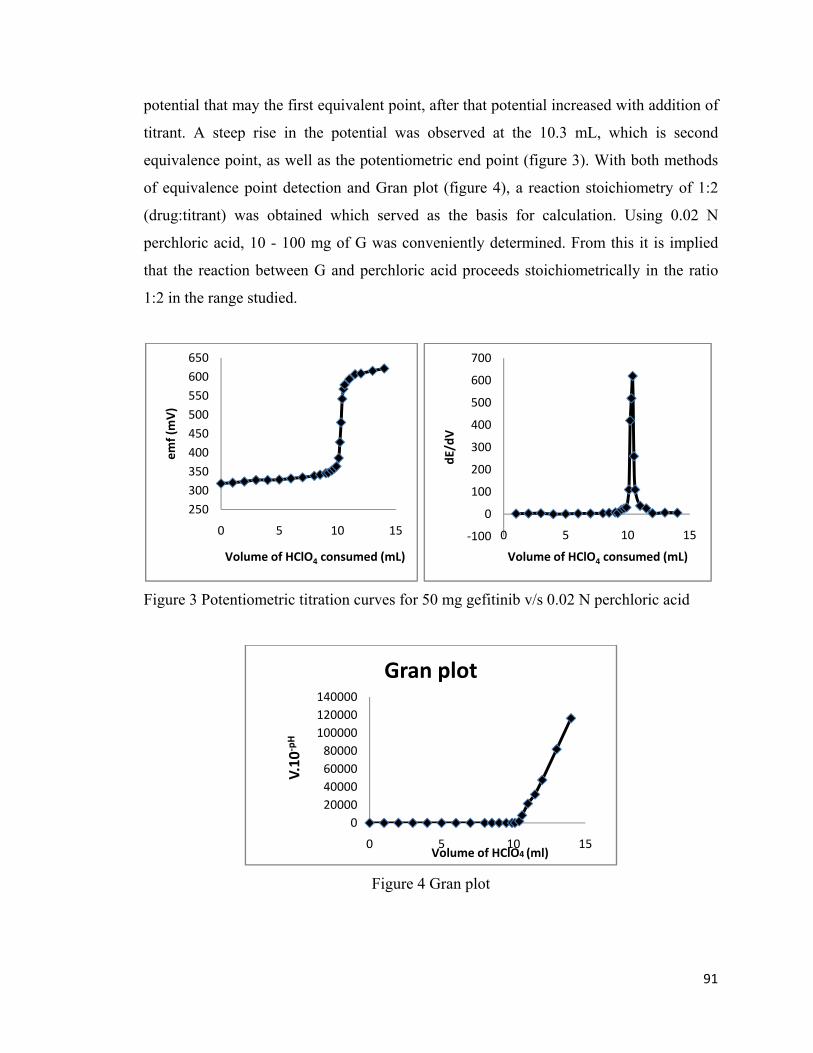
potential that may the first equivalent point, after that potential increased with addition of
titrant. A steep rise in the potential was observed at the 10.3 mL, which is second
equivalence point, as well as the potentiometric end point (figure 3). With both methods
of equivalence point detection and Gran plot (figure 4), a reaction stoichiometry of 1:2
(drug:titrant) was obtained which served as the basis for calculation. Using 0.02 N
perchloric acid, 10 - 100 mg of G was conveniently determined. From this it is implied
that the reaction between G and perchloric acid proceeds stoichiometrically in the ratio
1:2 in the range studied.
Figure 3 Potentiometric titration curves for 50 mg gefitinib v/s 0.02 N perchloric acid
Figure 4 Gran plot
250300350400450500550600650
0 5 10 15
emf (mV)
Volume of HClO4 consumed (mL)
‐100
0
100
200
300
400
500
600
700
0 5 10 15
dE/dV
Volume of HClO4 consumed (mL)
020000400006000080000
100000120000140000
0 5 10 15
V.10
‐pH
Volume of HClO4 (ml)
Gran plot

92
3.1.4.1.1 Estimation of gefitinib by visual titration method
The nonaqueous titration method by visual end point determination was developed and
optimized. The method was validated using ICH guidelines and detailed validation study
results were described in this section.
Linearity
Linearity of the method was checked at seven concentration levels ranging from 10 -100
mg of G standard solutions by titration with 0.02 M perchloric acid. The correlation
graph was plotted volume of perchloric acid consumed against quantity of G taken. The
correlation co-efficient value was 0.999, indicating that there is good correlation between
concentration of G and volume of perchloric acid consumed. The different data points of
linearity study and correlation graphs were given in table 1 and figure 5 respectively.
Table 1 Linearity data
Figure 5 Correlation graph
Accuracy and precision
Accuracy and precision of the method was checked by analyzing the G standard solutions
at three concentration levels (10, 20 & 50 mg). The relative error (RE) was calculated at
each level on two days and RE values were <1.0% indicating the good accuracy of the
method. The relative standard deviations (RSD) was estimated at three concentration
levels and the RSD values were <1.5% indicating the good precision of the method.
(Table 2)
y = 0.208x + 0.053R² = 0.999
0
5
10
15
20
25
0 50 100 150
Volum
e of HClO
4
consum
ed(m
L)
Weight of G (mg)
Sl.No Weight of G (mg) Volume of HClO4 Consumed (mL)
1 10 2.2 2 20 4.3 3 30 6.1 4 40 8.4 5 50 10.4 6 70 14.75
7 100 20.85

93
RE, %Amount G taken Amount G found x100
Amount G taken
RSD, %SD x 100
Average value
Table 2 Accuracy and precision data
a average of five determinations b average of eight determinations
Recovery study
Recovery of the method was checked by spiking the bulk drug with standard gefitinib at
three concentration levels (10, 20, & 30 mg).The study was done in triplicate and the
recovery values at each level falls between 98.5 – 99.50% indicating the good recovery of
the method. (Table 3)
Recovery, %Amount of G taken Amount of G found x 100
Amount of G taken
Table 3 Recovery data a
Amount of G from bulk drug(mg)
Amount of standard G added (mg)
Total G (mg) Total amount of G found (mg)
Recovery,%
20.2 10 30.20 29.95 99.17
20.1 20 40.10 39.56 98.56
20.3 30 50.30 50.05 99.49 a average of three determinations
Amount taken G,
(mg)
Intra-daya Inter-dayb Amount
found (mg) RE, % RSD, % Amount
found(mg)RE, % RSD, %
10 9.94 0.55 1.32 9.97 0.31 1.29
20 20.03 0.16 1.07 20.03 0.14 0.89
50 49.91 0.42 0.52 49.84 0.31 0.52

94
Application
The developed visual titration method was used for estimation of assay of gefitinib bulk
drug. Six bulk drug samples analysed in triplicate and assay values were in the range of
99.54 - 99.87% and RSD values were <1.0%. (Table 4)
Table 4 Sample analysis dataa
Sample ID Assay, % w/w RSD,%
Gef-1 99.87 0.31
Gef-2 99.76 0.10
Gef-3 99.77 0.25
Gef-4 99.68 0.31
Gef-5 99.54 0.33
Gef-6 99.76 0.84 a average of three determinations
3.1.3.1.2 Estimation of gefitinib by potentiometric titration method
The nonaqueous titration with potentiometric end point detection method was developed
and validated as per ICH guidelines. The validation study results were described in this
section.
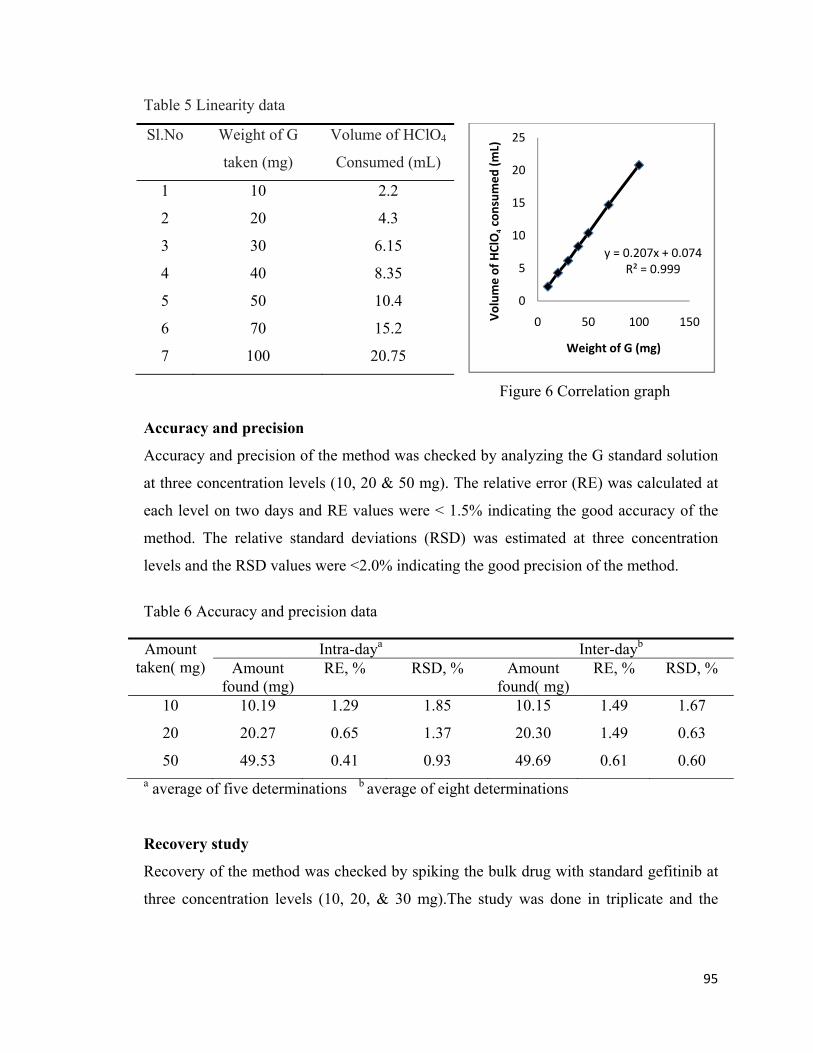
Linearity
Linearity of the method was checked at seven concentration levels ranging from 10-100
mg by titration with. The correlation graph was plotted against volume of perchloric acid
consumed against quantity of G taken. The correlation co-efficient value was 0.999
indicating that there was good linearity between concentration of G and volume of
perchloric acid consumed. The different data points of linearity study and correlation
graphs were given in table 5 and figure 6 respectively.
95
Table 5 Linearity data
Figure 6 Correlation graph
Accuracy and precision
Accuracy and precision of the method was checked by analyzing the G standard solution
at three concentration levels (10, 20 & 50 mg). The relative error (RE) was calculated at
each level on two days and RE values were < 1.5% indicating the good accuracy of the
method. The relative standard deviations (RSD) was estimated at three concentration
levels and the RSD values were <2.0% indicating the good precision of the method.
Table 6 Accuracy and precision data
a average of five determinations b average of eight determinations
Recovery study
Recovery of the method was checked by spiking the bulk drug with standard gefitinib at
three concentration levels (10, 20, & 30 mg).The study was done in triplicate and the
y = 0.207x + 0.074R² = 0.999
0
5
10
15
20
25
0 50 100 150Volum
e of HClO
4consum
ed (m
L)
Weight of G (mg)
Sl.No Weight of G
taken (mg)
Volume of HClO4
Consumed (mL)
1 10 2.2
2 20 4.3
3 30 6.15
4 40 8.35
5 50 10.4
6 70 15.2
7 100 20.75
Amount taken( mg)
Intra-daya Inter-dayb Amount
found (mg) RE, % RSD, % Amount
found( mg) RE, % RSD, %
10 10.19 1.29 1.85 10.15 1.49 1.67
20 20.27 0.65 1.37 20.30 1.49 0.63
50 49.53 0.41 0.93 49.69 0.61 0.60

96
recovery values at each level falls between 99 - 100% indicating the good recovery of the
method.
Table 7 Recovery study dataa
Weight of G from bulk drug, mg
Weight of standard G added, mg
Total G, mg Total amount of G found, mg
Recovery,%
20.1 10 30.1 32.43 99.48
20.1 20 40.1 39.72 99.04
20.2 30 50.2 50.05 99.69 a average of three determinations
Application
The developed potentiometric titration method was used for assay of gefitinib bulk drug.
Six bulk drug samples analysed in triplicate and assay values were in the range of 99.35-
99.90% and RSD values were <1.0%. (Table 8)
Table 8 Sample analysis resultsa
Sample ID Assay, % w/w RSD,%
Gef-1 99.68 0.65 Gef-2 99.82 0.16 Gef-3 99.77 0.25 Gef-4 99.73 0.55 Gef-5 99.90 0.53 Gef-6 99.35 0.36
a average of three determinations
3.1.4.2 Isolation, characterization of impurities and development of HPLC method
for simultaneous estimation of gefitinib and its process related impurities
3.1.4.2.1 Isolation and characterization of impurities
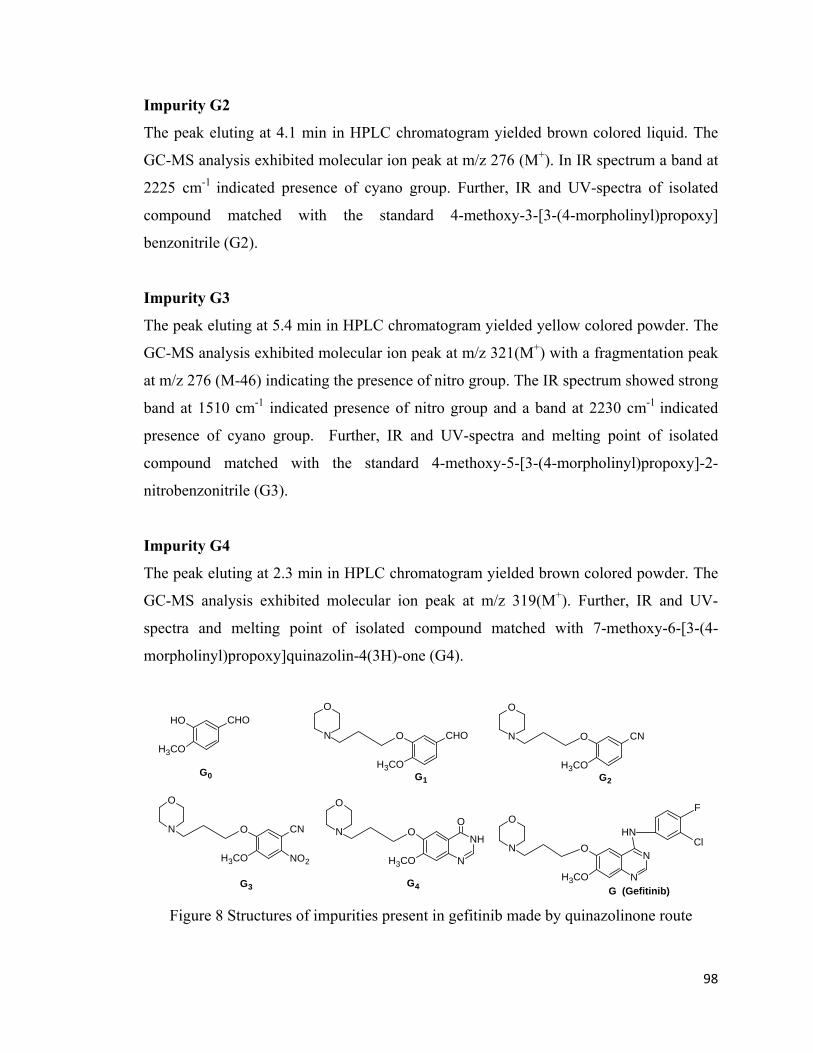
The impurities present in gefitinib bulk drug (figure 7) were isolated using preparative
HPLC and purified by extraction and concentration. The mass spectra, IR spectra, UV
spectra and melting points were recorded for purified compounds.(Figure 8)
97
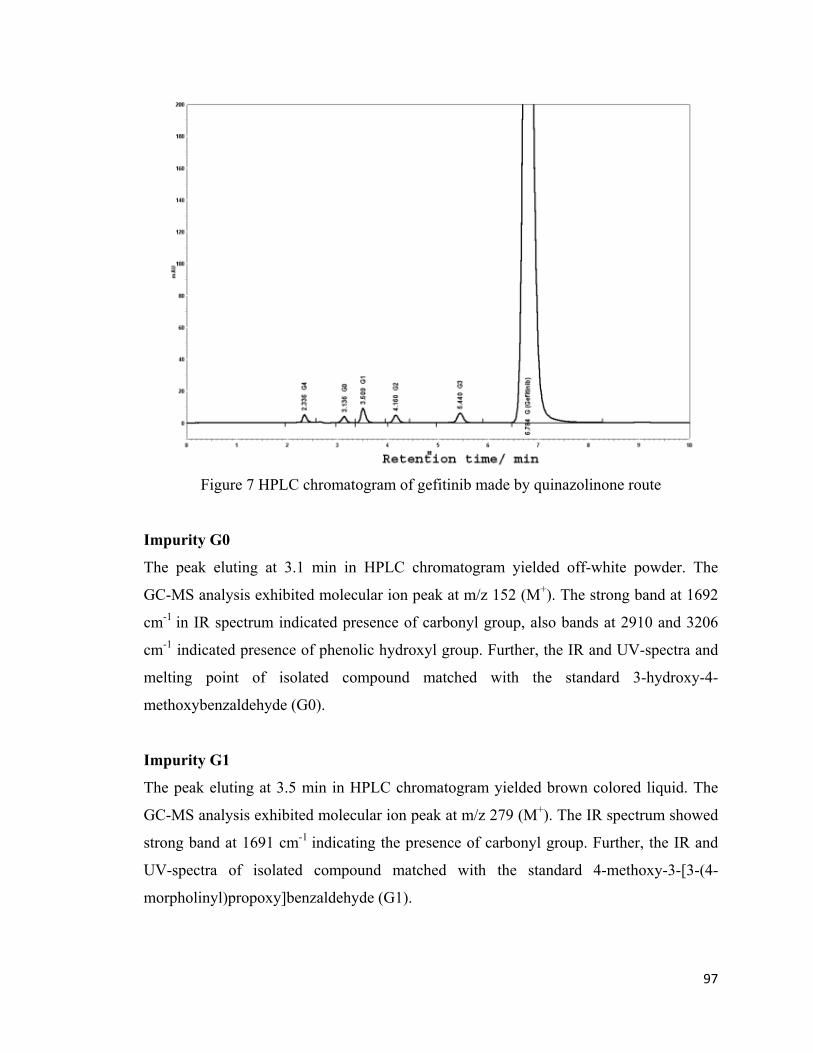
Figure 7 HPLC chromatogram of gefitinib made by quinazolinone route
Impurity G0
The peak eluting at 3.1 min in HPLC chromatogram yielded off-white powder. The
GC-MS analysis exhibited molecular ion peak at m/z 152 (M+). The strong band at 1692
cm-1 in IR spectrum indicated presence of carbonyl group, also bands at 2910 and 3206
cm-1 indicated presence of phenolic hydroxyl group. Further, the IR and UV-spectra and
melting point of isolated compound matched with the standard 3-hydroxy-4-
methoxybenzaldehyde (G0).
Impurity G1
The peak eluting at 3.5 min in HPLC chromatogram yielded brown colored liquid. The
GC-MS analysis exhibited molecular ion peak at m/z 279 (M+). The IR spectrum showed
strong band at 1691 cm-1 indicating the presence of carbonyl group. Further, the IR and
UV-spectra of isolated compound matched with the standard 4-methoxy-3-[3-(4-
morpholinyl)propoxy]benzaldehyde (G1).
98
Impurity G2
The peak eluting at 4.1 min in HPLC chromatogram yielded brown colored liquid. The
GC-MS analysis exhibited molecular ion peak at m/z 276 (M+). In IR spectrum a band at
2225 cm-1 indicated presence of cyano group. Further, IR and UV-spectra of isolated
compound matched with the standard 4-methoxy-3-[3-(4-morpholinyl)propoxy]
benzonitrile (G2).
Impurity G3
The peak eluting at 5.4 min in HPLC chromatogram yielded yellow colored powder. The
GC-MS analysis exhibited molecular ion peak at m/z 321(M+) with a fragmentation peak
at m/z 276 (M-46) indicating the presence of nitro group. The IR spectrum showed strong
band at 1510 cm-1 indicated presence of nitro group and a band at 2230 cm-1 indicated
presence of cyano group. Further, IR and UV-spectra and melting point of isolated
compound matched with the standard 4-methoxy-5-[3-(4-morpholinyl)propoxy]-2-
nitrobenzonitrile (G3).
Impurity G4
The peak eluting at 2.3 min in HPLC chromatogram yielded brown colored powder. The
GC-MS analysis exhibited molecular ion peak at m/z 319(M+). Further, IR and UV-
spectra and melting point of isolated compound matched with 7-methoxy-6-[3-(4-
morpholinyl)propoxy]quinazolin-4(3H)-one (G4).
HO
H3CO
CHON
O
O
H3CO
CN
O
H3CO
CN
NO2
N
O
O
H3CO
NH
N
ON
O
G0 G2
G3 G4
N
O
O
H3CO
CHO
G1
O
H3CO
N
N
HN
F
ClN
O
G (Gefitinib) Figure 8 Structures of impurities present in gefitinib made by quinazolinone route

99
3.1.4.2.2 Development of HPLC method for simultaneous estimation of gefitinib and
its process related impurities
3.1.4.2.2.1 Optimization of chromatographic conditions
It is evident from HPLC chromatogram (figure 7) that gefitinib bulk drug made by
quinazolinone route contains five process related impurities. The present study deals with
development of a chromatographic system which will separate all process-related
impurities of gefitinib. All impurities and gefitinib subjected to separation by reverse-
phase HPLC with different columns, using different buffer systems, with different pH
and organic modifiers. The separation was achieved with Inertsil-ODS-3V (250 x 4.6
mm, 5 µm) column, using mobile phase 1% ammonium acetate and acetonitrile (50:50
v/v).There was good separation of G2, G3, G4 and G, but G0 and G1 compound peaks were
merged. Mobile phase composition was altered by decreasing the acetonitrile
composition, but there is no improvement in separation of G0 and G1 peaks. Since G0
contains one phenolic proton, the pH of the mobile phase was changed from neutral to
acidic by adding the glacial acetic acid, which improved the separation of G0 and G1.
Further the mobile phase composition was changed to 65:35, (v/v) (pH 5) wherein good
separation of G0 and G1 along with other peaks was achieved. In above mobile phase, the
gefitinib was eluting at higher retention time compared to other compounds, hence the
acetonitrile composition was increased to 37% to elute gefitinib earlier with retention
times of G0 at 3.3 min, G1 at 3.6 min, G2 at 4.3 min, G3 at 5.6 min, G4 at 2.3 min and G at
7.0 min. A typical chromatogram of gefitinib spiked with 25 ppm of each process-related
impurity is shown in figure 9. It is evident from figure 9, that all compounds were
separated with good peak shape, symmetry and resolution. The UV wavelength 260 nm
was chosen for the detection and quantification, since the gefitinib and its impurities have
good absorption at that wavelength. The peaks were identified by injecting and
comparing retention times of the individual compounds and studying absorption spectra
using PDA detector.

100
Figure 9 Chromatogram of gefitinib spiked with five impurities
3.1.4.2.2.2 Method validation
Specificity
From figure 9, it is evident that all impurity peaks are well separated from gefitinib with
good resolution and symmetry. The chromatographic peak purity and the homogeneity
were evaluated with a PDA detector, the peaks with flat-top indicated that all peaks are
homogeneous without impurities embedded in it. The forced degradation study results
indicated that under UV, acidic and basic conditions there was no change in purity, but
under oxidative condition, the degradation products were formed (figure 10) but they
were well separated from gefitinib and the process impurities, indicating that the method
is specific for the separation and estimation of gefitinib and its process impurities.
Figure 10 Typical chromatogram of forced degradation study
101
System suitability
System suitability parameters were evaluated by five replicate injection of solution
containing 1.0% of each impurity in gefitinib at specification level (100 μg/mL). The
RSD values calculated for retention time in the range 0.01 – 0.26, theoretical plates in the
range 0.75 – 1.95 and tailing factor in the range 1.63 – 1.98 respectively. It is evident
from results that, the parameters evaluated were within the acceptable range (RSD < 2%),
indicating, the system is suitable for estimation of gefitinib and its process-related
impurities.(Table 9)
Table 9 System suitability dataa
Compound Name Abbrev iations
tR / min Tailing factor
Theoretical plate
Isovanillin
G0 3.13 ± 0.06 0.96 ± 1.72 4822 ± 1.95
4-Methoxy-3-[3-(4-morpholinyl) propoxy] benzaldehyde
G1 3.50 ± 0.01 1.21 ± 1.98 6267 ± 1.26
4-Methoxy-3-[3-(4-morpholinyl) propoxy] benzonitrile
G2 4.16 ± 0.02 1.17 ± 1.86 6989 ± 1.82
4-Methoxy-5-[3-(4-morpholinyl) propoxy]-2-nitrobenzonitrile
G3 5.44 ± 0.09 1.16 ± 1.91 9643 ± 1.21
7-Methoxy-6-[3-(4-morpholinyl) propoxy] quinazolin-4(3H)-one
G4 2.34 ± 0.26 1.15 ± 1.63 3479 ± 1.21
Gefitinib
G 6.77 ± 0.09 1.22 ± 1.78 7008 ± 0.75
a average of five determinations ± RSD,%
Linearity
The linearity of the method for impurities and gefitinib was checked at eight
concentration levels (table 10). The HPLC analysis data were subjected to statistical
analysis using linear-regression model, all the impurities and gefitinib showed a linear

102
response over the concentration range tested, with correlation coefficient (R2) values
>0.999. The regression equation and correlation coefficients are shown in figure 11 &12.
Table 10 Different data points of linearity study
Concentration,
µg/mL
Area Concentration,
µg/mL
Area
G0 G1 G2 G3 G4 G
0.1 2558 5411 3079 3902 3621 25 1638835
0.2 4585 9654 6035 7356 5401 50 3267666
0.3 7348 16598 10319 12674 8121 75 4842419
0.5 11894 26742 16668 22010 12306 100 6354639
0.8 20283 45353 27752 38485 20866 200 13130800
1 25545 57496 35340 49045 26048 300 19140537
1.5 37458 84515 51733 72898 37324 400 26045465
2 51403 115815 70579 100538 50707 500 32241006
Figure 11 HPLC chromatograms of impurities (0.1 – 2.0 µg/mL)

103
Figure 12 Gefitinib and impurities correlation graph
Limit of detection and limit of quantification
LOD and LOQ method for each impurity was estimated using S/N ratio. LOD and LOQ
for gefitinib and its process related impurities were in the range 0.012 - 0.033 and
0.04 – 0.10 µg/mL respectively. (Table 11)
Table 11 Limit of detection and limit of quantification
Compound G0 G1 G2 G3 G4 G
LOD, µg/mL 0.033 0.02 0.014 0.012 0.013 0.019
LOQ, µg/mL 0.10 0.06 0.05 0.04 0.04 0.06
Accuracy
Accuracy of the method was estimated by performing the recovery study at four
concentration levels for impurities (0.1, 0.5, 1.0 & 2.0 µg/mL) and gefitinib (25, 100, 200
& 500 µg/mL). Recovery values of five process-related impurities ranges from 95.99 –
100.55% and RSD values ranges from 0.26 – 2.59%. Similarly, the recovery values for

104
assay of gefitinib ranges from 98.26 – 99.90% and RSD values were in the range 0.30 –
1.35%. Results indicate that the developed method has good accuracy for estimation of
gefitinib and its process-related impurities. Values are recorded in table 12.
Table 12 Accuracy dataa
Compound Spiked quantity, µg / mL
Found quantity, ± SD, µg / mL
Recovery,%
%,RSD
G0 0.1 0.096 ± 0.001 95.99 0.93 0.5 0.491 ± 0.004 98.29 0.75 1 0.982 ± 0.016 98.21 1.63 2 2.000 ± 0.008 100.03 0.4
G1
0.1
0.097 ± 0.003
97.15
2.59 0.5 0.493 ± 0.003 98.7 0.6 1 0.996 ± 0.012 99.65 1.24 2 2.006 ± 0.012 100.32 0.62
G2
0.1
0.098 ± 0.002
98.18
2.05 0.5 0.490 ± 0.004 98.07 0.91 1 0.997 ± 0.007 99.79 0.74 2 1.999 ± 0.003 99.97 0.16
G3
0.1
0.098 ± 0.001
98.67
1.26 0.5 0.486 ± 0.008 97.38 1.57 1 1.005 ± 0.015 100.52 1.47 2 1.994 ± 0.006 99.74 0.31
G4
0.1
0.100 ± 0.002
100.32
2.35 0.5 0.487 ± 0.009 97.5 1.75 1 1.002 ± 0.003 100.21 0.26 2 2.011 ± 0.008 100.55 0.41
G
25
24.56 ± 0.33
98.26
1.35 100 99.12 ± 1.07 99.13 1.08 200 199.79 ± 1.00 99.90 0.50 500 498.6 ± 1.52 99.72 0.53
a. n = 3, average of three determinations

105
Precision
Precision of the method was expressed in terms of repeatability (intra-day) and
intermediate (inter-day) precision. The repeatability of the method for estimation of
process-related impurities were expressed in terms of RSD and it ranges from 0.16 –
2.59% and the intermediate precision studied over the period of three days ranges from
1.09 – 2.94%. Repeatability of the method for assay of gefitinib ranges from 0.30 –
1.35% and the intermediate precision intermediate precision studied over the period of
three days ranges from 0.22 – 1.38%. Above values indicate that the method has good
precision for estimation of process-related impurities and assay of gefitinib. The
repeatability and intermediate precision values were recorded in Table 13.
Table 13 Precision data
Compound Spiked quantity,
µg / mL Intra-day precision,
%RSD (n=3) Inter-day precision,
%RSD ( n=9)
G0 0.1 0.93 1.92 1 1.63 2.88 2 0.40 1.77
G1 0.1 2.59 2.94
1 1.24 1.47 2 0.62 1.17
G2 0.1 2.05 2.77
1 0.74 1.97 2 0.16 1.53
G3 0.1 1.24 1.31
1 1.47 1.76 2 0.31 1.63
G4 0.1 2.35 2.44
1 0.26 1.31 2 0.41 1.09
G 25 1.35 1.38
100 1.08 1.2 200 0.50 1.14
500 0.30 0.22

106
Robustness
Small but deliberate variations in the HPLC parameters were made to verify the
robustness of the analytical method. Robustness was studied by varying ±0.2 mL of flow
rate, ±2mL of acetonitrile composition in mobile phase, ±2°C in column temperature and
±0.2 pH to the actual method parameters. There was a slight change in the retention times
of gefitinib and its impurities upon changing the mobile-phase concentration, but all
peaks were well separated without affecting the accuracy of the quantitative estimation of
gefitinib and the impurities. When mobile phase pH was kept at 5.2 there was a slight
change in the relative retention time (RRT) values of compounds was observed. When
acetonitrile composition of mobile phase was decreased to 35% there was a visible
change in the RRT values of compounds. There was no significant change in RRT values
observed upon changing the flow rate and the temperature. The capacity factor (CF)
remained almost same under modified flow rate, temperature, mobile phase composition
and pH. The results indicated that the method is suitable for the separation and estimation
of gefitinib and its process-related impurities. The RRT and CF values are recorded in
table 14.
Table 14 Robustness data
Parameter G0 G1 G2 G3 G4 G RRT CF RRT CF RRT CF RRT CF RRT CF RRT CF
Flow rate(mL/min) 0.8 0.461 38.22 0.515 42.84 0.609 50.84 0.793 66.56 0.344 28.33 1.000 64.16 1.0 0.460 31.11 0.516 35.02 0.611 41.63 0.795 54.43 0.345 23.07 1.000 68.76 1.2 0.457 24.78 0.511 27.87 0.606 33.20 0.788 43.52 0.342 18.31 1.000 55.46 Temperature( °C) 28 0.454 30.36 0.509 34.16 0.600 40.49 0.776 52.65 0.341 22.57 1.000 68.12 30 0.460 31.11 0.516 35.02 0.611 41.63 0.795 54.43 0.345 23.07 1.000 68.76 32 0.455 30.32 0.509 34.09 0.602 40.46 0.779 52.65 0.341 22.50 1.000 67.90 Acetonitrile in mobile phase (%) 35 0.366 33.38 0.422 38.57 0.518 47.64 0.653 60.26 0.265 23.85 1.000 72.83 37 0.460 31.11 0.516 35.02 0.611 41.63 0.795 54.43 0.345 23.07 1.000 68.76 39 0.468 31.00 0.520 34.52 0.613 40.88 0.803 53.86 0.350 22.89 1.000 67.30 pH of mobile phase 4.8 0.486 31.50 0.551 35.87 0.648 42.38 0.836 54.93 0.369 23.71 1.000 65.92 5.0 0.460 31.11 0.516 35.02 0.611 41.63 0.795 54.43 0.345 23.07 1.000 68.76 5.2 0.366 32.14 0.418 36.90 0.517 45.83 0.644 57.34 0.265 23.04 1.000 69.60 RRT- Relative retention time CF- Capacity factor
107
Stability of solutions
The HPLC analysis of the solutions stored in refrigeration and room temperature for 1, 3
and 5 days did not show any significant changes in the assay values, hence indicating the
stability of gefitinib and its process-related impurities in solutions up to five days.
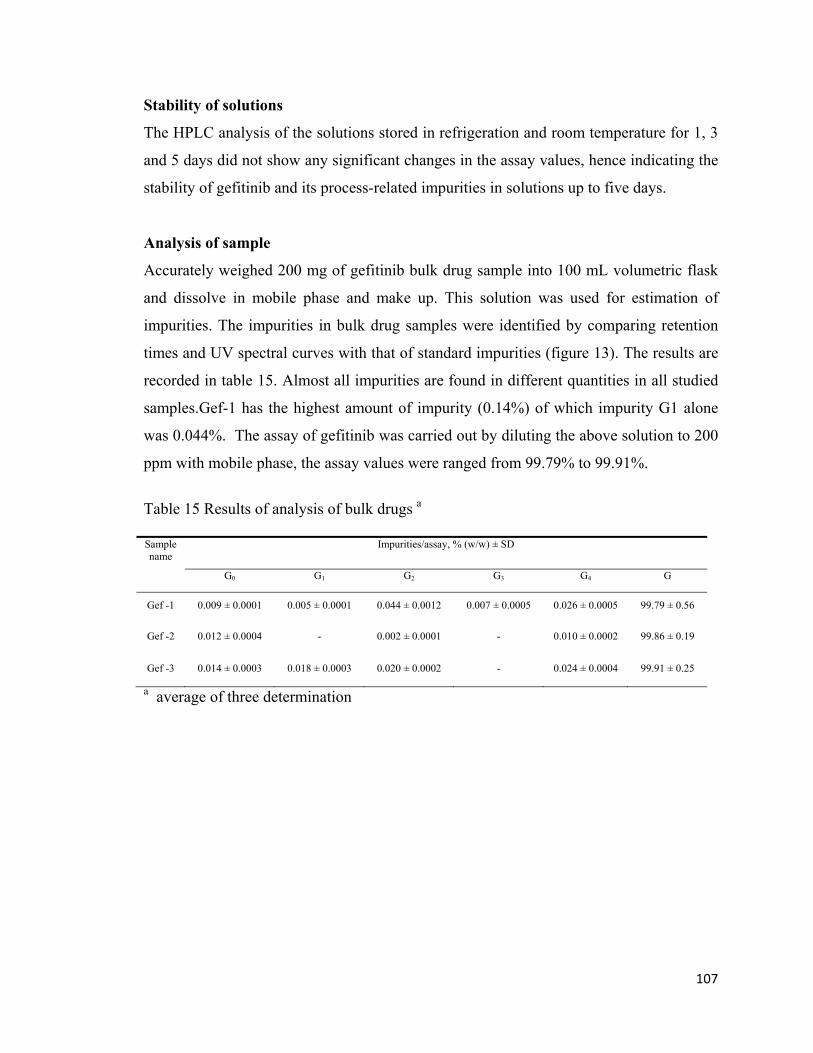
Analysis of sample
Accurately weighed 200 mg of gefitinib bulk drug sample into 100 mL volumetric flask
and dissolve in mobile phase and make up. This solution was used for estimation of
impurities. The impurities in bulk drug samples were identified by comparing retention
times and UV spectral curves with that of standard impurities (figure 13). The results are
recorded in table 15. Almost all impurities are found in different quantities in all studied
samples.Gef-1 has the highest amount of impurity (0.14%) of which impurity G1 alone
was 0.044%. The assay of gefitinib was carried out by diluting the above solution to 200
ppm with mobile phase, the assay values were ranged from 99.79% to 99.91%.
Table 15 Results of analysis of bulk drugs a
Sample name
Impurities/assay, % (w/w) ± SD
G0 G1 G2 G3 G4 G
Gef -1 0.009 ± 0.0001 0.005 ± 0.0001 0.044 ± 0.0012 0.007 ± 0.0005 0.026 ± 0.0005 99.79 ± 0.56
Gef -2 0.012 ± 0.0004 - 0.002 ± 0.0001 - 0.010 ± 0.0002 99.86 ± 0.19
Gef -3 0.014 ± 0.0003 0.018 ± 0.0003 0.020 ± 0.0002 - 0.024 ± 0.0004 99.91 ± 0.25
a average of three determination

108
Figure 13 Comparative UV patterns of impurities in standard and bulk drug

109
3.1.4 CONCLUSION
A simple, fast and cost effective nonaqueous titration method was developed and
validated for assay of gefitinib in gefitinib bulk drug. The developed titrimetric methods
showed good linearity in the range 10-100 mg, the RE values were <1.5% indicated good
accuracy of the methods and the RSD values were <2.0% indicated that methods were
precise. The titrimetric methods were successfully used for assay of gefitinib in gefitinib
bulk drug. The impurities present in gefitinib bulk drug were isolated using preparative
HPLC and characterized using spectroscopic techniques. Also, a simple, selective and
fast reverse phase-HPLC method was developed and validated for simultaneous
estimation of gefitinib and its process-related impurities formed during the above
mentioned synthesis of gefitinib bulk drug. The LOD and LOQ of the method is <0.033
and <0.1 μg/mL for all process related impurities and gefitinib. The recovery values were
within specified range of 90-110% and precision values are <3% indicated that method
has good accuracy and precision. The developed method was successfully used for
estimation of traces of process related impurities in gefitinib bulk drug along with
gefitinib.
3.1.5 MATERIALS AND METHODS
3.1.5.1 Titrimetric methods for estimation of gefitinib
3.1.5.1.1 Reagents and chemicals
All reagents were of analytical grade unless stated otherwise. Analytical grade acetic acid
(99%), mercuric acetate, and crystal violet dye were procured from MERCK India Ltd
(India). Gefitinib (99.9%) (G) was obtained from in-house research facilities of Vittal
Mallya Scientific Research Foundation, Bangalore.

110
3.1.5.1.2 Apparatus
Potentiometric titration was performed with an Elico 120 digital pH meter provided with
a combined glass-SCE system. The KCl of the salt bridge was replaced with 0.1 M
lithium perchlorate in glacial acetic acid.
3.1.5.1.3 Preparation of solutions
Preparation of 0.02 N perchloric acid
The 0.02 N perchloric acid was prepared by diluting 100 mL of 0.1 N solution to 500 mL
by acetic acid (the 0.1 N perchloric acid was prepared as discussed in chapter IIA). This
solution was standardized using potassium hydrogen phthalate before use.
Preparation of gefitinib standard solution
About 1000 mg of gefitinib standard was accurately weighed into a dry 100 mL
volumetric flask and dissolved in acetic acid. This 10 mg/mL G solution was used for
validation study.
3.1.5.1.4 General methods
Estimation of gefitinib by visual titration method
Accurately weighed 10 - 100 mg of gefitinib (G) into a clean and dry 100 mL titration
flask and dissolved in 25 mL of glacial acetic acid. Then, 2-3 drops of crystal violet
indicator was added and titrated with 0.02 N perchloric acid until the color changes from
blue to emerald green.
A blank titration was performed in the same manner without G, and the necessary volume
corrections were made. Each mL of 0.02 N perchloric acid equivalents to 4.469 mg of
gefitinib.
Assay, %w/wV x N x Mw x 100
W x 0.02
Where, V - volume of perchloric acid consumed in mL, Mw - relative molecular mass of the drug
111
N - normality of the perchloric acid W- weight of sample in mg
The method was validated for linearity, accuracy, precision and robustness as per ICH
guidelines.
Estimation of gefitinib by potentiometric titration method:
Accurately weighed 10 - 100 mg of gefitinib (G) into a clean and dry 100 mL titration
flask and dissolved in 25 mL of glacial acetic acid. The combined glass-SCE (modified)
system was dipped in the solution. The contents were stirred magnetically and the titrant
(0.02 M HClO4) was added from a micro burette. Near the equivalence point, titrant was
added in 0.05 mL increments. After each addition of titrant, the solution was stirred
magnetically for 30 s and the steady potential was noted. The addition of titrant was
continued until there was no significant change in potential on further addition of titrant.
The equivalence point was determined by applying the graphical method.
Assay, % w/wV x N x Mw x 100
W x 0.02
Where, V - volume of perchloric acid consumed in mL, Mw - relative molecular mass of the drug N - normality of the perchloric acid W- weight of sample in mg
The method was validated for linearity, accuracy, precision and robustness as per ICH
guidelines.
3.1.5.2 Isolation and characterization impurities and development of HPLC method
for simultaneous estimation of gefitinib and its process related impurities
3.1.5.2.1 Reagents and chemicals
All reagents were of analytical grade unless stated otherwise. HPLC-grade water was
provided by a Milli-Q® water purification system, Millipore Corporation (USA), HPLC-

112
grade acetonitrile, acetic acid and ammonium acetate procured from MERCK India Ltd
(India), Gefitinib (G) and process-related impurities (G0,G1,G2,G3 & G4) were obtained
from in-house research facilities of Vittal Mallya Scientific Research Foundation,
Bangalore.
3.1.5.2.2 Apparatus
The analytical HPLC, preparative HPLC, GC-MS, IR spectrophotometer, photostability
chamber, pH meter and ultrasonic cleaner were used in analysis. (Detailed discussion on
instruments is provided in chapter IIA)
3.1.5.2.3 Chromatographic conditions
The mobile phase was 1% ammonium acetate and acetonitrile (63:37, v/v) adjusted to pH
5 using acetic acid; before delivering into the column it was filtered through 0.45 μm
nylon filter (Millipore) and degassed. The analysis was carried out under isocratic
condition using flow rate 1.0 mL/min at 30°C. Chromatograms were recorded at 260 nm
using PDA detector. For isolation of impurities using preparative HPLC the flow rate was
kept at 17 mL/min.
3.1.5.2.4 Preparation of standard and sample solution
Solutions of (1000 μg/mL) gefitinib (G) and its process intermediates G0, G1, G2, G3 &
G4 were prepared by dissolving known amounts of components in acetonitrile. These
solutions were further diluted with mobile phase to determine the accuracy, precision,
linearity, LOD and LOQ.
Sample solution of gefitinib bulk drug (2000 μg/mL) was prepared by dissolving an
appropriate amount in mobile phase.
3.1.5.2.5 Method validation
The developed HPLC method was validated for specificity, linearity, precision, accuracy,
limit of detection, limit of quantification, robustness and solution stability as per ICH
guidelines as discussed in Chapter IIA.

113
3.1.6 EXPERIMENTAL SECTION
3.1.6.1 Isolation of the impurities by preparative HPLC
The chromatographic conditions mentioned previous section was used for isolating the
impurities using preparative HPLC. About 5 g of gefitinib bulk drug was dissolved in 50
mL of acetonitrile and 0.2 mL of the solution was injected to preparative HPLC and
fraction corresponding to each impurity was collected separately. In this solvent system,
the impurities G4, G0, G1, G2, and G3 were eluting at 2.3, 3.1, 3.5, 4.1, and 5.4 min
respectively. 100 injections were made and fractions were collected each time and pooled
(850 mL). The fractions collected were concentrated to remove acetonitrile and aqueous
layer (500 mL) containing impurities were re-extracted with (100 x 3) mL of ethyl
acetate. The ethyl acetate layer containing impurities were dried over anhydrous sodium
sulphate. The evaporation of ethyl acetate yielded individual components in pure form (8
mg).
3.1.3.2.3 Characterization of impurities
The impurities isolated using preparative HPLC were characterized by recording IR
spectra, mass spectra, UV spectra and melting point.
Impurity G0
Off-white solid
mp: 112-115 °C (lit. 113-116 °C)2
UV: λ max 235, 276, 306 nm
IR (KBr): 740, 785, 815, 882, 1015, 1109, 1246, 1432, 1501, 1586, 1695, 2910,
3206 cm-1
GC-MS (DI, m/z, Spectra 3.1.1): 152 (M+)
Impurity G1
Brown colored liquid
UV: λ max 230, 254, 286 nm

114
IR (thin film): 706, 802, 845, 1006, 1105, 1116, 1240, 1256, 1386, 1418, 1505, 1586,
1691, 2832, 2989 cm-1
GC-MS (DI, m/z, Spectra 3.1.2): 279 (M+)
Impurity G2
Brown colored liquid.
UV: λ max 224, 251, 337 nm
IR(thin film): 805, 886, 1008, 1105, 1120, 1240, 1252, 1315, 1504, 1603, 2225, 2856,
3010 cm-1
GC-MS (DI, m/z, Spectra 3.1.3): 276 (M+)
Impurity G3
Yellow colored solid
mp: 135-140 °C (lit. 137-141°C) 2
UV: λ max 236, 277, 313 nm
IR (KBr): 729, 786, 845, 868, 970, 1035, 1106, 1226, 1301, 1356, 1496, 1510, 1583,
1745, 2230, 2805, 2930 cm-1
GC-MS (DI, m/z, Spectra 3.1.4): 321 (M+)
Impurity G4
Brown colored solid
mp: 219-222 °C (lit. 218-220 °C) 2
UV: λ max 224, 241, 280, 308, 320 nm
IR (KBr): 740, 785, 809, 860, 965, 1056, 1109, 1203, 1265, 1285, 1350, 1423, 1499,
2102, 2184, 2805, 3105 cm-1
GC-MS (DI, m/z, Spectra 3.1.5): 319 (M+)

115
3.1.7 BIBLIOGRAPHY
1. Sordella, R.; Bell, D. W.; Haber, D. A.; Settleman, J. Science 2004, 305, 1163–1167.
2. Chandrasekara Reddy, G.; Chandregowda, V.; Venkateswara Rao, G.; Chandrasekara
Reddy, G. Heterocycles 2007, 71, 39.
3. Chandregowda, V.; Rao, G. V.; Reddy, G. C. Synth. Commun. 2007, 37, 3409–3415.
4. Ratnakumari, A.; Rajeswari, A.; Shobha, K. Pharmanest 2010, 1, 118-122.
5. Pravalika Reddy, P.; Murali Balaram, V.; Krishna Mohan, G. Int. J. chemical sciences
and research 2012, 2, 1-8
6. Kumar, V. K.; Raju, N. A.; Begum, S.; Rao, J. S.; Satyanarayana, T. Res. J. Pharm.
Technol. 2009, 2, 341–343.
7. Faivre, L.; Gomo, C.; Mir, O.; Taieb, F.; Schoemann-Thomas, A.; Ropert, S.; Vidal,
M.; Dusser, D.; Dauphin, A.; Goldwasser, F.; Blanchet, B. J. Chromatogr. B Analyt.
Technol. Biomed. Life. Sci. 2011, 879, 2345–2350.
8. Bai, F.; Iacono, L. C.; Johnston, B.; Stewart, C. F. J. Liq. Chromatogr. Relat. Technol.
2005, 27, 2743–2758.
9. Guetens, G.; Prenen, H.; De Boeck, G.; Van Dongen, W.; Lemière, F.; van Oosterom,
A. T.; Schöffski, P.; de Bruijn, E. A. J. Chromatogr. A 2005, 1082, 2–5.
10. Wang, L.-Z.; Lim, M. Y.-X.; Chin, T.-M.; Wong, A.; Chan, S.-Y.; Goh, B. C.; Ho, P.
C. J. Chromatogr. B Analyt. Technol. Biomed. Life. Sci. 2011, 879, 2155–2161.

116
Spectra 3.1.1: Mass spectra of impurity G0
Spectra 3.1.2: Mass spectra of impurity G1

117
Spectra 3.1.3: Mass spectra of impurity G2
Spectra 3.1.4: Mass spectra of impurity G3

118
Spectra 3.1.5: Mass spectra of impurity G4

119
Chapter III B
HPLC method for simultaneous estimation of gefitinib
(Iressa®) and its process-related impurities formed in
7-methoxy-6-[3-(4-morpholinyl)propoxy]-4-quinazoline-
thione route: Detection and identification of new N-oxide
impurity

120
3.2.1 INTRODUCTION
Herein we describe isolation and characterization of impurities present in the gefitinib
bulk drug made by quinazoline-thione route and also HPLC method for simultaneous
estimation of gefitinib and its impurities. The raw materials and intermediates formed
during the reaction may be present in the final product as impurity. According to US
FDA any impurity above 0.1% has to be identified and quantified using validated
analytical methods. HPLC is the technique of choice for separation and estimation of
related impurities in pharmaceutical formulations. Literature survey has indicated several
HPLC methods for estimation of gefitinib in biological fluids and finished products using
UV and mass detectors.1–6 Further the HPLC method developed in chapter IIIA was not
suitable as some of the intermediates under this new route merge with each other. Hence
there needed a further refinement of HPLC method which is the subject matter of this
chapter.
3.2.2 IMPORTANCE OF PRESENT WORK
The identification and quantification of process-related impurities is of greater
importance in order to develop drug master file of this drug for possible use of it in
various formulations. In the present study, the impurities present in gefitinib bulk drug
made via quinazoline-thione route were isolated using preparative HPLC and
characterized using spectroscopic techniques. Also, we have developed RP-HPLC
method for separation and estimation of gefitinib and its process-related impurities. The
developed HPLC method was validated for specificity, linearity, precision, limit of
detection, limit of quantification and ruggedness as per ICH guidelines.
121
3.2.3 RESULTS AND DISCUSSION
3.2.3.1 Isolation and characterization of impurities
The impurities present in gefitinib bulk drug were isolated using preparative HPLC and
purified by extraction and concentration. The mass spectra, IR spectra, UV spectra and
melting points were recorded for purified compounds. Further, 1H NMR and 13C NMR
was recorded for structure elucidation of new impurity G-NO.
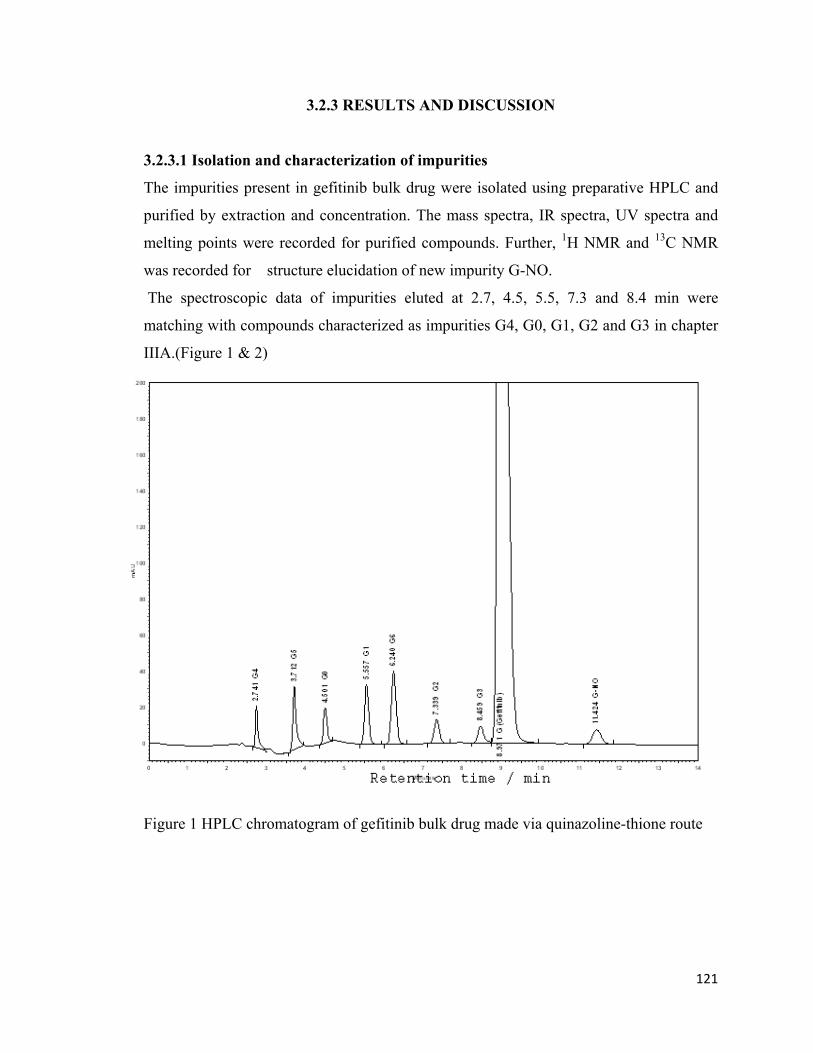
The spectroscopic data of impurities eluted at 2.7, 4.5, 5.5, 7.3 and 8.4 min were
matching with compounds characterized as impurities G4, G0, G1, G2 and G3 in chapter
IIIA.(Figure 1 & 2)
Figure 1 HPLC chromatogram of gefitinib bulk drug made via quinazoline-thione route

122
HO
H3CO
CHOO
H3CO
CHON
O
O
H3CO
CNN
O
O
H3CO
CN
NO2
N
O
O
H3CO
NH
N
ON
O
G0 G1 G2
G3 G4
O
H3CO
N
N
S CH3N
O
O
H3CO
N
N
HN
F
ClN
O
G (Gefitinib)
O
H3CO
NH
N
SN
O
G6
G5
Figure 2 Structures of process-related impurities of gefitinib
Impurity G5
The peak eluting at 3.7 min in HPLC chromatogram yielded pale yellow colored powder.
The GC-MS analysis exhibited molecular ion peak at m/z 335(M+). The IR and UV-
spectra and melting point of isolated compound matched with the standard 7-methoxy-6-
[3-(4-morpholinyl)propoxy]quinazolin-4(3H)-thione (G5).
Impurity G6
The peak eluting at 6.2 min in HPLC chromatogram yielded pale yellow colored powder.
The GC-MS analysis exhibited molecular ion peak at m/z 349(M+). The IR and UV-
spectra and melting point of isolated compound matched with the standard 7-methoxy-4-
(methylthio)-6-[3-(4-morpholinyl)propoxy]quinazoline (G6).
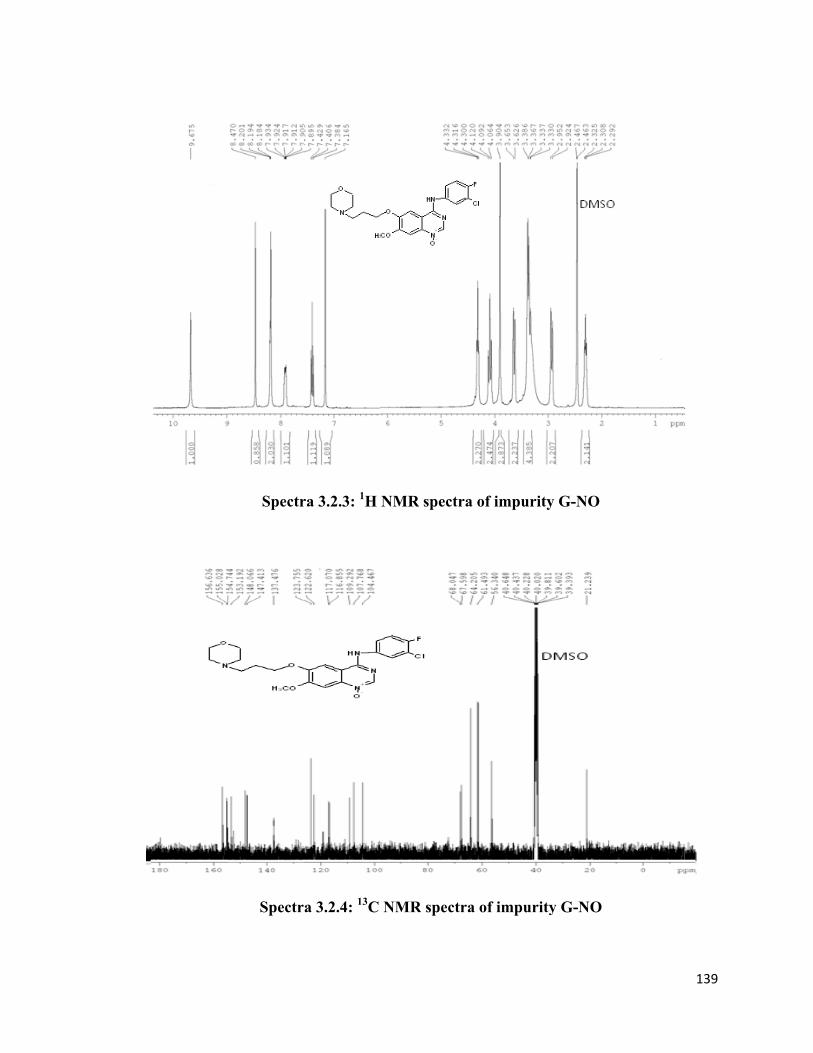
Impurity G-NO
The peak eluting at 11.4 min in HPLC chromatogram yielded yellow colored powder. IR
spectrum showed a peak at 1210 cm-1 indicating the presence of N-oxide group. Further,
mass spectrum showed M+ peak at m/z 462 which is 16 mass units more than the parent
molecule gefitinib. In NMR spectrum the central –CH2- protons of propyl group were

123
observed as multiplet at δ 2.30 and a singlet at δ 3.90 indicating the presence of one
aromatic methoxy group. The six protons of 3 x -N-CH2- appeared between δ 2.92-3.38
and two protons each of 3 x -O-CH2- were observed as multiplet at δ 3.64 and as triplets
at δ 4.09 and 4.31. The six aromatic protons on aniline and quinazoline ring were
observed between δ 7.16 - 8.47 and a singlet was observed at δ 9.67 for –NH proton. Six
peaks observed in 13C NMR in the range of δ 21.23 to 68.04 indicating primary and
secondary alkyl carbons and 14 aromatic carbon peaks in the range of δ 104.46 to 156.63
clearly indicated all structural features of quinazoline molecule present in gefitinib.All
this data indicated that the impurity is gefitinib N-oxide and it is known that in 4-
substituted quinazolines, 1 N-oxides are favoured products over 3 N-oxides due to
stability and steric factors. (Reference: M.Uchida, T.Higashino and E.Hayashi; Mass
Spectrometry Vol.21, 245-254 (1973).7 Thus it was characterized as 4-[3-chloro-4-
fluourophenyl)amino]-7-methoxy-6-[3(4-morphonyl)propoxy]quinazoline-1-N-oxide (G-
NO). Further the structure was confirmed by synthesizing it from gefitinib using meta
chloroperbenzoic acid and comparing the melting point and HPLC chromatograms with
that of isolated compound. (Figure 3)
O
H3CO
N
N+
NH Cl
O-
F
N
O
Figure 3 Structure of gefitinib N-oxide (G-NO)
124
3.2.3.2 Development of HPLC method for estimation of gefitinib and its process
related impurities
3.2.3.2.1 Optimization of chromatographic conditions
There are seven process impurities present in gefitinib bulk drug made from quinazoline-
thione route. The present study is aimed at developing a chromatographic system which
will separate all process-related impurities of gefitinib. All impurities and gefitinib
subjected to separation by reverse-phase HPLC with different columns, using different
buffer systems, with different pH and organic modifiers. With Inertsil-ODS-3V (250 X
4.6 mm, 5 µm) column, using mobile phase 1% ammonium acetate and acetonitrile
(63:37 v/v) with pH 58 there was good separation of G2, G3, G4, but G0 peak was merged
with G5, also G6 peak was merging with G1 and G was eluting at higher retention.
When mobile phase composition was changed to 70:30,( v/v) (pH 5), there was little
improvement in the separation but G was eluting at further higher retention. Even though
polarity of mobile phase was varied by adding 5% methanol, i.e. buffer: acetonitrile:
methanol (70:25:5, v/v/v) (pH 5), though the gefitinib eluted at relatively lower retention
but there was not much improvement in the separation of merging peaks. By several
modifications in the mobile phase ingredients and by varying pH, finally we have arrived
at the correct mobile phase which consisted of 0.05 M ammonium acetate, acetonitrile
and methanol (70:25:5, v/v/v) (pH 4.1). Retention times of G0 was at 4.1 min, G1 at 5.1
min, G2 at 6.1 min, G3 at 8.1 min, G4 at 2.9 min G5 at 3.6 min, G6 at 5.6 min and G at 9.1
min. A typical chromatogram of gefitinib spiked with 25 ppm of each process-related
impurity is shown in figure 4. It is evident from figure 4, that all compounds were eluted
and separated with good peak shape and resolution. The UV wavelength at 260 nm was
chosen for the detection and quantification, since the gefitinib and its impurities have
good absorption at that wavelength. The peaks were identified by injecting and
comparing retention times of the individual compounds and studied absorption spectra
using PDA detector.
125
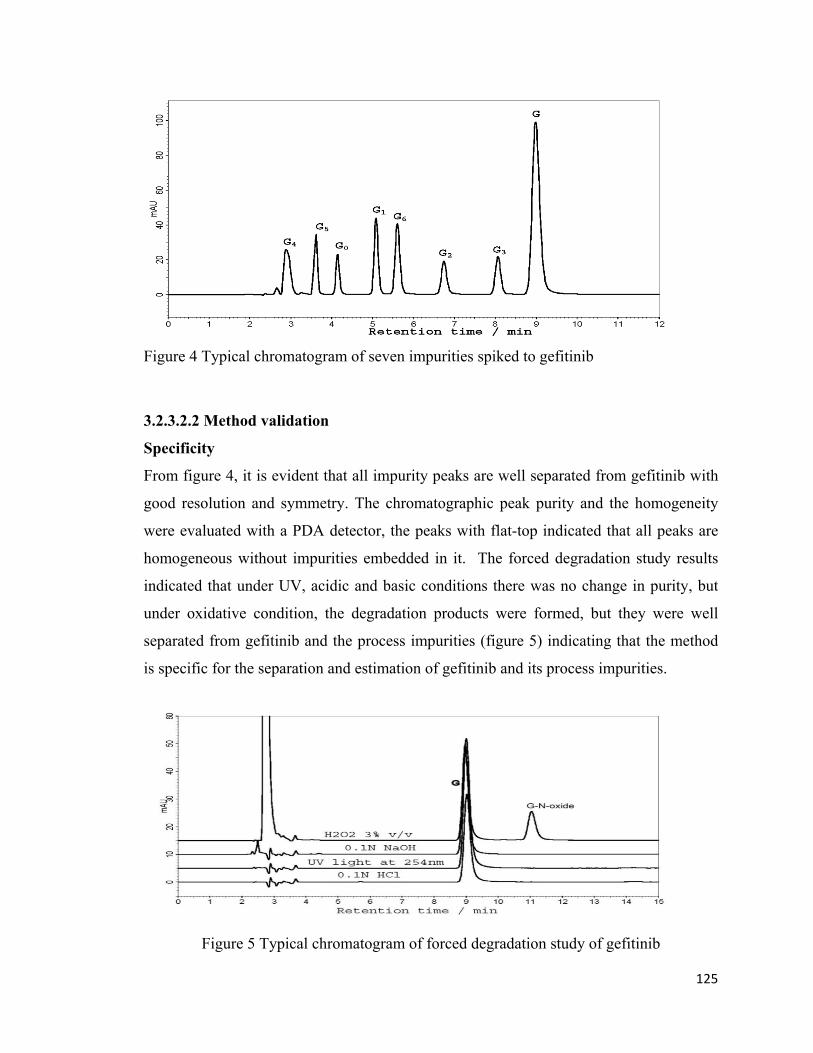
Figure 4 Typical chromatogram of seven impurities spiked to gefitinib
3.2.3.2.2 Method validation
Specificity
From figure 4, it is evident that all impurity peaks are well separated from gefitinib with
good resolution and symmetry. The chromatographic peak purity and the homogeneity
were evaluated with a PDA detector, the peaks with flat-top indicated that all peaks are
homogeneous without impurities embedded in it. The forced degradation study results
indicated that under UV, acidic and basic conditions there was no change in purity, but
under oxidative condition, the degradation products were formed, but they were well
separated from gefitinib and the process impurities (figure 5) indicating that the method
is specific for the separation and estimation of gefitinib and its process impurities.
Figure 5 Typical chromatogram of forced degradation study of gefitinib

126
System suitability
System suitability parameters were evaluated by five replicate injection of solution
containing 1.0% of each impurity in gefitinib at specification level (100 μg/mL). The
RSD values calculated for retention time was in the range 0.13 – 1.61, theoretical plates
in the range 0.14 – 1.61 and tailing factor in the range 0.48 – 1.59 respectively. It is
evident from results that, the parameters evaluated were within the acceptable range
(RSD < 2%), indicating, the system was suitable for estimation of gefitinib and its
process-related impurities. System suitability parameters are recorded in table 1.
Table 1 System suitability dataa
Compound Name
Abbriv
tR/min
Tailing Theoretical
plates ations factor
Isovanillin G0 4.18 ± 0.51 1.09 ± 1.06 9615 ± 1.61
4-Methoxy-3-[3-(4-morpholinyl)
propoxy] benzaldehyde G1 5.12 ± 1.61 1.14 ± 0.51 11343 ± 0.13
4-Methoxy-3-[3-(4-morpholinyl)
propoxy]-2-benzonitrile G2 6.08 ± 0.47 1.10 ± 1.37 12182 ± 0.60
4-Methoxy-5-[3-(4-morpholinyl)
propoxy]-2-nitrobenzonitrile G3 8.12 ± 0.13 1.10 ± 0.53 16134 ± 0.30
7-Methoxy-6-[3-(4-morpholinyl)
propoxy] quinazolin-4(3H)-one G4 2.89 ± 0.56 1.40 ± 1.59 3781 ± 0.14
7-Methoxy-6-[3-(4- morpholinyl)
propoxy] quinazolin-4(3H)-thione G5 3.64 ± 0.58 1.22 ± 1.22 6502 ± 1.25
7-Methoxy-4-(methylthio)-6-[3-(4-
morpholinyl) propoxy]quinazoline G6 5.65 ± 0.48 1.16 ± 1.49 9956 ± 0.46
Gefitinib G 9.06 ± 0.39 1.21 ± 0.48 10303 ± 1.38 a (n=5) average of five determinations ± RSD,%.
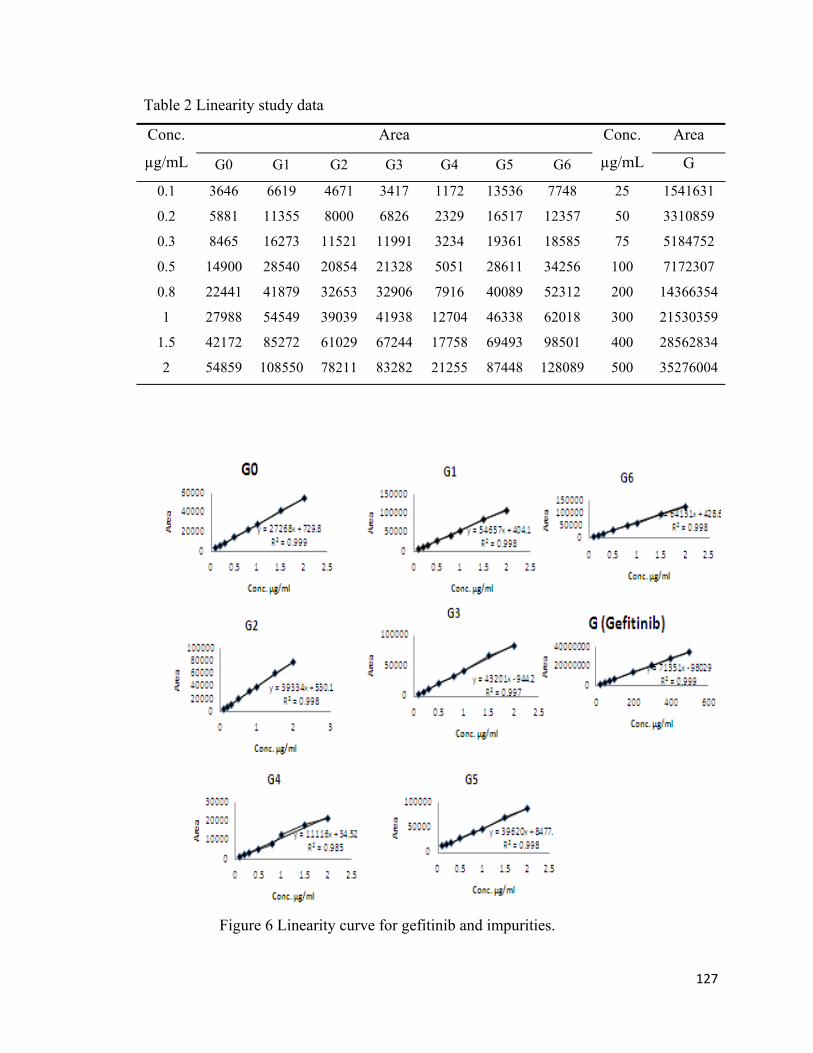
Linearity
All seven process-related impurities and gefitinib showed a linear response over the
concentration range tested (table 2), with correlation coefficient values in the range 0.995
– 0.998. The regression equation and correlation coefficients are shown in figure 6 and
HPLC chromatograms of impurities at eight concentrations were shown in figure 7.
127
Table 2 Linearity study data
Conc.
µg/mL
Area Conc.
µg/mL
Area
G0 G1 G2 G3 G4 G5 G6 G
0.1 3646 6619 4671 3417 1172 13536 7748 25 1541631
0.2 5881 11355 8000 6826 2329 16517 12357 50 3310859
0.3 8465 16273 11521 11991 3234 19361 18585 75 5184752
0.5 14900 28540 20854 21328 5051 28611 34256 100 7172307
0.8 22441 41879 32653 32906 7916 40089 52312 200 14366354
1 27988 54549 39039 41938 12704 46338 62018 300 21530359
1.5 42172 85272 61029 67244 17758 69493 98501 400 28562834
2 54859 108550 78211 83282 21255 87448 128089 500 35276004
Figure 6 Linearity curve for gefitinib and impurities.

128
Figure 7 HPLC chromatograms of impurities at eight concentrations (0.1 – 2.0 µg/mL)
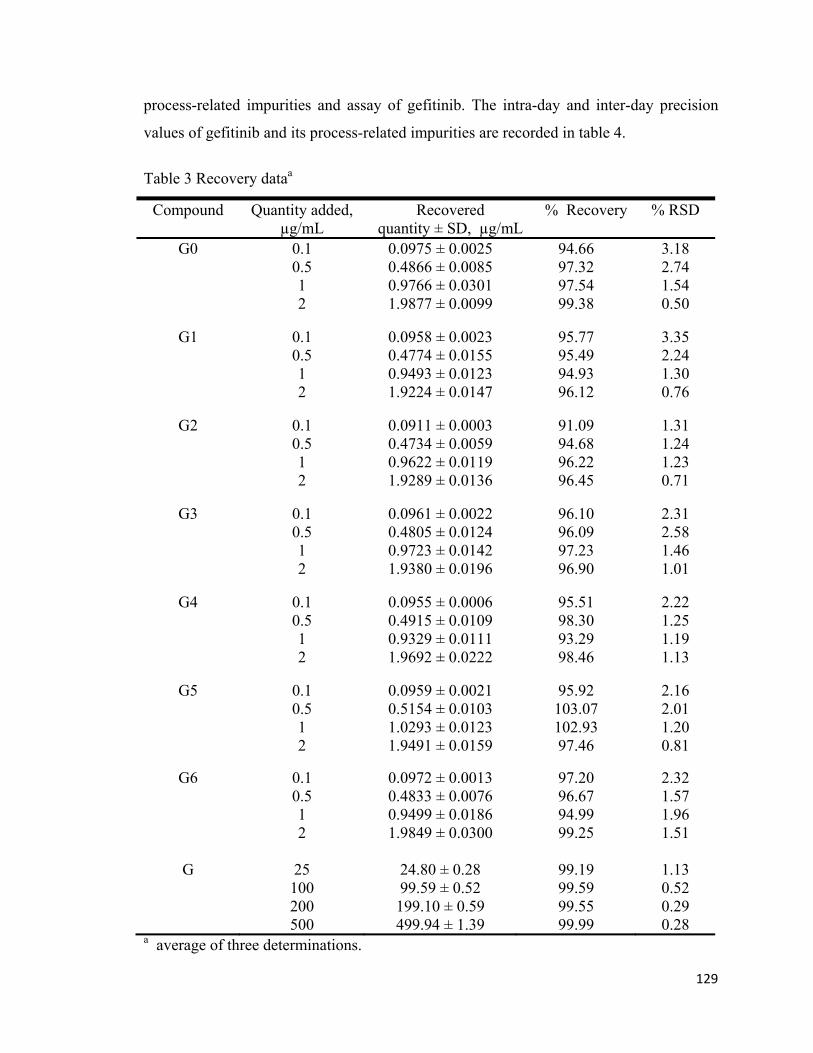
Accuracy
Accuracy of the method was estimated by performing the recovery study at four
concentration levels for impurities (0.1, 0.5, 1.0 & 2.0 µg/mL) and gefitinib (25, 100, 200
& 500 µg/mL). Recovery values of seven process-related impurities ranges from 91.09-
103.07% and RSD values ranges from 0.50-3.18%. Similarly, the recovery values for
assay of gefitinib ranges from 99.19-99.99% and RSD values were in the range 0.28-
1.13%. Results indicated that the developed method has good accuracy for estimation of
gefitinib and its process-related impurities. (Table 3)
Precision
The precision of the method for estimation of impurities and assay of gefitinib was
studied over period of three days. The intra-day precision of the method for estimation of
process-related impurities were expressed in terms of RSD and it ranges from 0.50 –
3.35% and the inter-day precision studied over the period of three days ranges from 1.32
– 4.04%. The intra-day precision of the method for assay of gefitinib ranges from 0.28 –
1.26% and the inter-day precision studied over the period of three days ranges from 0.29
– 1.43%. Above values indicates that the method has good precision for the estimation of
129
process-related impurities and assay of gefitinib. The intra-day and inter-day precision
values of gefitinib and its process-related impurities are recorded in table 4.
Table 3 Recovery dataa
Compound Quantity added, µg/mL
Recovered quantity ± SD, µg/mL
% Recovery % RSD
G0 0.1 0.0975 ± 0.0025 94.66 3.18 0.5 0.4866 ± 0.0085 97.32 2.74 1 0.9766 ± 0.0301 97.54 1.54 2 1.9877 ± 0.0099 99.38 0.50
G1 0.1 0.0958 ± 0.0023 95.77 3.35 0.5 0.4774 ± 0.0155 95.49 2.24 1 0.9493 ± 0.0123 94.93 1.30 2 1.9224 ± 0.0147 96.12 0.76
G2 0.1 0.0911 ± 0.0003 91.09 1.31 0.5 0.4734 ± 0.0059 94.68 1.24 1 0.9622 ± 0.0119 96.22 1.23 2 1.9289 ± 0.0136 96.45 0.71
G3 0.1 0.0961 ± 0.0022 96.10 2.31 0.5 0.4805 ± 0.0124 96.09 2.58 1 0.9723 ± 0.0142 97.23 1.46 2 1.9380 ± 0.0196 96.90 1.01
G4 0.1 0.0955 ± 0.0006 95.51 2.22 0.5 0.4915 ± 0.0109 98.30 1.25 1 0.9329 ± 0.0111 93.29 1.19 2 1.9692 ± 0.0222 98.46 1.13
G5 0.1 0.0959 ± 0.0021 95.92 2.16 0.5 0.5154 ± 0.0103 103.07 2.01 1 1.0293 ± 0.0123 102.93 1.20 2 1.9491 ± 0.0159 97.46 0.81
G6 0.1 0.0972 ± 0.0013 97.20 2.32 0.5 0.4833 ± 0.0076 96.67 1.57 1 0.9499 ± 0.0186 94.99 1.96 2 1.9849 ± 0.0300 99.25 1.51
G
25 24.80 ± 0.28 99.19 1.13 100 99.59 ± 0.52 99.59 0.52 200 199.10 ± 0.59 99.55 0.29 500 499.94 ± 1.39 99.99 0.28
a average of three determinations.

130
Table 4 Precision data
Comp ound
Quantity added, µg/mL
Intra-day precision, %RSD(n=3)
Inter-day precision, %RSD(n=9)
G0 0.1 3.18 3.51
1 1.54 1.45 2 0.50 1.32
G1 0.1
3.35 2.91 1 1.30 2.82 2 0.76 2.24
G2 0.1
1.31 2.13 1 1.23 2.98 2 0.71 1.47
G3 0.1
2.31 4.04 1 1.01 1.78 2 1.46 2.55
G4 0.1
2.22 3.80 1 1.19 3.41 2 1.13 3.10
G5 0.1
2.16 3.51 1 1.20 1.45 2 0.81 1.32
G6 0.1
3.18 4.11 1 2.54 2.34 2 0.50 1.43
G
25 1.26 1.43 100 0.58 0.61 200 0.41 0.59 500 0.28 0.29
Limit of detection and quantification
The S/N ratio method was used for estimation of LOD and LOQ of gefitinib and its
impurities. LOD and LOQ values of gefitinib and impurities were in the range of 0.011-
0.035 and 0.03-0.10 respectively. LOD and LOQ values are recorded in table 5.
131
Table 5 LOD and LOQ data
Compound G0 G1 G2 G3 G4 G5 G6 G
LOD, µg/mL 0.035 0.018 0.016 0.011 0.015 0.019 0.018 0.020
LOQ, µg/mL 0.10 0.05 0.05 0.03 0.04 0.06 0.05 0.06
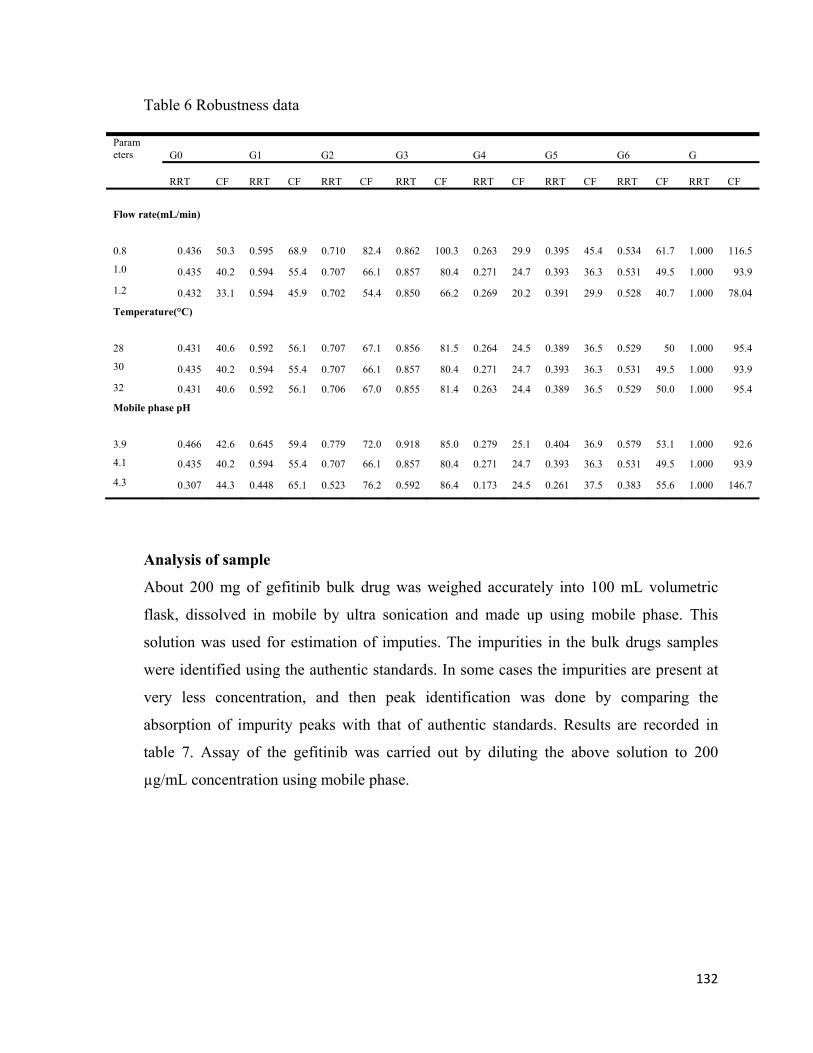
Robustness
Small but deliberate variations in the HPLC parameters were made to verify the
robustness of the analytical method. Robustness was studied by varying ±0.2 mL of flow
rate ±2°C in column temperature and ±0.2 pH to the actual method parameters. In all
specified variations, test samples were injected in triplicate. There was a slight change in
the retention times of gefitinib and its impurities upon changing the mobile-phase
concentration, but all peaks were well separated without affecting the accuracy of the
quantitative estimation of gefitinib and its impurities. When mobile phase pH was kept at
3.9 there is not much change in RRT and CF value of the compounds, but when pH was
changed to 4.3 there was a drastic change in the RRT values, this is due reason that the
retention time of gefitinib changes considerably with the increase in pH of mobile phase
and CF values remained same for all compounds except for gefitinib and there was no
observable change in the separation and assay results of impurities. By changing the
mobile phase flow rate and oven temperature, there was no significant change in RRT
and capacity factor values. The results indicate that the method is rugged and suitable for
the separation and estimation of gefitinib and its process-related impurities. The values
are recorded in table 6.
Stability of solutions
The HPLC analysis of the solutions stored in refrigeration and room temperature for 1, 3
and 5 days did not show any significant changes in the assay values, indicating the
stability of gefitinib and its process-related impurities in solutions up to five days.
132
Table 6 Robustness data
Param eters G0 G1 G2 G3 G4 G5 G6 G
RRT CF RRT CF RRT CF RRT CF RRT CF RRT CF RRT CF RRT CF
Flow rate(mL/min)
0.8 0.436 50.3 0.595 68.9 0.710 82.4 0.862 100.3 0.263 29.9 0.395 45.4 0.534 61.7 1.000 116.5
1.0 0.435 40.2 0.594 55.4 0.707 66.1 0.857 80.4 0.271 24.7 0.393 36.3 0.531 49.5 1.000 93.9
1.2 0.432 33.1 0.594 45.9 0.702 54.4 0.850 66.2 0.269 20.2 0.391 29.9 0.528 40.7 1.000 78.04
Temperature(°C)
28 0.431 40.6 0.592 56.1 0.707 67.1 0.856 81.5 0.264 24.5 0.389 36.5 0.529 50 1.000 95.4
30 0.435 40.2 0.594 55.4 0.707 66.1 0.857 80.4 0.271 24.7 0.393 36.3 0.531 49.5 1.000 93.9
32 0.431 40.6 0.592 56.1 0.706 67.0 0.855 81.4 0.263 24.4 0.389 36.5 0.529 50.0 1.000 95.4
Mobile phase pH
3.9 0.466 42.6 0.645 59.4 0.779 72.0 0.918 85.0 0.279 25.1 0.404 36.9 0.579 53.1 1.000 92.6
4.1 0.435 40.2 0.594 55.4 0.707 66.1 0.857 80.4 0.271 24.7 0.393 36.3 0.531 49.5 1.000 93.9
4.3 0.307 44.3 0.448 65.1 0.523 76.2 0.592 86.4 0.173 24.5 0.261 37.5 0.383 55.6 1.000 146.7
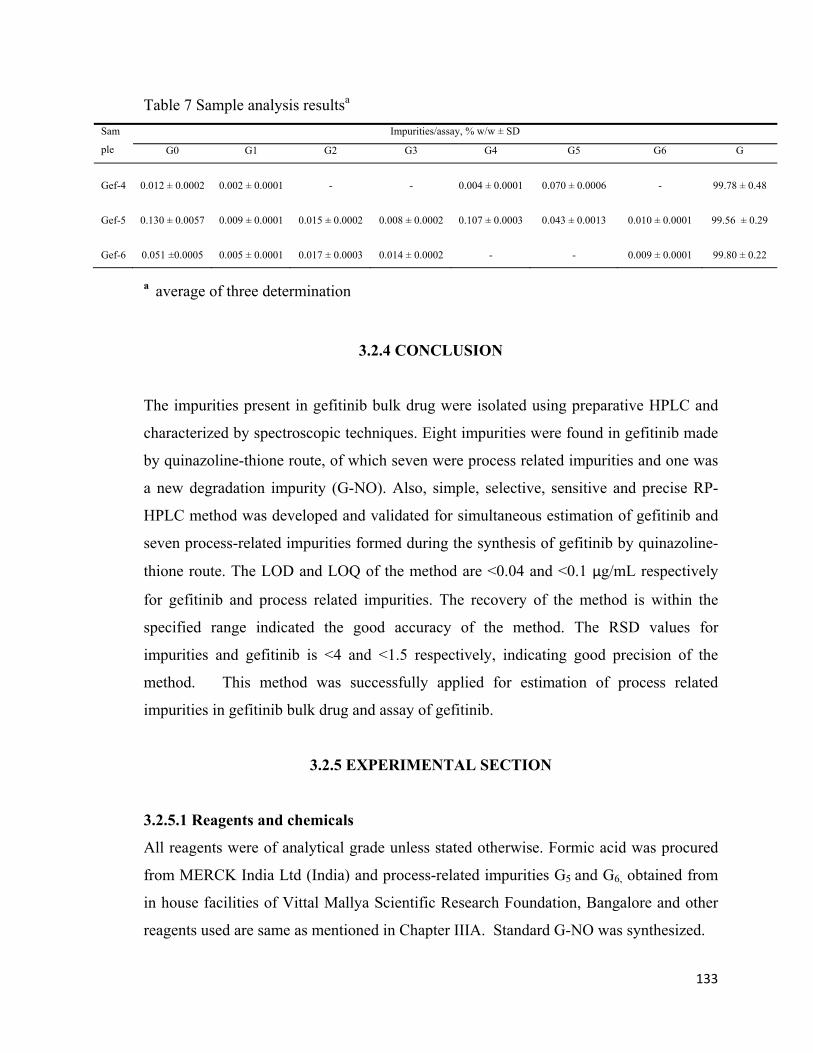
Analysis of sample
About 200 mg of gefitinib bulk drug was weighed accurately into 100 mL volumetric
flask, dissolved in mobile by ultra sonication and made up using mobile phase. This
solution was used for estimation of imputies. The impurities in the bulk drugs samples
were identified using the authentic standards. In some cases the impurities are present at
very less concentration, and then peak identification was done by comparing the
absorption of impurity peaks with that of authentic standards. Results are recorded in
table 7. Assay of the gefitinib was carried out by diluting the above solution to 200
µg/mL concentration using mobile phase.
133
Table 7 Sample analysis resultsa Sam
ple
Impurities/assay, % w/w ± SD
G0 G1 G2 G3 G4 G5 G6 G
Gef-4 0.012 ± 0.0002 0.002 ± 0.0001 - - 0.004 ± 0.0001 0.070 ± 0.0006 - 99.78 ± 0.48
Gef-5 0.130 ± 0.0057 0.009 ± 0.0001 0.015 ± 0.0002 0.008 ± 0.0002 0.107 ± 0.0003 0.043 ± 0.0013 0.010 ± 0.0001 99.56 ± 0.29
Gef-6 0.051 ±0.0005 0.005 ± 0.0001 0.017 ± 0.0003 0.014 ± 0.0002 - - 0.009 ± 0.0001 99.80 ± 0.22
a average of three determination
3.2.4 CONCLUSION
The impurities present in gefitinib bulk drug were isolated using preparative HPLC and
characterized by spectroscopic techniques. Eight impurities were found in gefitinib made
by quinazoline-thione route, of which seven were process related impurities and one was
a new degradation impurity (G-NO). Also, simple, selective, sensitive and precise RP-
HPLC method was developed and validated for simultaneous estimation of gefitinib and
seven process-related impurities formed during the synthesis of gefitinib by quinazoline-
thione route. The LOD and LOQ of the method are <0.04 and <0.1 μg/mL respectively
for gefitinib and process related impurities. The recovery of the method is within the
specified range indicated the good accuracy of the method. The RSD values for
impurities and gefitinib is <4 and <1.5 respectively, indicating good precision of the
method. This method was successfully applied for estimation of process related
impurities in gefitinib bulk drug and assay of gefitinib.
3.2.5 EXPERIMENTAL SECTION
3.2.5.1 Reagents and chemicals
All reagents were of analytical grade unless stated otherwise. Formic acid was procured
from MERCK India Ltd (India) and process-related impurities G5 and G6, obtained from
in house facilities of Vittal Mallya Scientific Research Foundation, Bangalore and other
reagents used are same as mentioned in Chapter IIIA. Standard G-NO was synthesized.
134
3.2.5.2 Apparatus
The analytical HPLC, preparative HPLC, GC-MS, IR spectrophotometer, photostability
chamber, pH meter and ultrasonic cleaner were used in analysis (Detailed discussion on
instruments is provided in chapter IIA). The NMR spectra were recorded in DMSO-d6
with TMS(tetra methyl silane) as internal standard at 400 Hz on a Bruker spectrometer.
3.2.5.3 Chromatographic conditions
The mobile phase consists of 0.05 M ammonium acetate, acetonitrile and methanol
(70:25:5, v/v/v) adjusted to pH 4.1 using formic acid. Before delivering into the column it
was filtered through 0.45 μm nylon filter (Millipore) and degassed. The analysis was
carried out under isocratic condition using flow rate 1.0 mL/min with oven temperature
30°C. Chromatograms were recorded at 260 nm using PDA detector. For isolation of
impurities using preparative HPLC the flow rate was kept at 17 mL/min.
3.2.5.4 Preparation of standard and sample solution
Known amounts of G, G0, G1, G2, G3, G4, G5 and G6 standards were dissoved in
acetonitrile to get 1000 µg/mL solutions. Above solutions were furher diluted with
mobile phase for validation study.
Sample solution of gefitinib bulk drug (2000 μg/mL) was prepared by dissolving an
appropriate amount in mobile phase.
3.2.5.5 Method validation
The HPLC method developed for simultaneous estimation gefitinib and its seven process
related impurities was validated for specificity, linearity, LOD, LOQ, precision,
accuracy, robustness and solution stability as per ICH guidelines as discussed in
chapter IIA.
3.2.5.6 Isolation and characterization of impurities
The chromatographic condition mentioned above was used for isolating the impurities
using preparative HPLC. About 5 g of gefitinib bulk drug was dissolved in 50 mL of
acetonitrile and 0.2 mL of the solution was injected to preparative HPLC and fraction
135
corresponding to each impurity was collected separately. In this solvent system, the
impurities G4, G5, G0, G1, G6, G2, G3 and G-NO were eluting at 2.7, 3.7, 4.5, 5.5, 6.2,
7.3, 8.4 and 11.42 min respectively. About 200 injections were made and fractions were
collected each time and pooled (1400 mL). The fractions collected were concentrated to
remove organic solvents (acetonitrile & methanol) and aqueous layer (950 mL)
containing impurities were re-extracted with (100 x 3) mL of ethyl acetate. The ethyl
acetate layer containing impurities were dried over anhydrous sodium sulphate. The
evaporation of ethyl acetate yielded individual components in pure form (22 mg).
Impurity G5
Yellow colored solid
mp: 195-197 °C (lit. 193-198 °C) 9
UV: λ max 232, 273, 360 nm
IR (KBr): 695, 810, 851, 1002, 1101, 1152, 1202, 1273, 1380, 1456, 1485,
1595, 2952 cm-1
GC-MS (DI, m/z, Spectra 3.2.1): 335 (M+)
Impurity G6
Yellow colored solid
mp: 125-130 °C (lit. 127-131 °C) 9
UV: λ max 243, 326, 339 nm
IR (KBr): 698, 753, 821, 849, 865, 963, 1025, 1106, 1180, 1232, 1310, 1336, 1398, 1502,
1540, 1583, 2780, 2985 cm-1
GC-MS (DI, m/z, Spectra 3.2.2): 349 (M+)
Impurity G-NO
Yellow colored solid
mp: 138-140 °C
UV: λ max 223, 252, 343 nm
IR (KBr): 695, 789, 862, 946, 998, 1065, 1121, 1147, 1204, 1256, 1345, 1395, 1413,
1497, 1585, 1603, 2896 cm-1

136
1H NMR (DMSO-d6, 400 MHz, Spectra 3.2.3) δ 2.30 (m, 2H), 2.92 (d, J=11.2 Hz, 2H),
3.33-3.38 (m, 4H), 3.64 (m, 2H), 3.90 (s, 3H), 4.09 (t, J=11.2 Hz, 2H), 4.31 (t, J=6.4 Hz,
2H), 7.16 (s, 1H), 7.40 (dd, J=9.2 & J=8.8 Hz, 1H), 7.91 (m, 1H), 8.22 (s, 1H),
8.19 (m, 1H), 8.47 (s, 1H), 9.67 (s, 1H). 13C NMR (DMSO-d6, 400 MHz, Spectra 3.2.4): δ 21.23, 56.34, 61.49, 64.20, 67.59,
68.04, 104.46, 107.76, 109.29, 116.85, 117.07, 122.62, 123.75, 137.47, 147.41, 148.06,
153.19, 154.74, 155.02, 156.63.
GC-MS (DI, m/z, Spectra 3.2.5): 462 (M+), 446, 359, 318, 286, 275, 240, 129, 100.
3.2.5.7 Synthesis of gefitinib N-oxide (G-NO)
About 200 mg of gefitinib was dissolved in 10 mL of chloroform; 120 mg of
meta chloroperoxybenzoic acid (mcPBA) was added under chilled condition. Solution
was stirred for about 12 h at room temperature and chloroform was evaporated under
vacuum. The residue was dissolved in 5% sodium bicarbonate and extracted with 25 mL
of chloroform. The chloroform layer evaporated under vacuum to get light yellow
colored solid. The crude material was recrystallised from ethyl acetate to afford 173 mg
of yellow crystalline compound (G-NO) and recorded melting point (139-141 °C).
Compound was compared with isolated impurity G-NO by HPLC and mixed melting
point method and found both were identical.
3.2.6 BIBLIOGRAPHY
1. Kumar, V. K.; Raju, N. A.; Begum, S.; Rao, J. S.; Satyanarayana, T. Res. J. Pharm.
Technol. 2009, 2, 341–343.
2. Faivre, L.; Gomo, C.; Mir, O.; Taieb, F.; Schoemann-Thomas, A.; Ropert, S.; Vidal,
M.; Dusser, D.; Dauphin, A.; Goldwasser, F.; Blanchet, B. J. Chromatogr. B Analyt.
Technol. Biomed. Life. Sci. 2011, 879, 2345–2350.
137
3. Bai, F.; Iacono, L. C.; Johnston, B.; Stewart, C. F. J. Liq. Chromatogr. Relat. Technol.
2005, 27, 2743–2758.
4. Guetens, G.; Prenen, H.; De Boeck, G.; Van Dongen, W.; Esmans, E.; Lemière, F.; de
Bruijn, E. A. J. Chromatogr. A 2005, 1082, 2–5.
5. Wang, L.-Z.; Lim, M. Y.-X.; Wong, A.; Chan, S.-Y.; Goh, B.-C.; Ho, P. C. J.
Chromatogr. B Analyt. Technol. Biomed. Life. Sci. 2011, 879, 2155–2161.
6. Venkataramanna, M. Am. J. Anal. Chem. 2011, 2, 75–83.
7. Uchida, M.; Higashino, T.; Hayashi, E. J. Mass Spectrom. Soc. Jpn. 1973, 21,
245–254.
8. Chandrashekara, K. A.; Udupi, A.; Reddy, C. G. J. Chromatogr. Sci. 2014, 52,
799-805.

138
Spectra 3.2.1: Mass spectra of impurity G5
Spectra 3.2.2: Mass spectra of impurity G6
Spectr
Spectr
ra 3.2.3: 1H
a 3.2.4: 13C
NMR spect
NMR spect
tra of impur
tra of impur
rity G-NO
rity G-NO
139

140
Spectra 3.2.5: Mass spectra of impurity G-NO


![Review Article ANewLookatTriggerPointInjectionsdownloads.hindawi.com/journals/arp/2012/492452.pdfduring trigger point injections [23]. 5.2. Injection of Peripheral Nerves. Trigger](https://static.fdocuments.in/doc/165x107/5fe8786c7e06df04b85d3718/review-article-anewlookattriggerpoin-during-trigger-point-injections-23-52.jpg)