CHAPTER-II REVIEW OF LITERATURE -...
23
5 CHAPTER-II REVIEW OF LITERATURE Rice is one of the most important and widely grown crops in the world. It is the staple food crop of about half of the world’s population (Zeigler and Barclay, 2008). It is estimated that the global demand for rice will increase from 465 million tons in 2012 to about 487 million tons in 2020 (Mohanty, 2009). The situation will be more challenging in the wake of drought and recent climate changes. Rice which is generally grown in water is extremely sensitive to drought (Lafitte et al., 2004) and the rainfed rice growing areas often witness the loss of crop yield due to drought stress. The literature available related to the topics under study is reviewed under the following sub heads: 2.1 Rainfed Rice ecology and Drought Rice is adapted to a wide range of climate, soil and water conditions. In Asia and in India, it is mainly grown in rainfed environment dependent on rainfall. This makes rice cultivation highly prone to drought conditions. Drought therefore, is one of the major limiting factors to rice yield in rainfed regions (Dey and Upadhyaya 1996). De Datta (1981) classified rice culture according to water regimes, viz., upland, with no standing water; lowland with about 50 cm of standing water, and deep water rice ecosystem, with >50 cm of standing water. Drought is said to be prevalent in each of these rice ecosystems. The rainfed lowland system in Asia covers about 45 million hectares, almost 30% of the total rice area worldwide (Haefele and Hijmans 2007). In South Asia, India covers an area of about 16.1 million ha area of rainfed lowland. About 75% of total rice production comes from irrigated lowlands in Asia (Maclean et al., 2002). Although
Transcript of CHAPTER-II REVIEW OF LITERATURE -...

5
CHAPTER-II
REVIEW OF LITERATURE
Rice is one of the most important and widely grown crops in the world. It is
the staple food crop of about half of the world’s population (Zeigler and Barclay, 2008).
It is estimated that the global demand for rice will increase from 465 million tons in 2012
to about 487 million tons in 2020 (Mohanty, 2009). The situation will be more
challenging in the wake of drought and recent climate changes. Rice which is generally
grown in water is extremely sensitive to drought (Lafitte et al., 2004) and the rainfed rice
growing areas often witness the loss of crop yield due to drought stress. The literature
available related to the topics under study is reviewed under the following sub heads:
2.1 Rainfed Rice ecology and Drought
Rice is adapted to a wide range of climate, soil and water conditions. In Asia
and in India, it is mainly grown in rainfed environment dependent on rainfall. This makes
rice cultivation highly prone to drought conditions. Drought therefore, is one of the major
limiting factors to rice yield in rainfed regions (Dey and Upadhyaya 1996). De Datta
(1981) classified rice culture according to water regimes, viz., upland, with no standing
water; lowland with about 50 cm of standing water, and deep water rice ecosystem, with
>50 cm of standing water. Drought is said to be prevalent in each of these rice
ecosystems.
The rainfed lowland system in Asia covers about 45 million hectares, almost
30% of the total rice area worldwide (Haefele and Hijmans 2007). In South Asia, India
covers an area of about 16.1 million ha area of rainfed lowland. About 75% of total rice
production comes from irrigated lowlands in Asia (Maclean et al., 2002). Although

6
rainfed lowlands include favourable environments with conditions similar to those of
irrigated systems, most of the area in this agroecosystem faces drought stress due to
uneven rainfall pattern affecting rice production.
2.2 Hybrid rice technology in unfavourable environments
Hybrid rice technology exploits the phenomenon of hybrid vigour to increase
the yield potential of rice varieties with reported yield advantage of 15-20% over inbred
commercial high-yielding varieties. China started hybrid rice research in 1964 and has
been utilizing it in commercial rice production since 1976. In South and Southeast Asia,
hybrid rice research initiated in 1980s and has been commercially used in rice production
for two decades. The success of hybrid rice technology for favourable environment is
well documented but its exploitation under unfavourable condition has been very limited.
Hybrid rice varieties can be one of the options for drought prone lowland
areas. The performance of hybrid rice in favourable irrigated condition is known, but
their performance under drought stress is not much evaluated. In irrigated ecosystems,
yield advantage of hybrids has been reported to be 10-30 % higher compared to inbreds
(Virmani et al. 1982). However, there are not many studies done to assess the hybrid
performance under drought conditions. Hybrid varieties can offer a route to combining
improved drought tolerance with increased yield potential in drought-prone rainfed
lowland systems. Many drought susceptible varieties such as IR64 and IR36 can be
replaced with hybrids in the drought-prone lowland areas. In earlier studies, superiority of
hybrids under drought prone rainfed lowland has been reported (Virmani, 2003).
Atlin et al. (2008) identified promising drought tolerant hybrids with high yield
potential for lowland environments.
7
There were studies, showing some hybrid rice lines that were developed for
irrigated environment when evaluated under drought environments, showed high yield
heterosis under both irrigated and drought conditions (Xie, 2010). However, contrary
findings have also been reported. Under alternate wetting and drying method, Bueno et
al. (2010) observed inconsistent or below par performance of some hybrid lines when
compared with other inbred verities.
Villa et al. (2011) reported the genetic variability of the response to drought
among hybrid lines and reported high yield performance of hybrid rice lines over their
inbreds in both well watered and stress environments.
2.3 Fertility restoration reactions and identification of restorers in WA-CMS based
system.
In hybrid rice technology, three line system is the most common, involving a
cytoplasmic male sterile line, a maintainer line and a restorer line. This method has been
widely adopted in most of the crops including rice where hybrids have been developed
and commercialized.
Identification of restorers and maintainers from elite breeding lines and land
races through test crossing (Virmani 1996) and their use in further breeding program are
thus the prerequisites in three line approach. Several effective restorer lines for WA, Gam
and Bt cytosterility system have been identified among elite rice genotypes (Shinjyo,
1969; Lin and Yuan 1980). The restorer lines for WA cytosterility system were found
more stable and with higher restoration ability (Virmani, 1996). For the WA cytosterility
system, many effective restorer lines have been identified among cultivated rice varieties
and elite rice genotypes in China (Lin and Yuan 1980; Yuan et al. 1994), International

8
Rice research Institute (Govinda Raj and Virmani 1988), Indonesia (Suprihanto et al.
1994), Philippines (Lara et al. 1994) and India (Siddiq et al. 1994). The frequency of
restorer lines was higher among Indica cultivars and low among Japonica cultivars (Lin
and Yuan 1980).
The commercial utilization of hybrid rice technology in rice is mainly due to
the use of cytoplasmic sterility system combined with a effective fertility restoration
system (Virmani and Wan 1988). The studies on inheritance of fertility restoration in the
WA-Cytoplasmic sterility system reported digenic inheritance with two independent
genes (Young and Virmani 1984, Li and Yuan 1986; Virmani et al. 1986; Bharaj et al.
1991; Teng and Shen 1994). The two dominant restorer genes Rf3 and Rf4 were found to
be responsible for fertility restoration in WA-CMS system (Tan et al. 1998). These
fertility restorer genes, viz., Rf3 and Rf4 for WA-CMS system have been mapped on
chromosome 1 and 10 respectively (Yao et al. 1997). Among different WA- CMS
sources, IR58025A has been one of the popular and most extensively used CMS line. In
India, most of the commercial rice hybrids have been developed using CMS line
IR58025A with WA-CMS source (Nanda and Virmani 2000).
In studies of fertility restoration behaviour, frequency of restorers and
maintainers among the tested rice genotypes varied. Saber et al. (2007) using local
Basmati and course rice observed higher frequency of maintainers than restorers while
Sharma et al. (2012) from among the local and high yielding rice genotypes observed
higher frequency of restorers than maintainers.

9
2.4 Rice yield response and genotypic evaluation under managed drought stress
The rice yield is primarily affected by drought timing, severity, duration and
crop growth stage at which drought occurs. Boonjung and Fukai (1996) and Jongdee et
al. (2006) reported that early drought stress which generally occurs during vegetative
growth stage results in yield reduction due to reduced tillering. Fukai and Cooper (1995)
depicted that intermittent stress which generally occurs between tillering and flowering
stages results in yield loss due to reduced leaf expansion and photosynthesis. Liu et al.
(2006) reported late stage drought which manifest generally during panicle initiation and
flowering stage is the main contributing factor of yield loss due to reduced spikelet
fertility. Lancreas et al. 2004 and Venuprasad et al. 2009 reported drought stress at the
reproductive stage as the most damaging.
Evaluation under managed stress helps to identify the differential response to
drought among the large number of genotypes screened at the reproductive stage.
Managed stress screening for drought tolerance is an easy approach and has been utilized
for large scale evaluation of rice breeding lines and genotypes. Lafitte et al. (2004)
reported the purpose of using managed drought stress which was to impart similar
drought conditions as witnessed in the target environment. Selection for yield under
managed drought condition in the target environment in rice (Bernier et al. 2007; Kumar
et al. 2008; Venuprasad et al. 2008; Verulkar et al. 2010) offers scope in development of
rice cultivars with improved drought tolerance and yield potential.
Under managed drought stress, rainfed lowland screening is different from
rainfed upland screening and depends upon the crop growth stage and type of drought
occurance in the target environment. Guan et al. (2010) reported that for rainfed lowland

10
environment, where terminal drought is more frequent, screening of breeding populations
at severe reproductive stress is more preferable while, for the rainfed upland
environments, where early or intermittent drought is a common occurrence, both
vegetative stress and reproductive stress stage is desirable to screen the breeding
populations.
2.5 Genetic parameters for yield and its component traits under drought
Drought resistance is a complex trait that involves several physiological,
phenological and morphological mechanism and associated with polygenic nature of
resistance. For improvement in any crop species, the knowledge of genetic variability in
traits of economic importance is crucial as knowledge on the genetic architecture of
genotypes help to formulate efficient breeding strategies. Besides, it could be of interest
to know the magnitude of variation due to heritable component which in turn forms the
basis for selection in the crop improvement. The genetic variation along with estimates of
heritability and genetic advance help breeders to determine the possible extent for
improvement through selection.
Many varieties and hybrids were evaluated under different drought severities for
yield and contributing traits.
Hegde and Patil (2000) found that spikelets number per panicle, photosynthetic
rate and thousand grain weight contributes maximum towards total genetic diversity for
yield in rainfed rice varieties.
Jongdee et al. (2002) found significant genetic variation in leaf water potential
among rice lines under drought stress at flowering stage.

11
Pantuwan et al. (2002) found significant variation in days to flowering among
drought stressed genotypes which otherwise showed similar flowering time under
irrigated condition.
Mahto et al. (2003) in a study of rainfed upland rice observed high heritability
and genetic advance for plant height and grain yield per plant.
Moderate to high heritability for grain yield under drought stress has been
reported by many authors in recent time. Venuprasad et al. (2007) and Kumar et al.
(2008) reported comparable heritability under stress and irrigated conditions.
Verulkar et al. (2010) reported high heritability under severe stress condition for
grain yield, days to 50% flowering, plant height and harvest index in medium to late
duration breeding lines while low heritability was observed for grain yield under
moderate stress in both early and late duration breeding lines. They also reported
significant genetic variability among the tested lines for grain yield, days to 50%
flowering, plant height and harvest index.
Sravan et al. (2012) in a study of 36 diverse rice genotypes under rainfed upland
condition observed high genotypic variation for grain yield, harvest index and flag leaf
length while harvest index and grain yield exhibited high heritability coupled with high
genetic advance as percent of mean.
Shrivastava et al. (2012) in an experiment conducted with 22 advance breeding
lines subjected to high temperatures at reproductive stage with different sowing dates,
observed high heritability coupled with high genetic advance for biological yield.

12
2.6 Combining ability and gene action
The ability of a genotype to produce superior progenies upon crossing is termed as
combining ability. It is the ability of an inbred to transmit desirable performance to the
hybrid progeny. The success of crop improvement programmes depends to a great extent
on the types of parents used, their diversities for desired characters and their combining
ability. Combining ability analysis provides information on additive and non additive
variances and helps in selection of the desirable parents and crosses for the exploitation
of heterosis.
Sprague and Tatum (1942) gave the concept of combining ability and proposed
the idea of partitioning genetic variation into variances due to general combining ability
(GCA) and specific combining ability (SCA). The GCA is the average performance of a
genotype in cross combinations and is the result of additive gene action, while SCA is the
specific expression of performance between any two inbred lines in relation to the
average performance of all combinations and is the result of non additive gene action. In
rice, several researchers reported nature of gene action for different characters through
various biometrical techniques. The literature pertaining to combining ability is presented
in the tabular form in table 2.6.1.
13
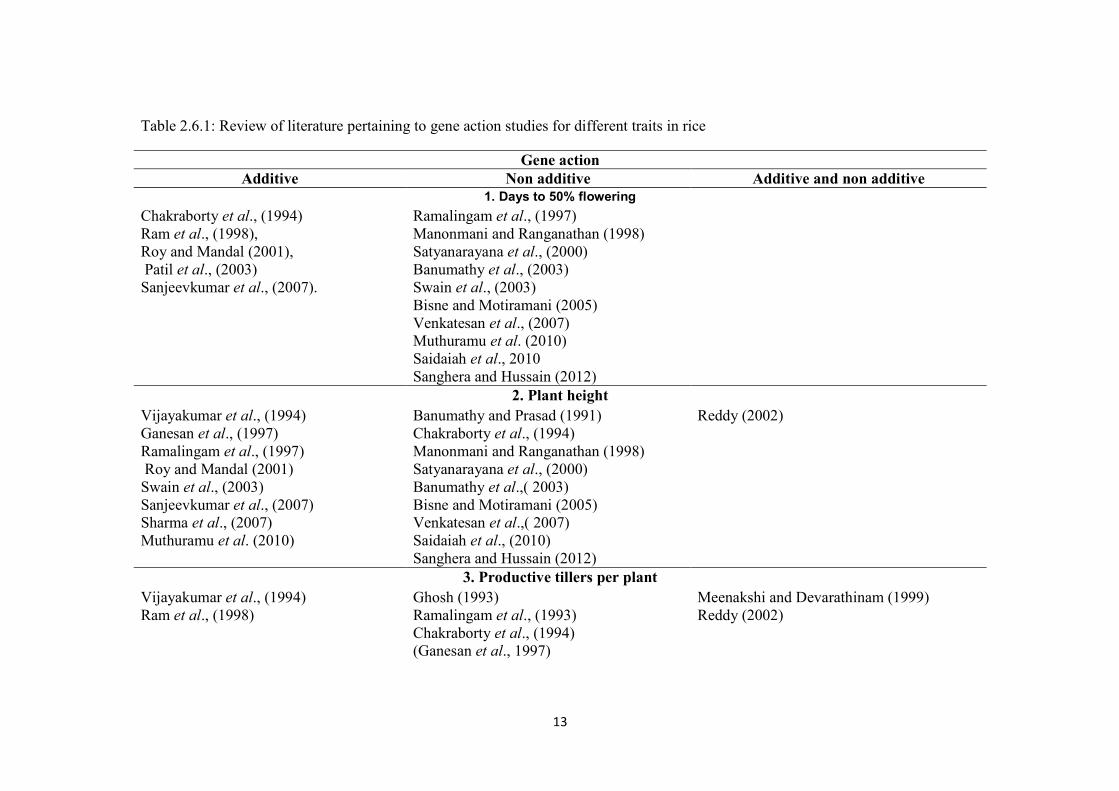
Table 2.6.1: Review of literature pertaining to gene action studies for different traits in rice
Gene actionAdditive Non additive Additive and non additive
1. Days to 50% floweringChakraborty et al., (1994) Ramalingam et al., (1997)Ram et al., (1998), Manonmani and Ranganathan (1998)Roy and Mandal (2001), Satyanarayana et al., (2000)Patil et al., (2003) Banumathy et al., (2003)Sanjeevkumar et al., (2007). Swain et al., (2003)
Bisne and Motiramani (2005)Venkatesan et al., (2007)Muthuramu et al. (2010)Saidaiah et al., 2010Sanghera and Hussain (2012)
2. Plant heightVijayakumar et al., (1994) Banumathy and Prasad (1991) Reddy (2002)Ganesan et al., (1997) Chakraborty et al., (1994)Ramalingam et al., (1997) Manonmani and Ranganathan (1998)Roy and Mandal (2001) Satyanarayana et al., (2000)Swain et al., (2003) Banumathy et al.,( 2003)Sanjeevkumar et al., (2007) Bisne and Motiramani (2005)Sharma et al., (2007) Venkatesan et al.,( 2007)Muthuramu et al. (2010) Saidaiah et al., (2010)
Sanghera and Hussain (2012)3. Productive tillers per plant
Vijayakumar et al., (1994) Ghosh (1993) Meenakshi and Devarathinam (1999)Ram et al., (1998) Ramalingam et al., (1993) Reddy (2002)
Chakraborty et al., (1994)(Ganesan et al., 1997)

14
Additive Non additive Additive and non additiveManonmani and Ranganathan (1998)Satyanarayana et al., (2000)Roy and Mandal (2001)Banumathi et al., (2003)Swain et al., (2003)Bisne and Motiramani (2005)Sharma et al., (2007)Muthuramu et al. (2010)Saidaiah et al., 2010Sanghera and Hussain (2012)
4. Panicle lengthGhosh (1993) Ramalingam et al., (1993)Ram et al., (1998) Chakraborty et al., (1994)Swain et al., (2003) Ganesan et al., (1997)Sharma et al., (2007) Manonmani and Ranganathan (1998)
Satyanarayana et al., (2000)Roy and Mandal (2001)Banumathy et al., (2003)Bisne and Motiramani (2005)Sanjeevkumar et al., (2007)Muthuramu et al. (2010)Saidaiah et al., 2010Sanghera and Hussain (2012)
5. Panicle weightPrakash et al., (2003) Sharma et al., (2007)Saidaiah et al., (2010)
6. Number of filled grains per panicleVijayakumar et al., (1994) Banumathy and Prasad (1991)

15
Additive Non additive Additive and non additiveGanesan and Rangaswamy (1998) Ramalingam et al., (1993)Ram et al., (1998) Ghosh (1993)Swain et al., (2003) Ganesan et al., (1997)
Ramalingam et al., (1997)Manonmani and Ranganathan (1998)Satyanarayana et al., (2000)Roy and Mandal (2001)Banumathy et al., (2003)Bisne and Motiramani (2005)Muthuramu et al. (2010)Saidaiah et al., 2010Sanghera and Hussain (2012)
7. Spikelets per panicleChakraborty et al., (1994) Bisne and Motiramani (2005)Swain et al., (2003) Sanghera and Hussain (2012)
8. Spikelets fertility percentShanthi et al., (2003) Ghosh (1993)
Babu et al., (2000)Satyanarayana et al., (2000)Kalaiyarasi et al., (2002)Banumathy et al., (2003)Bisne and Motiramani (2005)Muthuramu et al. (2010)Saidaiah et al., (2010)Sanghera and Hussain (2012)
9. Test seed weightVijaykumar et al., (1994) Ghosh (1993) Patil et al., (2003)Ganesan and Rangaswamy (1998) Chakraborty et al., (1994)Ram et al., (1998) Ramalingam et al., (1997)

16
Additive Non additive Additive and non additiveRoy and Mandal., (2001) Rogbell and subbaraman (1997)Reddy (2002) Meenakshi and Devarathinam (1999)Swain et al., (2003) Babu et al.,( 2000)Sanjeevkumar et al., (2007) Banumathy et al., (2003)
Bisne and Motiramnai (2005)Sharma et al., (2007)Muthuramu et al. (2010)Saidaiah et al., 2010
10. Grain yield per plantVijayakumar et al., (1994) Banumathy and Prasad (1991)Ram et al., (1998) Wilfred manuel and Prasad (1992)Meenakshi and Devarathinam (1999) Ramalingam et al., (1993)Ganesan and Rangaswamy (1998) Chakraborty et al., (1994)Shanthi et al., (2003) Ganeshan et al., (1997)
Rogbell and subbaraman (1997)Manonamani and Ranganathan (1998)Satayanarayana et al., (2000)Banumathy et al., (2003)Swain et al., (2003)Bisne and Motiramani (2005)Sharma et al., (2007)Venkatesan et al., (2007)Muthuramu et al. (2010)Saidaiah et al., 2010Sanghera and Hussain (2012)
11. Biomass per plantWilfred Manual and Prasad (1992) Sanghera and Hussain (2012)Swain et al., (2003)

17
12. Harvest indexAdditive Non additive Additive and non additive
Swain et al., (2003) Lokaprakash et al., (1991)Bisne and Motiramani (2005)Sanghera and Hussain (2012)

18
Chakraborty et al. (1994) observed additive gene effects for days to 50%
flowering, spikelets per panicle, flag leaf length and hundred seed weight while non
additive gene action for plant height, panicles per plant and yield per plant. The crosses
Mahsuri / Pankaj and Mahasuri / Manoharsali showed positive sca effects for grain yield.
In another study by Rogbell and Subbaraman (1997), it was found that
magnitude of variance due to SCA was higher than GCA for all the studied traits. Good
general combiners among the parents for grain yield were IR 61457-8-3-3-1, IR 10198-
66-2 and IR 54717-C10-113-1-2-2-2.
Manomani and Ranganathan (1998) found predominance of non additive gene action
for days to flowering, plant height, productive tillers, panicle length, number of grains per
panicle, 100 seed weight and grain yield. Among the parents IR 50, Co 37 and ASD 17
were found to be good combiners for grain yield. The crosses ASD 16 x Kalyani II, IR 50
x ASD 8 and ASD 16 x ASD 17 showed high SCA effects for days to flowering,
productive tillers and grain yield, respectively.
Babu et al. (2000) studied the combining ability and observed preponderance of non
additive gene action for all the studied traits. Among the parents, two lines viz., IR
58025A and IR 62829A and three testers WGL 3962, IET 9762 and IET 10021 were
found to be good general combiners yield and related traits. Among the crosses,
IR62829A x WGL 3962, IR62829A x IR 276-301-06-01R, IR 62829A x MTU9992, and
APMS 2A x IET 9762 were found to have high SCA effects for grain yield.
Swain et al. (2003) reported importance of both additive and non additive gene
actions for all studied characters. Days to flowering, panicles per plant and grain yield per

19
plant showed non additive effects while additive effects were observed for plant height,
panicle length, spikelets per panicle, 1000 seed weight, harvest index and straw yield per
plant. Good combining parents were found to be Ketanangka and Rahaspanjar for yield
and components traits, except for plant height. Among the crosses, Rahaspanjar x Swarna
and CR-260-77 x Ketanangka showed high SCA effects and found to be promising
crosses.
In a study by Banumathi et al. (2003), non additive gene action played major role in
grain yield and associated traits. Among the parents, the lines IR 58025A, IR 69616A and
IR 70364A and testers CB 95066, IR 10198-66-2r, IR 65515-47-2-1-19, TNAU 94241,
and TNAU 94301 were good general combiners for grain yield.
Bisne and Motiramani (2005) observed preponderance of non additive gene action for
plant height, productive tillers per plant, spikelets per panicle, 100 seed weight, harvest
index seed length and nreadth. Among parents, lines DRR 2A and PMS 10A and testers
BKP 232, R 827-287, R 1060-1674-2-103 and R 714-2-103 were found to be good
general combiners for grain yield and among the crosses DRR 2A x R 827-287 and DRR
2A x R 1060-1674-1-1showed high SCA effects.
Anand Kumar et al. (2006) in their study found IR 68886A and IR 58025A good
general combiners for earliness and grain yield respectively. Among testers, Pusa 1040,
PSRM-1-16-48-11, RAU 1411-4 and RAU 1414-10 were good general combiners for
grain yield among crosses IR 68886A x Pusa 1040, IR 58025A x RAU 1411-10 and IR
68886A x PSRM-1-16-48-1 showed high SCA effects and recorded significant heterosis
for yield and its contributing traits.

20
In another study of combining ability by SanjeevKumar et al., (2007) it was found
that both additive and non additive gene action played equal role in expression of the
traits. Preponderance of additive gene action was observed for plant height, days to
flowering and 100 seed weight. Non additive gene action were observed for panicle
length and grain length while both additive and non additive effects observed for leaf area
index and grain yield per plant. Parents HPR 2047, VL 93-3613 and J08 were good
general combiners for grain yield and associated traits. Among the crosses HPR 2047 x
VL 93-3613, HPR 1164 x IR 57893-8, VL 91-1754 x J08, VL 91-1754 x VL 93-3613
showed high SCA effects for grain yield and associated traits.
Venkatesan et al. (2007) found non additive gene action for plant height, days to fifty
percent flowering and grain yield. The lines AD 25157, AD 25137 and MDU 5 and
testers ADT 36, ADT43 and IR 50 appeared good general combiners for grain yield and
its components traits.
Muthuramu et al. (2010), in a study of combining ability analysis through diallel
cross for drought tolerance in rice observed preponderance of non additive gene action
for most of the traits except plant height which showed additive gene action. Among the
parents, Nootripathu, Mattaikar, Vellaichithiraikar appeared to be good general
combiners for grain yield while the hybrids NPT 107 x MDU 5 and NPT 107 x
Nootripathu were found to promising crosses for drought conditions.
Saidaiah et al. (2010) in a combining ability study for rice hybrids evaluation in three
agro climatic zones observed prevalence of non additive gene action for all the traits. In
the study lines APMS 6A, PUSA 5A and CRMS 32 A and testers 1096, 1005, IBL-57
and SC5 9-3 were found to be good general combiners for yield and majority of traits

21
while the crosses with high SCA effects for yield and other related traits were APMS 6a x
SC5 9-3, APMS 6a x 1005and APMS 6a x GQ 25.
Sanghera and Hussain (2012) while studying the combining ability in rice hybrids for
temperate conditions found preponderance of non additive gene action for all the traits.
The estimates of GCA effect indicated the male parent K-08-61-2 and female parent
SKAU 11A to be good general combiner for grain yield and other yield contributing
traits. The crosses SKAU 7A x K-08-61-2, SKAU 7A x SR-2, SKAU 11A x K-08-60-2,
SKAU 11A x K-08-59-3, SKAU 11A x SKAU-389 were found to be promising cross
combinations for grain yield and other desired traits.
2.7 Heterosis
The concept of hybrid vigour was first put forth by Shull (1908) which has given birth
to heterosis breeding. Heterosis is a phenomenon in which F1 hybrids show superiority
over their parents (mid parent or better parent heterosis) or over standard check (standard
heterosis).
In rice, heterosis was reported by Jones (1926) who observed in F1 hybrids, higher
culm growth and yield over their parents. Since then several studies have been made to
estimate the extent of heterosis in rice for yield and contributing characters. Earlier there
were more reports on relative heterosis and heterobeltiosis. However, since 1976, after
the success of F1 rice hybrids in China, that standard heterosis is being considered.
The literature pertaining to heterosis in rice has been reviewed and tabulated (Table
2.7.1) as follows

22
Table: 2.7.1: Summary of review of literature on heterosis for different traits in rice
Range of heterosis percent over
No. of crosses studied
Heterosis % Heterobeltiosis %
Standard Heterosis % Reference
1. Days to 50% flowering
75 -16.00 to 14.00 -12.00 to 29.00 -27.00 to 19.00 Peng and Virmani (1991)
28 -16.00 to 12.00 -27.50 to 15.00 - Ganesan et al., (1997)
30 - -19.50 to 18.40 -19.00 to 16.00 Mishra and Pandey (1998)
15 -16.21 to 4.10 -43.70 to 42.90 - Ghosh (2002)
30 - -8.27 to 22.06 - Yadav et al., (2004)
8 - -14.70 to 11.50 - Bhandarker et al., (2005)
45 -11.59 to 17.74 -10.95 to 19.35 -5.53 to 16.99 Deoraj et al., (2007)
64 -17.00 to 14.00 -27.10 to 1.70 -3.00 to 52.30 Selvaraj et al., (2010)
60 - -16.57 to 7.27 -4.22 to -16.57 Tiwari et al., (2011)
20 -10.27 to 7.12 -14.71 to 5.49 - Vanisree et al., 2011
2. Plant height
21 -4.19 to 5.97 -3.99 to 20.45 - Lokaprakash et al.,(1992)
36 -7.10 to 15.50 10.10 to 12.80 -7.52 to 0.40 Pandey et al., (1995)
28 0.40 to 11.80 -14.20 to 9.80 - Ganesan et al., (1997)
30 - -37.00 to 29.80 -26.50 to 15.20 Mishra and Pandey (1998)
8 1.20 to 18.90 -16.80 to 7.20 - Tiwari and Sarathe (2000)
15 -6.30 to 30.30 -11.50 to 5.20 - Ghosh (2002)
30 - -26.75 to 28.08 - Yadav et al., (2004)
8 - -19.73 to 22.81 - Bhandarker et al.,(2005)

23
8 -35.96 to -3.98 - - Shanthala et al., (2006)
45 -23.14 to 53.32 -16.15 to 89.76 -25.41 to 85.11 Deoraj et al., (2007)
64 4.50 to 50.00 -19.80 to 42.00 -7.00 to 78.00 Selvaraj et al., (2010)
60 - -16.99 to 8.29 -19.62 to 0.18 Tiwari et al., (2011)
3. No. of fertile tillers per plant
21 -34.65 to 48.86 -36.84 to 47.71 - Lokaprakash et al.,(1992)
50 - - 5.60 to 43.40 Bobby and Nadarajan (1994)
36 12.70 to 117.60 13.60 to 117.60 9.80 to 109.40 Pandey et al., (1995)
28 3.80 to 40.90 5.60 to 29.70 - Ganesan et al., (1997)
30 - -17.20 to 226.80 -34.60 to 79.10 Mishra and Pandey (1998)
45 13.30 to 83.80 - - Singh and Haque (1999)
15 14.60 to 63.80 -11.10 to 48.30 - Ghosh (2002)
30 -31.51 to 45.27 - - Yadav et al., (2004)
8 - -22.87 to 74.29 - Bhandarker et al., (2005)
8 -26.29 to 55.26 - - Shanthala et al., (2006)
45 -27.87 to 96.50 -28.57 to 97.05 -59.68 to 37.09 Deoraj et al., (2007)
64 -18.50 to 167.00 -21.00 to 160.00 -5.26 to 180.00 Selvaraj et al., (2010)
60 - -34.00 to 39.53 -8.33 to 66.67 Tiwari et al., (2011)
4. Panicle length
17 - -13.13 to 18.00 -31.20 to 7.55 Singh et al., (1992)
50 - - -14.25 to 19.40 Bobby and Nadarajan (1994)
36 -4.50 to 24.80 -6.50 to 20.40 -12.50 to 46.90 Pandey et al.,(1995)
28 -9.50 to 13.00 -12.50 to 7.40 - Ganesan et al., (1997)
30 - -22.60 to 30.90 -0.60 to 35.10 Mishra and Pandey (1998)

24
15 7.20 to 59.20 1.60 to 46.20 - Ghosh (2002)
30 - -27.37 to 42.29 - Yadav et al., (2004)
8 - -22.02 to 3.20 - Bhandarkar et al., (2005)
8 -20.82 to 7.43 - - Shanthala et al., (2006)
45 -10.09 to 37.61 -18.42 to 36.84 -14.03 to 43.85 Deoraj et al., (2007)
64 -22.90 to 18.70 -28.00 to 15.40 -22.10 to 22.50 Selvaraj et al., (2010)
60 -39.26 to 48.30 -40.63 to 23.20 Tiwari et al., (2011)
20 -8.81 to 29.77 -9.54 to 25.85 - Vanisree et al., (2011)
5. Fertile spikelets per panicle
21 -56.73 to 64.84 -64.03 to 47.12 -59.06 to 76.59 Sreedhar and Kulkarni (1993)
4 - -24.70 to 35.10 -8.10 to 35.20 Sharma and Mani (1996)
24 -9.08 to 10.25 -14.63 to 5.77 -5.66 to 48.29 Sathya et al., (1999)
35 -2.85 to 85.75 -21.72 to 78.74 -4.46 to 28.74 Annadurai and Nandarajan (2001)
30 - -91.77 to 25.31 - Yadav et al., (2004)
45 -2.87 to 55.1 -17.08 to 57.57 -15.06 to -46.02 Deoraj et al., (2007)
64 -30.10 to 52.20 -38.01 to 48.00 -15.00 to 46.80 Selvaraj et al., (2010)
60 - -20.66 to 46.61 -16.86 to 21.02 Tiwari et al., (2011)
20 - -58.32 to 28.85 - Vanisree et al., (2011)
6. Spikelet fertility percent
25 - - -252.56 to 33.8 Radhakrishna (1992)
10 - - -16.70 to -1.84 Yolanda and Vijendradas (1995)
30 - -72.90 to 82.00 -81.30 to 25.10 Mishra and Pandey (1998)
28 - - -0.77 to 5.14 Singh and Maurya (1999)

25
22 - - -23.89 to 14.98 Panwar et al., (2002)
24 -34.37 to 25.67 - - Joshi et al., (2004)
24 0.53 to 21.67 -14.51 to 0.33 -18.70 to -2.44 Aananthi and Jebaraj (2006)
60 - -6.89 to 46.40 -0.81 to 16.31 Tiwari et al., (2011)
7. Test seed weight
21 -5.26 to 61.74 -7.05 to 57.89 -8.06 to 17.06 Sreedhar and Kulkarni (1993)
36 - - -29.60 to 6.50 Yolanda and Vijendradas (1995)
60 - -30.33 to 12.62 -41.63 to -5.83 Vishwakarma et al., (1998)
14 - - -46.46 to 26.66 Singh and Maurya (1999)
22 - - -34.55 to -5.82 Panwar et al., (2002)
24 -32.95 to 31.82 - - Joshi et al., (2004)
8 -9.27 to 12.61 - - Shanthala et al., (2006)
33 - - -23.65 to 57.94 Eradasappa et al., (2007)
3 - -5.83 to 7.78 -3.75 to 11.82 Narasimman et al., (2007)
24 - - -29.40 to -0.70 Rosamma and Vijayakumar (2007)
64 -21.30 to 19.00 -24.24 to 16.20 -21.00 to 22.40 Selvaraj et al., (2010)
60 - -41.25 to 71.63 -43.47 to 21.81 Tiwari et al., (2011)
8. Grain yield per plant
75 -45.00 to 157.0 -59.00 to 98.00 -59.00 to 34.00 Peng and Virmani (1991)
50 - - -12.50 to 16.40 Bobby and Nadarajan (1994)
8 0.10 to 127.80 -40.60 to 6.89 - Reddy and Nerkar (1995)

26
28 -10.20 to 108.90 -12.80 to 106.90 - Ganesan et al., (1997)
45 -5.60 to 131.70 - - Singh and Haque (1999)
8 1.00 to 130.00 -34.40 to 68.30 - Tiwari and Sarathe (2000)
103 - - -4.52 to 30.00 Pandey et al., (2001)
22 - - -0.57 to 54.75 Panwar et al., (2002)
24 -43.33 to 93.16 - - Joshi et al., (2004)
8 -61.81 to 14.79 - - Shanthala et al., (2006)
24 -23.58 to 44.65 -37.20 to 39.41 -42.31 to 51.65 Aananthi and Jebaraj (2006)
3 -75.14 to 90.50 -181.57 to 270.98 - Narasimman et al., (2007)
24 - - -38.30 to 70.60 Rosamma and Vijayakumar (2007)
27 12.50 to 95.33 -6.97 to 66.38 - Saleem et al., (2008)
57 abc (-1.1 to 98.7) c (-14.3 to 12.3) a;(-39.0 to 24.9) b;
- Xangsayasane et al., (2010)
64 -31.60 to 71.90 -42.31 to 78.90 -42.30 to 80.30 Selvaraj et al., (2010)
60 -36.05 to 113.04 -28.57 to 71.56 Tiwari et al., (2011)
20 -63.69 to 122.46 -66.98 to 104.19 - Vanisree et al., (2011) a(crosses from female parent IR 58025A with 19 male parent); b(crosses from female parent IR 65 with 19 male parent); c(crosses from female parent IR 75589S with 19 male parent)
9. Biomass per plant
24 -31.27 to 15.55 -35.41 to 12.22 -30.44 to 9.89 Aananthi and jebaraj (2006)
27 7.54 to 58.77 12.88 to 104.37 - Saleem et al., 2008
20 -56.60 to 115.06 -60.47 to 60.99 - Vanisree et al., (2011)
10. Harvest index
24 -17.65 to 43.82 -19.23 to 42.22 -16.32 to 30.61 Aananthi and Jebaraj (2006)
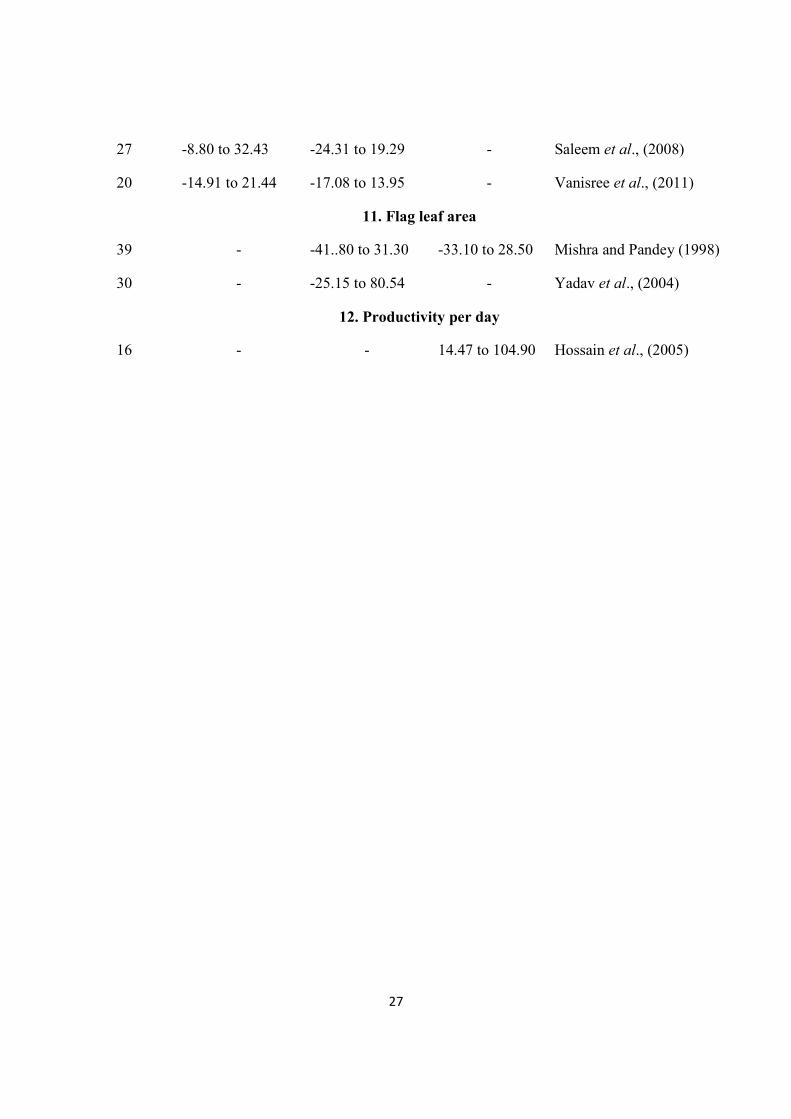
27
27 -8.80 to 32.43 -24.31 to 19.29 - Saleem et al., (2008)
20 -14.91 to 21.44 -17.08 to 13.95 - Vanisree et al., (2011)
11. Flag leaf area
39 - -41..80 to 31.30 -33.10 to 28.50 Mishra and Pandey (1998)
30 - -25.15 to 80.54 - Yadav et al., (2004)
12. Productivity per day
16 - - 14.47 to 104.90 Hossain et al., (2005)