CHAPTER II PERFORMANCE AUDIT - agker.cag.gov.in · 24x7 PHC (Health Block) Primary Health Centres...
69
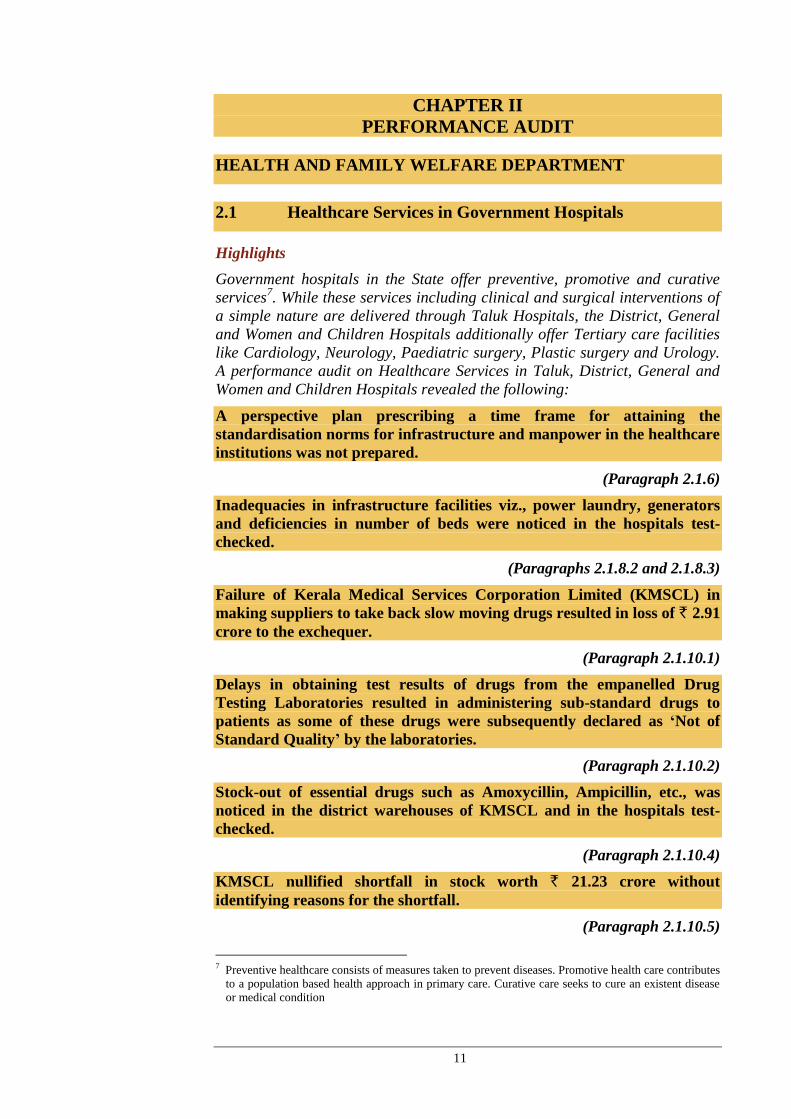
11 CHAPTER II PERFORMANCE AUDIT HEALTH AND FAMILY WELFARE DEPARTMENT 2.1 Healthcare Services in Government Hospitals Highlights Government hospitals in the State offer preventive, promotive and curative services 7 . While these services including clinical and surgical interventions of a simple nature are delivered through Taluk Hospitals, the District, General and Women and Children Hospitals additionally offer Tertiary care facilities like Cardiology, Neurology, Paediatric surgery, Plastic surgery and Urology. A performance audit on Healthcare Services in Taluk, District, General and Women and Children Hospitals revealed the following: A perspective plan prescribing a time frame for attaining the standardisation norms for infrastructure and manpower in the healthcare institutions was not prepared. (Paragraph 2.1.6) Inadequacies in infrastructure facilities viz., power laundry, generators and deficiencies in number of beds were noticed in the hospitals test- checked. (Paragraphs 2.1.8.2 and 2.1.8.3) Failure of Kerala Medical Services Corporation Limited (KMSCL) in making suppliers to take back slow moving drugs resulted in loss of ` 2.91 crore to the exchequer. (Paragraph 2.1.10.1) Delays in obtaining test results of drugs from the empanelled Drug Testing Laboratories resulted in administering sub-standard drugs to patients as some of these drugs were subsequently declared as ‘Not of Standard Quality’ by the laboratories. (Paragraph 2.1.10.2) Stock-out of essential drugs such as Amoxycillin, Ampicillin, etc., was noticed in the district warehouses of KMSCL and in the hospitals test- checked. (Paragraph 2.1.10.4) KMSCL nullified shortfall in stock worth ` 21.23 crore without identifying reasons for the shortfall. (Paragraph 2.1.10.5) 7 Preventive healthcare consists of measures taken to prevent diseases. Promotive health care contributes to a population based health approach in primary care. Curative care seeks to cure an existent disease or medical condition
Transcript of CHAPTER II PERFORMANCE AUDIT - agker.cag.gov.in · 24x7 PHC (Health Block) Primary Health Centres...
11
CHAPTER II
PERFORMANCE AUDIT
HEALTH AND FAMILY WELFARE DEPARTMENT
2.1 Healthcare Services in Government Hospitals
Highlights
Government hospitals in the State offer preventive, promotive and curative
services7. While these services including clinical and surgical interventions of
a simple nature are delivered through Taluk Hospitals, the District, General
and Women and Children Hospitals additionally offer Tertiary care facilities
like Cardiology, Neurology, Paediatric surgery, Plastic surgery and Urology.
A performance audit on Healthcare Services in Taluk, District, General and
Women and Children Hospitals revealed the following:
A perspective plan prescribing a time frame for attaining the
standardisation norms for infrastructure and manpower in the healthcare
institutions was not prepared.
(Paragraph 2.1.6)
Inadequacies in infrastructure facilities viz., power laundry, generators
and deficiencies in number of beds were noticed in the hospitals test-
checked.
(Paragraphs 2.1.8.2 and 2.1.8.3)
Failure of Kerala Medical Services Corporation Limited (KMSCL) in
making suppliers to take back slow moving drugs resulted in loss of ` 2.91
crore to the exchequer.
(Paragraph 2.1.10.1)
Delays in obtaining test results of drugs from the empanelled Drug
Testing Laboratories resulted in administering sub-standard drugs to
patients as some of these drugs were subsequently declared as ‘Not of
Standard Quality’ by the laboratories.
(Paragraph 2.1.10.2)
Stock-out of essential drugs such as Amoxycillin, Ampicillin, etc., was
noticed in the district warehouses of KMSCL and in the hospitals test-
checked.
(Paragraph 2.1.10.4)
KMSCL nullified shortfall in stock worth ` 21.23 crore without
identifying reasons for the shortfall.
(Paragraph 2.1.10.5)
7 Preventive healthcare consists of measures taken to prevent diseases. Promotive health care contributes
to a population based health approach in primary care. Curative care seeks to cure an existent disease
or medical condition
Audit Report (General and Social Sector) for the year ended 31 March 2013
12
Trauma Care & Emergency Medical Services and Blood bank facilities
were not available in many hospitals.
(Paragraphs 2.1.11.1 and 2.1.11.3)
Shortage of doctors was noticed in the hospitals test-checked.
(Paragraph 2.1.13.1)
2.1.1 Introduction
Healthcare services are generally classified into preventive, promotive and
curative services. The preventive and promotive services are delivered through
primary level institutions such as Sub-Centres, Primary Health Centres and
Community Health Centres. All institutions deliver curative services in
varying capacity and standards.
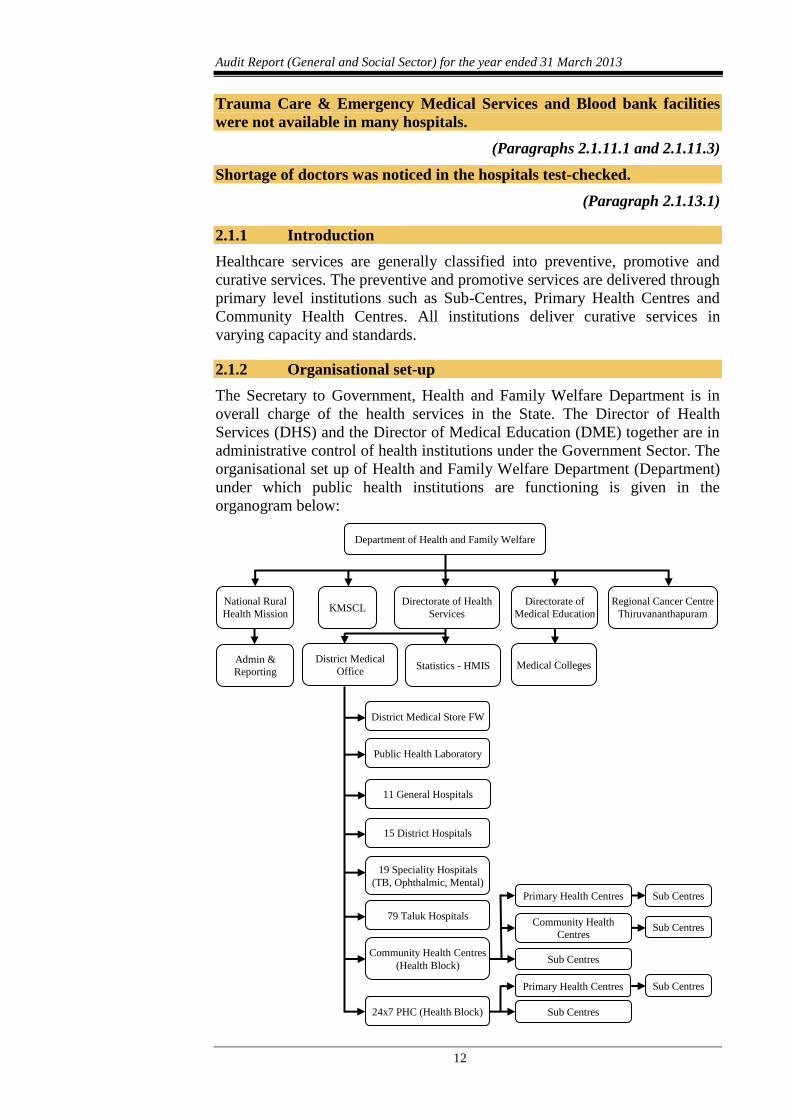
2.1.2 Organisational set-up
The Secretary to Government, Health and Family Welfare Department is in
overall charge of the health services in the State. The Director of Health
Services (DHS) and the Director of Medical Education (DME) together are in
administrative control of health institutions under the Government Sector. The
organisational set up of Health and Family Welfare Department (Department)
under which public health institutions are functioning is given in the
organogram below:
Department of Health and Family Welfare
National Rural
Health Mission KMSCL
Directorate of Health
Services
Directorate of
Medical Education
Regional Cancer Centre
Thiruvananthapuram
Admin &
Reporting
District Medical
Office Statistics - HMIS Medical Colleges
District Medical Store FW
Public Health Laboratory
11 General Hospitals
15 District Hospitals
19 Speciality Hospitals
(TB, Ophthalmic, Mental)
79 Taluk Hospitals
Community Health Centres
(Health Block)
24x7 PHC (Health Block)
Primary Health Centres
Community Health
Centres
Sub Centres
Sub Centres
Sub Centres
Primary Health Centres
Sub Centres
Sub Centres
Chapter II – Performance Audit
13
Management of taluk hospitals within the Block Panchayath/Municipal area is
vested with the concerned Block Panchayath/Municipal Corporation. The
management of District Hospitals is vested with the respective District
Panchayath.
2.1.3 Audit Objectives
The audit objectives of conducting performance audit were to assess whether:
the planning process was adequate to improve quality of healthcare
services;
the financial resources were adequate and effectively used;
adequate infrastructure and manpower were available to deliver the
healthcare services in hospitals;
proper system existed to ensure quality and adequacy in procurement
and inventory management of drugs and equipments; and
disposal of solid and bio-medical wastes generated by hospitals was as
per norms.
2.1.4 Audit Criteria
Audit findings were benchmarked against the following criteria:
Policies/strategies of the Directorate of Health Services in the annual
plan;
Budget documents, Appropriation and Finance Accounts and records
of KMSCL;
Norms for staff, infrastructure and other facilities for the hospitals as
prescribed in the Standardisation Report approved by the State
Government in 2008;
Guidelines/instructions issued by the Central/State Governments for
procurement of medical equipment and drugs;
Provisions for the quality of drugs envisaged in the Drugs and
Cosmetics Act, 1940, as amended from time to time; and
Provisions in the Bio-Medical Waste (Management & Handling)
Rules, 1998 for the disposal of solid and bio-medical waste.
2.1.5 Scope and methodology
Mention was made in the Audit Reports of C&AG of India, Government of
Kerala (Civil) for the year ended 31 March 2009 and 31 March 2010 on the
implementation of the National Rural Heath Mission (Paragraph 1.2) covering
Primary Health Centres (PHCs) and Community Health Centres (CHCs) and
functioning of the medical college hospitals (Paragraph 3.1) in the State
respectively. The current performance audit on healthcare services in
Government hospitals covered Taluk hospitals (TH), District Hospitals (DH),
General Hospitals (GH) and Women and Children (W&C) Hospitals in the
State under the control of DHS. Performance audit covering the period 2008-
13 was carried out from April 2013 to July 2013 by test check of records in the
Audit Report (General and Social Sector) for the year ended 31 March 2013
14
Department, the DHS, the District Medical Offices (DMOs), the KMSCL and
338 Health institutions selected from five
9 out of 14 districts. The sample
health institutions were selected for detailed audit by adopting three-tier
stratification sampling and PPSWOR10
. As part of gathering evidence,
physical verifications were conducted along with the departmental Officers
and photographic evidence was obtained wherever possible.
An entry conference was held with the Principal Secretary to Government,
Health and Family Welfare Department in April 2013 during which the audit
objectives and criteria were discussed and audit methodology explained.
An exit conference was held in October 2013 with the Secretary to
Government, Health and Family Welfare Department during which the audit
findings were discussed in detail. Views of the State Government and replies
of the departmental officers were taken into consideration while finalising the
report.
Audit findings
2.1.6 Planning
State Government approved (May 2008) the Report of the Standardisation
Committee11
prescribing the standardisation norms for Medical Institutions in
the State. For the early attainment of the norms fixed for infrastructure,
manpower, etc., in health institutions, an effective planning process was
essential for the Health Department to marshal its financial and human
resources. Audit noticed that no appraisal was conducted by the department to
identify the current status of the hospitals vis-a-vis the standardisation norms
of the State Government. A comprehensive picture at the State level on the
availability of major diagnostic services in the hospitals was not available with
the DHS. A perspective plan prescribing a time frame for attaining the
standardisation norms in the health institutions was not prepared by the
Department. While the Department had an Annual Plan as part of the five year
plan of the Department, it did not prescribe methodologies or lay a timeline to
achieve the standardisation norms. Further, on the lines of the National Health
Policy, 2002, only a draft Health policy was formulated which is yet to be
adopted by the State Government (December 2013).
In the exit conference (October 2013), Secretary stated that an expert
committee had been constituted to make an indepth study on the draft health
policy, which would be finalised by December 2013. However, the policy has
not been finalised so far (January 2014).
8 Five District hospitals, three General hospitals, 23 Taluk Hospitals and two W&C hospitals 9 Alappuzha, Idukki, Kasaragod, Thiruvananthapuram and Thrissur, 10 Probability Proportional to Size Without Replacement 11 A committee constituted by the Government (May 2002) to recommend standards for service delivery,
infrastructure, equipment and staff pattern under the Health Services Department. Meanwhile, GOI
issued (February 2007), Indian Public Health Standards (IPHS) for institutions like PHCs, CHCs and
Sub-Centres which was adopted by State Government. In respect of Taluk, District, General and
Speciality Hospitals for which IPHS was not applicable, State Government accepted (May 2008) the
Standardisation Committee Report of 2002 as the basic document for upgradation. IPHS for District
Hospitals was issued by GOI in 2011
Chapter II – Performance Audit
15
2.1.7 Funding
Consequent to adoption of the Kerala Panchayathi Raj Act, 1994, management
of medical institutions upto DHs in the State had been transferred to
Panchayathi Raj Institutions (PRIs). The expenditure on electricity and water
charges, dietary charges, repairs/maintenance of buildings, day-to-day
expenditure of hospitals were met by the PRIs from their budgetary allocations
and by Hospital Development Committees (HDC)12
from the collection
charges on various services rendered by them. Salaries of doctors and staff,
cost of drugs and equipment were met by the State Government. Since 2008-
09, procurement of all drugs and equipment for the Government hospitals in
the State was made through KMSCL, a State Government undertaking. While
funds for the purchase of drugs for supply to hospitals under DHS/DME were
made available to KMSCL by the State Government through budget
allocation, the cost of equipment to be purchased for Government hospitals
was released to KMSCL by the DHS on getting specific sanctions from the
State Government. Details of funds provided by the State Government for pay
and allowances of staff of hospitals under DHS, funds released by the State
Government/DHS to KMSCL for procurement of drugs and equipment and
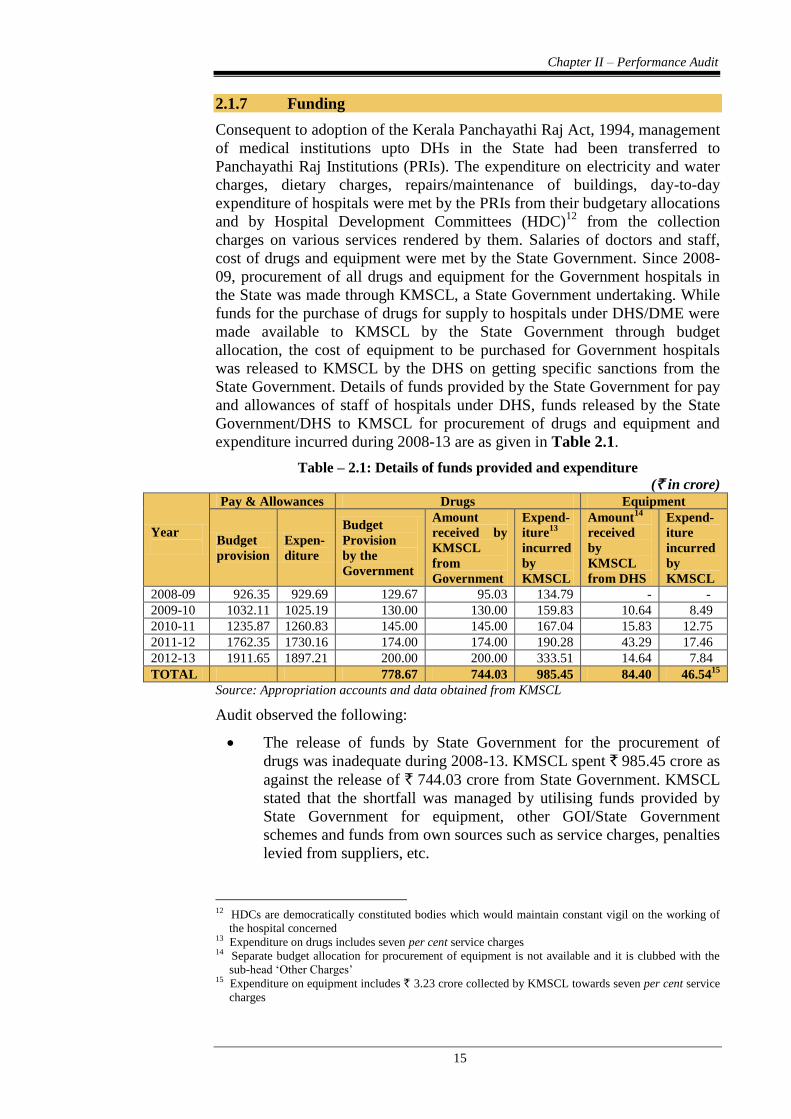
expenditure incurred during 2008-13 are as given in Table 2.1.
Table – 2.1: Details of funds provided and expenditure
(` in crore)
Year
Pay & Allowances Drugs Equipment
Budget
provision
Expen-
diture
Budget
Provision
by the
Government
Amount
received by
KMSCL
from
Government
Expend-
iture13
incurred
by
KMSCL
Amount14
received
by
KMSCL
from DHS
Expend-
iture
incurred
by
KMSCL
2008-09 926.35 929.69 129.67 95.03 134.79 - -
2009-10 1032.11 1025.19 130.00 130.00 159.83 10.64 8.49
2010-11 1235.87 1260.83 145.00 145.00 167.04 15.83 12.75
2011-12 1762.35 1730.16 174.00 174.00 190.28 43.29 17.46
2012-13 1911.65 1897.21 200.00 200.00 333.51 14.64 7.84
TOTAL 778.67 744.03 985.45 84.40 46.5415
Source: Appropriation accounts and data obtained from KMSCL
Audit observed the following:
The release of funds by State Government for the procurement of
drugs was inadequate during 2008-13. KMSCL spent ` 985.45 crore as
against the release of ` 744.03 crore from State Government. KMSCL
stated that the shortfall was managed by utilising funds provided by
State Government for equipment, other GOI/State Government
schemes and funds from own sources such as service charges, penalties
levied from suppliers, etc.
12 HDCs are democratically constituted bodies which would maintain constant vigil on the working of
the hospital concerned 13 Expenditure on drugs includes seven per cent service charges 14 Separate budget allocation for procurement of equipment is not available and it is clubbed with the
sub-head ‘Other Charges’ 15 Expenditure on equipment includes ` 3.23 crore collected by KMSCL towards seven per cent service
charges
Audit Report (General and Social Sector) for the year ended 31 March 2013
16
Out of ` 84.40 crore received for procurement of equipment, KMSCL
utilised only ` 46.54 crore. Equipment like ECG/X-ray machines, Ultra
sound scanners, cytoscopy instruments, light source, etc., indented by
the DHS were not procured leading to shortage of critical equipment in
various hospitals as brought out in paragraph 2.1.9.2.
State Government introduced a scheme (November 2012) for distribution of
free generic drugs to all patients (other than those who pay income tax)
including those in pay wards. The scheme envisaged that expenditure for the
scheme would be met from one per cent cess to be collected by the Kerala
State Beverages Corporation Limited (KSBCL). Though KSBCL collected
and remitted ` 26.01 crore to the State Government account, the amount was
not transferred by State Government to KMSCL as of July 2013.
In the exit conference (October 2013), Secretary stated that modalities would
be worked out in consultation with the Finance Department for releasing the
amount to KMSCL.
2.1.8 Infrastructure
Development of infrastructure facilities in public health institutions as per
standardisation norms is essential for providing quality medical services. PRIs
in the State were entrusted with the management of hospitals upto district
level. While PRIs meet recurring and maintenance charges of these hospitals,
State Government and National Rural Health Mission (NRHM) meet
expenditure on major civil works.
2.1.8.1 Uneven distribution of hospitals
As per the Report of Standardisation Committee, each taluk should have a TH
and each district should have a DH. Against 63 taluks in the State, there were
80 THs as of March 2013. While seven taluks16
did not have Taluk level
hospitals, taluks such as Chirayankeezhu (Thiruvananthapuram district),
Hosdurg (Kasaragod district), Thalappilly and Mukundapuram taluks
(Thrissur district) were having more than one TH.
2.1.8.2 Inadequacies in infrastructure
The major items of infrastructure facilities to be provided in the THs, DHs,
GHs and W&C hospitals as per the standardisation norms and the position of
availability in respect of 3317
hospitals test-checked are given in
Appendix 2.1.
Some of the shortcomings in the available infrastructure noticed in the test-
checked hospitals were as under:
Out of the 23 THs test-checked, Communicable diseases ward and
Geriatric and Palliative care ward were available only in four and three
THs respectively. Only three out of five DHs have Communicable
diseases ward and none of the DHs have Geriatric and Palliative care
ward.
16 Adoor, Kasaragod, Kozhencherry, Mananthavady, Mavelikkara, Thrissur and Tirur 17 Taluk Hospital:23; District Hospital: 5; General Hospital: 3 and W&C Hospital: 2
Chapter II – Performance Audit
17
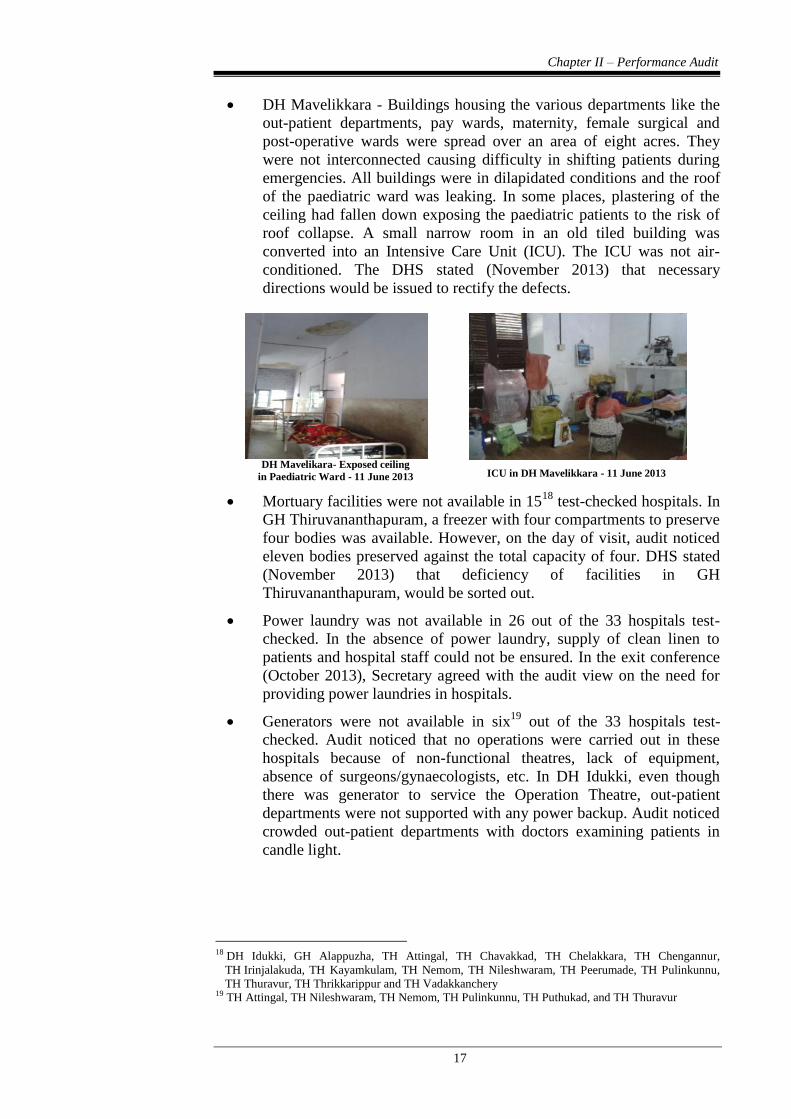
DH Mavelikkara - Buildings housing the various departments like the
out-patient departments, pay wards, maternity, female surgical and
post-operative wards were spread over an area of eight acres. They
were not interconnected causing difficulty in shifting patients during
emergencies. All buildings were in dilapidated conditions and the roof
of the paediatric ward was leaking. In some places, plastering of the
ceiling had fallen down exposing the paediatric patients to the risk of
roof collapse. A small narrow room in an old tiled building was
converted into an Intensive Care Unit (ICU). The ICU was not air-
conditioned. The DHS stated (November 2013) that necessary
directions would be issued to rectify the defects.
DH Mavelikara- Exposed ceiling
in Paediatric Ward - 11 June 2013
ICU in DH Mavelikkara - 11 June 2013
Mortuary facilities were not available in 1518
test-checked hospitals. In
GH Thiruvananthapuram, a freezer with four compartments to preserve
four bodies was available. However, on the day of visit, audit noticed
eleven bodies preserved against the total capacity of four. DHS stated
(November 2013) that deficiency of facilities in GH
Thiruvananthapuram, would be sorted out.
Power laundry was not available in 26 out of the 33 hospitals test-
checked. In the absence of power laundry, supply of clean linen to
patients and hospital staff could not be ensured. In the exit conference
(October 2013), Secretary agreed with the audit view on the need for
providing power laundries in hospitals.
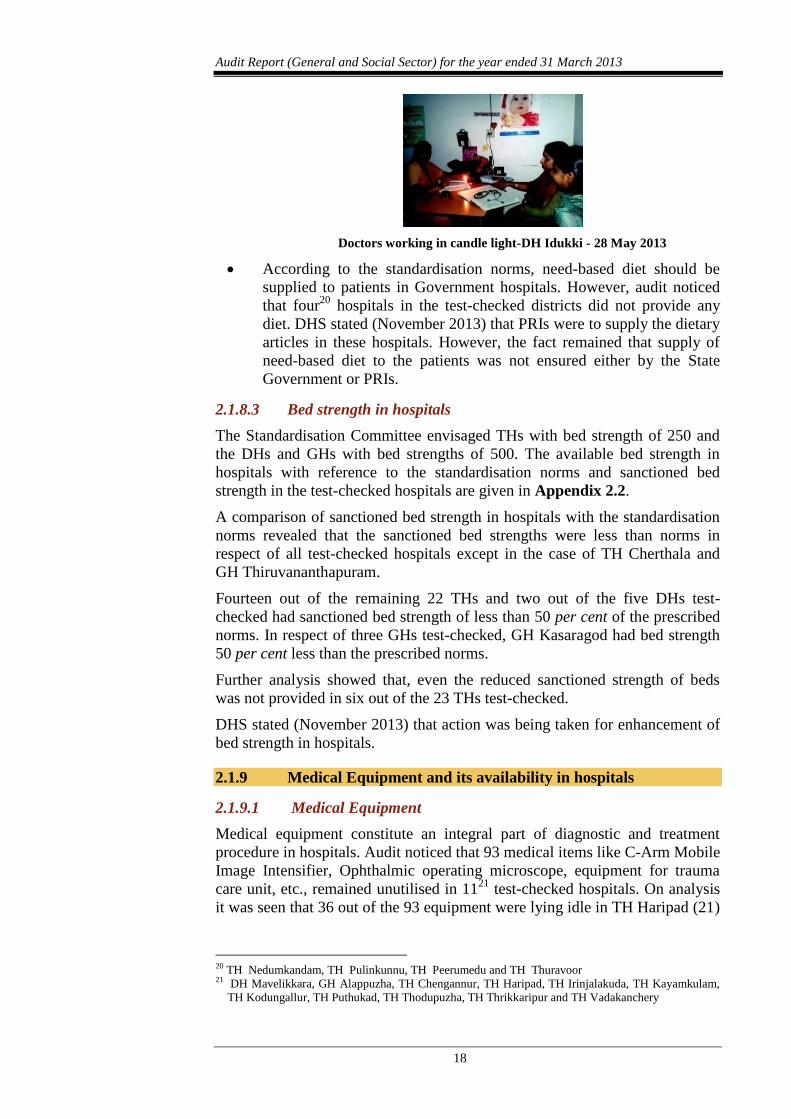
Generators were not available in six19
out of the 33 hospitals test-
checked. Audit noticed that no operations were carried out in these
hospitals because of non-functional theatres, lack of equipment,
absence of surgeons/gynaecologists, etc. In DH Idukki, even though
there was generator to service the Operation Theatre, out-patient
departments were not supported with any power backup. Audit noticed
crowded out-patient departments with doctors examining patients in
candle light.
18 DH Idukki, GH Alappuzha, TH Attingal, TH Chavakkad, TH Chelakkara, TH Chengannur,
TH Irinjalakuda, TH Kayamkulam, TH Nemom, TH Nileshwaram, TH Peerumade, TH Pulinkunnu,
TH Thuravur, TH Thrikkarippur and TH Vadakkanchery 19 TH Attingal, TH Nileshwaram, TH Nemom, TH Pulinkunnu, TH Puthukad, and TH Thuravur
Audit Report (General and Social Sector) for the year ended 31 March 2013
18
Doctors working in candle light-DH Idukki - 28 May 2013
According to the standardisation norms, need-based diet should be
supplied to patients in Government hospitals. However, audit noticed
that four20
hospitals in the test-checked districts did not provide any
diet. DHS stated (November 2013) that PRIs were to supply the dietary
articles in these hospitals. However, the fact remained that supply of
need-based diet to the patients was not ensured either by the State
Government or PRIs.
2.1.8.3 Bed strength in hospitals
The Standardisation Committee envisaged THs with bed strength of 250 and
the DHs and GHs with bed strengths of 500. The available bed strength in
hospitals with reference to the standardisation norms and sanctioned bed
strength in the test-checked hospitals are given in Appendix 2.2.
A comparison of sanctioned bed strength in hospitals with the standardisation
norms revealed that the sanctioned bed strengths were less than norms in
respect of all test-checked hospitals except in the case of TH Cherthala and
GH Thiruvananthapuram.
Fourteen out of the remaining 22 THs and two out of the five DHs test-
checked had sanctioned bed strength of less than 50 per cent of the prescribed
norms. In respect of three GHs test-checked, GH Kasaragod had bed strength
50 per cent less than the prescribed norms.
Further analysis showed that, even the reduced sanctioned strength of beds
was not provided in six out of the 23 THs test-checked.
DHS stated (November 2013) that action was being taken for enhancement of
bed strength in hospitals.
2.1.9 Medical Equipment and its availability in hospitals
2.1.9.1 Medical Equipment
Medical equipment constitute an integral part of diagnostic and treatment
procedure in hospitals. Audit noticed that 93 medical items like C-Arm Mobile
Image Intensifier, Ophthalmic operating microscope, equipment for trauma
care unit, etc., remained unutilised in 1121
test-checked hospitals. On analysis
it was seen that 36 out of the 93 equipment were lying idle in TH Haripad (21)
20 TH Nedumkandam, TH Pulinkunnu, TH Peerumedu and TH Thuravoor 21 DH Mavelikkara, GH Alappuzha, TH Chengannur, TH Haripad, TH Irinjalakuda, TH Kayamkulam,
TH Kodungallur, TH Puthukad, TH Thodupuzha, TH Thrikkaripur and TH Vadakanchery
Chapter II – Performance Audit
19
and TH Thrikkaripur (15) for periods ranging between 2.5 and 3.5 years. In
four hospitals, 15 items were lying idle for more than five years.
It was noticed that the equipment were not utilised mainly due to non-
functioning of infrastructure facilities like operation theatre, labour room,
blood storage units, etc., and shortage of staff. The department had not
furnished any specific reply for the steps taken for making the equipment
functional.
2.1.9.2 Availability of diagnostic equipment
ECG, X-ray and Ultra Sound Scanners are essential diagnostic equipment for
providing quality medical care to patients. Audit noticed that Ultra Sound
scanners were not available in 19 out of the 23 THs test-checked. None of the
above facilities were available in THs Nemom and Attingal. The status of
availability of diagnostic services in the test-checked hospitals is given in
Appendix 2.3.
The Standardisation Committee recommended for making available
CT Scanners in all District and General Hospitals. Audit noticed that
CT Scanners were not available in the GH Alappuzha and in any of the DHs
test-checked.
2.1.9.3 Safety measures in X-Ray centres
Atomic Energy Regulatory Board (AERB) guidelines (August 2004) on
licensing of X-ray units provide for issuing of licence for operating radiation
installations after inspecting the working practices being followed to ensure
adherence to prescribed safety standards, availability of appropriate radiation
monitors and dosimetry devices for purposes of radiation surveillance, etc. In
Kerala, the Director of Radiation Safety (DRS) is the authorised agency to
issue licences on behalf of AERB.
Audit noticed that 27 out of 33 hospitals test-checked offered X-ray services.
However, in 1822
out of the 27 hospitals, X-Ray machines were operated
without obtaining Certification of Safety from the DRS. Superintendents of
four23
hospitals stated that necessary steps were being taken to obtain
certification from DRS and to provide Thermo Luminescence Dosimeter
(TLD) film badges to technicians.
Audit noticed that the technicians manning the X-ray units in 1724
hospitals
were not provided with TLD film badges to indicate levels of exposure to
radiation. In the absence of TLD badges and safety certification from the DRS,
audit could not obtain reasonable assurance that patients and technicians were
not being exposed to more than permissible radiation levels.
22 DH Mavelikkara, DH Peroorkada, DH Thrissur, GH Alappuzha, TH Adimaly, TH Chalakudy,
TH Chavakkad, TH Chelakkara, TH Chengannur, TH Haripad, TH Irinjalakuda, TH Kayamkulam,
TH Nedumkandam, TH Peerumade, TH Thodupuzha, TH Thuravur, TH Vadakkancherry and
TH Varkala 23 DH Mavelikkara, TH Chavakkad, TH Haripad and TH Thodupuzha 24 DH Idukki, DH Kanhangad, DH Mavelikkara, DH Thrissur, GH Thiruvananthapuram, TH Adimali,
TH Chelakkara, TH Chengannur, TH Haripad, TH Irinjalakuda, TH Kayamkulam, TH Kodungallur,
TH Kunnamkulam, TH Pulinkunnu, TH Thuravur, TH Vadakkancherry, and TH Varkala
Audit Report (General and Social Sector) for the year ended 31 March 2013
20
DRS stated (August 2013) that most of the public sector medical institutions
neglected the mandatory conditions despite issue of repeated directions.
2.1.10 Procurement and management of drugs and medical devices
2.1.10.1 Procurement of drugs without the stipulated shelf-life
Tender conditions of KMSCL required that the drugs supplied should have the
stipulated shelf-life. There was also provision in the tender documents that the
tenderers shall take back drugs which were not utilised by KMSCL within the
shelf-life period based on mutual agreement. To minimise the expiry of drugs
in the hospitals and warehouses, an efficient system of First Expiry First Out
(FEFO) method was to be followed by KMSCL.
Audit scrutiny revealed that KMSCL procured 321 drugs comprising 16,529
batches costing ` 92.66 crore without the stipulated shelf-life during 2008-13.
KMSCL was also not following an effective FEFO method for issue of drugs
to hospitals. During 2008-13, drugs costing ` 2.91 crore became time expired
and the KMSCL did not take any action to get the same replaced by the
suppliers as stipulated in the tender conditions. Thus, failure on the part of
KMSCL to follow the tender conditions resulted in a loss of ` 2.91 crore to
State Government.
In the exit conference, Secretary agreed with the audit findings and stated that
a detailed audit would be conducted at the KMSCL after consultation with the
Finance Department.
2.1.10.2 Testing of drugs
According to the procedure prescribed and followed by KMSCL, all batches
of drugs procured were to be subjected to quality tests through its empanelled
laboratories. According to the standard operating procedure followed by
KMSCL for ensuring quality of drugs, the empanelled quality testing
laboratories were required to submit test reports of sterile and non-sterile25
samples within 15 and 30 days respectively from the date of receipt of the
samples by them. Drugs declared as ‘Not of Standard Quality (NSQ)’ were to
be frozen and not to be issued to hospitals. It was also seen that out of 37,112
batches, in 25,342 batches the empanelled laboratories failed to submit the test
result within the stipulated time. Analysis revealed that, in 970 batches the
delay ranged from 50 to 100 days, in 155 batches the delay ranged from 101 to
200 days, in 41 batches the delay ranged from 201 to 300 days and in four
batches the delay was between 300 and 395 days.
Audit noticed that during 2008-13, only 37,112 out of 47,650 batches of 1,158
drugs procured were tested for quality and 382 batches were declared as NSQ.
Out of the above, only 260 batches of drugs were frozen at the warehouses of
KMSCL and the remaining 122 batches of the substandard drugs were issued
to hospitals due to delay in receipt of test results. In 23 out of the 33 hospitals
test-checked, it was noticed that the delay in receipt of intimation of NSQ
drugs resulted in administration of sub-standard drugs to patients.
25 Sterile products refer to products that are free from microbial organisms eg. Injection, sutures, etc. and
products which are not sterile are termed as non-sterile
Chapter II – Performance Audit
21
Audit scrutiny also revealed that certain drugs like insulin, anti-venom and
anti-rabies vaccine, paracetamol, antibiotics, etc., purchased by KMSCL were
not subjected to quality tests despite KMSCL collecting Handling and Testing
charges of ` 3.58 crore from the suppliers of these drugs during review period.
By not conducting the required quality tests, the risk of patients consuming
substandard drugs cannot be ruled out.
The Secretary in the exit conference stated that the delay in obtaining results
from the laboratories would be looked into. He also agreed that the risk of
administering NSQ drugs to patients was a very serious issue and would be
taken care of on priority basis.
Regarding non-testing of drugs, KMSCL stated (September 2013) that drugs
requiring cold storage conditions, X-ray films and chemicals, etc., were not
tested as no empanelled laboratory had provisions for their testing. However,
the reply does not explain why drugs like paracetamol, antibiotics etc. were
not sent for testing.
2.1.10.3 Presence of expired drugs in hospital wards
Drugs with expired shelf life were to be reckoned as bio-medical waste and
not to be consumed. Audit noticed that in six26
hospitals, lack of monitoring of
the life cycle of drugs resulted in their time expiry. Expired drugs were stored
in various nursing stations and wards along with normal drugs for eventual
distribution to patients. In TH Attingal, expired drugs like Metoclopramide
Injection and Adrenaline Injection were kept along with normal drugs in the
ward.
In the exit conference, the Secretary stated that presence of expired drugs in
hospital wards was due to lack of computerisation of pharmacies and stores
and assured that necessary instructions would be issued to hospitals.
2.1.10.4 Stock-out of drugs in warehouses/hospitals
Ensuring the uninterrupted supply of essential drugs to hospitals plays a vital
role in the delivery of quality healthcare services in hospitals. KMSCL was to
ensure stocking of sufficient quantity of essential drugs in its warehouses.
Analysis of the stock of essential drugs in KMSCL as on 31 March of each
year during the period 2008-1227
revealed that essential items of drugs
including vital drugs such as Amoxycillin, Ampicillin, Cloxacillin, etc., were
out of stock in the warehouses. It was observed that there was stock-out of 35
to 48 per cent of items of essential drugs in the warehouses as on 31 March of
each year during the period 2008-12. Maximum shortage of drugs ranging
from 61 to 66 per cent was noticed in the Wayanad and Kasaragod district
warehouses of KMSCL. Stock-out of drugs in warehouses resulted in stock-
out of drugs in hospitals. In test-checked hospitals, audit noticed stock-out of
essential drugs on the dates of visit by audit. The stock-out of drugs resulted in
purchase of drugs by the patients from private medical shops. The
26 GH Thiruvananthapuram, TH Adimali, TH Attingal, TH Irinjalakuda, TH Nemom and
TH Thrikkarippur 27 Figures relating to 2012-13 were not available at the time of audit
Audit Report (General and Social Sector) for the year ended 31 March 2013
22
Superintendent, W&C hospital, Alappuzha attributed the stock-out of drugs in
the hospital to irregular supply of drugs by KMSCL.
2.1.10.5 Huge variation in physical stock and system stock of drugs
Audit analysis revealed that KMSCL had not conducted the annual/periodical
physical verification of stock with the system stock from its inception in
November 2007. The statutory auditors of KMSCL pointed out the variation in
physical stock vis-à-vis system stock of KMSCL in the audit reports for 2008-
09 and 2009-10. But, KMSCL conducted a detailed stock taking of drugs only
in March 2013. The physical stock taking by KMSCL in its drug warehouses
revealed variations to the extent of ` 21.23 crore between the actual stock
available in the warehouses vis-à-vis system stock maintained in KMSCL.
KMSCL decided to introduce a process wherein the excess and shortage
would be nullified and making the system stock equal to the stock physically
available in the warehouses as on 1 April, 2013. For this, it was decided to
create fictitious purchase orders (POs)/Material Issue Notes (MINs) in the
name of fictitious suppliers/institutions. Based on these fictitious POs and
MINs, the net shortage of stock of ` 21.23 crore in the warehouses was
nullified and physical stock was taken as system stock. This is not a standard
accounting procedure to set right a system stock, and hence the possibility of
using this practice for stock misappropriation could not be ruled out.
The Governing Body of KMSCL while ratifying the action of the Managing
Director in making the system stock equal to the stock physically available in
warehouses as on 1 April 2013, directed to find out the reasons for the
variation. But KMSCL did not analyse the causes of variation as of September
2013.
Audit observed that the deficiency in inventory management could have been
rectified, if stock taking had been done periodically. Due to non-conducting of
stock taking, there was accumulation of huge shortage of stock over the years
making it difficult for KMSCL to evaluate the reasons for variation and take
corrective measures.
Audit noticed that while in the case of time expired drugs, KMSCL obtained
orders from the State Government to write off ` 1.13 crore, but shortage of
stock worth ` 21.23 crore was nullified by the Governing Body without
obtaining any orders from State Government. This requires detailed
investigation.
In the exit conference, Secretary stated that a detailed audit would be
conducted in consultation with the Finance Department.
2.1.10.6 Procurement of medical devices at higher price
KMSCL in its tender documents stipulated that the type, nature and quality of
evaluation tests were the prerogative of its technical committee. Audit noticed
that in the case of supply of medical devices for 2011-12, tenders of 10 out of
11 firms were rejected on technical grounds. There was undue delay in
finalisation of tenders and placing purchase orders resulting in stock-out
position in warehouses and hospitals during 2011-12. Citing urgency of the
situation, KMSCL placed supply orders with M/s B.Braun Medicals India
Ltd., the only firm approved by the Technical Committee for 10 items of
Chapter II – Performance Audit
23
medical devices. The rates quoted and approved for procurement of six items
from this supplier during 2011-12 were higher than the prices at which these
products were procured by the MCT28
during the same period by ` 4.35 crore.
Similarly, during 2011-12 the KMSCL procured IV set with needle at the rate
of ` 24 per unit. KMSCL procured the same item during 2010-11 and 2012-13
at the rate of ` 3.28 and ` 10.10 per unit respectively. As the MCT rate was
not available, audit made a cost comparison of this item purchased in 2011-12
with respect to the cost of the item procured in 2012-13 and found that the
KMSCL incurred an extra expenditure of ` 3.05 crore. Thus, KMSCL
incurred an additional expenditure to the tune of ` 7.40 crore in the above
purchases. KMSCL admitted the audit observations and stated that they were
forced to procure the drugs from M/s B.Braun Medicals India Ltd due to acute
shortfall of drugs in hospitals.
The reply is not acceptable as KMSCL also admitted that it had not fixed any
timeline for finalisation of tenders. The delay in finalisation of tenders and
resultant additional expenditure of ` 7.40 crore could have been prevented if
specific timeline for finalisation of tenders was stipulated and adhered to.
2.1.11 Services
The standardisation norms of the State Government stipulated making
available casualty services in THs also. Audit noticed that two29
out of 33
hospitals test-checked did not provide casualty services in THs. General,
District and W&C hospitals must provide 24x7 services in laboratory,
pharmacy, blood bank/blood storage, X-ray and ECG while THs were to
provide these services at least till 5 PM. Major services in hospitals were
analysed in audit and the results are given in succeeding paragraphs.
2.1.11.1 Trauma Care and Emergency Medical Services
The standardisation norms provided for availability of Trauma Care and
Emergency Medical Services in the THs, DHs and GHs. Audit noticed the
following:
Trauma Care and Emergency Medical Services were not available in
22 THs, five DHs and three GHs test-checked.
In the GH Alappuzha, a building exclusively for Trauma Care Unit
was completed (February 2011) at a cost of ` 1.83 crore but the unit
has not yet started functioning (July 2013) due to lack of equipment
and additional manpower.
A building for Trauma Care constructed in TH Haripad at a cost of
` 49.56 lakh was completed in November 2009 and was not functional
due to lack of manpower. Instead, it currently accommodates a
casualty wing and an operation theatre.
The importance of having a fully equipped Trauma Care Unit can be gauged
from the fact that the number of persons admitted to the GH
Thiruvananthapuram, as a result of injuries sustained in road accidents shot up
28 Medical College Thiruvananthapuram 29 TH Thuravur in Alappuzha and TH Nileshwaram in Kasaragod districts
Audit Report (General and Social Sector) for the year ended 31 March 2013
24
from 212 cases in 2009-10 to 2204 in 2012-13. However, the hospital still
does not have a Trauma Care Unit.
2.1.11.2 Speciality services in hospitals
According to the standardisation norms THs, DHs, GHs and W&C hospitals
were to offer stipulated speciality services30
.
Audit noticed that except DH Kanhangad, DH Thrissur, GH Kasaragod,
TH Chalakudy and TH Thodupuzha, no other Government hospital in the test-
checked districts provided all the required speciality out-patient (OP) services
as per standardisation norms. The details of speciality OP services not
available in the other test-checked hospitals are given in Appendix 2.4.
2.1.11.3 Blood banks
Blood banks/storage centres are an essential element in the functioning of
Taluk, District, General and W&C hospitals as stipulated in the
Standardisation Committee Report and Government order dated 22 February
2010. Licence issued by the Drugs Controller (DC) is mandatory to run a
blood bank. Application for blood bank licence should be submitted by the
hospital authorities to the DC along with a ‘No Objection Certificate (NOC)’
from Kerala State Blood Transfusion Council. On receipt of the application,
the DC may issue the licence. Application for renewal should be submitted
three months before the expiry of licence following the same procedure. Audit
noticed the following:
There was no blood bank in GH Alappuzha. The blood banks at
DH Thrissur, GH Thiruvananthapuram, GH Kasaragod and W&C
hospitals at Thiruvananthapuram and Alappuzha were functioning
without renewing their licences. The Blood Storage Centre at DH
Mavelikkara was non-functional since July 2012 due to equipment
failure.
Out of the 23 THs test-checked, only TH Irinjalakuda had blood
storage centre. Further, audit noticed that the blood bank/blood storage
centres sanctioned by State Government in six31
THs, were not
functioning due to lack of infrastructure facilities/trained manpower.
In the absence of blood banks in the hospitals, patients had to depend on
private blood banks for obtaining blood.
In the reply, DHS stated (November 2013) that action was being taken to
operationalise blood banks/storage centres in respect of the six hospitals by
obtaining NOC from the authorities concerned.
30 Taluk hospitals: General Medicine, General Surgery, Obstetrics & Gynaecology, Paediatrics,
Anesthesia, ENT, Ophthalmology, Dermatology, Orthopedics, Psychiatry, Clinical Pathology and
Dental Surgery
Additional services in District and General Hospitals: Radiology, Forensic medicine, Physical
Medicine & Rehabilitation
W&C hospital: Medical, Surgery, Gynaecology, Paediatrics, Anesthesia, Clinical Pathology and
Radiology 31 TH Chalakkudy, TH Chavakkad, TH Cherthala, TH Kodungalloor, TH Peerumedu and
TH Thodupuzha
Chapter II – Performance Audit
25
2.1.11.4 Hospital Infection Control Standards
Accreditation of hospitals by NABH32
requires that the hospitals take adequate
measures to prevent or reduce the risk of hospital associated infection among
employees and in-patients. Two33
of the hospitals test-checked were having
NABH accreditation and hence required to adhere to Hospital Associated
Infection Control. Audit noticed that in these hospitals, 219 children had
contracted sepsis/pneumonia during 2012-13. The Superintendent,
TH Cherthala attributed it to overcrowding in the obstetric wards, heavy rush
of bystanders and the ward being situated on the top floor and consequent
extreme heat. Superintendent of W&C hospital, Thiruvananthapuram, stated
that the figures were high on account of reporting of all presumed cases to the
higher authorities.
2.1.12 Disposal of bio-medical waste
2.1.12.1 Disposal of bio-medical waste in hospitals
In 30 out of 33 test-checked hospitals, an agency named ‘IMAGE’ was
engaged for disposal of bio-medical wastes. Under the programme, the
hospitals were to segregate waste, store it in containers and bags and label it to
be lifted daily by the personnel of IMAGE for disposal.
According to the Bio-Medical Waste (Management and Handling Rules) 1998,
wastes from laboratory cultures, wastes from production of biological toxins,
dishes and devices used for transfer of cultures were to be disposed of by local
autoclaving/microwaving or incineration. However, it was seen during
physical verification that untreated laboratory wastes and used IV tubes were
being disposed off into drains and into the open causing danger to public
health. Major observations were as under:
In TH Chavakkad, the wastewater from labour room, operation theatre,
Kerala Health Research and Welfare Society pay ward, female and
paediatric wards, mortuary etc., was released into the nearby open
drain without any pre-treatment.
In TH Haripad, the Dialysis Unit with two dialysis machines,
generated an average of 40 litres of bio-medical waste per patient,
which was released into an open drain thereby polluting the nearby
water bodies. Bio-medical liquid waste from the mortuary was also
being released into the public drainage system.
In TH, Nileswaram, even though bio-medical waste was being
disposed of through IMAGE, used IV Tubes with needles attached to
them were seen dumped behind the Tuberculosis Wards. In GH
Alappuzha, empties of IV bottles along with used needles were seen
dumped in the hospital premises. The hospital authorities reported
(November 2013) that the wastes mentioned by audit has been
removed.
32 National Accreditation Board for Hospitals & Healthcare Providers 33 TH Cherthala in Alappuzha district and the W&C Hospital in Thiruvananthapuram district
Audit Report (General and Social Sector) for the year ended 31 March 2013
26
The DHS stated (November 2013) that ` 50 lakh has been allotted in 2013-14
for setting up of a sewage treatment plant in TH Chavakkad.
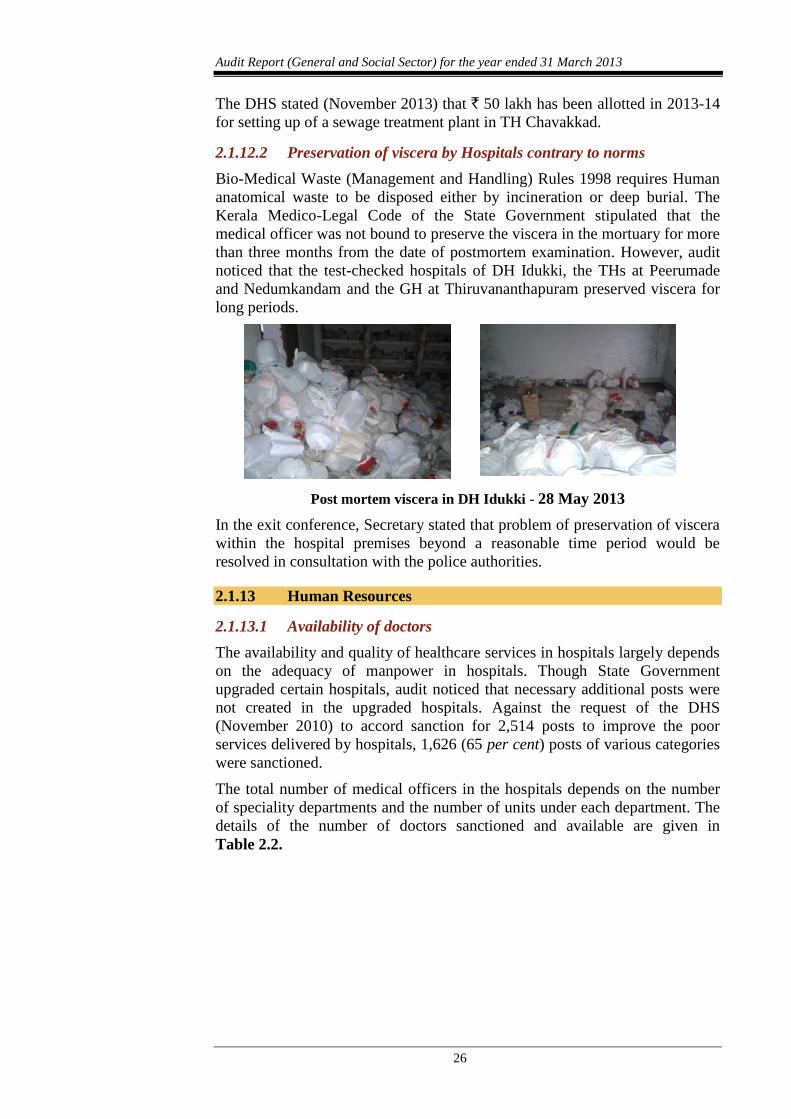
2.1.12.2 Preservation of viscera by Hospitals contrary to norms
Bio-Medical Waste (Management and Handling) Rules 1998 requires Human
anatomical waste to be disposed either by incineration or deep burial. The
Kerala Medico-Legal Code of the State Government stipulated that the
medical officer was not bound to preserve the viscera in the mortuary for more
than three months from the date of postmortem examination. However, audit
noticed that the test-checked hospitals of DH Idukki, the THs at Peerumade
and Nedumkandam and the GH at Thiruvananthapuram preserved viscera for
long periods.
Post mortem viscera in DH Idukki - 28 May 2013
In the exit conference, Secretary stated that problem of preservation of viscera
within the hospital premises beyond a reasonable time period would be
resolved in consultation with the police authorities.
2.1.13 Human Resources
2.1.13.1 Availability of doctors
The availability and quality of healthcare services in hospitals largely depends
on the adequacy of manpower in hospitals. Though State Government
upgraded certain hospitals, audit noticed that necessary additional posts were
not created in the upgraded hospitals. Against the request of the DHS
(November 2010) to accord sanction for 2,514 posts to improve the poor
services delivered by hospitals, 1,626 (65 per cent) posts of various categories
were sanctioned.
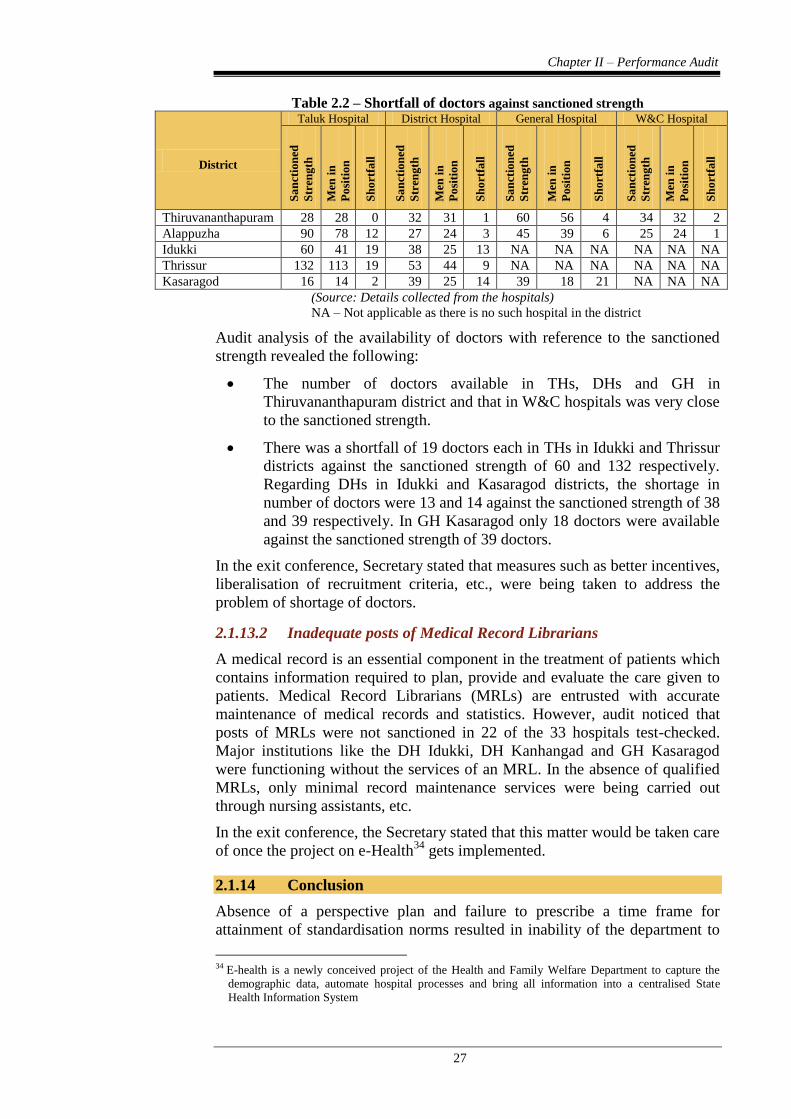
The total number of medical officers in the hospitals depends on the number
of speciality departments and the number of units under each department. The
details of the number of doctors sanctioned and available are given in
Table 2.2.
Chapter II – Performance Audit
27
Table 2.2 – Shortfall of doctors against sanctioned strength
District
Taluk Hospital District Hospital General Hospital W&C Hospital
Sa
nct
ion
ed
Str
eng
th
Men
in
Po
siti
on
Sh
ort
fall
Sa
nct
ion
ed
Str
eng
th
Men
in
Po
siti
on
Sh
ort
fall
Sa
nct
ion
ed
Str
eng
th
Men
in
Po
siti
on
Sh
ort
fall
Sa
nct
ion
ed
Str
eng
th
Men
in
Po
siti
on
Sh
ort
fall
Thiruvananthapuram 28 28 0 32 31 1 60 56 4 34 32 2
Alappuzha 90 78 12 27 24 3 45 39 6 25 24 1
Idukki 60 41 19 38 25 13 NA NA NA NA NA NA
Thrissur 132 113 19 53 44 9 NA NA NA NA NA NA
Kasaragod 16 14 2 39 25 14 39 18 21 NA NA NA
(Source: Details collected from the hospitals)
NA – Not applicable as there is no such hospital in the district
Audit analysis of the availability of doctors with reference to the sanctioned
strength revealed the following:
The number of doctors available in THs, DHs and GH in
Thiruvananthapuram district and that in W&C hospitals was very close
to the sanctioned strength.
There was a shortfall of 19 doctors each in THs in Idukki and Thrissur
districts against the sanctioned strength of 60 and 132 respectively.
Regarding DHs in Idukki and Kasaragod districts, the shortage in
number of doctors were 13 and 14 against the sanctioned strength of 38
and 39 respectively. In GH Kasaragod only 18 doctors were available
against the sanctioned strength of 39 doctors.
In the exit conference, Secretary stated that measures such as better incentives,
liberalisation of recruitment criteria, etc., were being taken to address the
problem of shortage of doctors.
2.1.13.2 Inadequate posts of Medical Record Librarians
A medical record is an essential component in the treatment of patients which
contains information required to plan, provide and evaluate the care given to
patients. Medical Record Librarians (MRLs) are entrusted with accurate
maintenance of medical records and statistics. However, audit noticed that
posts of MRLs were not sanctioned in 22 of the 33 hospitals test-checked.
Major institutions like the DH Idukki, DH Kanhangad and GH Kasaragod
were functioning without the services of an MRL. In the absence of qualified
MRLs, only minimal record maintenance services were being carried out
through nursing assistants, etc.
In the exit conference, the Secretary stated that this matter would be taken care
of once the project on e-Health34
gets implemented.
2.1.14 Conclusion
Absence of a perspective plan and failure to prescribe a time frame for
attainment of standardisation norms resulted in inability of the department to
34 E-health is a newly conceived project of the Health and Family Welfare Department to capture the
demographic data, automate hospital processes and bring all information into a centralised State
Health Information System
Audit Report (General and Social Sector) for the year ended 31 March 2013
28
optimally utilise its financial resources to enhance service delivery in
Government hospitals. Lack of infrastructure and deficiency in human
resources affected the quality of services delivered by hospitals. There was
shortage of doctors in the hospitals test-checked. Blood storage centre was
available only in one of the 23 THs test-checked. Basic facilities like
availability of beds, diet, generator, power laundry, etc., were lacking in many
hospitals. Presence of expired drugs in hospital wards, stock-out of drugs in
pharmacies and non-adherence to timings in laboratory, pharmacy, X-ray and
ECG centres affected the quality of services provided to patients. Trauma care
and emergency medical services were not available in 30 hospitals test-
checked.
The performance audit revealed instances of KMSCL procuring drugs without
the stipulated shelf-life, procurement of drugs at higher prices, non-testing of
drugs for quality and issue of sub-standard drugs to hospitals. During 2008-13,
drugs costing ` 2.91 crore became time expired and the KMSCL did not take
any action to get the same replaced by the suppliers as stipulated in the tender
conditions.
2.1.15 Recommendations
State Government may consider:
drawing a timeframe to enable early achievement of standardisation
norms for infrastructure and human resources in Government hospitals;
early intervention to address the acute shortage of critical health
personnel in hospitals;
setting up Trauma Care Centres in all hospitals;
KMSCL enforcing standard operating procedures to expedite the
testing process and avoid sub-standard drugs being issued to the
hospitals; and
KMSCL streamlining procurement procedure and stipulating timeline
for finalising tenders in order to ensure timely and economic
procurement of quality drugs and avoiding stock-out in
warehouses/hospitals.
The above issues were referred to Government in October 2013; their reply
had not been received (January 2014).
29
REVENUE DEPARTMENT
2.2 District-centric Audit of Wayanad
Highlights
The district-centric audit of Wayanad involved a performance audit of the
significant socio-economic developmental programmes implemented in the
district during 2008-13. The district has 31.24 per cent of the entire tribal
population of the State and a number of schemes specially focusing on tribal
development being implemented in the State were also examined during the
course of the performance audit. The district is lagging behind the State
average in terms of literacy, per capita income and with higher infant
mortality and maternal mortality, school dropout rate, etc. Major audit
findings are given below.
The District Planning Committee neither prepared Integrated District
Development Plan nor consolidated the Local Development Plan. Vital
data available with various agencies were not collected and utilised by the
Local Self-Government Institutions while formulating plans.
(Paragraphs 2.2.7 and 2.2.7.1)
Adequate manpower and infrastructure as per the Indian Public Health
Standards/norms were not available in Community Health Centres and
Primary Health Centres.
(Paragraphs 2.2.9.1 and 2.2.9.2)
The percentage of severely under-weight children among tribal
community was more when compared to other communities in the
district.
(Paragraph 2.2.9.3)
Dropout rate among tribal students was higher than the district average
indicating that the SSA had not produced the desired results.
(Paragraph 2.2.10.2)
Out of 292 drinking water samples tested, only 44 samples conformed to
the desired level of chlorination, indicating the method of chlorination
was unscientific. Test results in more than 50 per cent of samples in 2011-
12 showed presence of coliform bacteria and turbidity indicating that
KWA failed to supply safe drinking water to the public.
(Paragraph 2.2.12.2)
Audit Report (General and Social Sector) for the year ended 31 March 2013
30
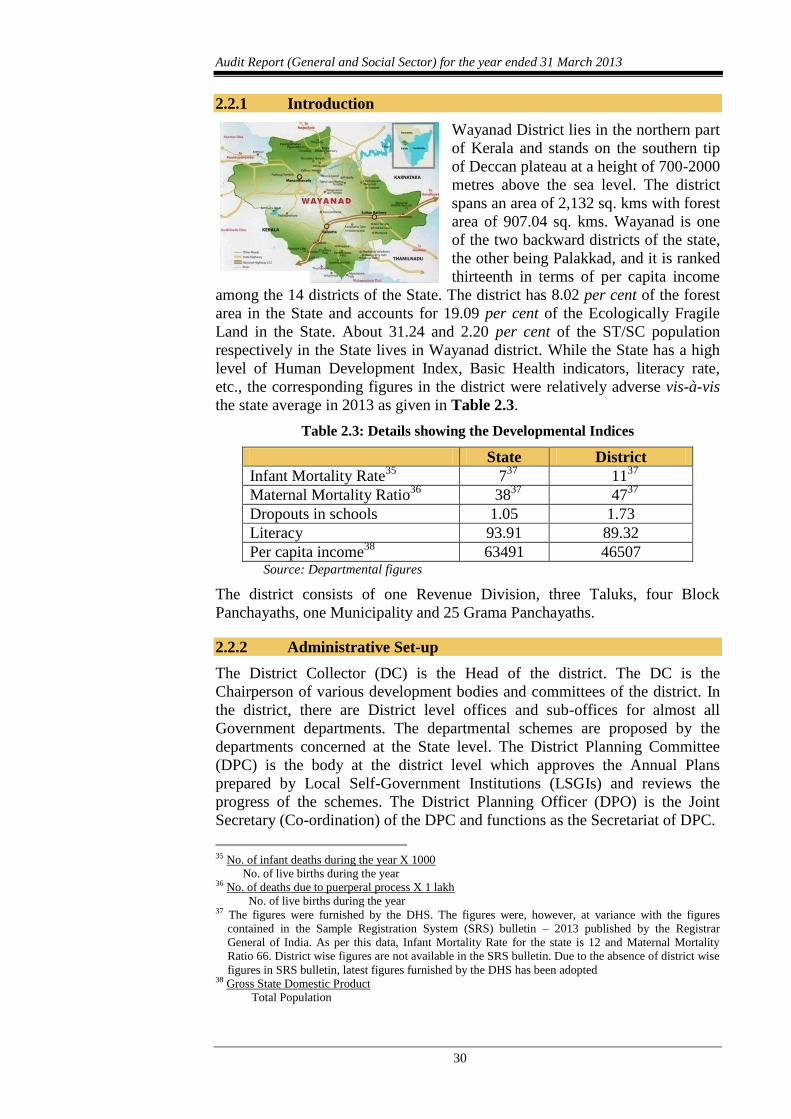
2.2.1 Introduction
Wayanad District lies in the northern part
of Kerala and stands on the southern tip
of Deccan plateau at a height of 700-2000
metres above the sea level. The district
spans an area of 2,132 sq. kms with forest
area of 907.04 sq. kms. Wayanad is one
of the two backward districts of the state,
the other being Palakkad, and it is ranked
thirteenth in terms of per capita income
among the 14 districts of the State. The district has 8.02 per cent of the forest
area in the State and accounts for 19.09 per cent of the Ecologically Fragile
Land in the State. About 31.24 and 2.20 per cent of the ST/SC population
respectively in the State lives in Wayanad district. While the State has a high
level of Human Development Index, Basic Health indicators, literacy rate,
etc., the corresponding figures in the district were relatively adverse vis-à-vis
the state average in 2013 as given in Table 2.3.
Table 2.3: Details showing the Developmental Indices
State District
Infant Mortality Rate35
737
1137
Maternal Mortality Ratio36
3837
4737
Dropouts in schools 1.05 1.73
Literacy 93.91 89.32
Per capita income38
63491 46507 Source: Departmental figures
The district consists of one Revenue Division, three Taluks, four Block
Panchayaths, one Municipality and 25 Grama Panchayaths.
2.2.2 Administrative Set-up
The District Collector (DC) is the Head of the district. The DC is the
Chairperson of various development bodies and committees of the district. In
the district, there are District level offices and sub-offices for almost all
Government departments. The departmental schemes are proposed by the
departments concerned at the State level. The District Planning Committee
(DPC) is the body at the district level which approves the Annual Plans
prepared by Local Self-Government Institutions (LSGIs) and reviews the
progress of the schemes. The District Planning Officer (DPO) is the Joint
Secretary (Co-ordination) of the DPC and functions as the Secretariat of DPC.
35 No. of infant deaths during the year X 1000
No. of live births during the year 36 No. of deaths due to puerperal process X 1 lakh
No. of live births during the year 37 The figures were furnished by the DHS. The figures were, however, at variance with the figures
contained in the Sample Registration System (SRS) bulletin – 2013 published by the Registrar
General of India. As per this data, Infant Mortality Rate for the state is 12 and Maternal Mortality
Ratio 66. District wise figures are not available in the SRS bulletin. Due to the absence of district wise
figures in SRS bulletin, latest figures furnished by the DHS has been adopted 38 Gross State Domestic Product
Total Population
Chapter II – Performance Audit
31
2.2.3 Scope of Audit
Audit undertook appraisal of social and economic sector programmes
implemented in the district during the period 2008-09 to 2012-13 relating to
health, education, water supply, tribal welfare, sanitation, agriculture, forest,
etc. The audit focused on the role and responsibilities of the district
administration in providing essential public services and improving the
general standard of living of the people of the district.
2.2.4 Audit Objectives
The objectives of the audit were to assess whether:
the planning process for different programmes was adequate and
effective;
the financial management was efficient and effective;
the implementation of programmes/schemes was efficient, effective
and economical; and
an efficient monitoring mechanism was in place.
2.2.5 Audit Criteria
The audit criteria for assessing the implementation of various developmental
programmes/schemes were derived from the following:
Norms prescribed for providing human resources, infrastructure,
services, etc., in the standardisation norms/Indian Public Health
Standards for improving the healthcare facilities.
Performance indicators set out by the Government of India (GOI) in
the schemes for evaluating the impact on universal education,
reduction in dropout rate, improvement of basic infrastructure facilities
in schools, etc.
Performance indicators/goals set out in schemes/programs framed by
the Government for the welfare of tribal population.
Sustainability and quality of drinking water as enunciated in National
Rural Drinking Water Programme guidelines.
Measures for conservation of forest land as prescribed in the Kerala
Private Forest (Vesting and Assignment) Act, 1971.
2.2.6 Audit Methodology and coverage
An entry conference was held (9 May 2013) with the DC and the
implementing officers of various schemes. In the meeting, the audit objectives,
the scope of audit and the audit programmes were discussed. The audit
involved examination of documents of offices at the District, Block and
Grama Panchayath level. Photographic evidence and physical verification
were also taken into consideration to substantiate the audit observations.
The audit was conducted during April - July 2013 covering the period
2008-13. Audit scrutinised the records of the office of the DC, District
Planning Office, Deputy Director of Education, District Project Office, Sarva
Audit Report (General and Social Sector) for the year ended 31 March 2013
32
Shiksha Abhiyan (SSA), District Medical Officer, District Health Society,
National Rural Health Mission (NRHM), Principal Agricultural Officer,
Divisional Office of Kerala Water Authority, line departments and
Autonomous Bodies involved in the implementation of schemes. Further,
Audit conducted test check of the records in the District Panchayath,
one Block Panchayath39
(out of four), six Grama Panchayaths40
(out of 25) and
the only Municipality (Kalpetta) in the district. An exit conference was held
(26 September 2013) with the district authorities of the line department
concerned headed by the DC, wherein the audit findings were discussed.
Views of the departments were considered and incorporated in the report at
appropriate places.
Audit findings
2.2.7 Planning
The Guidelines for district plans in the Eleventh Five Year Plan issued
(August 2006) by the Planning Commission envisaged a district planning
process for preparing an integrated plan for the district taking into account the
resources available and covering the sectoral activities and schemes assigned
to the district level and below, and those implemented through LSGIs. The
State Government directed (February 2007) DPOs and LSGIs to prepare Local
Development Plans (LDPs) for all LSGIs in a district and Integrated District
Development Plan (IDDP) for each district under the auspices of DPC.
However, as the preparation of the IDDP for the district and consolidation of
the LDPs for the LSGIs were not done by the DPC, the disparities between
various regions within the district in respect of the developmental issues
remained unidentified.
The DC stated (September 2013) that the district had already launched steps to
prepare IDDP/LDPs and the delay in finalisation was due to paucity of funds
and manpower.
2.2.7.1 Non-utilisation of data in planning process
The minutes of the DPC and District Development Council (DDC) revealed
that statistical data available with various sources like Health Department,
SSA, Kerala Water Authority, etc., were not utilised by the LSGIs while
formulating schemes.
The District Planning Officer (DPO) stated (July 2013) that the data compiled
by various departments on various aspects relating to human development
were not utilized at the lower level while finalizing the plan due to the lack of
co-ordination.
2.2.8 Financial Management
Funds are allocated to the district through the State budget for various
developmental activities. In addition, funds are directly released to the
implementing agencies for implementation of various socio-economic
39 Mananthavady Block Panchayath 40 Kottathara, Meenangadi, Panamaram, Sulthan Batheri, Thirunelli and Vythiri Grama Panchayaths
Chapter II – Performance Audit
33
programmes by the Government of India (GOI). The State Government also
allots funds directly to the LSGIs for implementation of schemes under
decentralised planning programme.
The details of total flow of funds to the district during 2008-13 were not
available either with the DC or with the DPO. They were also not maintaining
a consolidated year-wise statement of total funds received and utilised for
various developmental programmes/schemes implemented in the district.
The DC accepted the audit observation and stated that the details of funds
allotted and received by various departments and expenditure were not
available with the office as the funds were not routed through him.
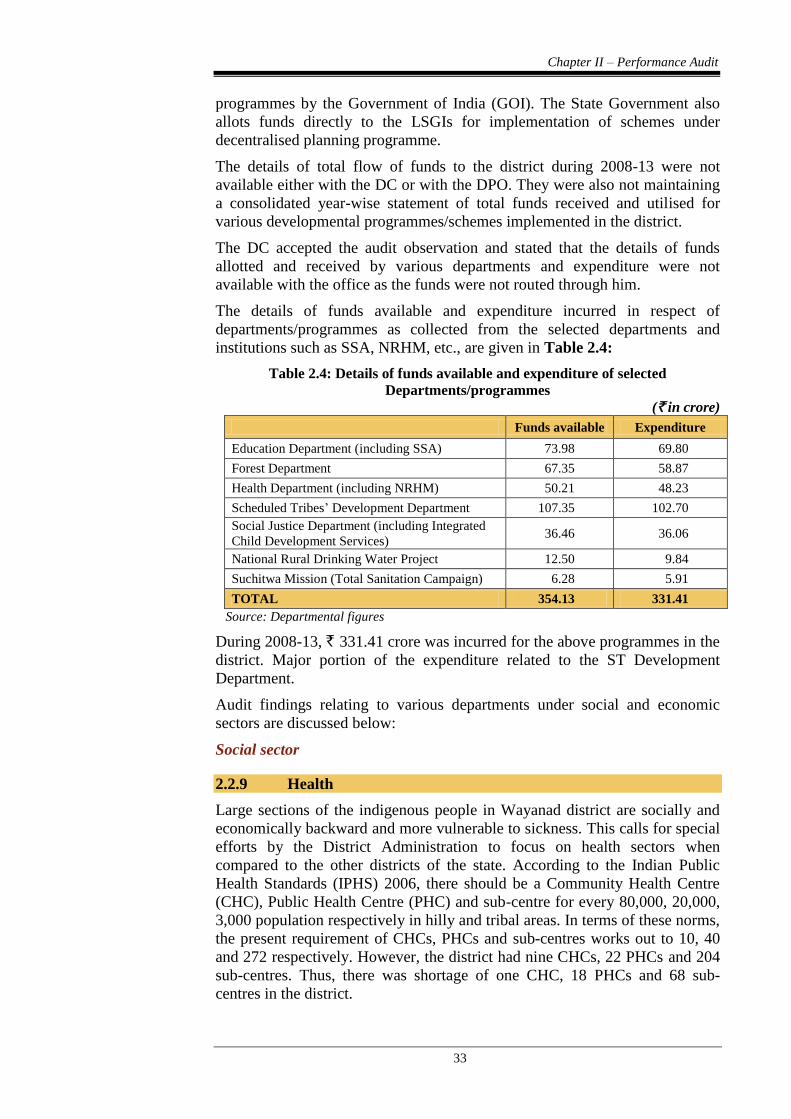
The details of funds available and expenditure incurred in respect of
departments/programmes as collected from the selected departments and
institutions such as SSA, NRHM, etc., are given in Table 2.4:
Table 2.4: Details of funds available and expenditure of selected
Departments/programmes
(` in crore)
Funds available Expenditure
Education Department (including SSA) 73.98 69.80
Forest Department 67.35 58.87
Health Department (including NRHM) 50.21 48.23
Scheduled Tribes’ Development Department 107.35 102.70
Social Justice Department (including Integrated
Child Development Services) 36.46 36.06
National Rural Drinking Water Project 12.50 9.84
Suchitwa Mission (Total Sanitation Campaign) 6.28 5.91
TOTAL 354.13 331.41
Source: Departmental figures
During 2008-13, ` 331.41 crore was incurred for the above programmes in the
district. Major portion of the expenditure related to the ST Development
Department.
Audit findings relating to various departments under social and economic
sectors are discussed below:
Social sector
2.2.9 Health
Large sections of the indigenous people in Wayanad district are socially and
economically backward and more vulnerable to sickness. This calls for special
efforts by the District Administration to focus on health sectors when
compared to the other districts of the state. According to the Indian Public
Health Standards (IPHS) 2006, there should be a Community Health Centre
(CHC), Public Health Centre (PHC) and sub-centre for every 80,000, 20,000,
3,000 population respectively in hilly and tribal areas. In terms of these norms,
the present requirement of CHCs, PHCs and sub-centres works out to 10, 40
and 272 respectively. However, the district had nine CHCs, 22 PHCs and 204
sub-centres. Thus, there was shortage of one CHC, 18 PHCs and 68 sub-
centres in the district.
Audit Report (General and Social Sector) for the year ended 31 March 2013
34
2.2.9.1 Infrastructure facilities/services
During 2008-13, out of expenditure of ` 48.23 crore as shown in Table 2.4
above, ` 12.37 crore was incurred in the district by the Health and Family
Welfare Department and NRHM for augmentation of facilities and
infrastructure development. Many of the health centres test-checked lacked
major infrastructure facilities and services as required under IPHS norms. The
details are shown in Appendix 2.5. Audit observed the following.
Out of eight CHCs, operation theatre in one CHC, blood storage
facility in seven CHCs and ambulance in six CHCs were not available.
Though labour room was available in seven CHCs, delivery service
was available only in one CHC. Essential and emergency obstetrics
care and essential new born care were not available in seven CHCs.
Out of 20 PHCs, labour room was available only in three PHCs, but
delivery service was not available in any of the PHCs. Laboratory
services in 11 PHCs, cold chain room in eight PHCs and separate
public utilities for male/female patients in 11 PHCs were also not
available.
DMO stated (September 2013) that all these issues were taken up with the
Government.
District Hospital, Mananthavady
District Hospital, Mananthavady (DH) is the one and only referral hospital in
Wayanad District. In DH, there is no super speciality facility for cardiology or
cardio-thoracic and vascular surgery considered desirable as per IPHS norms.
However, equipment like ECG Machine, 12 channel stress ECG test
equipment, tread mill, cardiac monitor, etc., provided to the hospital years
back, were not utilised as no cardiologist has been posted to the hospital till
date (September 2013). In para-clinical services, there was no physiotherapy
unit. The microbiology unit was not functioning. Six out of eight major
investigations in endoscopy could not be provided.
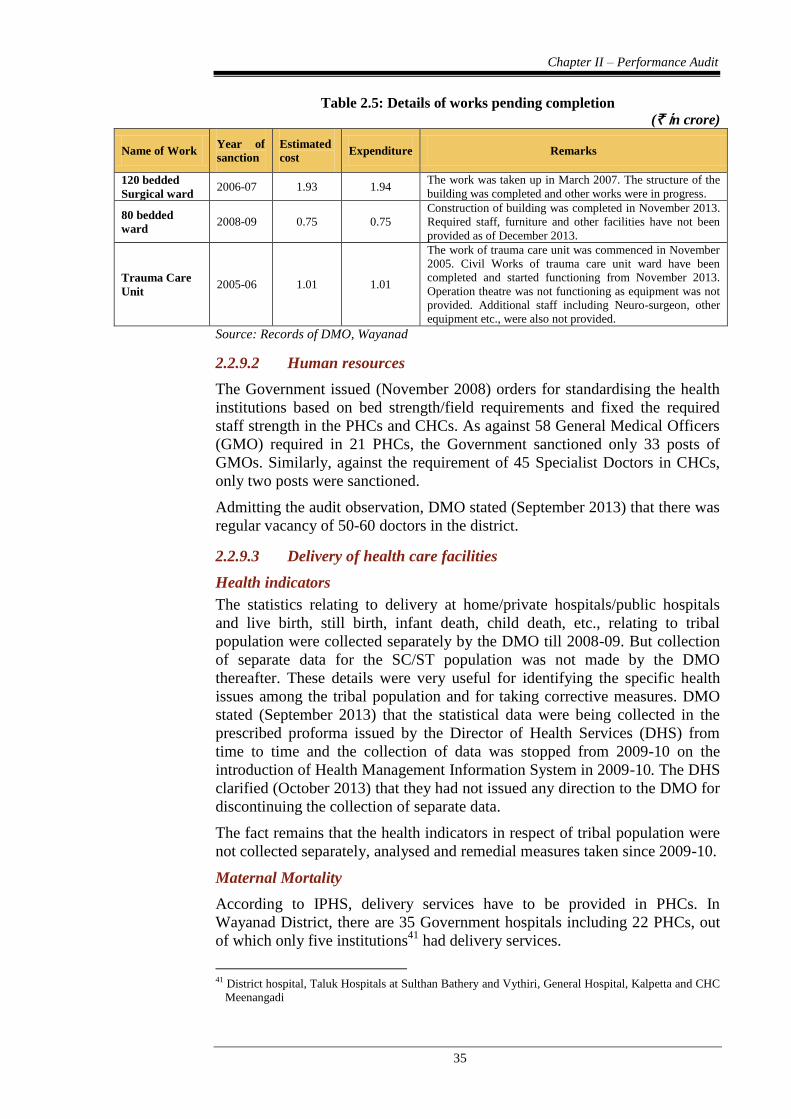
Government accorded sanction (November 2005) to enhance the bed strength
of DH from 274 to 500 as the effective inpatient strength was more than 400
per day. Some of the works sanctioned by Government for augmenting the
facilities were not taken up by the department in a time bound manner
resulting in delay in construction of buildings and providing the required staff,
equipment and other facilities as shown in Table 2.5.
Chapter II – Performance Audit
35
Table 2.5: Details of works pending completion
(` in crore)
Name of Work Year of
sanction
Estimated
cost Expenditure Remarks
120 bedded
Surgical ward 2006-07 1.93 1.94
The work was taken up in March 2007. The structure of the
building was completed and other works were in progress.
80 bedded
ward 2008-09 0.75 0.75
Construction of building was completed in November 2013.
Required staff, furniture and other facilities have not been
provided as of December 2013.
Trauma Care
Unit 2005-06 1.01 1.01
The work of trauma care unit was commenced in November
2005. Civil Works of trauma care unit ward have been
completed and started functioning from November 2013.
Operation theatre was not functioning as equipment was not
provided. Additional staff including Neuro-surgeon, other
equipment etc., were also not provided.
Source: Records of DMO, Wayanad
2.2.9.2 Human resources
The Government issued (November 2008) orders for standardising the health
institutions based on bed strength/field requirements and fixed the required
staff strength in the PHCs and CHCs. As against 58 General Medical Officers
(GMO) required in 21 PHCs, the Government sanctioned only 33 posts of
GMOs. Similarly, against the requirement of 45 Specialist Doctors in CHCs,
only two posts were sanctioned.
Admitting the audit observation, DMO stated (September 2013) that there was
regular vacancy of 50-60 doctors in the district.
2.2.9.3 Delivery of health care facilities
Health indicators
The statistics relating to delivery at home/private hospitals/public hospitals
and live birth, still birth, infant death, child death, etc., relating to tribal
population were collected separately by the DMO till 2008-09. But collection
of separate data for the SC/ST population was not made by the DMO
thereafter. These details were very useful for identifying the specific health
issues among the tribal population and for taking corrective measures. DMO
stated (September 2013) that the statistical data were being collected in the
prescribed proforma issued by the Director of Health Services (DHS) from
time to time and the collection of data was stopped from 2009-10 on the
introduction of Health Management Information System in 2009-10. The DHS
clarified (October 2013) that they had not issued any direction to the DMO for
discontinuing the collection of separate data.
The fact remains that the health indicators in respect of tribal population were
not collected separately, analysed and remedial measures taken since 2009-10.
Maternal Mortality
According to IPHS, delivery services have to be provided in PHCs. In
Wayanad District, there are 35 Government hospitals including 22 PHCs, out
of which only five institutions41
had delivery services.
41 District hospital, Taluk Hospitals at Sulthan Bathery and Vythiri, General Hospital, Kalpetta and CHC
Meenangadi
Audit Report (General and Social Sector) for the year ended 31 March 2013
36
In Wayanad, during 2008-13, out of 72,795 deliveries, 33,229 were in
Government hospitals, 37,567 in Private hospitals and 1,999 were domicile
deliveries without skilled birth attendants. The lack of delivery services in the
Government institutions explain the large (51.60 per cent) number of
deliveries in private hospitals. The number of domicile deliveries seen in the
context of the total number of such deliveries in the entire State brings to sharp
focus the seriousness of this issue. Out of 3,180 cases of domicile deliveries
reported in the State during 2010-2013, 988 cases (31.6 per cent) were in
Wayanad.
Most of the cases of maternal deaths were of those who belonged to the tribal
population. During 2008-09 to 2012-13, there were 51 deaths, out of which 32
were tribal women in the age group 19-35. In view of the poor health
condition of the tribal women, more focused attention for providing nutritional
support and medical attention during pregnancy is required. DMO stated
(September 2013) that a nutritional supplementation programme targeting
pregnant women and adolescent girls of tribal community was introduced
recently in four Panchayaths.
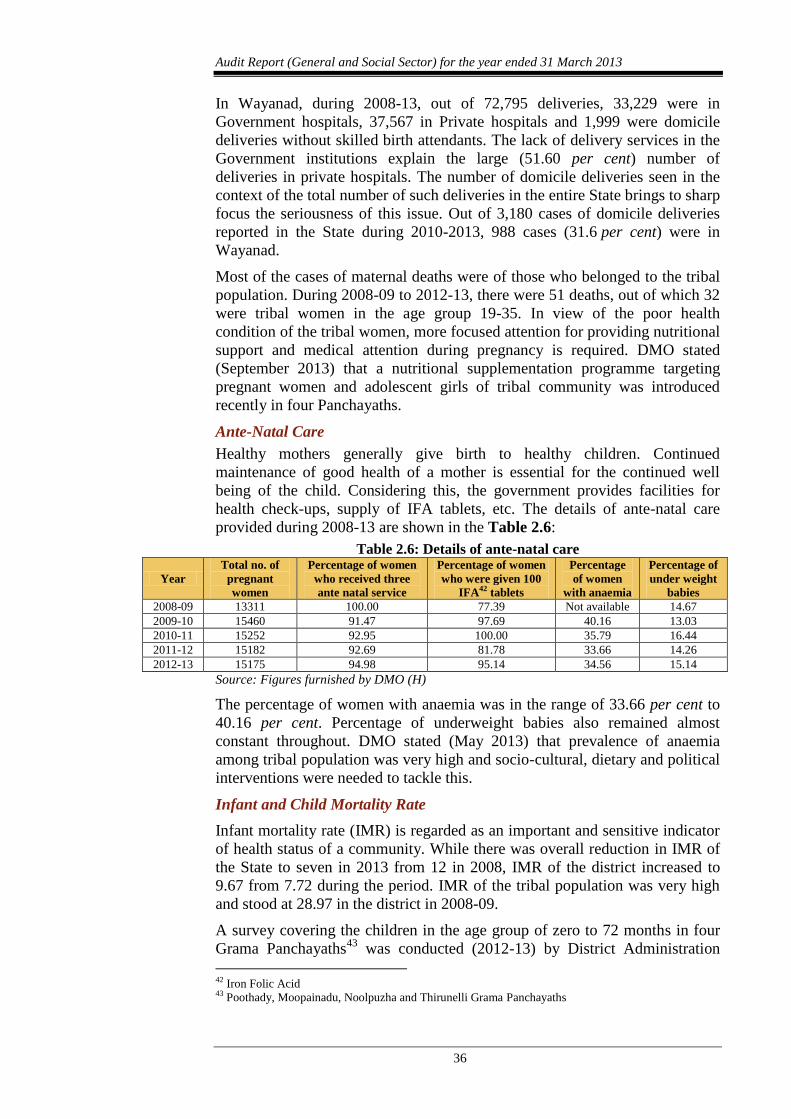
Ante-Natal Care
Healthy mothers generally give birth to healthy children. Continued
maintenance of good health of a mother is essential for the continued well
being of the child. Considering this, the government provides facilities for
health check-ups, supply of IFA tablets, etc. The details of ante-natal care
provided during 2008-13 are shown in the Table 2.6:
Table 2.6: Details of ante-natal care
Year
Total no. of
pregnant
women
Percentage of women
who received three
ante natal service
Percentage of women
who were given 100
IFA42 tablets
Percentage
of women
with anaemia
Percentage of
under weight
babies
2008-09 13311 100.00 77.39 Not available 14.67
2009-10 15460 91.47 97.69 40.16 13.03
2010-11 15252 92.95 100.00 35.79 16.44
2011-12 15182 92.69 81.78 33.66 14.26
2012-13 15175 94.98 95.14 34.56 15.14
Source: Figures furnished by DMO (H)
The percentage of women with anaemia was in the range of 33.66 per cent to
40.16 per cent. Percentage of underweight babies also remained almost
constant throughout. DMO stated (May 2013) that prevalence of anaemia
among tribal population was very high and socio-cultural, dietary and political
interventions were needed to tackle this.
Infant and Child Mortality Rate
Infant mortality rate (IMR) is regarded as an important and sensitive indicator
of health status of a community. While there was overall reduction in IMR of
the State to seven in 2013 from 12 in 2008, IMR of the district increased to
9.67 from 7.72 during the period. IMR of the tribal population was very high
and stood at 28.97 in the district in 2008-09.
A survey covering the children in the age group of zero to 72 months in four
Grama Panchayaths43
was conducted (2012-13) by District Administration
42 Iron Folic Acid 43 Poothady, Moopainadu, Noolpuzha and Thirunelli Grama Panchayaths
Chapter II – Performance Audit
37
(under UNICEF assistance). Data collected and analysed by survey on 1,855
births in four selected Grama Panchayaths revealed that the infant mortality
rate was as high as 41.47 among tribal population. In these circumstances,
maintenance of separate database for the tribal population is necessary for the
appropriate and timely intervention by the Health department.
In the survey, it was noticed that about 34.1 per cent of children in the age
group of one to two years did not receive all the primary doses of
immunisation by the end of first year of life. It was also found that there was
no significant difference in the immunisation status between tribal and non-
tribal children. This would indicate the failure of the health system to reach
out rather than lack of awareness being the reason for the low rate of
immunisation. DMO replied (September 2013) that high percentage of
children not receiving all the primary doses of immunisation was due to the
frequent occurrence of illness among the children.
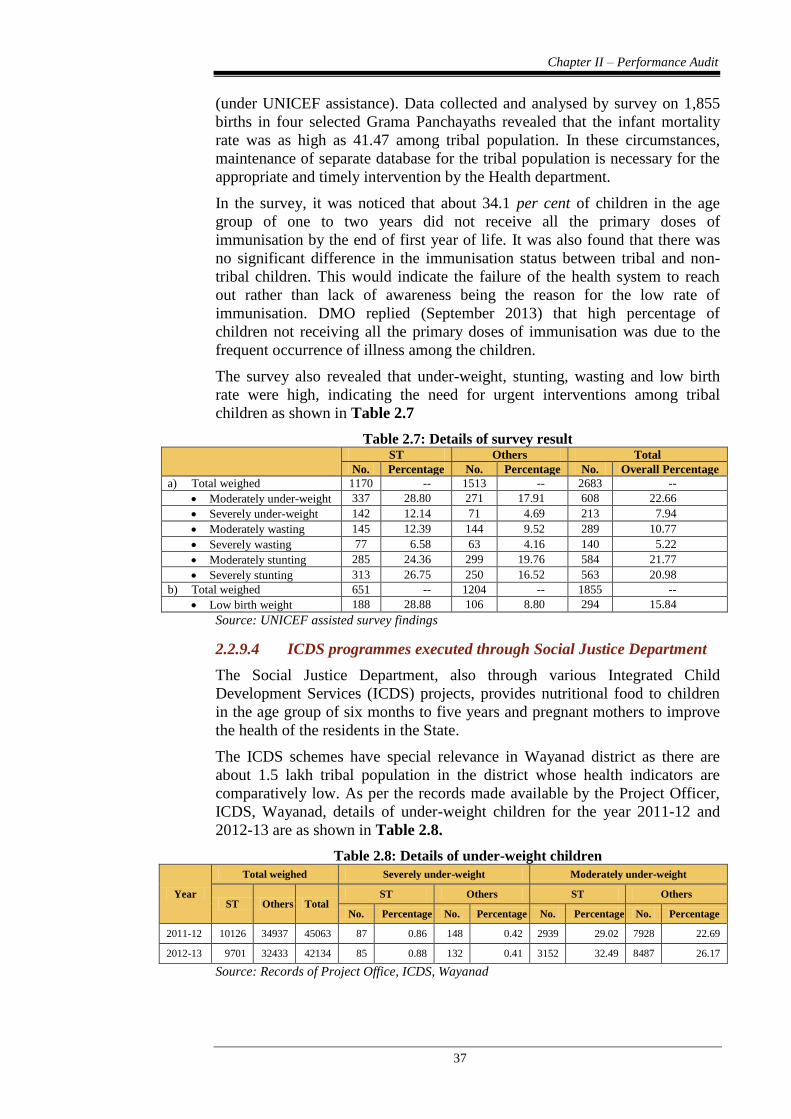
The survey also revealed that under-weight, stunting, wasting and low birth
rate were high, indicating the need for urgent interventions among tribal
children as shown in Table 2.7
Table 2.7: Details of survey result
ST Others Total
No. Percentage No. Percentage No. Overall Percentage
a) Total weighed 1170 -- 1513 -- 2683 --
Moderately under-weight 337 28.80 271 17.91 608 22.66
Severely under-weight 142 12.14 71 4.69 213 7.94
Moderately wasting 145 12.39 144 9.52 289 10.77
Severely wasting 77 6.58 63 4.16 140 5.22
Moderately stunting 285 24.36 299 19.76 584 21.77
Severely stunting 313 26.75 250 16.52 563 20.98
b) Total weighed 651 -- 1204 -- 1855 --
Low birth weight 188 28.88 106 8.80 294 15.84
Source: UNICEF assisted survey findings
2.2.9.4 ICDS programmes executed through Social Justice Department
The Social Justice Department, also through various Integrated Child
Development Services (ICDS) projects, provides nutritional food to children
in the age group of six months to five years and pregnant mothers to improve
the health of the residents in the State.
The ICDS schemes have special relevance in Wayanad district as there are
about 1.5 lakh tribal population in the district whose health indicators are
comparatively low. As per the records made available by the Project Officer,
ICDS, Wayanad, details of under-weight children for the year 2011-12 and
2012-13 are as shown in Table 2.8.
Table 2.8: Details of under-weight children
Year
Total weighed Severely under-weight Moderately under-weight
ST Others Total ST Others ST Others
No. Percentage No. Percentage No. Percentage No. Percentage
2011-12 10126 34937 45063 87 0.86 148 0.42 2939 29.02 7928 22.69
2012-13 9701 32433 42134 85 0.88 132 0.41 3152 32.49 8487 26.17
Source: Records of Project Office, ICDS, Wayanad
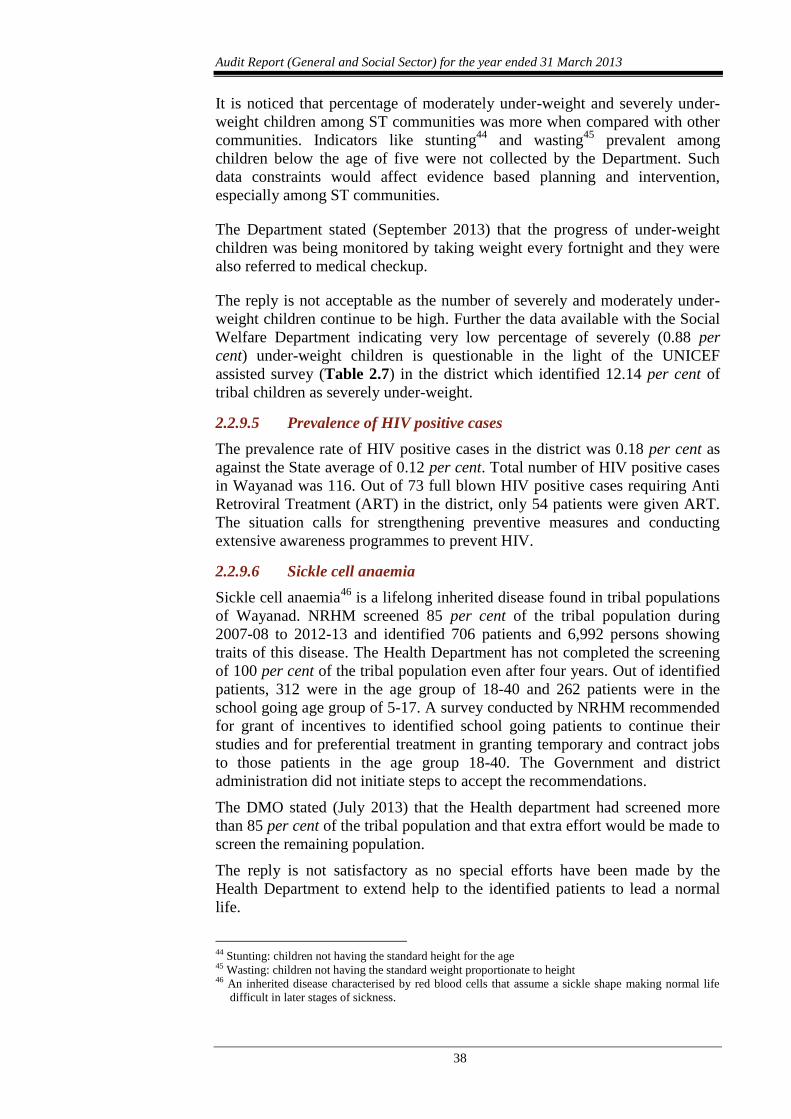
Audit Report (General and Social Sector) for the year ended 31 March 2013
38
It is noticed that percentage of moderately under-weight and severely under-
weight children among ST communities was more when compared with other
communities. Indicators like stunting44
and wasting45
prevalent among
children below the age of five were not collected by the Department. Such
data constraints would affect evidence based planning and intervention,
especially among ST communities.
The Department stated (September 2013) that the progress of under-weight
children was being monitored by taking weight every fortnight and they were
also referred to medical checkup.
The reply is not acceptable as the number of severely and moderately under-
weight children continue to be high. Further the data available with the Social
Welfare Department indicating very low percentage of severely (0.88 per
cent) under-weight children is questionable in the light of the UNICEF
assisted survey (Table 2.7) in the district which identified 12.14 per cent of
tribal children as severely under-weight.
2.2.9.5 Prevalence of HIV positive cases
The prevalence rate of HIV positive cases in the district was 0.18 per cent as
against the State average of 0.12 per cent. Total number of HIV positive cases
in Wayanad was 116. Out of 73 full blown HIV positive cases requiring Anti
Retroviral Treatment (ART) in the district, only 54 patients were given ART.
The situation calls for strengthening preventive measures and conducting
extensive awareness programmes to prevent HIV.
2.2.9.6 Sickle cell anaemia
Sickle cell anaemia46
is a lifelong inherited disease found in tribal populations
of Wayanad. NRHM screened 85 per cent of the tribal population during
2007-08 to 2012-13 and identified 706 patients and 6,992 persons showing
traits of this disease. The Health Department has not completed the screening
of 100 per cent of the tribal population even after four years. Out of identified
patients, 312 were in the age group of 18-40 and 262 patients were in the
school going age group of 5-17. A survey conducted by NRHM recommended
for grant of incentives to identified school going patients to continue their
studies and for preferential treatment in granting temporary and contract jobs
to those patients in the age group 18-40. The Government and district
administration did not initiate steps to accept the recommendations.
The DMO stated (July 2013) that the Health department had screened more
than 85 per cent of the tribal population and that extra effort would be made to
screen the remaining population.
The reply is not satisfactory as no special efforts have been made by the
Health Department to extend help to the identified patients to lead a normal
life.
44 Stunting: children not having the standard height for the age 45 Wasting: children not having the standard weight proportionate to height 46 An inherited disease characterised by red blood cells that assume a sickle shape making normal life
difficult in later stages of sickness.
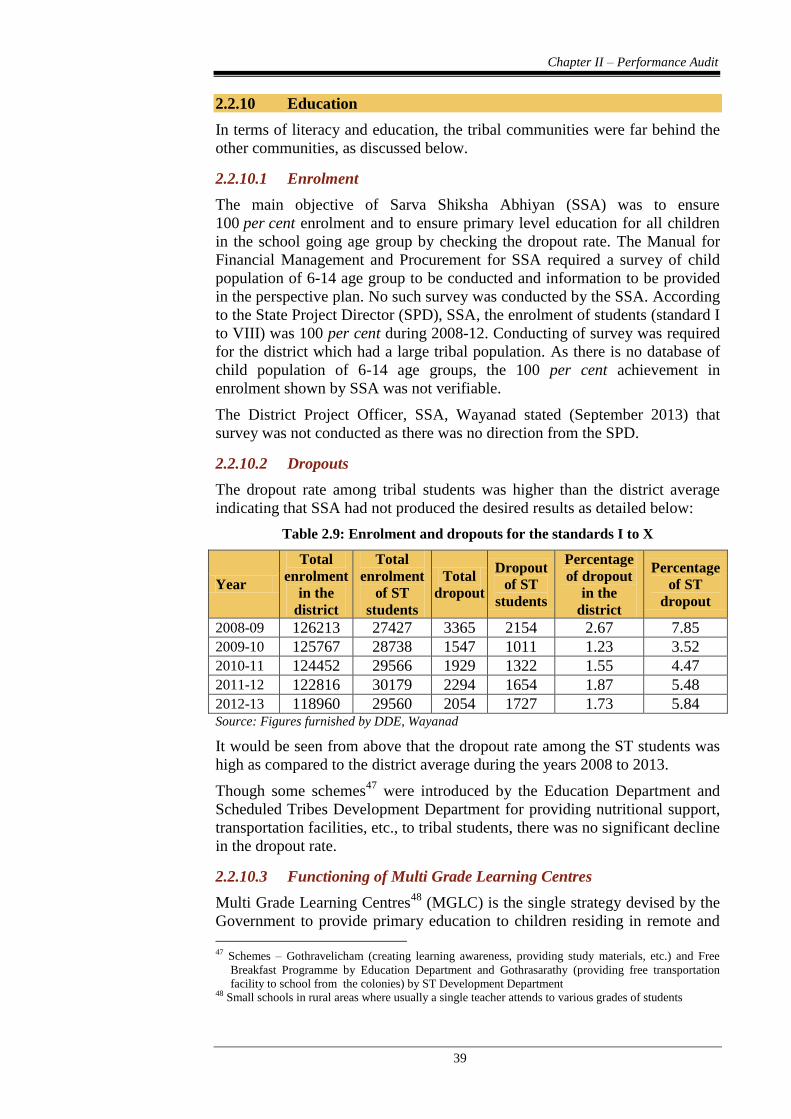
Chapter II – Performance Audit
39
2.2.10 Education
In terms of literacy and education, the tribal communities were far behind the
other communities, as discussed below.
2.2.10.1 Enrolment
The main objective of Sarva Shiksha Abhiyan (SSA) was to ensure
100 per cent enrolment and to ensure primary level education for all children
in the school going age group by checking the dropout rate. The Manual for
Financial Management and Procurement for SSA required a survey of child
population of 6-14 age group to be conducted and information to be provided
in the perspective plan. No such survey was conducted by the SSA. According
to the State Project Director (SPD), SSA, the enrolment of students (standard I
to VIII) was 100 per cent during 2008-12. Conducting of survey was required
for the district which had a large tribal population. As there is no database of
child population of 6-14 age groups, the 100 per cent achievement in
enrolment shown by SSA was not verifiable.
The District Project Officer, SSA, Wayanad stated (September 2013) that
survey was not conducted as there was no direction from the SPD.
2.2.10.2 Dropouts
The dropout rate among tribal students was higher than the district average
indicating that SSA had not produced the desired results as detailed below:
Table 2.9: Enrolment and dropouts for the standards I to X
Year
Total
enrolment
in the
district
Total
enrolment
of ST
students
Total
dropout
Dropout
of ST
students
Percentage
of dropout
in the
district
Percentage
of ST
dropout
2008-09 126213 27427 3365 2154 2.67 7.85
2009-10 125767 28738 1547 1011 1.23 3.52
2010-11 124452 29566 1929 1322 1.55 4.47
2011-12 122816 30179 2294 1654 1.87 5.48
2012-13 118960 29560 2054 1727 1.73 5.84 Source: Figures furnished by DDE, Wayanad
It would be seen from above that the dropout rate among the ST students was
high as compared to the district average during the years 2008 to 2013.
Though some schemes47
were introduced by the Education Department and
Scheduled Tribes Development Department for providing nutritional support,
transportation facilities, etc., to tribal students, there was no significant decline
in the dropout rate.
2.2.10.3 Functioning of Multi Grade Learning Centres
Multi Grade Learning Centres48
(MGLC) is the single strategy devised by the
Government to provide primary education to children residing in remote and
47 Schemes – Gothravelicham (creating learning awareness, providing study materials, etc.) and Free
Breakfast Programme by Education Department and Gothrasarathy (providing free transportation
facility to school from the colonies) by ST Development Department 48 Small schools in rural areas where usually a single teacher attends to various grades of students
Audit Report (General and Social Sector) for the year ended 31 March 2013
40
reserve forest areas. In 2012-13, there were 42 MGLCs with student strength
of 867. A test check revealed that out of 76 students enrolled in standard one
in 10 centres in 2009-10, 44 did not continue their study beyond third standard
during 2012-13. Apparently, the objective of imparting primary education to
all marginalised children was not achieved.
The approved Annual Working Plan & Budget (AWP&B) of SSA for the year
2010-11 to 2012-13 contained a provision of ` 78.64 lakh49
for upgradation of
10 MGLCs to new primary schools. The Project was not included in the
AWP&B for the year 2013-14, and hence the possibility of project
materialising is remote.
The District Project Officer stated (May 2013) that the funds could not be
utilised as LSGIs failed to provide the required land.
2.2.10.4 Rashtriya Madhyamik Shiksha Abhiyan
The objective of Rashtriya Madhyamik Shiksha Abhiyan (RMSA),
implemented in the State from September 2009, is to provide good quality
education accessible and affordable to all young persons in the age group of
14-18 years. The Deputy Directors of Education (DDE) of each district were
designated as the District Programme Officers.
Under the RMSA, 12 Lower Primary/Upper Primary schools in Wayanad
district were selected (November 2010) for upgradation as High Schools.
RMSA released (April 2011) ` 2.40 crore as first instalment (` 20.00 lakh for
each school) to the DDE Wayanad out of the total outlay of
` 6.97 crore (` 58.12 lakh x 12 schools).
Audit noticed that there was inordinate delay in implementing the scheme. The
sanction for upgradation of schools was made in November 2010 and the first
instalment was received in April 2011, but the DDE Wayanad issued the
administrative sanction only in December 2012. There was no progress
towards upgradation of schools till date (December 2013). The delay resulted
in denial of infrastructure facilities to the students and escalation in
construction cost. Also, there was parking of ` 2.40 crore in the bank account
of the DDE for more than two years.
2.2.10.5 Schools without sufficient infrastructure facilities
During the period 2008-09 to 2012-13, SSA incurred ` 7.23 crore for
infrastructure development such as construction of girls’ toilets, providing
drinking water facilities, compound wall, major repairs, etc. The DDE,
Wayanad, had also incurred Rupee one crore for providing urinals, library and
furniture, etc., in schools. However, scrutiny of the District Information
System for Education (DISE) data maintained by SSA, revealed that basic
infrastructure like urinals, electricity, furniture, etc., were insufficient in many
schools as given in Appendix 2.6.
The District Project Officer, SSA stated (September 2013) that works were
taken up on a priority basis depending on the availability of funds from GOI.
49 Construction of building: ` 58 lakh and disbursement of salary to the teachers: ` 20.64 lakh
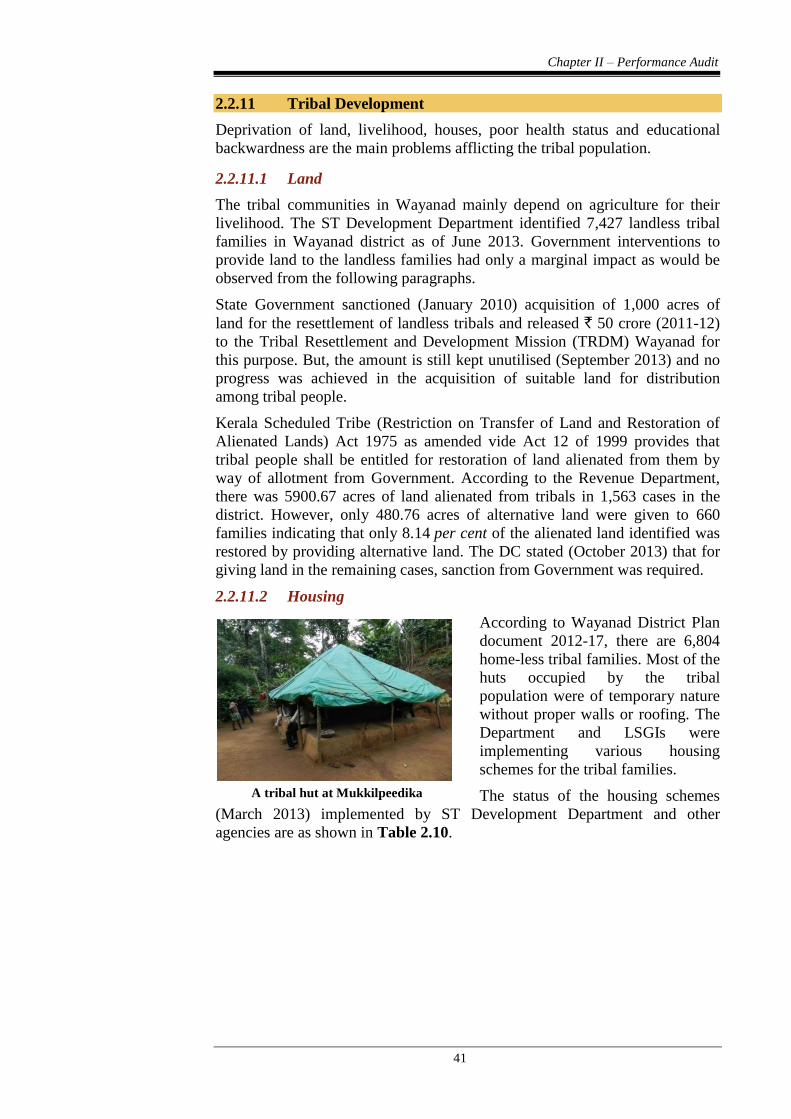
Chapter II – Performance Audit
41
2.2.11 Tribal Development
Deprivation of land, livelihood, houses, poor health status and educational
backwardness are the main problems afflicting the tribal population.
2.2.11.1 Land
The tribal communities in Wayanad mainly depend on agriculture for their
livelihood. The ST Development Department identified 7,427 landless tribal
families in Wayanad district as of June 2013. Government interventions to
provide land to the landless families had only a marginal impact as would be
observed from the following paragraphs.
State Government sanctioned (January 2010) acquisition of 1,000 acres of
land for the resettlement of landless tribals and released ` 50 crore (2011-12)
to the Tribal Resettlement and Development Mission (TRDM) Wayanad for
this purpose. But, the amount is still kept unutilised (September 2013) and no
progress was achieved in the acquisition of suitable land for distribution
among tribal people.
Kerala Scheduled Tribe (Restriction on Transfer of Land and Restoration of
Alienated Lands) Act 1975 as amended vide Act 12 of 1999 provides that
tribal people shall be entitled for restoration of land alienated from them by
way of allotment from Government. According to the Revenue Department,
there was 5900.67 acres of land alienated from tribals in 1,563 cases in the
district. However, only 480.76 acres of alternative land were given to 660
families indicating that only 8.14 per cent of the alienated land identified was
restored by providing alternative land. The DC stated (October 2013) that for
giving land in the remaining cases, sanction from Government was required.
2.2.11.2 Housing
According to Wayanad District Plan
document 2012-17, there are 6,804
home-less tribal families. Most of the
huts occupied by the tribal
population were of temporary nature
without proper walls or roofing. The
Department and LSGIs were
implementing various housing
schemes for the tribal families.
The status of the housing schemes
(March 2013) implemented by ST Development Department and other
agencies are as shown in Table 2.10.
A tribal hut at Mukkilpeedika
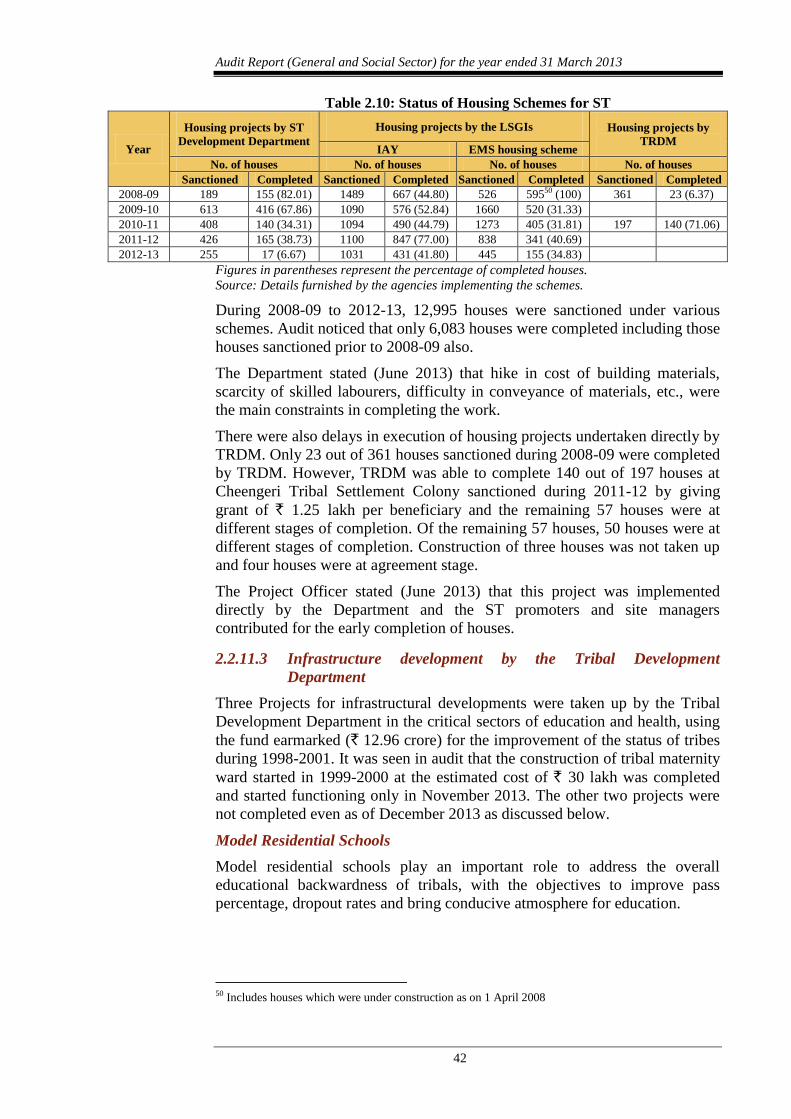
Audit Report (General and Social Sector) for the year ended 31 March 2013
42
Table 2.10: Status of Housing Schemes for ST
Year
Housing projects by ST
Development Department
Housing projects by the LSGIs Housing projects by
TRDM IAY EMS housing scheme
No. of houses No. of houses No. of houses No. of houses
Sanctioned Completed Sanctioned Completed Sanctioned Completed Sanctioned Completed
2008-09 189 155 (82.01) 1489 667 (44.80) 526 59550 (100) 361 23 (6.37)
2009-10 613 416 (67.86) 1090 576 (52.84) 1660 520 (31.33)
2010-11 408 140 (34.31) 1094 490 (44.79) 1273 405 (31.81) 197 140 (71.06)
2011-12 426 165 (38.73) 1100 847 (77.00) 838 341 (40.69)
2012-13 255 17 (6.67) 1031 431 (41.80) 445 155 (34.83)
Figures in parentheses represent the percentage of completed houses.
Source: Details furnished by the agencies implementing the schemes.
During 2008-09 to 2012-13, 12,995 houses were sanctioned under various
schemes. Audit noticed that only 6,083 houses were completed including those
houses sanctioned prior to 2008-09 also.
The Department stated (June 2013) that hike in cost of building materials,
scarcity of skilled labourers, difficulty in conveyance of materials, etc., were
the main constraints in completing the work.
There were also delays in execution of housing projects undertaken directly by
TRDM. Only 23 out of 361 houses sanctioned during 2008-09 were completed
by TRDM. However, TRDM was able to complete 140 out of 197 houses at
Cheengeri Tribal Settlement Colony sanctioned during 2011-12 by giving
grant of ` 1.25 lakh per beneficiary and the remaining 57 houses were at
different stages of completion. Of the remaining 57 houses, 50 houses were at
different stages of completion. Construction of three houses was not taken up
and four houses were at agreement stage.
The Project Officer stated (June 2013) that this project was implemented
directly by the Department and the ST promoters and site managers
contributed for the early completion of houses.
2.2.11.3 Infrastructure development by the Tribal Development
Department
Three Projects for infrastructural developments were taken up by the Tribal
Development Department in the critical sectors of education and health, using
the fund earmarked (` 12.96 crore) for the improvement of the status of tribes
during 1998-2001. It was seen in audit that the construction of tribal maternity
ward started in 1999-2000 at the estimated cost of ` 30 lakh was completed
and started functioning only in November 2013. The other two projects were
not completed even as of December 2013 as discussed below.
Model Residential Schools
Model residential schools play an important role to address the overall
educational backwardness of tribals, with the objectives to improve pass
percentage, dropout rates and bring conducive atmosphere for education.
50 Includes houses which were under construction as on 1 April 2008
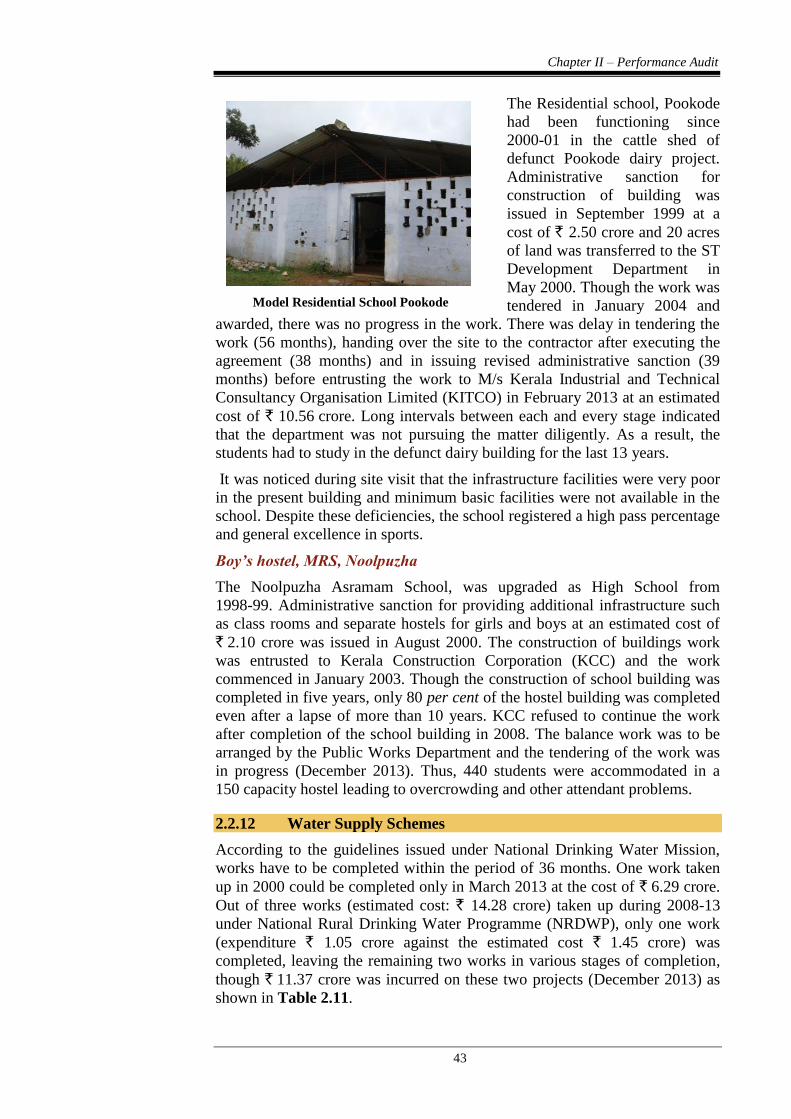
Chapter II – Performance Audit
43
The Residential school, Pookode
had been functioning since
2000-01 in the cattle shed of
defunct Pookode dairy project.
Administrative sanction for
construction of building was
issued in September 1999 at a
cost of ` 2.50 crore and 20 acres
of land was transferred to the ST
Development Department in
May 2000. Though the work was
tendered in January 2004 and
awarded, there was no progress in the work. There was delay in tendering the
work (56 months), handing over the site to the contractor after executing the
agreement (38 months) and in issuing revised administrative sanction (39
months) before entrusting the work to M/s Kerala Industrial and Technical
Consultancy Organisation Limited (KITCO) in February 2013 at an estimated
cost of ` 10.56 crore. Long intervals between each and every stage indicated
that the department was not pursuing the matter diligently. As a result, the
students had to study in the defunct dairy building for the last 13 years.
It was noticed during site visit that the infrastructure facilities were very poor
in the present building and minimum basic facilities were not available in the
school. Despite these deficiencies, the school registered a high pass percentage
and general excellence in sports.
Boy’s hostel, MRS, Noolpuzha
The Noolpuzha Asramam School, was upgraded as High School from
1998-99. Administrative sanction for providing additional infrastructure such
as class rooms and separate hostels for girls and boys at an estimated cost of
` 2.10 crore was issued in August 2000. The construction of buildings work
was entrusted to Kerala Construction Corporation (KCC) and the work
commenced in January 2003. Though the construction of school building was
completed in five years, only 80 per cent of the hostel building was completed
even after a lapse of more than 10 years. KCC refused to continue the work
after completion of the school building in 2008. The balance work was to be
arranged by the Public Works Department and the tendering of the work was
in progress (December 2013). Thus, 440 students were accommodated in a
150 capacity hostel leading to overcrowding and other attendant problems.
2.2.12 Water Supply Schemes
According to the guidelines issued under National Drinking Water Mission,
works have to be completed within the period of 36 months. One work taken
up in 2000 could be completed only in March 2013 at the cost of ` 6.29 crore.
Out of three works (estimated cost: ` 14.28 crore) taken up during 2008-13
under National Rural Drinking Water Programme (NRDWP), only one work
(expenditure ` 1.05 crore against the estimated cost ` 1.45 crore) was
completed, leaving the remaining two works in various stages of completion,
though ` 11.37 crore was incurred on these two projects (December 2013) as
shown in Table 2.11.
Model Residential School Pookode
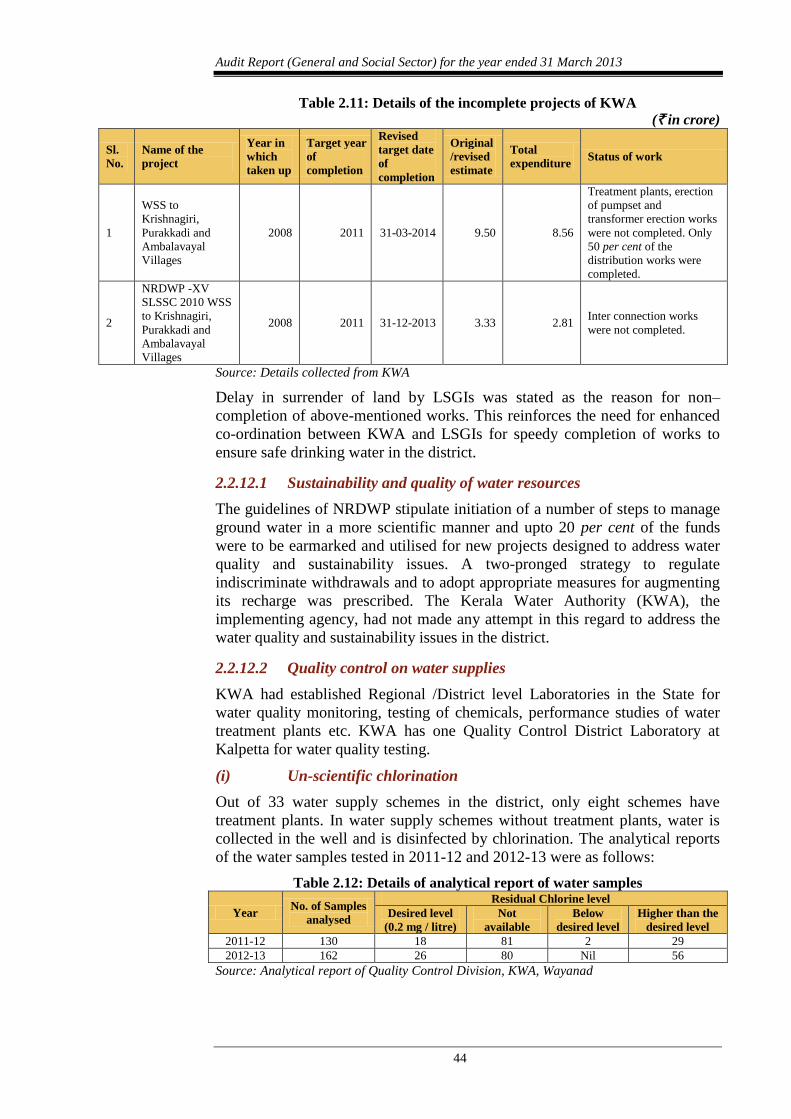
Audit Report (General and Social Sector) for the year ended 31 March 2013
44
Table 2.11: Details of the incomplete projects of KWA
(` in crore)
Sl.
No.
Name of the
project
Year in
which
taken up
Target year
of
completion
Revised
target date
of
completion
Original
/revised
estimate
Total
expenditure Status of work
1
WSS to
Krishnagiri,
Purakkadi and
Ambalavayal
Villages
2008 2011 31-03-2014 9.50 8.56
Treatment plants, erection
of pumpset and
transformer erection works
were not completed. Only
50 per cent of the
distribution works were
completed.
2
NRDWP -XV
SLSSC 2010 WSS
to Krishnagiri,
Purakkadi and
Ambalavayal
Villages
2008 2011 31-12-2013 3.33 2.81 Inter connection works
were not completed.
Source: Details collected from KWA
Delay in surrender of land by LSGIs was stated as the reason for non–
completion of above-mentioned works. This reinforces the need for enhanced
co-ordination between KWA and LSGIs for speedy completion of works to
ensure safe drinking water in the district.
2.2.12.1 Sustainability and quality of water resources
The guidelines of NRDWP stipulate initiation of a number of steps to manage
ground water in a more scientific manner and upto 20 per cent of the funds
were to be earmarked and utilised for new projects designed to address water
quality and sustainability issues. A two-pronged strategy to regulate
indiscriminate withdrawals and to adopt appropriate measures for augmenting
its recharge was prescribed. The Kerala Water Authority (KWA), the
implementing agency, had not made any attempt in this regard to address the
water quality and sustainability issues in the district.
2.2.12.2 Quality control on water supplies
KWA had established Regional /District level Laboratories in the State for
water quality monitoring, testing of chemicals, performance studies of water
treatment plants etc. KWA has one Quality Control District Laboratory at
Kalpetta for water quality testing.
(i) Un-scientific chlorination
Out of 33 water supply schemes in the district, only eight schemes have
treatment plants. In water supply schemes without treatment plants, water is
collected in the well and is disinfected by chlorination. The analytical reports
of the water samples tested in 2011-12 and 2012-13 were as follows:
Table 2.12: Details of analytical report of water samples
Year No. of Samples
analysed
Residual Chlorine level
Desired level
(0.2 mg / litre)
Not
available
Below
desired level
Higher than the
desired level
2011-12 130 18 81 2 29
2012-13 162 26 80 Nil 56
Source: Analytical report of Quality Control Division, KWA, Wayanad
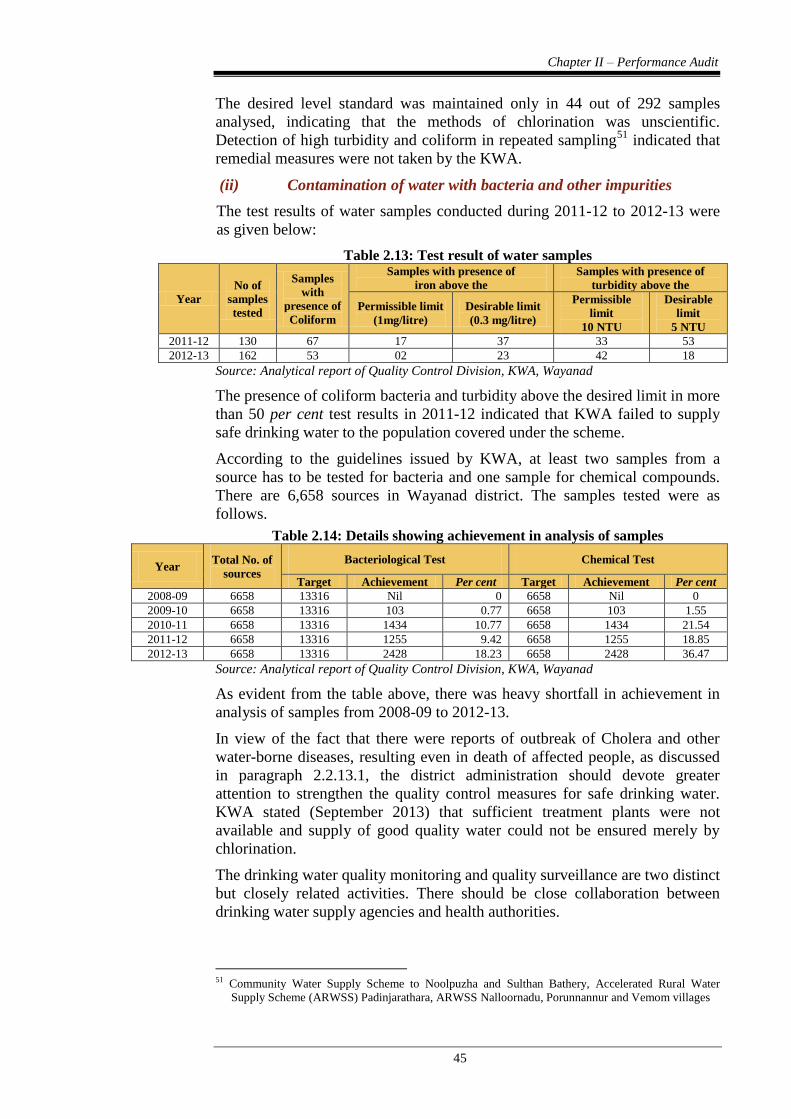
Chapter II – Performance Audit
45
The desired level standard was maintained only in 44 out of 292 samples
analysed, indicating that the methods of chlorination was unscientific.
Detection of high turbidity and coliform in repeated sampling51
indicated that
remedial measures were not taken by the KWA.
(ii) Contamination of water with bacteria and other impurities
The test results of water samples conducted during 2011-12 to 2012-13 were
as given below:
Table 2.13: Test result of water samples
Year
No of
samples
tested
Samples
with
presence of
Coliform
Samples with presence of
iron above the
Samples with presence of
turbidity above the
Permissible limit
(1mg/litre)
Desirable limit
(0.3 mg/litre)
Permissible
limit
10 NTU
Desirable
limit
5 NTU
2011-12 130 67 17 37 33 53
2012-13 162 53 02 23 42 18
Source: Analytical report of Quality Control Division, KWA, Wayanad
The presence of coliform bacteria and turbidity above the desired limit in more
than 50 per cent test results in 2011-12 indicated that KWA failed to supply
safe drinking water to the population covered under the scheme.
According to the guidelines issued by KWA, at least two samples from a
source has to be tested for bacteria and one sample for chemical compounds.
There are 6,658 sources in Wayanad district. The samples tested were as
follows.
Table 2.14: Details showing achievement in analysis of samples
Year Total No. of
sources
Bacteriological Test Chemical Test
Target Achievement Per cent Target Achievement Per cent
2008-09 6658 13316 Nil 0 6658 Nil 0
2009-10 6658 13316 103 0.77 6658 103 1.55
2010-11 6658 13316 1434 10.77 6658 1434 21.54
2011-12 6658 13316 1255 9.42 6658 1255 18.85
2012-13 6658 13316 2428 18.23 6658 2428 36.47
Source: Analytical report of Quality Control Division, KWA, Wayanad
As evident from the table above, there was heavy shortfall in achievement in
analysis of samples from 2008-09 to 2012-13.
In view of the fact that there were reports of outbreak of Cholera and other
water-borne diseases, resulting even in death of affected people, as discussed
in paragraph 2.2.13.1, the district administration should devote greater
attention to strengthen the quality control measures for safe drinking water.
KWA stated (September 2013) that sufficient treatment plants were not
available and supply of good quality water could not be ensured merely by
chlorination.
The drinking water quality monitoring and quality surveillance are two distinct
but closely related activities. There should be close collaboration between
drinking water supply agencies and health authorities.
51 Community Water Supply Scheme to Noolpuzha and Sulthan Bathery, Accelerated Rural Water
Supply Scheme (ARWSS) Padinjarathara, ARWSS Nalloornadu, Porunnannur and Vemom villages
Audit Report (General and Social Sector) for the year ended 31 March 2013
46
2.2.13 Sanitation Programme
The State Suchitwa Mission is the nodal agency in the State for the
implementation of the Total Sanitation Campaign. As on 30 April 2013, the
Mission utilised ` 9.83 crore, out of ` 10.37 crore received52
. The Mission had
a target of 53136 household latrines to be constructed (BPL: 50,655 and APL
2,481) during 2003-04 to 2013-14. As per the progress report, the Mission had
achieved 100 per cent of target by 2010-11. However, census 2011 data
reveals that out of 1,78,686 rural households in the district, 14,917 households
did not have latrine facilities.
The NRHM had conducted a survey (during 2012-13) in 100 (out of 2,500)
tribal colonies in Wayanad district with high risk of cholera and found that
1,793 latrines and 172 toilet complexes need to be provided in the colonies.
Out of 874 Anganwadis (AW) in the district, 828 AWs are without baby
friendly toilets and 257 AWs are without toilets. However, the Mission have
proposed for only 211 AW toilets in the Revised Project Implementation Plan,
2013.
2.2.13.1 Prevalence of Cholera
During 2011-13, 231 suspected cases of cholera were reported. Out of these,
33 cases were confirmed and 17 deaths were also reported. The medical team
visiting the area reported the absence of good quality drinking water and
sanitation facilities were the main reasons for spreading of the disease.
Cholera can spread as an epidemic if sanitation breaks down in distress areas.
No long term measures were adopted to tackle the issue. The district
administration must initiate steps to provide clean drinking water and better
sanitation facilities to prevent outbreak of the disease.
No solid or liquid waste treatment plants were installed in the District. All the
LSGIs in the district were following traditional method of waste disposal i.e.,
dumping in open area, with attendant consequences of pollution and health
hazard. These issues need to be addressed immediately by the Mission.
2.2.13.2 Contamination of Water due to untreated Hospital Waste
There was no system for treatment of wastewater in the District Hospital. The
wastewater was discharged to Mananthavady river which is the source of
water supply of KWA. In September 2007, the District Panchayath (DP)
proposed to set up a treatment plant. The Pollution Control Board agreed
(March 2010) for the proposal of the treatment plant and stated that
discharging untreated wastewater posed a threat to public health as the effluent
directly reaches the Mananthavady river. A rough cost estimate for ` 75 lakh
for construction of treatment plant was prepared in March 2010. Government
approved (March 2012) the proposal of DP for entrusting the work to M/s
Hindustan Pre Fab Limited. But the work of the plant has not been started till
date (June 2013). The DP attributed (July 2013) non-receipt of technical
sanction from Government for the delay.
52 State Government - ` 219.77 lakh, Central Government - ` 656.39 lakh, Beneficiary - ` 121.64 lakh,
Interest ` 38.8 lakh and miscellaneous - ` 0.02 lakh
Chapter II – Performance Audit
47
Economic Sector
2.2.14 Agriculture
2.2.14.1 Disbursement of loans by the co-operative Sector
Agricultural credit to the farmers by cooperative sector decreased from
` 117.08 crore in 2008-09 to ` 40.66 crore in 2012-13 and agricultural credit
as a percentage of total loan disbursed decreased from 31.6 to 3.85 per cent as
indicated below.
Table 2.15: Details of disbursement of agricultural loan
(` in lakh )
Sl. No. Particulars 2008-09 2009-10 2010-11 2011-12 2012-13
1. Total amount of Loan disbursed 369.45 496.50 694.91 854.55 1056.47
2. Total loan for agricultural purpose 117.08 65.42 68.93 66.35 40.66
3. Percentage of agricultural loan 31.69 13.18 9.92 7.76 3.85
Source: Joint Registrar of Co-operative Societies (Gl), Wayanad
The trends in the disbursement of agricultural credit over the years indicate
that the role of cooperative banks in agricultural sector is gradually decreasing.
2.2.14.2 Sustainable Development of Rice Based Farming System
The scheme on Sustainable Development of Rice Based Farming System is
intended to sustain rice cultivation and to augment the average productivity to
more than three tonne per hectare. During 2009-2013, expenditure of
` 4.56 crore was incurred under the programme. The result however, was not
encouraging as total cropped area under paddy decreased from 12,746 hectare
in 2008-09 to 8,995 hectare in 2011-1253
and total production also decreased
from 33,861 MT in 2008-09 to 23,526 MT in 2011-12. The productivity target
of three tonne per hectare was not achieved in any of the seasons during these
years54
. There was no monitoring and evaluation of the scheme, as envisaged
in the guidelines. Periodical monitoring is required to get a better result.
The Principal Agricultural Officer stated that better schemes and irrigation
facilities were required to make the paddy cultivation more attractive.
2.2.15 Forest
The forest area in the district represents 8.02 per cent of the total forest area in
the State. The district also accounts for 19.09 per cent of the Ecologically
Fragile Land in the State.
53 Source: Economic Review. Figures of 2012-13 were not available 54 2,657 kg/ha in 2008-09, 2,552 kg/ha in 2009-10, 2,525 kg/ha in 2010-11 & 2,615 kg/ha in 2011-12
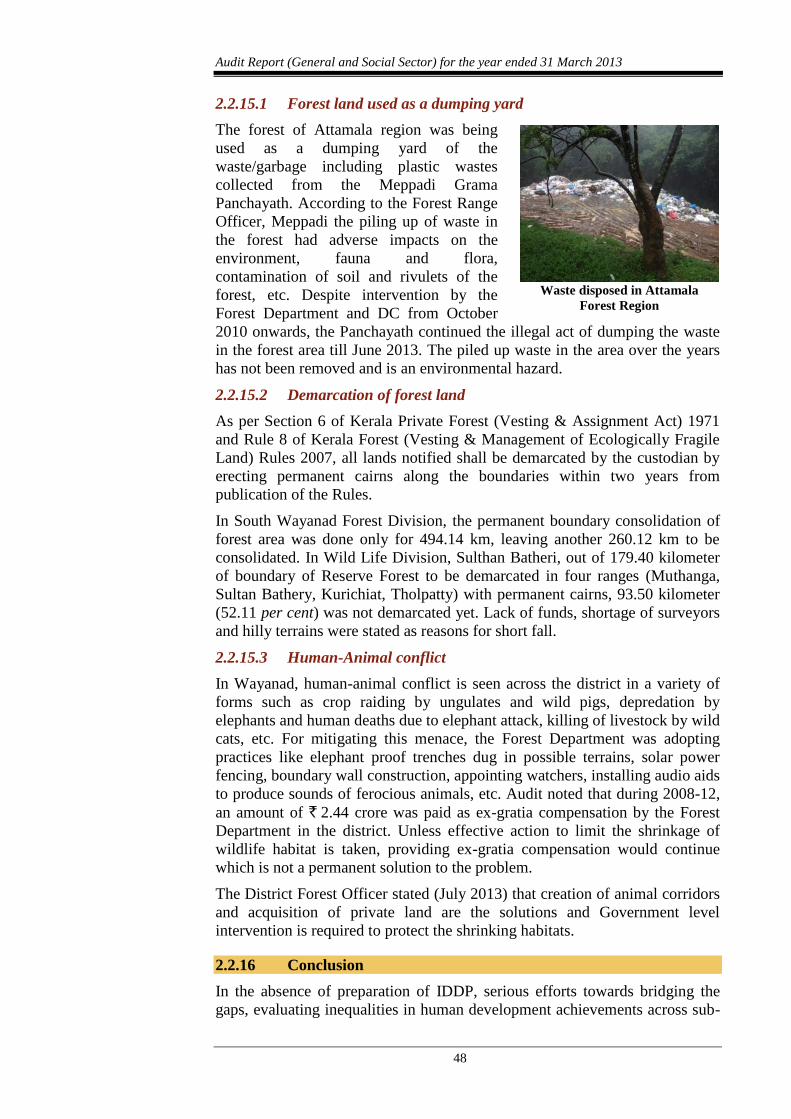
Audit Report (General and Social Sector) for the year ended 31 March 2013
48
2.2.15.1 Forest land used as a dumping yard
The forest of Attamala region was being
used as a dumping yard of the
waste/garbage including plastic wastes
collected from the Meppadi Grama
Panchayath. According to the Forest Range
Officer, Meppadi the piling up of waste in
the forest had adverse impacts on the
environment, fauna and flora,
contamination of soil and rivulets of the
forest, etc. Despite intervention by the
Forest Department and DC from October
2010 onwards, the Panchayath continued the illegal act of dumping the waste
in the forest area till June 2013. The piled up waste in the area over the years
has not been removed and is an environmental hazard.
2.2.15.2 Demarcation of forest land
As per Section 6 of Kerala Private Forest (Vesting & Assignment Act) 1971
and Rule 8 of Kerala Forest (Vesting & Management of Ecologically Fragile
Land) Rules 2007, all lands notified shall be demarcated by the custodian by
erecting permanent cairns along the boundaries within two years from
publication of the Rules.
In South Wayanad Forest Division, the permanent boundary consolidation of
forest area was done only for 494.14 km, leaving another 260.12 km to be
consolidated. In Wild Life Division, Sulthan Batheri, out of 179.40 kilometer
of boundary of Reserve Forest to be demarcated in four ranges (Muthanga,
Sultan Bathery, Kurichiat, Tholpatty) with permanent cairns, 93.50 kilometer
(52.11 per cent) was not demarcated yet. Lack of funds, shortage of surveyors
and hilly terrains were stated as reasons for short fall.
2.2.15.3 Human-Animal conflict
In Wayanad, human-animal conflict is seen across the district in a variety of
forms such as crop raiding by ungulates and wild pigs, depredation by
elephants and human deaths due to elephant attack, killing of livestock by wild
cats, etc. For mitigating this menace, the Forest Department was adopting
practices like elephant proof trenches dug in possible terrains, solar power
fencing, boundary wall construction, appointing watchers, installing audio aids
to produce sounds of ferocious animals, etc. Audit noted that during 2008-12,
an amount of ` 2.44 crore was paid as ex-gratia compensation by the Forest
Department in the district. Unless effective action to limit the shrinkage of
wildlife habitat is taken, providing ex-gratia compensation would continue
which is not a permanent solution to the problem.
The District Forest Officer stated (July 2013) that creation of animal corridors
and acquisition of private land are the solutions and Government level
intervention is required to protect the shrinking habitats.
2.2.16 Conclusion
In the absence of preparation of IDDP, serious efforts towards bridging the
gaps, evaluating inequalities in human development achievements across sub-
Waste disposed in Attamala
Forest Region
Chapter II – Performance Audit
49
regions and social groups would not be possible. There was no system in place
at the district level to have a consolidated position of the receipt and utilisation
of funds under various schemes implemented in the district. Adequate
infrastructure and human resources were not available in health sector.
Majority of tribal people in Wayanad were not brought to the mainstream of
society and remained marginalised, with lower indices in health and education.
Separate data on tribal population was not compiled for a proper assessment
on the magnitude of the problems existing especially in the areas of nutrition,
Infant Mortality Rate, Maternal Mortality Ratio, etc. There was undue delay in
allotment of land and construction of houses. The quality of water supplied
was not at the desired level. Agricultural credit from the cooperative banks
was gradually decreasing and schemes to augment rice production were not
depicting positive results. Issues like conservation of forest, recurring
incidences of human-animal conflicts were not addressed on a long term
perspective
2.2.17 Recommendation
The Government should evolve a continuous mechanism of
sharing/exchanging of vital data pertaining to various departments with
the LSGIs and other implementing agencies for prioritisation of the
plans.
There should be a system in place at the district level to have a
consolidated position of flow of funds emanating from various sources
including GOI and State Government and their utilisation for an
integrated approach towards the various developmental activities in the
district.
The health sector in the district should be strengthened by providing
adequate human resources and infrastructure in terms of the
established norms. Adequate monitoring for timely completion of
infrastructure projects is required.
The Government should reinforce the system of collection of vital data
related to health and educational indicators of tribal population, to be
used as critical inputs in planning and conceptualising the schemes
meant for the welfare of tribals.
As water borne diseases are increasingly reported in the district, KWA
should take immediate steps to provide sufficient treatment plants and
strengthen water quality control measures to ensure availability of safe
drinking water.
The above issues were referred to Government in November 2013; their reply
has not been received (January 2014).
50
SPORTS AND YOUTH AFFAIRS DEPARTMENT
2.3 Activities/Schemes for the promotion of Sports
Highlights
The Government of Kerala passed the Kerala Sports Act 2000 with the
principle of ‘Sports for All’. The State's sports objectives include development
of sports activities at grassroot level, and thereby ensuring mass participation
in national and international level sports events for sporting excellence. The
Performance Audit revealed deficiencies in planning, utilisation of funds,
completion of projects on time, implementation of programmes, etc.
Long-term plan was not prepared by the Department as comprehensive
database on sports infrastructure in the State was not available.
(Paragraph 2.3.6)
Instances of under-utilisation of grants for the development of sports,
abnormal delay in execution of projects and under-utilisation of
infrastructure were noticed.
(Paragraphs 2.3.7.2, 2.3.8. and 2.3.10.2)
The Sports Development Fund envisaged for the creation and
upgradation of sports facilities in the State, to arrange extra funds for
training abroad and engagement of dedicated specialist coaches for
meritorious sports persons was not created, despite a provision of
` 1.25 crore made in the State budget during 2010-12.
(Paragraphs 2.3.7.4)
The Panchayath Yuva Krida Aur Khel Abhiyan, a Centrally Sponsored
Scheme did not achieve the desired results as the targeted number of
Grama Panchayaths/Block Panchayaths were not covered.
(Paragraph 2.3.9.1)
Health related physical fitness test conducted at school level revealed that
only 19.61 per cent of the school going children in the State had the
minimum recommended standards. But, no effective remedial measures
were taken by the government for improving the physical fitness of school
going children.
(Paragraph 2.3.9.2)
The progress achieved in the development of infrastructure for staging
35th
National Games in the State by the National Games Secretariat was
poor.
(Paragraph 2.3.11.2)
2.3.1 Introduction
The Government of Kerala (Government) passed the Kerala Sports Act, 2000
with the concept of ‘Sports for All’. It envisaged the promotion of sports and
games to augment athletic efficiency in the State and the constitution of Sports
Chapter II – Performance Audit
51
Councils at the State, Districts and local levels for securing greater measure of
participation of the people in sports and games. Rules were framed in July
2008 for governing the various activities of the Sports Councils. The sports
objectives of the State include the development of sports activities at grassroot
level and ensuring mass participation in sports and games in national and
international sports events for sporting excellence. The State is also on the
way for adopting and implementing a sports policy to make Kerala a vibrant,
leading-edge state in the sports arena, duly recognising the athlete as the
central character of all sporting activities.
Sports scenario in Kerala
Kerala is in the forefront in athletics with good contribution in Olympic
Games, Commonwealth Games and Asian Games. In Beijing Olympics (2008)
and London Olympics (2012), around 25 per cent (three out of 16 and four out
of 14 respectively) of athletes who represented the country were from Kerala.
In the XIX Commonwealth Games, New Delhi 2010, Kerala athletes won five
medals (one Gold, one Silver and three Bronze) for the country. In XVI Asian
Games 2010 held at Guangzhou, China, Kerala athletes also won five medals
(three Gold, one Silver and one Bronze) for the country. Kerala is also the
national champion in Athletics (senior level) for the last four years (2009-12).
In Volleyball, Kerala men’s team were the national champions for the last two
years and Kerala women’s team were runners up for the last four years. The
overall medal positions of the State in the last two National Games were 75
and 87 respectively and the all-India position of the State in the National
Games was fourth and seventh respectively. Similarly, in National School
Games, the position of the State was between five and seven during 2009-13.
Kerala State Sports Council (KSSC) implements various sports promotion
activities in Kerala through 32 affiliated organisations under it.
2.3.2 Organisational set-up
The Department of Sports and Youths Affairs (Department), Government of
Kerala is primarily responsible for enunciating the broad vision and policies
for sports, the implementation of plans and programmes related to sports and
youth affairs are carried out through the Director, Sports & Youth Affairs
(DS&YA), KSSC an autonomous body and through the decentralised set up of
local self-governments. A society under the title ‘National Games Secretariat
(NGS)’ was formed (November 2008) by the Government for the successful
and timely conduct of the 35th
National Games.
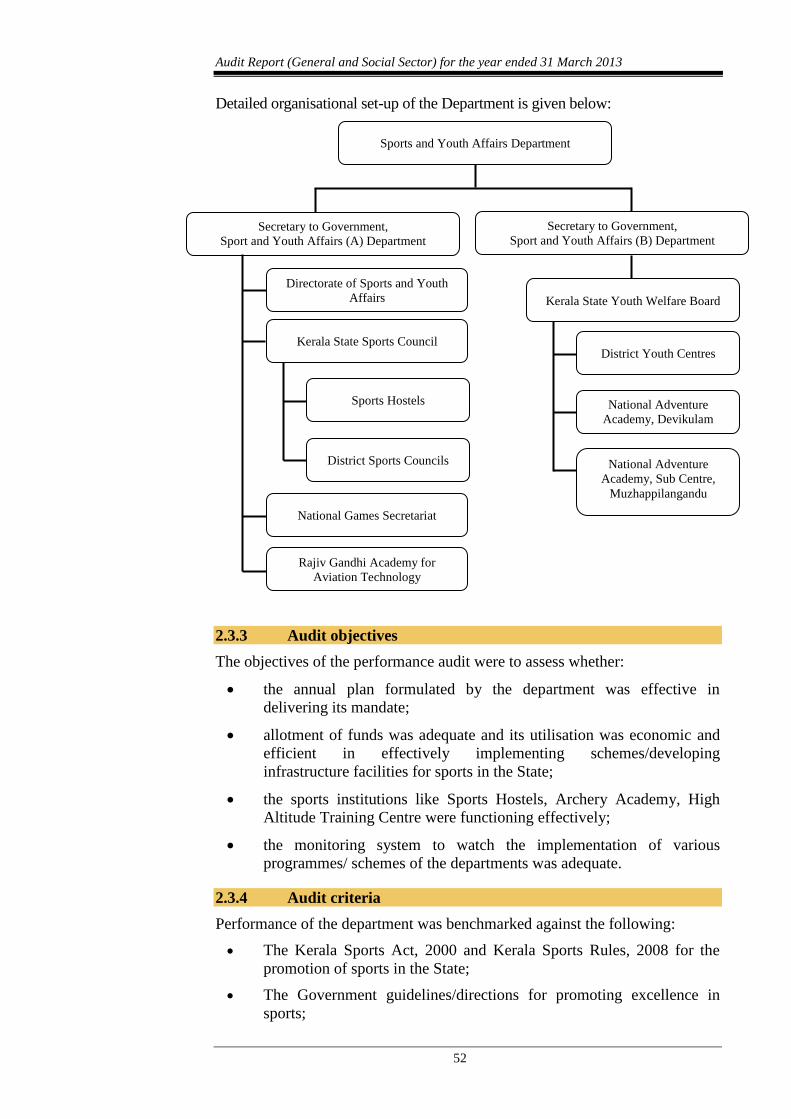
Audit Report (General and Social Sector) for the year ended 31 March 2013
52
Detailed organisational set-up of the Department is given below:
2.3.3 Audit objectives
The objectives of the performance audit were to assess whether:
the annual plan formulated by the department was effective in
delivering its mandate;
allotment of funds was adequate and its utilisation was economic and
efficient in effectively implementing schemes/developing
infrastructure facilities for sports in the State;
the sports institutions like Sports Hostels, Archery Academy, High
Altitude Training Centre were functioning effectively;
the monitoring system to watch the implementation of various
programmes/ schemes of the departments was adequate.
2.3.4 Audit criteria
Performance of the department was benchmarked against the following:
The Kerala Sports Act, 2000 and Kerala Sports Rules, 2008 for the
promotion of sports in the State;
The Government guidelines/directions for promoting excellence in
sports;
Sports and Youth Affairs Department
Secretary to Government,
Sport and Youth Affairs (A) Department
Secretary to Government,
Sport and Youth Affairs (B) Department
Kerala State Sports Council
Sports Hostels
District Sports Councils
National Games Secretariat
Rajiv Gandhi Academy for
Aviation Technology
Directorate of Sports and Youth
Affairs Kerala State Youth Welfare Board
District Youth Centres
National Adventure
Academy, Devikulam
National Adventure
Academy, Sub Centre,
Muzhappilangandu
Chapter II – Performance Audit
53
Orders, sanctions and guidelines issued by the Government for the
creation and maintenance of infrastructure and conduct of sports
related activities;
Guidelines issued by the Government from time to time for
empanelment of coaches and selection of student beneficiaries.
2.3.5 Scope and methodology of Audit
A Performance Audit on Activities/Schemes for the promotion of sports was
conducted between April 2013 and July 2013 covering the period 2008-13, by
test check of records of the Department, DS&YA, KSSC and NGS. Further,
records of District Sports Councils (DSCs), five Centralised Sports Hostels
(CSHs) and 84 Grama/Block Panchayaths (GPs/BPs) in the five55
(out of 14)
selected districts were also test-checked. The districts for audit were selected
by adopting sampling method of Probability Proportional to Size Without
Replacement (PPSWOR).
Audit methodology included scrutiny of records and information and site
inspections along with implementing officials for the collection of data and
audit evidence. An entry conference was held (April 2013) with the
Secretaries of Sports and Youth Affairs and audit methodology of the
performance audit was informed. The audit findings were discussed with the
Secretary to Government (Sports and Youth Affairs) in the exit conference
(October 2013) and their views have been incorporated in the Report at
appropriate places.
Audit findings
The audit findings are discussed as under.
2.3.6 Planning
The functions of the department involves creation of infrastructure facilities,
conduct of sports activities, selection of coaches and sport beneficiaries
through agencies like DS&YA, KSSC etc., for improving excellence in sports.
They also provide hostel facilities and other sports related training/coaching
through State/National/International coaches.
2.3.6.1 Assessment of requirement and prioritisation of works
The Department prepared Annual Plans related to Sports and Youth Affairs
with reference to Five-Year Plans of the State. Other than the Annual Plans,
the Department did not have any long term plan for the development of sports.
Funds for the development of sports and youth affairs were provided by the
Government based on annual plan proposals of the DS&YA and KSSC.
Audit noticed that 11 projects/schemes like construction of stadia, swimming
pool, development of play fields, sports academies, etc., which were
repeatedly included in the annual plans of KSSC (Appendix 2.7) had not
commenced, as of March 2013. The inclusion of such projects in plan
55 Alappuzha, Kottayam, Kozhikode, Malappuram and Thiruvananthapuram
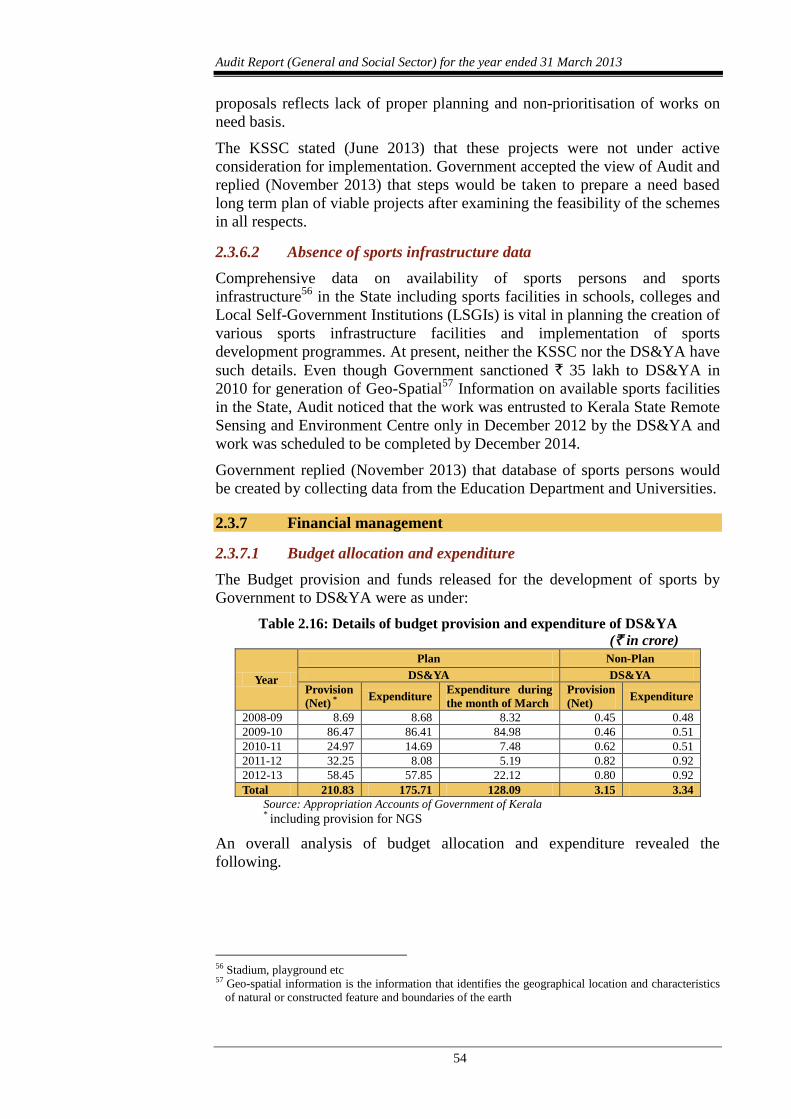
Audit Report (General and Social Sector) for the year ended 31 March 2013
54
proposals reflects lack of proper planning and non-prioritisation of works on
need basis.
The KSSC stated (June 2013) that these projects were not under active
consideration for implementation. Government accepted the view of Audit and
replied (November 2013) that steps would be taken to prepare a need based
long term plan of viable projects after examining the feasibility of the schemes
in all respects.
2.3.6.2 Absence of sports infrastructure data
Comprehensive data on availability of sports persons and sports
infrastructure56
in the State including sports facilities in schools, colleges and
Local Self-Government Institutions (LSGIs) is vital in planning the creation of
various sports infrastructure facilities and implementation of sports
development programmes. At present, neither the KSSC nor the DS&YA have
such details. Even though Government sanctioned ` 35 lakh to DS&YA in
2010 for generation of Geo-Spatial57
Information on available sports facilities
in the State, Audit noticed that the work was entrusted to Kerala State Remote
Sensing and Environment Centre only in December 2012 by the DS&YA and
work was scheduled to be completed by December 2014.
Government replied (November 2013) that database of sports persons would
be created by collecting data from the Education Department and Universities.
2.3.7 Financial management
2.3.7.1 Budget allocation and expenditure
The Budget provision and funds released for the development of sports by
Government to DS&YA were as under:
Table 2.16: Details of budget provision and expenditure of DS&YA
(` in crore)
Year
Plan Non-Plan
DS&YA DS&YA
Provision
(Net) * Expenditure
Expenditure during
the month of March
Provision
(Net) Expenditure
2008-09 8.69 8.68 8.32 0.45 0.48
2009-10 86.47 86.41 84.98 0.46 0.51
2010-11 24.97 14.69 7.48 0.62 0.51
2011-12 32.25 8.08 5.19 0.82 0.92
2012-13 58.45 57.85 22.12 0.80 0.92
Total 210.83 175.71 128.09 3.15 3.34
Source: Appropriation Accounts of Government of Kerala *
including provision for NGS
An overall analysis of budget allocation and expenditure revealed the
following.
56 Stadium, playground etc 57 Geo-spatial information is the information that identifies the geographical location and characteristics
of natural or constructed feature and boundaries of the earth
Chapter II – Performance Audit
55
2.3.7.2 Lapse/Under-utilisation of funds
According to paragraph 91 of Kerala Budget Manual, spending departments
are required to surrender grants/appropriations or portions thereof as and when
savings are anticipated. The departments should not wait till the last day of
financial year for surrender of grants/appropriations. Contrary to the above,
Audit noticed that the budget provisions under certain heads of account
operated by the DS&YA were kept unutilised until the last day of the financial
year and were allowed to lapse at the close of the financial year.
Huge savings under various heads indicate that the budget provisions were
made without proper assessment of requirement. Against the budget provision
of ` 210.83 crore to DS&YA under Plan head during 2008-13 for the
development of sports in the State, only ` 175.71 crore was drawn and the
balance amount of ` 35.12 crore lapsed as it was not surrendered by the
department in time.
2.3.7.3 Rush of expenditure
According to paragraph 91(2) of the Kerala Budget Manual, the flow of
expenditure should be regulated in such a manner that there is no rush of
expenditure at the end of the financial year. It was noticed that the same was
not adhered to by the DS&YA and the expenditure during the month of March
was 95.85 per cent of the net provision during 2008-09 and 38.24 per cent
during 2012-13.
2.3.7.4 State Sports Development Fund
The Kerala State Sports Commission, appointed by the Government in June
2008, recommended (June 2009) the setting up of State Sports Development
Fund for the creation and up-gradation of sports facilities across the State in a
phased manner, to meet insurance coverage of students and to arrange extra
funds for training abroad and engagement of specialised coaches for
meritorious sports persons.
Based on the recommendations, Government made a budgetary allocation of
` 1.25 crore to DS&YA for the establishment of State Sports Development
Fund during 2010-12. However, Audit noticed that the budgetary allotment
was not utilised and State Sports Development Fund was not established
(December 2013) due to reasons like non-finalisation of draft trust deed by the
DS&YA, delay in constitution of the trustees by Government and registration
of trust deed. Thus, the intended benefits out of the State Sports Development
Fund were not derived even after sufficient budget allotment was made to the
Department.
Government stated (November 2013) that the Fund would be created once the
orders of tax exemption for registration of the Trust is received from the
Taxes Department.
2.3.8 Sports Infrastructure
According to the Sports Act, 2000, KSSC was responsible for the
development of sports infrastructure in the State. Certain projects would be
carried out by LSGIs/DSCs with partial assistance of KSSC/DS&YA and the
remaining amount needed for the project would be raised by the LSGIs/DSCs.
Audit Report (General and Social Sector) for the year ended 31 March 2013
56
Audit noticed that 10 sports infrastructure projects costing ` 78.30 crore,
initiated during 2000-2013, were still under construction as detailed in
Appendix 2.8. Out of the 10 works, three works directly executed by KSSC
were not completed (December 2013) despite sufficient funds being available
due to reasons like delay in re-arrangement of works, revision of estimates,
etc. Till December 2013 KSSC spent an amount of ` 18.40 crore against the
project estimate of ` 14.49 crore resulting in a cost escalation of ` 3.91 crore
and time overrun of more than 13 years in the construction of Aquatic
Complex at Pirappancode started in the year 2000.
In respect of the remaining seven works, financial assistance (` 25.59 crore)
were provided to LSGIs/DSCs for the creation of sports infrastructure
facilities. The Government/KSSC while releasing financial assistance to the
implementing agencies of these works stated that the assistance would be
limited to the extent of funds sanctioned and balance was to be raised from
sources like MP/MLA fund or from their own contribution. At the time of
releasing the assistance, KSSC/DS&YA did not assess the capability of the
implementing agencies to raise the additional funds required for completion of
the project. In all the cases the implementing agencies failed to raise the
required funds and repeatedly requested DS&YA for additional funds. It was
partially entertained in certain cases, but it was not adequate to complete the
works. Thus the seven works were halted due to lack of funds and an amount
of ` 25.59 crore released on these works was lying blocked up.
Government accepted the audit observations and stated that the department
had only limited provision of funds and the balance amount required for such
projects had to be mobilised from external sources like LSGIs, MLA/MP
funds, etc.
Thus the KSSC/DS&YA failed in completion of the various projects due to
poor financial and project management. This resulted in non-achievement of
the intended benefits besides time and cost overruns.
2.3.9 Implementation of Sports Development schemes
2.3.9.1 Panchayath Yuva Krida Aur Khel Abhiyan (PYKKA)
To promote the practice of active sports among rural youth through creation of
adequate sports infrastructure and conduct of annual competitions, the KSSC
implements PYKKA, a Centrally Sponsored Scheme, since 2008 in the State.
The scheme was to be implemented in 400 GPs and 60 BPs during 2008-12.
The scheme was extended by one year and during 2008-13. KSSC received ` 24.68 crore under the scheme from GOI and incurred an expenditure of ` 17
crore (March 2013). Audit scrutiny of the implementation of the scheme
revealed the following:
An amount of ` 9.82 crore was distributed to only 199 GPs and 28 BPs
and the scheme was only partially implemented in these GPs and BPs.
Most of the GPs covered under the scheme did not turn up for second
instalment of assistance and did not furnish statement of
expenditure/Utilisation Certificates (UCs) to KSSC. Records produced
to Audit indicated that as against the release of ` 9.82 crore, the
beneficiary Panchayaths had furnished UCs only for ` 1.44 crore.
Chapter II – Performance Audit
57
Out of 84 Panchayaths test-checked, only 47 Panchayaths utilised ‘One
Time Seed Capital Grant’ for the creation of play fields utilising ` 1.54
crore against the release of ` 3.85 crore. It could be seen that an
amount of ` 2.31 crore was not utilised for the creation of play fields.
But an amount of ` 1.64 crore released for annual rural competitions
was fully utilised without the creation of play fields intended.
Thus the scheme, conceived in 2008, to promote the practice of active sports
among rural youth through creation of adequate sports infrastructure had not
made the desired progress in creation of infrastructure and annual
competitions were conducted without adequate infrastructure in the State.
Government accepted the audit observations and the State Level Executive
Committee headed by the Chief Secretary, decided (October 2013) to
constitute District Level Committees under the chairmanship of District
Collectors to sort out the issues for successful implementation of scheme.
2.3.9.2 Total Physical Fitness Programme (TPFP)
Government constituted a committee in November 2007 for the integration of
Health and Physical Education in the Educational Curriculum for the schools
in Kerala. Government sanctioned (January 2008) ‘Total Physical Fitness
Programme’ (TPFP) to assess the physical fitness status of school children in
the State. Health related physical tests conducted at school level indicated that
only 19.61 per cent of students had the minimum recommended health related
physical standards. The KSSC, in-charge of the implementation of the
programme, spent ` 1.41 crore during 2008-13 for conducting the tests and
uploading the data. Government approved the inclusion of physical education
as a part of curriculum in schools to improve the physical fitness of students
and directed the State Council for Education Research and Training (SCERT)
to recommend the syllabus.
The SCERT did not finalise the curriculum even after a lapse of four years and
thus the scheme envisaged to improve the physical fitness of school children
was not achieved.
Government stated that the inclusion of physical education in curriculum
requires creation of additional posts and infusion of more funds. It was also
stated that a new scheme ‘Play for Health’ was sanctioned (October 2013) to
achieve a total physically fit populace in the State and to convert the schools
as sporting hubs.
The reply of the Government is not acceptable as the Government should have
considered the financial implication of the scheme before approving it.
Moreover, the project mentioned is only a pilot project to be implemented in
25 schools. The justification and rationale behind the scheme is also not clear.
2.3.10 Sports institutions
2.3.10.1 Sports Hostels
The KSSC directly runs 23 centralised sports hostels in the State to nurture
talented sports persons to international level and for giving specialised training
in various disciplines. Besides, 13 school hostels and 33 college hostels in the
State admit students sponsored by KSSC. During 2008-13, KSSC spent
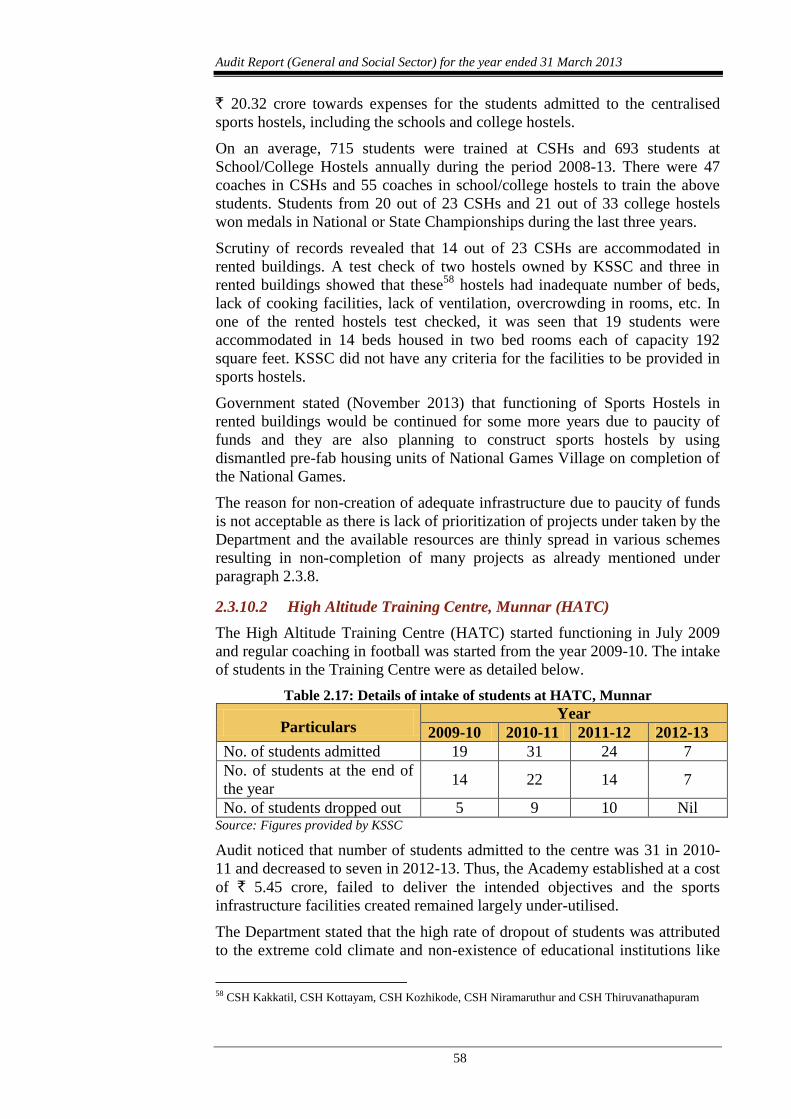
Audit Report (General and Social Sector) for the year ended 31 March 2013
58
` 20.32 crore towards expenses for the students admitted to the centralised
sports hostels, including the schools and college hostels.
On an average, 715 students were trained at CSHs and 693 students at
School/College Hostels annually during the period 2008-13. There were 47
coaches in CSHs and 55 coaches in school/college hostels to train the above
students. Students from 20 out of 23 CSHs and 21 out of 33 college hostels
won medals in National or State Championships during the last three years.
Scrutiny of records revealed that 14 out of 23 CSHs are accommodated in
rented buildings. A test check of two hostels owned by KSSC and three in
rented buildings showed that these58
hostels had inadequate number of beds,
lack of cooking facilities, lack of ventilation, overcrowding in rooms, etc. In
one of the rented hostels test checked, it was seen that 19 students were
accommodated in 14 beds housed in two bed rooms each of capacity 192
square feet. KSSC did not have any criteria for the facilities to be provided in
sports hostels.
Government stated (November 2013) that functioning of Sports Hostels in
rented buildings would be continued for some more years due to paucity of
funds and they are also planning to construct sports hostels by using
dismantled pre-fab housing units of National Games Village on completion of
the National Games.
The reason for non-creation of adequate infrastructure due to paucity of funds
is not acceptable as there is lack of prioritization of projects under taken by the
Department and the available resources are thinly spread in various schemes
resulting in non-completion of many projects as already mentioned under
paragraph 2.3.8.
2.3.10.2 High Altitude Training Centre, Munnar (HATC)
The High Altitude Training Centre (HATC) started functioning in July 2009
and regular coaching in football was started from the year 2009-10. The intake
of students in the Training Centre were as detailed below.
Table 2.17: Details of intake of students at HATC, Munnar
Particulars Year
2009-10 2010-11 2011-12 2012-13
No. of students admitted 19 31 24 7
No. of students at the end of
the year 14 22 14 7
No. of students dropped out 5 9 10 Nil Source: Figures provided by KSSC
Audit noticed that number of students admitted to the centre was 31 in 2010-
11 and decreased to seven in 2012-13. Thus, the Academy established at a cost
of ` 5.45 crore, failed to deliver the intended objectives and the sports
infrastructure facilities created remained largely under-utilised.
The Department stated that the high rate of dropout of students was attributed
to the extreme cold climate and non-existence of educational institutions like
58 CSH Kakkatil, CSH Kottayam, CSH Kozhikode, CSH Niramaruthur and CSH Thiruvanathapuram
Chapter II – Performance Audit
59
college/higher secondary schools in the vicinity. The Secretary, KSSC,
accepted the findings of Audit and stated that the possibility of utilising the
Centre for specialised trainings of short durations would be considered.
The reasons given by the Department for higher dropout rates are not
acceptable as these conditions were known at the time of setting up of the
centre.
2.3.10.3 Archery Academy in Wayanad
Government sanctioned (June 2012) the establishment of Archery Academy in
Wayanad District with a view to provide proper training and modern
equipment to the highly talented Archers in the State at an estimated cost of
` 50 lakh. The NGS was entrusted with the preparation of plan, estimates and
execution of work. Audit noticed that, the NGS has not started (October 2013)
the construction work. Records produced to Audit revealed that the land for
setting up the Archery Academy was transferred by the Local Self-
Government Department (LSGD) in January 2010 with the condition that the
land was to be utilised within three years, failing which the right to the land
would automatically vest with the local Panchayath. The delay in according
administrative sanction by Government was due to the failure of the DS&YA
in taking up the project in right earnest due to non-availability of suitable
person to formulate a detailed project report, lack of resources, adequate field
staff, etc., which resulted in the non-execution of the work and non-
achievement of the objective to nurture talented archers.
2.3.11 35th
National Games – Kerala
The 35th
National Games was allotted (November 2008) to Kerala by the
Indian Olympic Association (IOA). For planning and the successful staging of
the 35th
National Games, the Government of Kerala established (November
2008) National Games Secretariat59
(NGS) and constituted six60
committees.
The games were tentatively planned to be held in February 2014.
2.3.11.1 Funding
The estimated cost of National Games was ` 611.33 crore and the GOI
assured an assistance of ` 121 crore. During 2008-13, as against the total
release of ` 212.44 crore (State Government: ` 149.66 crore, GOI: ` 62.78
crore) NGS spent ` 130.83 crore for the Games.
2.3.11.2 Infrastructure/Venue Development
The National Games Secretariat (NGS) planned to execute 25 works as
detailed in Appendix 2.9, including construction of 10 new stadia (excluding
one Greenfield stadium at Thiruvananthapuram on Design Build Operate
Transfer mode), renovation of 14 existing sports infrastructure at various
places in the State and the construction of National Games Village at
Thiruvananthapuram. The total estimated cost of these 25 works, excluding
59 A registered society established under the Travancore Cochin Literary, Scientific and Charitable
Societies Registration Act 1956 60 National Games Organising Committee (NGOC), Co-ordination Committee, Empowered Committee,
Technical Committee, Technical Committee for Sports and Purchase Committee
Audit Report (General and Social Sector) for the year ended 31 March 2013
60
the Greenfield Stadium, was ` 274.92 crore. NGS appointed (May 2009)
M/s CES-SPAJV as Project Management Consultant (PMC) for
construction/renovation of existing sports infrastructure for the conduct of 35th
National Games. The PMC was entrusted with the consultancy and
supervisory works relating to the project from the stage of initiation to
completion. The project design and preparation of drawings etc., were also the
duties and responsibilities of PMC. PMC failed to deliver the services as
desired and the consultancy contracted with M/s CES-SPAJV was terminated
(March 2012) and new consultants Bharat Sanchar Nigam Limited (BSNL)
and Kerala Industrial and Technical Consultancy Organisation Limited
(KITCO) were appointed (January 2012).
Audit noticed that only nine out of 25 works planned were completed or were
nearing completion (December 2013). For the remaining 16 works, the
percentage of physical progress of seven works ranged between zero to 40. It
was also noted that non-identification of site, termination and re-arrangement
of contracts, change in design and lack of co-ordination by PMC, etc., were
the reasons for the slow progress of the works.
Audit findings on the execution of certain major works by the NGS were as
under.
Trap and Skeet facility at Mookunnimala, Thiruvananthapuram
For the development of Trap and Skeet venue at Army Shooting Range
Mookunnimala, Thiruvananthapuram, the NGS obtained (April 2012)
permission of Army authorities to conduct the survey for the preparation of
detailed Map for construction of Trap and Skeet facility. The NGS awarded
(January 2013) the work of construction of trap and skeet facility to a firm for
` 1.46 crore, which included construction of towers and bunkers before
obtaining the permission of Army. As the Army authorities objected to the
construction of towers and bunkers, the work has not commenced as of
December 2013. Though NGS identified another site, it was yet to obtain the
approval of the Ministry of Defence. Thus, the delay in finalisation of site may
have the risk of trap and skeet event being excluded from the Games.
Government replied (November 2013) that the Chief Minister had taken up the
matter (September 2013) with the Ministry of Defence for obtaining formal
sanction for the commencement of the work.
The reply is not acceptable as there was no justification on the part of NGS in
awarding the work even when the army headquarters had informed (April
2012) that the permission given was only for survey and not for construction
activities. No progress has been achieved in this context till date (December
2013).
Construction of Shooting Range, Vattiyoorkavu, Thiruvananthapuram
The work for the construction of a shooting range at Government Polytechnic
Vattiyoorkavu, Thiruvananthapuram was awarded (September 2010) to a
contractor for ` 17.10 crore with period of completion of ten months. The
proposed work included construction of two buildings with 10 m, 25 m and 50
m shooting ranges. The NGS terminated the contract (July 2012) citing the
slow progress of work. However, the cancellation made was revoked (January
2013) and extension of time was given to the contractor to complete the work
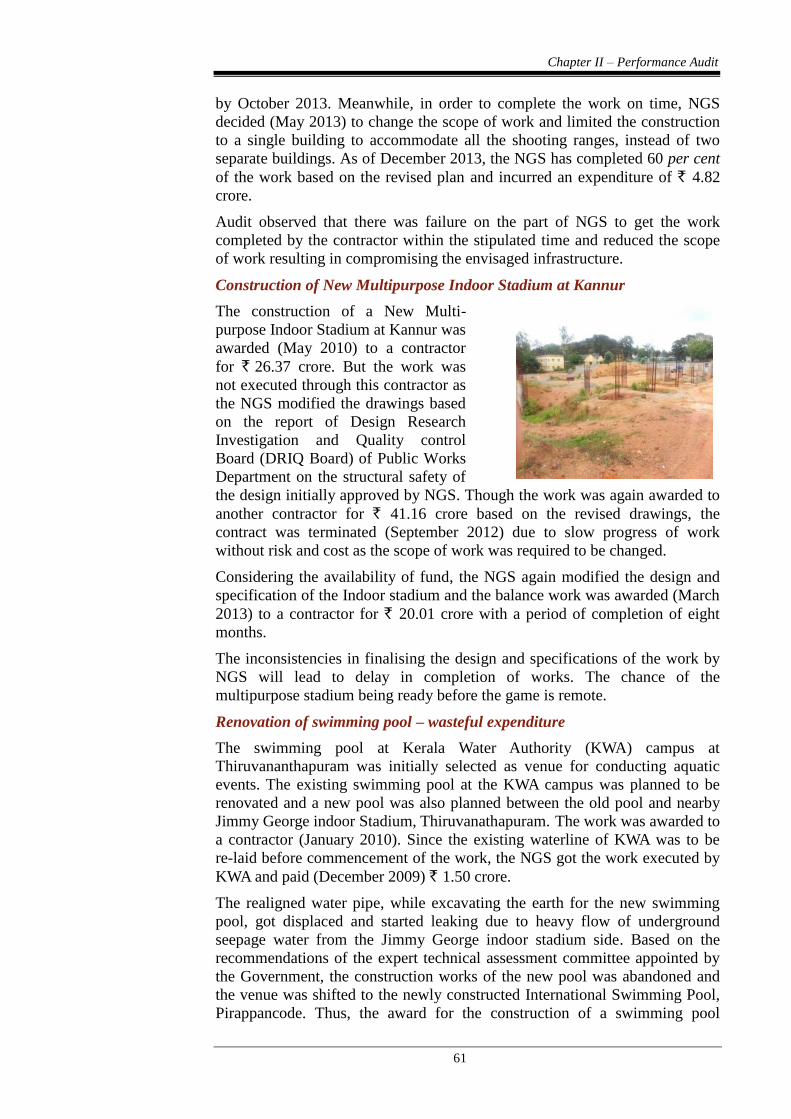
Chapter II – Performance Audit
61
by October 2013. Meanwhile, in order to complete the work on time, NGS
decided (May 2013) to change the scope of work and limited the construction
to a single building to accommodate all the shooting ranges, instead of two
separate buildings. As of December 2013, the NGS has completed 60 per cent
of the work based on the revised plan and incurred an expenditure of ` 4.82
crore.
Audit observed that there was failure on the part of NGS to get the work
completed by the contractor within the stipulated time and reduced the scope
of work resulting in compromising the envisaged infrastructure.
Construction of New Multipurpose Indoor Stadium at Kannur
The construction of a New Multi-
purpose Indoor Stadium at Kannur was
awarded (May 2010) to a contractor
for ` 26.37 crore. But the work was
not executed through this contractor as
the NGS modified the drawings based
on the report of Design Research
Investigation and Quality control
Board (DRIQ Board) of Public Works
Department on the structural safety of
the design initially approved by NGS. Though the work was again awarded to
another contractor for ` 41.16 crore based on the revised drawings, the
contract was terminated (September 2012) due to slow progress of work
without risk and cost as the scope of work was required to be changed.
Considering the availability of fund, the NGS again modified the design and
specification of the Indoor stadium and the balance work was awarded (March
2013) to a contractor for ` 20.01 crore with a period of completion of eight
months.
The inconsistencies in finalising the design and specifications of the work by
NGS will lead to delay in completion of works. The chance of the
multipurpose stadium being ready before the game is remote.
Renovation of swimming pool – wasteful expenditure
The swimming pool at Kerala Water Authority (KWA) campus at
Thiruvananthapuram was initially selected as venue for conducting aquatic
events. The existing swimming pool at the KWA campus was planned to be
renovated and a new pool was also planned between the old pool and nearby
Jimmy George indoor Stadium, Thiruvanathapuram. The work was awarded to
a contractor (January 2010). Since the existing waterline of KWA was to be
re-laid before commencement of the work, the NGS got the work executed by
KWA and paid (December 2009) ` 1.50 crore.
The realigned water pipe, while excavating the earth for the new swimming
pool, got displaced and started leaking due to heavy flow of underground
seepage water from the Jimmy George indoor stadium side. Based on the
recommendations of the expert technical assessment committee appointed by
the Government, the construction works of the new pool was abandoned and
the venue was shifted to the newly constructed International Swimming Pool,
Pirappancode. Thus, the award for the construction of a swimming pool
Audit Report (General and Social Sector) for the year ended 31 March 2013
62
without conducting its feasibility study resulted in a wasteful expenditure of
` 1.50 crore.
Audit analysis of the arrangements of National Games showed that only nine
out of 25 works were fully/almost completed and the stages of completion of
the seven works ranged between zero to 40 per cent. This indicates that
progress of completion of the arrangements for National Games allotted to the
State in November 2008 is poor and the targets fixed for completion of the
arrangements were not achieved so far.
2.3.12 Internal controls
2.3.12.1 Arrears in Statutory Audit
As per the Kerala Sports Act 2008, the accounts of the Kerala State Sports
Council were to be audited by the Local Fund Audit authorities and the reports
was to be submitted to Government. However, Audit noticed that the accounts
of the KSSC were audited only up to the year 2008-09.
2.3.13 Conclusion
The Department did not create a comprehensive database on sports
infrastructure facilities in the State as envisaged and hence a realistic need
based long-term plan to achieve the vision of the Department was not
prepared. State Sports Development Fund, mainly intended to meet insurance
coverage of students, to arrange training abroad and engagement of
specialized coaches for meritorious sport persons, was not created despite a
budgetary allocation of ` 1.25 crore was made available during 2010-12.
Infrastructure development plans to excel in sports were limited to allocation
of funds without prioritization and consequently the resources of the
Government were thinly spread over on many projects leading to non-
completion of many of the projects. The PYKKA, a centrally sponsored
scheme, covered (December 2013) only 199 GPs and 28 BPs against the target
of 400 GPs and 60 BPs resulting in non-achievement of the desired progress.
Infrastructure development in connection with the 35th
National Games
indicates slow progress in achievement of the targets fixed by NGS. In view of
the non-completion, non-creation and non-provision of infrastructure and
equipment, the State’s sports objectives of raising the level and quality of
participation in national and international level sports events could remain
unachieved.
2.3.14 Recommendations
Government should ensure the early completion of the comprehensive
database of sports infrastructure and sports personnel, to be used in the
planning process for the development of sports in the State.
Government should prioritise, with specific timelines, completion of
sports infrastructure development works, delayed due to lack of funds
and other bottlenecks and effectively utilise the available resources.
Government should ensure speedy completion of all the projects for
the smooth conduct of 35th
National Games.
63
WATER RESOURCE DEPARTMENT
2.4 National Rural Drinking Water Programme
Highlights
To provide every rural person with water for drinking, cooking and other
domestic basic needs, a national water supply and sanitation programme was
introduced (1954) in the country. Accelerated Rural Water Supply Programme
(ARWSP), introduced (1972-73) to accelerate the pace of coverage, was
subsequently renamed as National Rural Drinking Water Programme
(NRDWP). A performance audit of the implementation of the NRDWP in the
State was conducted and following are the major observations of Audit.
Five year rolling plan as envisaged in the framework for implementation
of NRDWP (2010) was not prepared and only Annual Action Plan was
prepared. Consequently, adequate priority was not given for schemes
started years back.
(Paragraph 2.4.5)
Lack of definite work execution plan led to non-achievement of yearly
targets fixed for coverage of habitations. Out of 187 schemes taken up
during 2008-13, only 34 were completed.
(Paragraph 2.4.8)
Seven schemes sanctioned for coverage of water quality affected
habitations were not taken up.
(Paragraph 2.4.10)
Though 20 schemes were sanctioned for sustainability of water sources
during 2008-13 by the State Level Scheme Sanctioning Committee
(SLSSC), only four schemes were taken up and completed.
(Paragraph 2.4.11)
Out of the 16 sub-divisional laboratories formed in the State, 15 of them
were functioning without separate infrastructure and technical facilities.
(Paragraph 2.4.12.1)
Though a State Water and Sanitation Mission was formed, activities as
envisaged in the guidelines were not performed.
(Paragraph 2.4.14)
2.4.1 Introduction
To provide every rural person with water for drinking, cooking and other
domestic basic needs on a sustainable basis, a national water supply and
sanitation programme was introduced in the year 1954. To accelerate the pace
of coverage, Central Government introduced the Accelerated Rural Water
Supply Programme (ARWSP) in 1972-73. The entire programme was given a
Mission approach when the National Drinking Water Mission (NDWM) was
introduced in 1986. In 1991, NDWM was renamed as Rajiv Gandhi National
Audit Report (General and Social Sector) for the year ended 31 March 2013
64
Drinking Water Mission. The ARWSP was subsequently renamed as National
Rural Drinking Water Programme (NRDWP) for the Eleventh Five Year Plan
period and this continued for the Twelfth Five Year Plan period.
The Guidelines of the programme revolved around the three distinct inter-
related issues viz., accelerating the coverage of remaining uncovered
habitations with safe drinking water systems, promote sustainability of safe
drinking water systems and institutionalising water quality management,
monitoring and surveillance systems.
2.4.2 Audit Objectives
The objectives of the Performance Audit were to assess whether:
the planning process conceived was adequate for successful
implementation of the programme in terms of coverage, source
sustainability and water quality;
the fund management was economical and effective;
the implementation of various programme components was effective
and efficient; and
there existed effective monitoring and evaluation mechanism.
2.4.3 Audit Criteria
Audit adopted criteria derived from the following:
Vision, Mission and Goals of NRDWP as reflected in the framework
for implementation
Water Quality norms stipulated in the Protocol on Water Quality
Monitoring
Work execution norms of Kerala Public Works Department Code and
Public Health Engineering Department data book.
2.4.4 Scope and Audit Methodology
Kerala Water Authority (Authority), a statutory authority under the State
Government, is the implementing agency for the programme. Economy,
efficiency and effectiveness of the NRDWP implementation in the State,
during the five year period (2008-2013) were reviewed. In the process, audit
scrutinised the records of Water Resources Department, Head Office of the
Authority, Project Divisions, Public Health (PH) Divisions, State Referral
Institute (SRI) and Regional/Circle Offices, Quality Control Divisions/
laboratories and Collectorates in five61
selected districts. Five out of 14
districts in the State were selected by adopting statistical sampling methods.
Idukki, going by the information available in the Department’s website, the
district with most number of water contaminated habitations, was selected as
the first sample and the remaining four districts were selected by applying
Probability Proportionate to Size Without Replacement (PPSWOR) sampling
method.
61 Idukki, Kollam, Kottayam, Kozhikode and Malappuram
Chapter II – Performance Audit
65
Detailed scrutiny of the records in five selected districts was conducted during
the period from April to July 2013. Information and data required were
collected by scrutiny of records in KWA and its sub-offices. An entry
conference with the Principal Secretary, Water Resources Department,
Government of Kerala was held on 27 March 2013 and audit objectives,
criteria, districts selected for detailed scrutiny, etc., were intimated in the
conference. An exit conference was conducted on 10 September 2013 with the
Additional Chief Secretary, Water Resources Department for discussing the
audit findings. The views of the department have been considered while
finalising the performance audit report.
Audit Findings
2.4.5 Planning
As per paragraph 14 of the Framework for implementation, a Comprehensive
Water Security Action Plan (CWSAP) is to be prepared for implementation in
the State. The main objective of the CWSAP is to provide a definite direction
to the programme, and also to ensure regular monitoring of the progress made
by the respective States towards the goal of achieving drinking water security
to every rural household. Under the broad goal set by each State, a five year
rolling plan is to be prepared and during each financial year, the sub-goal and
the priorities would be fixed based on mutual consultation by the Centre and
the State. In this regard, audit observed the following:
Annual Action Plans (AAP) were prepared for submission to the
Department of Drinking Water and Sanitation (DDWS), Government
of India, for allocation and release of funds. However, long-term five
year rolling plan as envisaged in the framework was not prepared.
In the AAPs, adequate priority was not given for incomplete schemes.
Out of 32 schemes verified, 20 schemes remained incomplete beyond
the stipulated date of completion.
Framework for implementation stipulates involvement of Panchayathi
Raj Institutions (PRIs), in planning and preparation of schemes. As
Village Water and Sanitation Committees did not exist, there was no
grassroot level involvement in planning and preparation of project
reports for schemes.
The Authority stated that rolling plan was not prepared. However,
programmes were implemented based on the AAP. It was also stated that strict
directions were given to all the concerned officials to take urgent steps to
complete the long pending schemes.
Absence of long-term planning and vision lead to several schemes started
years back remaining incomplete. Adequate schemes were not planned and
implemented for sustainability of sources and water quality, as discussed in
the succeeding paragraphs.
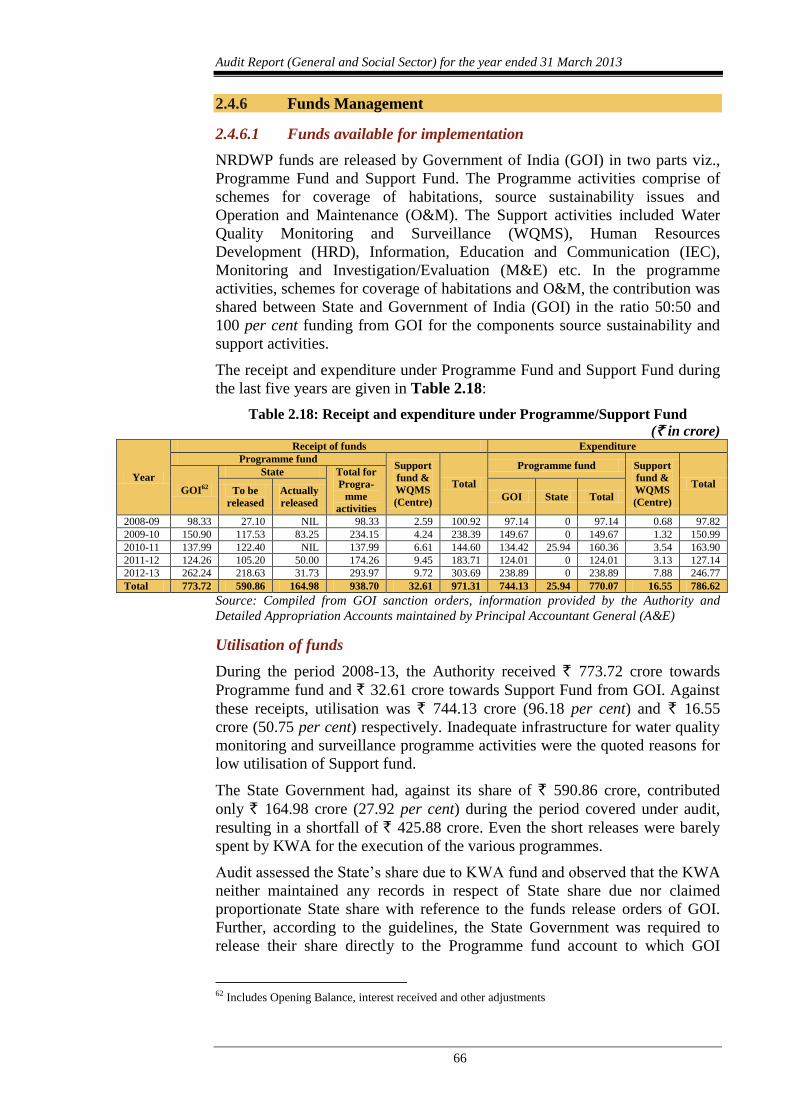
Audit Report (General and Social Sector) for the year ended 31 March 2013
66
2.4.6 Funds Management
2.4.6.1 Funds available for implementation
NRDWP funds are released by Government of India (GOI) in two parts viz.,
Programme Fund and Support Fund. The Programme activities comprise of
schemes for coverage of habitations, source sustainability issues and
Operation and Maintenance (O&M). The Support activities included Water
Quality Monitoring and Surveillance (WQMS), Human Resources
Development (HRD), Information, Education and Communication (IEC),
Monitoring and Investigation/Evaluation (M&E) etc. In the programme
activities, schemes for coverage of habitations and O&M, the contribution was
shared between State and Government of India (GOI) in the ratio 50:50 and
100 per cent funding from GOI for the components source sustainability and
support activities.
The receipt and expenditure under Programme Fund and Support Fund during
the last five years are given in Table 2.18:
Table 2.18: Receipt and expenditure under Programme/Support Fund
(` in crore)
Year
Receipt of funds Expenditure
Programme fund Support
fund &
WQMS
(Centre)
Total
Programme fund Support
fund &
WQMS
(Centre)
Total GOI62
State Total for
Progra-
mme
activities
To be
released
Actually
released GOI State Total
2008-09 98.33 27.10 NIL 98.33 2.59 100.92 97.14 0 97.14 0.68 97.82
2009-10 150.90 117.53 83.25 234.15 4.24 238.39 149.67 0 149.67 1.32 150.99
2010-11 137.99 122.40 NIL 137.99 6.61 144.60 134.42 25.94 160.36 3.54 163.90
2011-12 124.26 105.20 50.00 174.26 9.45 183.71 124.01 0 124.01 3.13 127.14
2012-13 262.24 218.63 31.73 293.97 9.72 303.69 238.89 0 238.89 7.88 246.77
Total 773.72 590.86 164.98 938.70 32.61 971.31 744.13 25.94 770.07 16.55 786.62
Source: Compiled from GOI sanction orders, information provided by the Authority and
Detailed Appropriation Accounts maintained by Principal Accountant General (A&E)
Utilisation of funds
During the period 2008-13, the Authority received ` 773.72 crore towards
Programme fund and ` 32.61 crore towards Support Fund from GOI. Against
these receipts, utilisation was ` 744.13 crore (96.18 per cent) and ` 16.55
crore (50.75 per cent) respectively. Inadequate infrastructure for water quality
monitoring and surveillance programme activities were the quoted reasons for
low utilisation of Support fund.
The State Government had, against its share of ` 590.86 crore, contributed
only ` 164.98 crore (27.92 per cent) during the period covered under audit,
resulting in a shortfall of ` 425.88 crore. Even the short releases were barely
spent by KWA for the execution of the various programmes.
Audit assessed the State’s share due to KWA fund and observed that the KWA
neither maintained any records in respect of State share due nor claimed
proportionate State share with reference to the funds release orders of GOI.
Further, according to the guidelines, the State Government was required to
release their share directly to the Programme fund account to which GOI
62 Includes Opening Balance, interest received and other adjustments
Chapter II – Performance Audit
67
released it’s share. The State Government did not follow this procedure and
the State’s share was credited in a Treasury Savings Bank account along with
other funds.
Responding to audit observations, the KWA stated that considering the State’s
investment in different rural water supply schemes like National Bank for
Agriculture and Rural Development (NABARD) assisted schemes, Japan
International Cooperation Agency (JICA) assisted schemes, etc., the State’s
share in rural water supply schemes was much more than that of the Central
share. It was also stated that this was accepted by GOI in principle. However,
the KWA did not produce any documentary evidence in support of the GOI’s
acceptance.
2.4.7 Coverage of Habitations
2.4.7.1 Habitation Survey
According to the Guidelines 2000, the norms adopted for NRDWP was
40 lpcd63
for humans. Habitations where a drinking water source/point is not
available within 1.6 kms in plains or 100 metres elevation in hilly areas or
habitations having quality affected source were categorised as ‘Not Covered
(NC)/No Safe Source (NSS) habitations’. Habitations which have a safe
drinking water source, but the capacity of the system ranges between 10 lpcd
to 40 lpcd were categorised as ‘Partially covered habitations’. All other
habitations were categorised as ‘Fully covered habitations’. With the
introduction of Framework for Implementation of NRDWP, 2010, there has
been a paradigm shift in respect of the status of coverage in the sense that the
installation of a water supply system in a habitation does not confer the
habitation ‘fully covered’ status unless every household in the habitation has
been fully covered with potable water in sufficient quantity.
At the beginning of 2008-09, 6,483 habitations were ‘Fully Covered’, 5,815
habitations were ‘Partially Covered’ and 145 habitations were ‘Not Covered’.
However, under the direction of State government, all rural habitations64
as on
31 December 2008 were treated as ‘fully covered’ considering private wells
also.
To cover rural population with individual piped water connections and for
coverage of water quality affected habitations, the KWA fixed targets for
coverage with effect from 2009-10 in accordance with the revised NRDWP
norms. The physical targets and achievements of coverage of habitations were
as given in Table 2.19.
63 litres per capita per day 64 Reassessed as 11883 in 2009-10
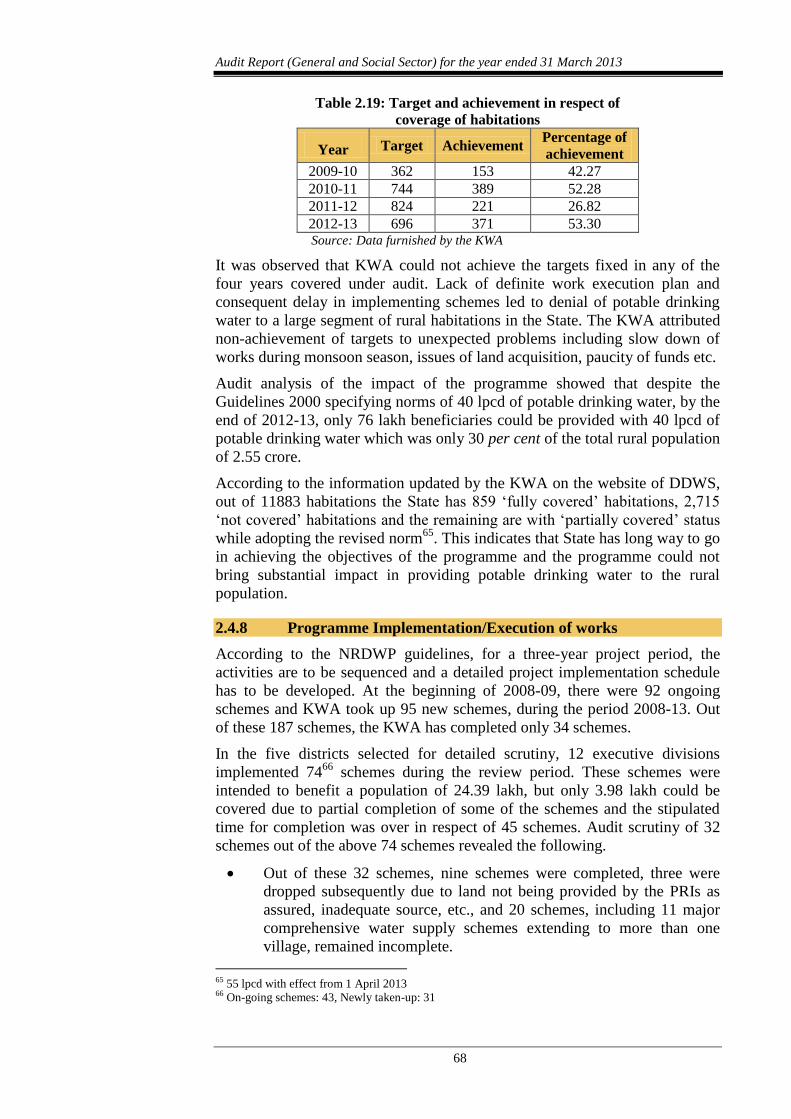
Audit Report (General and Social Sector) for the year ended 31 March 2013
68
Table 2.19: Target and achievement in respect of
coverage of habitations
Year Target Achievement Percentage of
achievement
2009-10 362 153 42.27
2010-11 744 389 52.28
2011-12 824 221 26.82
2012-13 696 371 53.30 Source: Data furnished by the KWA
It was observed that KWA could not achieve the targets fixed in any of the
four years covered under audit. Lack of definite work execution plan and
consequent delay in implementing schemes led to denial of potable drinking
water to a large segment of rural habitations in the State. The KWA attributed
non-achievement of targets to unexpected problems including slow down of
works during monsoon season, issues of land acquisition, paucity of funds etc.
Audit analysis of the impact of the programme showed that despite the
Guidelines 2000 specifying norms of 40 lpcd of potable drinking water, by the
end of 2012-13, only 76 lakh beneficiaries could be provided with 40 lpcd of
potable drinking water which was only 30 per cent of the total rural population
of 2.55 crore.
According to the information updated by the KWA on the website of DDWS,
out of 11883 habitations the State has 859 ‘fully covered’ habitations, 2,715
‘not covered’ habitations and the remaining are with ‘partially covered’ status
while adopting the revised norm65
. This indicates that State has long way to go
in achieving the objectives of the programme and the programme could not
bring substantial impact in providing potable drinking water to the rural
population.
2.4.8 Programme Implementation/Execution of works
According to the NRDWP guidelines, for a three-year project period, the
activities are to be sequenced and a detailed project implementation schedule
has to be developed. At the beginning of 2008-09, there were 92 ongoing
schemes and KWA took up 95 new schemes, during the period 2008-13. Out
of these 187 schemes, the KWA has completed only 34 schemes.
In the five districts selected for detailed scrutiny, 12 executive divisions
implemented 7466
schemes during the review period. These schemes were
intended to benefit a population of 24.39 lakh, but only 3.98 lakh could be
covered due to partial completion of some of the schemes and the stipulated
time for completion was over in respect of 45 schemes. Audit scrutiny of 32
schemes out of the above 74 schemes revealed the following.
Out of these 32 schemes, nine schemes were completed, three were
dropped subsequently due to land not being provided by the PRIs as
assured, inadequate source, etc., and 20 schemes, including 11 major
comprehensive water supply schemes extending to more than one
village, remained incomplete.
65 55 lpcd with effect from 1 April 2013 66 On-going schemes: 43, Newly taken-up: 31
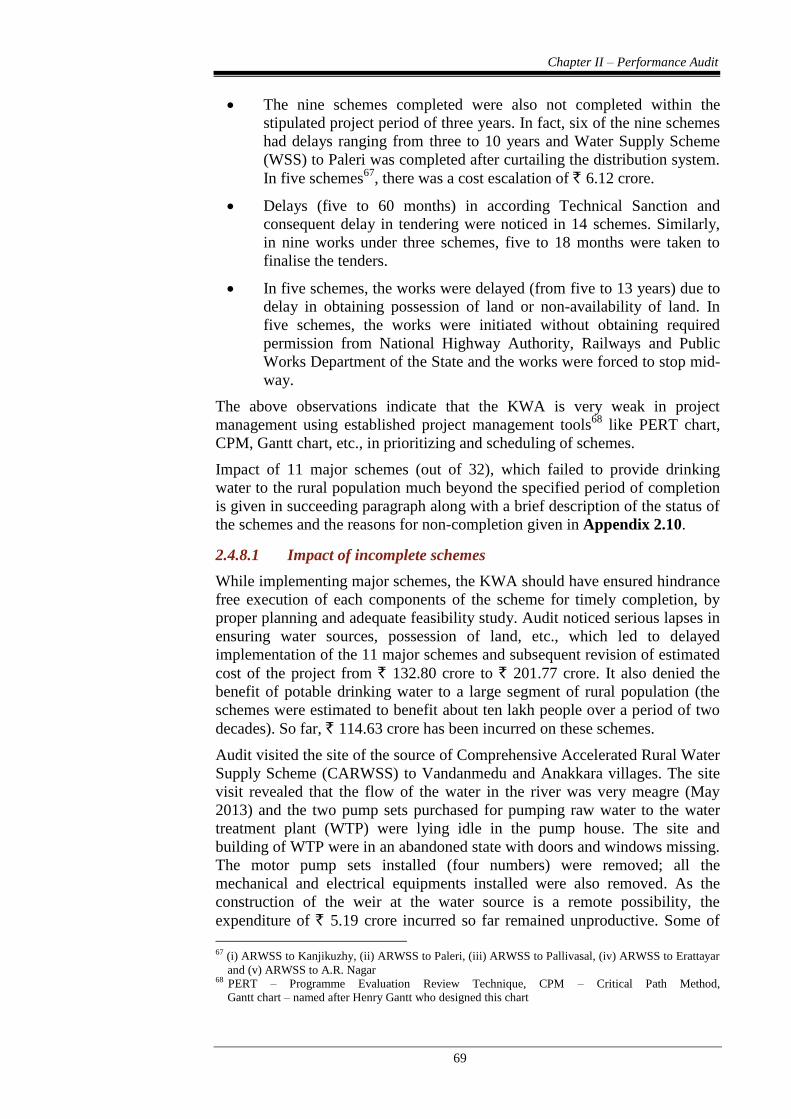
Chapter II – Performance Audit
69
The nine schemes completed were also not completed within the
stipulated project period of three years. In fact, six of the nine schemes
had delays ranging from three to 10 years and Water Supply Scheme
(WSS) to Paleri was completed after curtailing the distribution system.
In five schemes67
, there was a cost escalation of ` 6.12 crore.
Delays (five to 60 months) in according Technical Sanction and
consequent delay in tendering were noticed in 14 schemes. Similarly,
in nine works under three schemes, five to 18 months were taken to
finalise the tenders.
In five schemes, the works were delayed (from five to 13 years) due to
delay in obtaining possession of land or non-availability of land. In
five schemes, the works were initiated without obtaining required
permission from National Highway Authority, Railways and Public
Works Department of the State and the works were forced to stop mid-
way.
The above observations indicate that the KWA is very weak in project
management using established project management tools68
like PERT chart,
CPM, Gantt chart, etc., in prioritizing and scheduling of schemes.
Impact of 11 major schemes (out of 32), which failed to provide drinking
water to the rural population much beyond the specified period of completion
is given in succeeding paragraph along with a brief description of the status of
the schemes and the reasons for non-completion given in Appendix 2.10.
2.4.8.1 Impact of incomplete schemes
While implementing major schemes, the KWA should have ensured hindrance
free execution of each components of the scheme for timely completion, by
proper planning and adequate feasibility study. Audit noticed serious lapses in
ensuring water sources, possession of land, etc., which led to delayed
implementation of the 11 major schemes and subsequent revision of estimated
cost of the project from ` 132.80 crore to ` 201.77 crore. It also denied the
benefit of potable drinking water to a large segment of rural population (the
schemes were estimated to benefit about ten lakh people over a period of two
decades). So far, ` 114.63 crore has been incurred on these schemes.
Audit visited the site of the source of Comprehensive Accelerated Rural Water
Supply Scheme (CARWSS) to Vandanmedu and Anakkara villages. The site
visit revealed that the flow of the water in the river was very meagre (May
2013) and the two pump sets purchased for pumping raw water to the water
treatment plant (WTP) were lying idle in the pump house. The site and
building of WTP were in an abandoned state with doors and windows missing.
The motor pump sets installed (four numbers) were removed; all the
mechanical and electrical equipments installed were also removed. As the
construction of the weir at the water source is a remote possibility, the
expenditure of ` 5.19 crore incurred so far remained unproductive. Some of
67 (i) ARWSS to Kanjikuzhy, (ii) ARWSS to Paleri, (iii) ARWSS to Pallivasal, (iv) ARWSS to Erattayar
and (v) ARWSS to A.R. Nagar 68 PERT – Programme Evaluation Review Technique, CPM – Critical Path Method,
Gantt chart – named after Henry Gantt who designed this chart
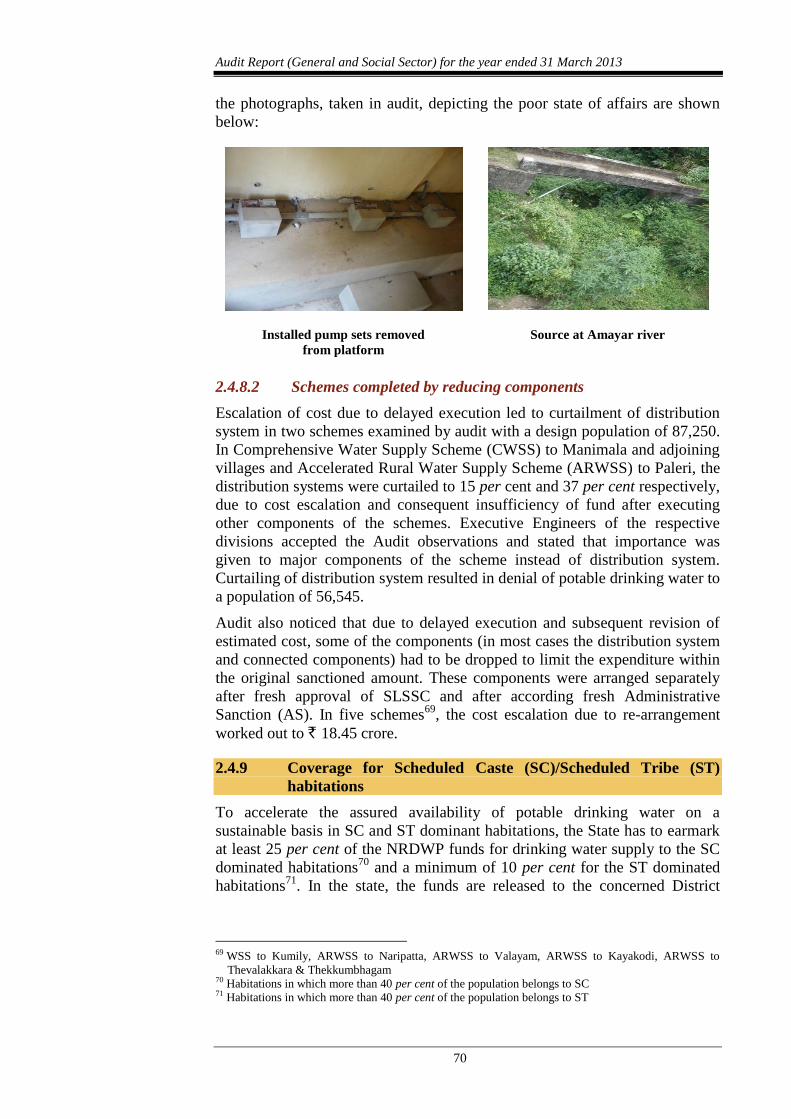
Audit Report (General and Social Sector) for the year ended 31 March 2013
70
the photographs, taken in audit, depicting the poor state of affairs are shown
below:
Installed pump sets removed
from platform
Source at Amayar river
2.4.8.2 Schemes completed by reducing components
Escalation of cost due to delayed execution led to curtailment of distribution
system in two schemes examined by audit with a design population of 87,250.
In Comprehensive Water Supply Scheme (CWSS) to Manimala and adjoining
villages and Accelerated Rural Water Supply Scheme (ARWSS) to Paleri, the
distribution systems were curtailed to 15 per cent and 37 per cent respectively,
due to cost escalation and consequent insufficiency of fund after executing
other components of the schemes. Executive Engineers of the respective
divisions accepted the Audit observations and stated that importance was
given to major components of the scheme instead of distribution system.
Curtailing of distribution system resulted in denial of potable drinking water to
a population of 56,545.
Audit also noticed that due to delayed execution and subsequent revision of
estimated cost, some of the components (in most cases the distribution system
and connected components) had to be dropped to limit the expenditure within
the original sanctioned amount. These components were arranged separately
after fresh approval of SLSSC and after according fresh Administrative
Sanction (AS). In five schemes69
, the cost escalation due to re-arrangement
worked out to ` 18.45 crore.
2.4.9 Coverage for Scheduled Caste (SC)/Scheduled Tribe (ST)
habitations
To accelerate the assured availability of potable drinking water on a
sustainable basis in SC and ST dominant habitations, the State has to earmark
at least 25 per cent of the NRDWP funds for drinking water supply to the SC
dominated habitations70
and a minimum of 10 per cent for the ST dominated
habitations71
. In the state, the funds are released to the concerned District
69 WSS to Kumily, ARWSS to Naripatta, ARWSS to Valayam, ARWSS to Kayakodi, ARWSS to
Thevalakkara & Thekkumbhagam 70 Habitations in which more than 40 per cent of the population belongs to SC 71 Habitations in which more than 40 per cent of the population belongs to ST
Chapter II – Performance Audit
71
Collectors for implementation of water supply schemes for the SC/ST
habitations.
2.4.9.1 Financial performance
Based on the release of funds for implementing NRDWP, ` 265.05 crore had
to be released for water supply schemes intended for SC/ST beneficiaries,
during 2008-13. But the KWA released only ` 90 crore to the District
Collectors for the purpose. The utilisation of funds available with the District
Collectors was poor (ranging from 40.66 per cent to 68.83 per cent) owing to
lack of schemes and other implementing agencies72
executing drinking water
supply schemes in SC/ST habitations. The under-utilisation resulted in
retention of heavy unspent balance at the end of each year, varying from
` 1.18 crore to ` 3.36 crore. Audit noticed that neither the KWA nor District
Collectors took steps to assess the requirement of drinking water supply
schemes and funds for implementing the schemes to avoid blockage/under-
utilisation of funds meant for SC/ST habitations. Non-utilisation/under-
utilisation of funds led to GOI reducing its releases in subsequent years.
Further, improper utilisation led to incurring of extra expenditure by State
Government for which GOI funds could not be obtained. Audit observations
on the above points are detailed in the succeeding paragraphs.
The special Treasury Savings Bank account of the District Collector,
Kottayam remained non-operative from November 2007 to November 2011 as
no schemes were taken up during the period. In the event of non-utilisation of
funds earmarked for implementing NRDWP under SC/ST habitations, the
funds should have been remitted back to NRDWP fund. The account was
closed in accordance with the directions of Principal Secretary, Finance
Department and the balance in the account amounting to ` 17.74 lakh was
credited to the State Government Account instead of remitting back to
NRDWP fund in violation of the guidelines.
The KWA requires utilisation certificates with statement of expenditure and
vouchers in respect of expenditure incurred by the District Collectors for funds
utilised for SC/ST habitations. In the test-checked districts, the Collectors
were not furnishing utilisation certificates with statement of expenditure and
proper vouchers. The Principal Accountant General (G&SSA), Kerala
disallowed ` 19 crore in 2008-09 and 2009-10 while certifying the accounts of
NRDWP and resulted in incurring of extra expenditure by State Government
to that extent, for which GOI funds were not obtained.
2.4.9.2 Physical performance
Out of the total 11,883 habitations identified, 201 were SC dominated and 108
were ST dominated. The district-wise number of schemes taken up for
implementation and completed was as given in Table 2.20.
72 Local Self-Government Institutions
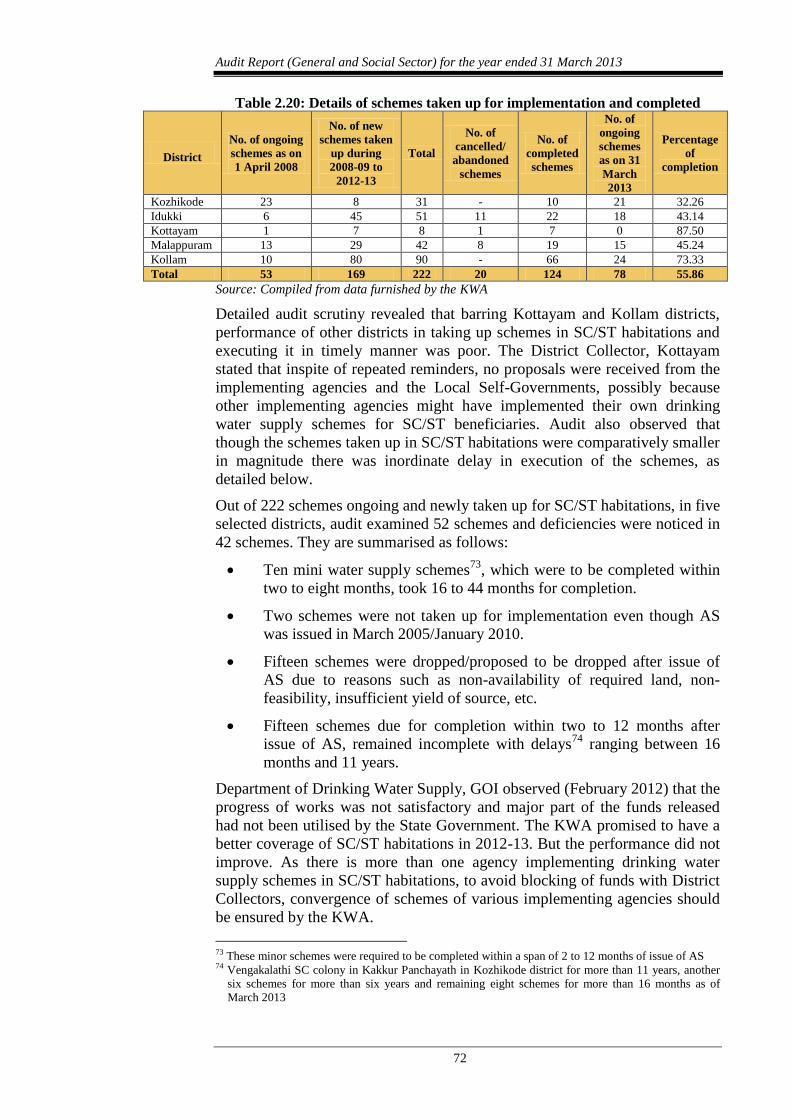
Audit Report (General and Social Sector) for the year ended 31 March 2013
72
Table 2.20: Details of schemes taken up for implementation and completed
District
No. of ongoing
schemes as on
1 April 2008
No. of new
schemes taken
up during
2008-09 to
2012-13
Total
No. of
cancelled/
abandoned
schemes
No. of
completed
schemes
No. of
ongoing
schemes
as on 31
March
2013
Percentage
of
completion
Kozhikode 23 8 31 - 10 21 32.26
Idukki 6 45 51 11 22 18 43.14
Kottayam 1 7 8 1 7 0 87.50
Malappuram 13 29 42 8 19 15 45.24
Kollam 10 80 90 - 66 24 73.33
Total 53 169 222 20 124 78 55.86
Source: Compiled from data furnished by the KWA
Detailed audit scrutiny revealed that barring Kottayam and Kollam districts,
performance of other districts in taking up schemes in SC/ST habitations and
executing it in timely manner was poor. The District Collector, Kottayam
stated that inspite of repeated reminders, no proposals were received from the
implementing agencies and the Local Self-Governments, possibly because
other implementing agencies might have implemented their own drinking
water supply schemes for SC/ST beneficiaries. Audit also observed that
though the schemes taken up in SC/ST habitations were comparatively smaller
in magnitude there was inordinate delay in execution of the schemes, as
detailed below.
Out of 222 schemes ongoing and newly taken up for SC/ST habitations, in five
selected districts, audit examined 52 schemes and deficiencies were noticed in
42 schemes. They are summarised as follows:
Ten mini water supply schemes73
, which were to be completed within
two to eight months, took 16 to 44 months for completion.
Two schemes were not taken up for implementation even though AS
was issued in March 2005/January 2010.
Fifteen schemes were dropped/proposed to be dropped after issue of
AS due to reasons such as non-availability of required land, non-
feasibility, insufficient yield of source, etc.
Fifteen schemes due for completion within two to 12 months after
issue of AS, remained incomplete with delays74
ranging between 16
months and 11 years.
Department of Drinking Water Supply, GOI observed (February 2012) that the
progress of works was not satisfactory and major part of the funds released
had not been utilised by the State Government. The KWA promised to have a
better coverage of SC/ST habitations in 2012-13. But the performance did not
improve. As there is more than one agency implementing drinking water
supply schemes in SC/ST habitations, to avoid blocking of funds with District
Collectors, convergence of schemes of various implementing agencies should
be ensured by the KWA.
73 These minor schemes were required to be completed within a span of 2 to 12 months of issue of AS 74 Vengakalathi SC colony in Kakkur Panchayath in Kozhikode district for more than 11 years, another
six schemes for more than six years and remaining eight schemes for more than 16 months as of
March 2013
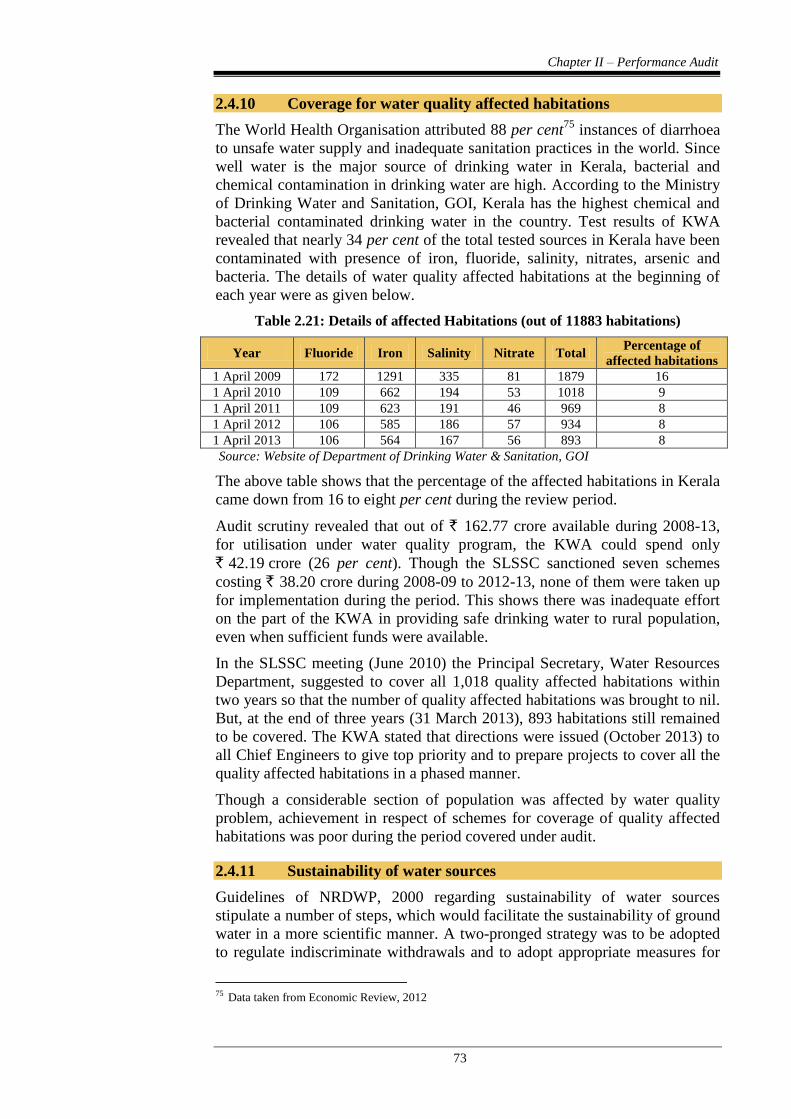
Chapter II – Performance Audit
73
2.4.10 Coverage for water quality affected habitations
The World Health Organisation attributed 88 per cent75
instances of diarrhoea
to unsafe water supply and inadequate sanitation practices in the world. Since
well water is the major source of drinking water in Kerala, bacterial and
chemical contamination in drinking water are high. According to the Ministry
of Drinking Water and Sanitation, GOI, Kerala has the highest chemical and
bacterial contaminated drinking water in the country. Test results of KWA
revealed that nearly 34 per cent of the total tested sources in Kerala have been
contaminated with presence of iron, fluoride, salinity, nitrates, arsenic and
bacteria. The details of water quality affected habitations at the beginning of
each year were as given below.
Table 2.21: Details of affected Habitations (out of 11883 habitations)
Year Fluoride Iron Salinity Nitrate Total Percentage of
affected habitations
1 April 2009 172 1291 335 81 1879 16
1 April 2010 109 662 194 53 1018 9
1 April 2011 109 623 191 46 969 8
1 April 2012 106 585 186 57 934 8
1 April 2013 106 564 167 56 893 8
Source: Website of Department of Drinking Water & Sanitation, GOI
The above table shows that the percentage of the affected habitations in Kerala
came down from 16 to eight per cent during the review period.
Audit scrutiny revealed that out of ` 162.77 crore available during 2008-13,
for utilisation under water quality program, the KWA could spend only
` 42.19 crore (26 per cent). Though the SLSSC sanctioned seven schemes
costing ` 38.20 crore during 2008-09 to 2012-13, none of them were taken up
for implementation during the period. This shows there was inadequate effort
on the part of the KWA in providing safe drinking water to rural population,
even when sufficient funds were available.
In the SLSSC meeting (June 2010) the Principal Secretary, Water Resources
Department, suggested to cover all 1,018 quality affected habitations within
two years so that the number of quality affected habitations was brought to nil.
But, at the end of three years (31 March 2013), 893 habitations still remained
to be covered. The KWA stated that directions were issued (October 2013) to
all Chief Engineers to give top priority and to prepare projects to cover all the
quality affected habitations in a phased manner.
Though a considerable section of population was affected by water quality
problem, achievement in respect of schemes for coverage of quality affected
habitations was poor during the period covered under audit.
2.4.11 Sustainability of water sources
Guidelines of NRDWP, 2000 regarding sustainability of water sources
stipulate a number of steps, which would facilitate the sustainability of ground
water in a more scientific manner. A two-pronged strategy was to be adopted
to regulate indiscriminate withdrawals and to adopt appropriate measures for
75 Data taken from Economic Review, 2012
Audit Report (General and Social Sector) for the year ended 31 March 2013
74
augmenting its recharge through spreading techniques in alluvial areas, check-
dams and percolation tanks, nalla bunding, contour bunding, contour trench,
surface-channels etc. Besides, direct injection methods utilising the abandoned
structures available in large numbers in the hard rock region were prescribed.
According to the guidelines 20 per cent of the NRDWP funds need to be
utilised for source sustainability activities. Audit observed that against the
released fund of ` 89.92 crore, only ` 24.16 crore (27 per cent) was utilised
during the period covered under audit. Audit further noticed that:
Though 20 schemes were sanctioned by the SLSSC during the period
2008-13, only four schemes were taken up and completed in the State.
No schemes were taken up for infiltration rings, recharge pits,
percolation tanks, injection wells etc., during the five year period.
In the test-checked districts, no schemes for sustainability of sources
were taken up during the period 2008-13.
The KWA stated that the works related to ground water recharge were being
carried out by Ground Water Department.
As the physical and financial performance was poor, the DDWS observed that
the KWA Engineers, in general, did not have adequate capacity to understand
and design sustainability structures. Further the Hydro-Geo-Morphological
(HGM) maps already available with the State Ground Water Department were
not being used. DDWS also recommended (October 2011) immediate two day
training programme for about 30 Engineers on usage of HGM maps. However,
the KWA did not furnish the details of training, if imparted.
In the light of above remarks of DDWS, the KWA transferred ` 5.00 crore
(out of the total provision of ` 8.08 crore in 2012-13) to Kerala Rural Water
and Sanitation Agency76
(KRWSA) for carrying out source sustainability
activities. The KWA stated that based on objection from GOI, KRWSA was
requested to refund the unspent balance for works for which AS were not
issued and to submit Utilisation Certificates for works carried out. Audit
observed that the details of schemes implemented and expenditure incurred by
KRWSA were not available with the KWA. As sanctioned schemes were not
taken up for source sustainability, water security in the various sources could
not be ensured.
2.4.12 Water Quality Monitoring and Surveillance
The National Water Quality Monitoring & Surveillance Programme
(WQM&SP) launched in February 2005 was merged with NRDWP and
modified to be implemented with effect from 1 April 2009 with
institutionalisation of community participation in the programme.
2.4.12.1 Setting up of laboratories
Water quality surveillance requires strong and effective organisational
framework for assessing the safety and accessibility of water supplied to the
people. Laboratories are to be set up at three levels-a nodal unit at the top
76 Agency entrusted with implementation of rain water harvesting programme
Chapter II – Performance Audit
75
level, intermediary level units like district laboratories and grassroot level
units. The Manual (Implementation Manual on WQM&SP) stipulates that the
surveillance agency may be separate from the water supply agency;
alternatively there may be two separate wings of the rural water supply
department. There are 14 district laboratories in the state. State Referral
Institute (SRI) established at Ernakulum (February 2009) acts as the nodal unit
in the state. Audit observed that:
Mandatory accreditation from ‘National Accreditation Board for
testing and calibration Laboratories’ (NABL)/appropriate agency of
GOI required for SRI, has not been obtained till date (July 2013), as no
steps in this regard were initiated by the KWA.
Though SRI was formed with statewide jurisdiction, it had the
administrative control of only two77
district laboratories and all other
districts laboratories were under the administrative control of three
quality control divisions78
of the KWA. Hence, the performance of
only two district laboratories was monitored and reported to this
institute. This system not only defeated the uniformity in functioning
of the laboratories but also violated the Manual provisions. Besides,
certain kind of surveillance and tests like analysis of heavy metal, toxic
elements, pesticides, etc., were available only in SRI and hence the
programme suffered as comprehensive assessment of water quality was
not available at the district laboratories.
Under NRDWP, the State has to establish water testing laboratories at
sub-divisional level to carry out the enormous task of water quality
monitoring by checking one sample per 200 people. Out of the 16 sub-
divisional laboratories formed in the State, 15 of them were attached to
district laboratories using the same premises and manpower and no
separate infrastructure and technical facilities were created.
With the existing 30 laboratories at district and sub-divisional level, at the rate
of 3,000 samples per laboratory, only 30 per cent of 2,97,121 representative
sources (December 2013) could be covered annually. Executive Engineer,
Quality control Division, Kozhikode stated that the present facility was not
sufficient and setting up of 11 additional sub-divisional laboratories under the
Divisions was proposed.
2.4.12.2 Water quality testing
As per the norms stipulated in the Framework for Implementation of NRDWP
Guidelines, all drinking water sources should be tested at least twice in a year
for bacteriological contamination and once in a year for chemical
contamination. District laboratories have to test at least 30 per cent of water
samples tested at Grama Panchayath (GP) level and all cases where
possibilities of contamination were reported by the community. Ten per cent
of all samples including all positively tested samples tested by district
laboratories are to be confirmed at state level. In this regard, audit observed as
under.
77 Ernakulam and Idukki 78 Ernakulam, Kozhikode and Thiruvananthapuram
Audit Report (General and Social Sector) for the year ended 31 March 2013
76
One time testing of all the sources in the state was not completed even
during the five year period. Out of 2,97,121 sources, 1,15,716
(39 per cent) sources could be tested so far (December 2013). Of these,
27,052 sources were found chemically contaminated and 36,135
sources bacteriologically contaminated.
The district laboratories did not check any sample at GP level by using
Field Test Kits (FTKs) against at least 30 per cent to be done by them
for confirmation and no samples were referred to SRI by district
laboratories. Thus, cross checking of water quality was not done at any
level.
2.4.12.3 Water Safety Plan and Sanitary Survey
Water safety plan prescribed by the Framework for Implementation of
NRDWP guidelines links identification of water quality problem with a water
safety solution. It includes both water quality testing and also sanitary
inspection to determine appropriate control measures. For the successful
implementation of WQM&SP, data generated through monitoring shall be
linked with mitigatory/preventive measures and rechecking of the quality after
taking preventive action. Surveillance requires a continuous and systematic
programme of sanitary inspection and water quality testing. Sanitary survey
should be carried out once in a year for all the drinking water sources in the
state. Sanitary inspections are intended to provide a range of information and
locate potential problems.
Under Nirmal Bharath Abhiyan, the State had achieved 100 per cent against
the target of providing individual household latrines (IHHL) under BPL/APL
households, schools and anganwadis. Inspite of this good performance,
presence of E-Coli and Coli form bacteria was found in most of the water
sources tested for biological contamination, due to high density of septic
tanks/latrine pits and drinking water sources. Out of the 28985 sources tested
in 2012-13, E-Coli and Coli form contamination was found in 5145 and 19156
sources respectively.
Sanitary survey as envisaged in the Guidelines for National Rural Drinking
Water Quality Monitoring & Surveillance Programme, 2006 was not
conducted so far and this adversely affected the preparation of the Water
Safety Plan and exposed the population to biological contamination.
2.4.12.4 Field Test Kits
In the State, Communication and Capacity Development Unit (CCDU) under
the Water Resources Department conducts water quality monitoring using
Field Test Kits (FTKs). The main objective of the FTKs was to obtain a
preliminary report on quality of water with basic chemical and bacteriological
parameters. The guidelines envisaged financial sustainability through full cost
recovery of operation and maintenance of FTKs by community contribution at
Rupee one per family per month. The amount so collected was to be deposited
in the account of the Village Water and Sanitation Committee (VWSC). Audit
observed that VWSCs were not constituted in any of the GPs in the State
defeating the objective of community participation. The target and
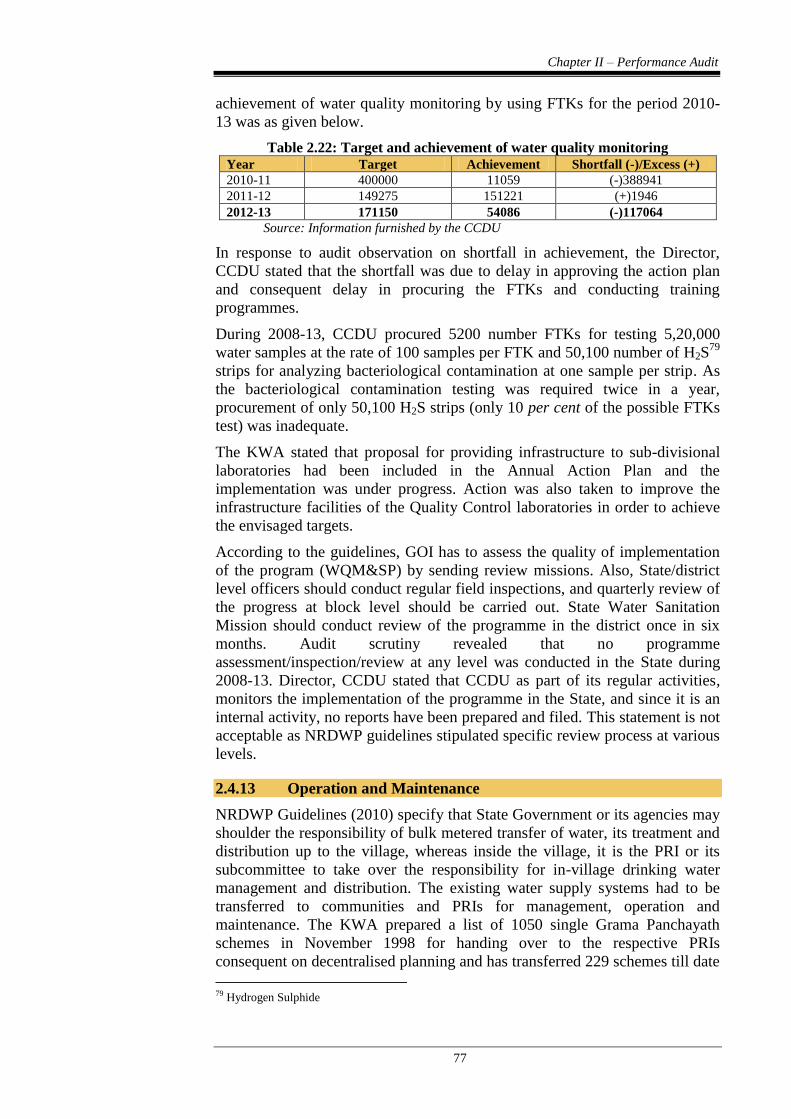
Chapter II – Performance Audit
77
achievement of water quality monitoring by using FTKs for the period 2010-
13 was as given below.
Table 2.22: Target and achievement of water quality monitoring Year Target Achievement Shortfall (-)/Excess (+)
2010-11 400000 11059 (-)388941
2011-12 149275 151221 (+)1946
2012-13 171150 54086 (-)117064
Source: Information furnished by the CCDU
In response to audit observation on shortfall in achievement, the Director,
CCDU stated that the shortfall was due to delay in approving the action plan
and consequent delay in procuring the FTKs and conducting training
programmes.
During 2008-13, CCDU procured 5200 number FTKs for testing 5,20,000
water samples at the rate of 100 samples per FTK and 50,100 number of H2S79
strips for analyzing bacteriological contamination at one sample per strip. As
the bacteriological contamination testing was required twice in a year,
procurement of only 50,100 H2S strips (only 10 per cent of the possible FTKs
test) was inadequate.
The KWA stated that proposal for providing infrastructure to sub-divisional
laboratories had been included in the Annual Action Plan and the
implementation was under progress. Action was also taken to improve the
infrastructure facilities of the Quality Control laboratories in order to achieve
the envisaged targets.
According to the guidelines, GOI has to assess the quality of implementation
of the program (WQM&SP) by sending review missions. Also, State/district
level officers should conduct regular field inspections, and quarterly review of
the progress at block level should be carried out. State Water Sanitation
Mission should conduct review of the programme in the district once in six
months. Audit scrutiny revealed that no programme
assessment/inspection/review at any level was conducted in the State during
2008-13. Director, CCDU stated that CCDU as part of its regular activities,
monitors the implementation of the programme in the State, and since it is an
internal activity, no reports have been prepared and filed. This statement is not
acceptable as NRDWP guidelines stipulated specific review process at various
levels.
2.4.13 Operation and Maintenance
NRDWP Guidelines (2010) specify that State Government or its agencies may
shoulder the responsibility of bulk metered transfer of water, its treatment and
distribution up to the village, whereas inside the village, it is the PRI or its
subcommittee to take over the responsibility for in-village drinking water
management and distribution. The existing water supply systems had to be
transferred to communities and PRIs for management, operation and
maintenance. The KWA prepared a list of 1050 single Grama Panchayath
schemes in November 1998 for handing over to the respective PRIs
consequent on decentralised planning and has transferred 229 schemes till date
79 Hydrogen Sulphide
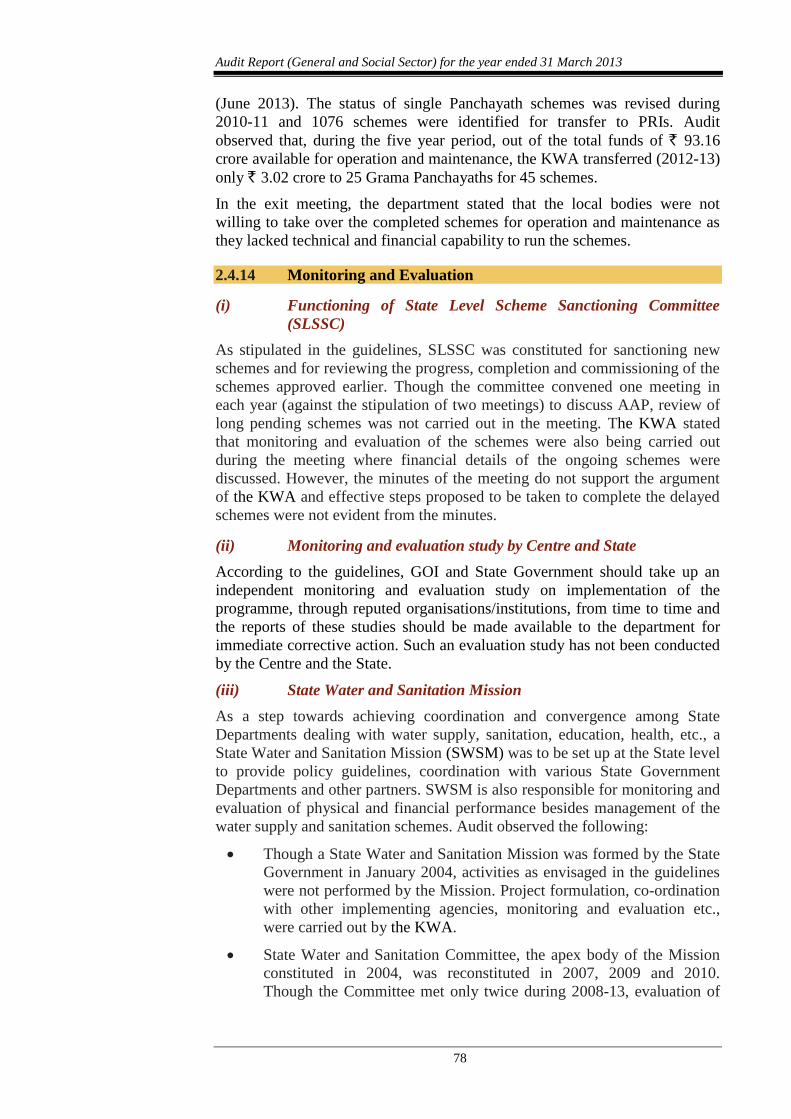
Audit Report (General and Social Sector) for the year ended 31 March 2013
78
(June 2013). The status of single Panchayath schemes was revised during
2010-11 and 1076 schemes were identified for transfer to PRIs. Audit
observed that, during the five year period, out of the total funds of ` 93.16
crore available for operation and maintenance, the KWA transferred (2012-13)
only ` 3.02 crore to 25 Grama Panchayaths for 45 schemes.
In the exit meeting, the department stated that the local bodies were not
willing to take over the completed schemes for operation and maintenance as
they lacked technical and financial capability to run the schemes.
2.4.14 Monitoring and Evaluation
(i) Functioning of State Level Scheme Sanctioning Committee
(SLSSC)
As stipulated in the guidelines, SLSSC was constituted for sanctioning new
schemes and for reviewing the progress, completion and commissioning of the
schemes approved earlier. Though the committee convened one meeting in
each year (against the stipulation of two meetings) to discuss AAP, review of
long pending schemes was not carried out in the meeting. The KWA stated
that monitoring and evaluation of the schemes were also being carried out
during the meeting where financial details of the ongoing schemes were
discussed. However, the minutes of the meeting do not support the argument
of the KWA and effective steps proposed to be taken to complete the delayed
schemes were not evident from the minutes.
(ii) Monitoring and evaluation study by Centre and State
According to the guidelines, GOI and State Government should take up an
independent monitoring and evaluation study on implementation of the
programme, through reputed organisations/institutions, from time to time and
the reports of these studies should be made available to the department for
immediate corrective action. Such an evaluation study has not been conducted
by the Centre and the State.
(iii) State Water and Sanitation Mission
As a step towards achieving coordination and convergence among State
Departments dealing with water supply, sanitation, education, health, etc., a
State Water and Sanitation Mission (SWSM) was to be set up at the State level
to provide policy guidelines, coordination with various State Government
Departments and other partners. SWSM is also responsible for monitoring and
evaluation of physical and financial performance besides management of the
water supply and sanitation schemes. Audit observed the following:
Though a State Water and Sanitation Mission was formed by the State
Government in January 2004, activities as envisaged in the guidelines
were not performed by the Mission. Project formulation, co-ordination
with other implementing agencies, monitoring and evaluation etc.,
were carried out by the KWA.
State Water and Sanitation Committee, the apex body of the Mission
constituted in 2004, was reconstituted in 2007, 2009 and 2010.
Though the Committee met only twice during 2008-13, evaluation of
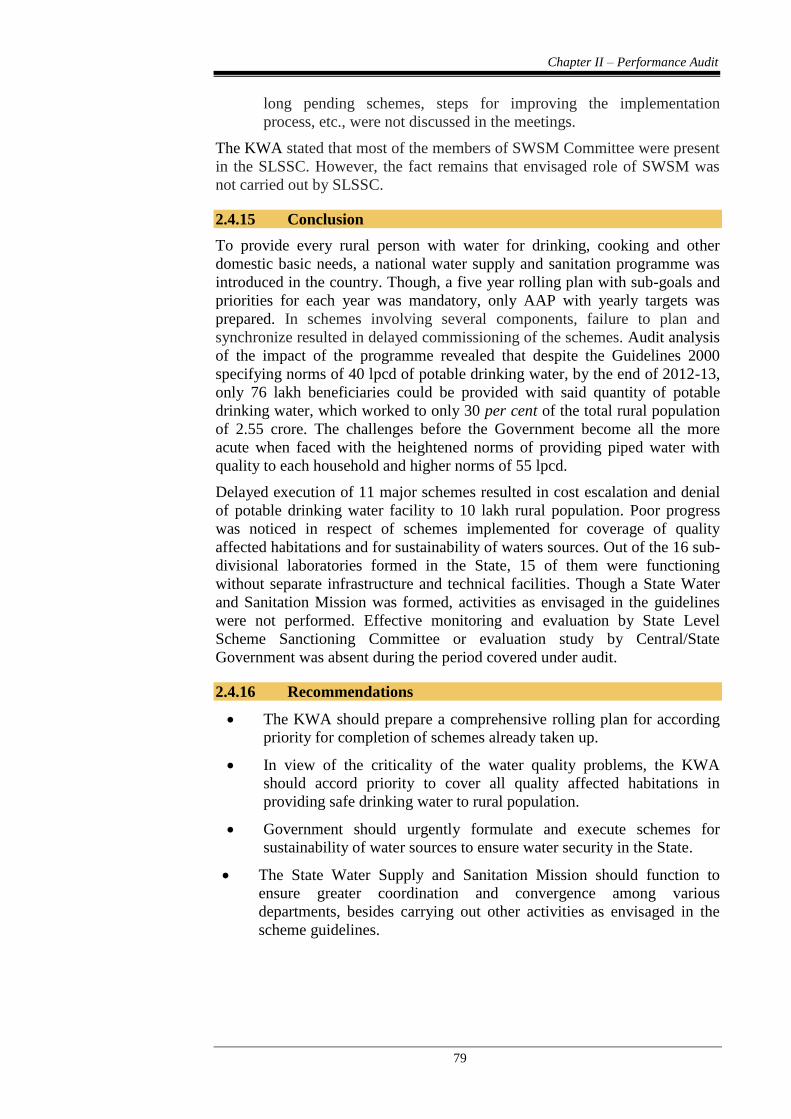
Chapter II – Performance Audit
79
long pending schemes, steps for improving the implementation
process, etc., were not discussed in the meetings.
The KWA stated that most of the members of SWSM Committee were present
in the SLSSC. However, the fact remains that envisaged role of SWSM was
not carried out by SLSSC.
2.4.15 Conclusion
To provide every rural person with water for drinking, cooking and other
domestic basic needs, a national water supply and sanitation programme was
introduced in the country. Though, a five year rolling plan with sub-goals and
priorities for each year was mandatory, only AAP with yearly targets was
prepared. In schemes involving several components, failure to plan and
synchronize resulted in delayed commissioning of the schemes. Audit analysis
of the impact of the programme revealed that despite the Guidelines 2000
specifying norms of 40 lpcd of potable drinking water, by the end of 2012-13,
only 76 lakh beneficiaries could be provided with said quantity of potable
drinking water, which worked to only 30 per cent of the total rural population
of 2.55 crore. The challenges before the Government become all the more
acute when faced with the heightened norms of providing piped water with
quality to each household and higher norms of 55 lpcd.
Delayed execution of 11 major schemes resulted in cost escalation and denial
of potable drinking water facility to 10 lakh rural population. Poor progress
was noticed in respect of schemes implemented for coverage of quality
affected habitations and for sustainability of waters sources. Out of the 16 sub-
divisional laboratories formed in the State, 15 of them were functioning
without separate infrastructure and technical facilities. Though a State Water
and Sanitation Mission was formed, activities as envisaged in the guidelines
were not performed. Effective monitoring and evaluation by State Level
Scheme Sanctioning Committee or evaluation study by Central/State
Government was absent during the period covered under audit.
2.4.16 Recommendations
The KWA should prepare a comprehensive rolling plan for according
priority for completion of schemes already taken up.
In view of the criticality of the water quality problems, the KWA
should accord priority to cover all quality affected habitations in
providing safe drinking water to rural population.
Government should urgently formulate and execute schemes for
sustainability of water sources to ensure water security in the State.
The State Water Supply and Sanitation Mission should function to
ensure greater coordination and convergence among various
departments, besides carrying out other activities as envisaged in the
scheme guidelines.