Chapter II: How Washington Pays for Higher Education · Chapter II: How Washington Pays for Higher...
18
Chapter II: How Washington Pays for Higher Education
Transcript of Chapter II: How Washington Pays for Higher Education · Chapter II: How Washington Pays for Higher...

Chapter II: How Washington Pays
for Higher Education


Chapter II: How Washington Pays for Higher Education
Key Facts about Higher Education in Washington Page | 11
Continued revenue shortfall further reduces budget for public higher education Declines in state tax revenue, the result of ongoing consumer uncertainty over the national economy and various global concerns, continue to cause serious financial repercussions for Washington’s public colleges and universities.
To help balance the budget, lawmakers in 2011 further reduced funding for higher education — the state’s largest source of discretionary spending. To partially offset the impact, they gave baccalaureate institutions significantly expanded authority to raise tuition, putting more of the cost of a college education on students and their families.
After a new projected revenue drop in fall 2011, the Governor proposed additional budget cuts for institutions ranging from 13 to 17 percent. The Governor also proposed a temporary increase in the state sales tax to “buy back” those reductions and cuts in other high priority state services. These issues will be addressed during the 2012 Legislative Session.
The chart below shows how much money is needed to keep institutions operating at their 2009-11 levels, and how much below those maintenance levels the current 2011-13 operating budget is. It shows that the budgets at research and comprehensive institutions are now 46 percent below maintenance level; community and technical colleges are 26 percent below.
Institutions have offset some of the revenue losses by raising tuition. Other steps have included implementing various efficiencies, eliminating academic programs, increasing class sizes, reducing staff and cutting student support services.
2011-13 State Funding Reductions for Public Higher Education Institutions from Maintenance Level, by Sector
Near General Fund-State, Dollars in Millions, First Phase 2012 Supplemental Operating Budget
Source: HECB staff analysis of data from Office of Financial Management Budget Allocation and Support System.

Chapter II: How Washington Pays for Higher Education
Key Facts about Higher Education in Washington Page | 12
Current operating budget below level needed to maintain services in last biennium The State General Fund and student tuition provide the bulk of the money in the state operating budget for public higher education. The General Fund includes revenues from the state sales tax, business and occupation tax, property tax, and other excise taxes. Other revenue sources for higher education include grants and contracts, dedicated local revenues, and the University of Washington hospital.
The state’s total 2011-13 operating budget of $61.4 billion, which includes adjustments made during the December 2011 special legislative session, provides $11.1 billion for public colleges and universities, or about 18.1 percent of the total budget. That left Washington’s public higher education institutions $1.26 billion below “maintenance level.”
Maintenance level is the amount of funding needed by public institutions to deliver the same level of services they did in the previous biennium. A maintenance-level budget includes cost increases over which the institutions have no control, such as negotiated wage and benefit agreements, inflation in the cost of goods and services, and increased energy costs.
Washington State 2011-13 Operating Budget, All Fund Sources, First Phase 2012 Supplemental
Total: $61.4 billion
Note: Spokane Intercollegiate Research and Technical Institute is included in "All Other," and not "Higher Education."
Source: HECB staff analysis of data from Washington State Fiscal Information. Retrieved from fiscal.wa.gov, 12/15/11.

Chapter II: How Washington Pays for Higher Education
Key Facts about Higher Education in Washington Page | 13
The state’s contribution: A look at the near general fund Higher education budget discussions often refer to the Near General Fund, which includes money from the General Fund, Education Legacy Trust Account (cigarette and estate taxes earmarked for education) and other sources.
The $31.9 billion Near General Fund provides approximately $2.8 billion for higher education in the 2011-13 biennium. This constitutes about 8.6 percent of Near General Fund revenues. The K-12 public school system accounts for the largest percentage of Near General Fund spending.
Washington State 2011-13 Near General Fund-State and
Opportunity Pathways Account, First Phase 2012 Supplemental Total: $31.9 billion
Source: HECB staff analysis of data from Washington State Fiscal Information. Retrieved from fiscal.wa.gov, 12/15/11.

Chapter II: How Washington Pays for Higher Education
Key Facts about Higher Education in Washington Page | 14
How near general fund money for higher education is distributed The $2.8 billion in Near General Fund revenues for higher education in the 2009-11 biennium were distributed as follows:
$ 1.2 billion for Community and Technical Colleges $ 426 million for the University of Washington $ 614 million for student financial aid $ 304 million for Washington State University $ 81 million for Western Washington University $ 69 million for Eastern Washington University $ 64 million for Central Washington University $ 36 million for The Evergreen State College $ 2 million for the Higher Education Coordinating Board
Washington State 2011-13 Higher Education Operating Budget Near General Fund-State and Opportunity Pathways, First Phase 2012 Supplemental
Total: $2.8 billion
Source: HECB staff analysis of data from Washington State Fiscal Information. Retrieved from fiscal.wa.gov, 12/15/11.
Chapter II: How Washington Pays for Higher Education
Key Facts about Higher Education in Washington Page | 15
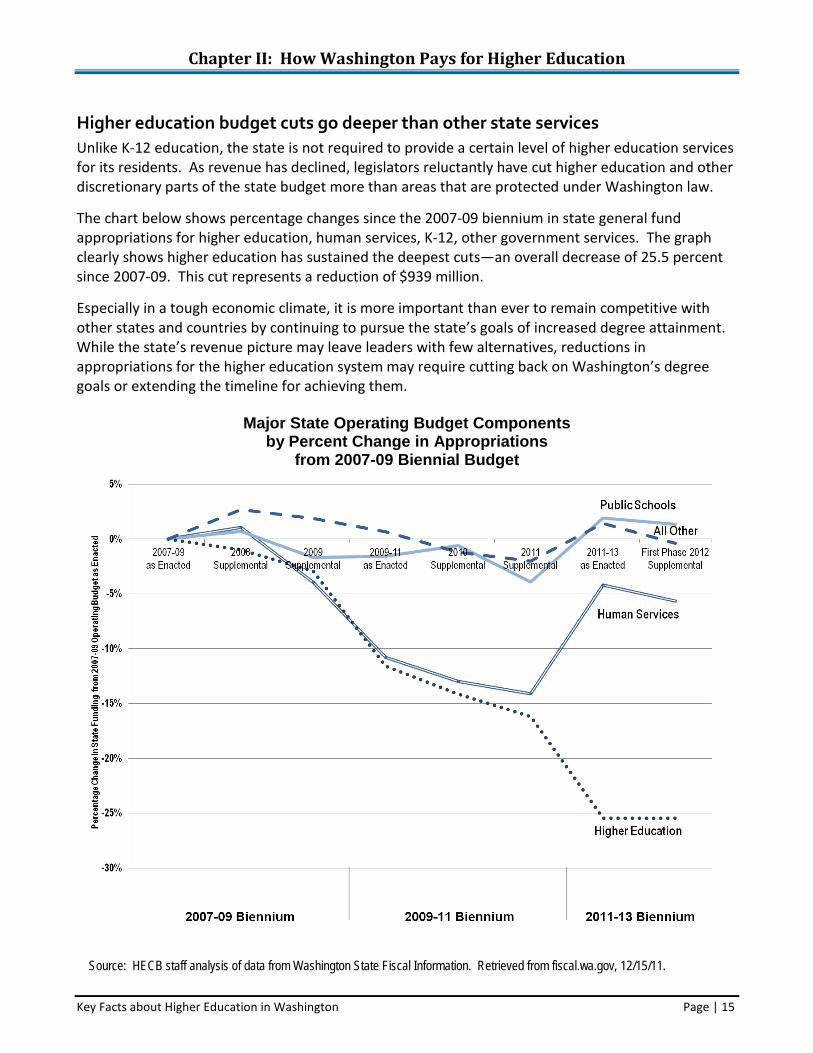
Higher education budget cuts go deeper than other state services Unlike K-12 education, the state is not required to provide a certain level of higher education services for its residents. As revenue has declined, legislators reluctantly have cut higher education and other discretionary parts of the state budget more than areas that are protected under Washington law.
The chart below shows percentage changes since the 2007-09 biennium in state general fund appropriations for higher education, human services, K-12, other government services. The graph clearly shows higher education has sustained the deepest cuts—an overall decrease of 25.5 percent since 2007-09. This cut represents a reduction of $939 million.
Especially in a tough economic climate, it is more important than ever to remain competitive with other states and countries by continuing to pursue the state’s goals of increased degree attainment. While the state’s revenue picture may leave leaders with few alternatives, reductions in appropriations for the higher education system may require cutting back on Washington’s degree goals or extending the timeline for achieving them.
Major State Operating Budget Components
by Percent Change in Appropriations from 2007-09 Biennial Budget
Source: HECB staff analysis of data from Washington State Fiscal Information. Retrieved from fiscal.wa.gov, 12/15/11.

Chapter II: How Washington Pays for Higher Education
Key Facts about Higher Education in Washington Page | 16
Per-student FTE support has dropped significantly at public baccalaureates One measure of the level of state support for public higher education institutions is the amount appropriated per budgeted student FTE. Over the past decade, per-student FTE support has remained fairly stable at community and technical colleges, but has declined significantly at baccalaureate institutions.
Between 2000 and the 2013 fiscal year, per-student FTE appropriations: • Declined 17 percent overall at community and technical colleges. This represents a decline of
approximately 1.2 percent per year. • Dropped 47 percent overall at the comprehensive institutions (CWU, EWU, TESC, and WWU)
– an average decline of about 3.4 percent per year. • Dropped 49 percent at the state’s two research institutions (UW and WSU) – an average
decline of 3.5 percent per year.
Calculated in 2013 dollars, the chart below shows the level of support per state-funded student FTE in each sector between 2000 and 2013. Institutions frequently enroll more students than budgeted, so FTE figures are usually lower than headcounts. The chart reflects appropriations in the final supplemental biennial budgets, except for FY 2012 and FY 2013, which reflect the First Phase 2012 Supplemental 2011-13 Operating Budget. Running Start enrollments are not reflected in community and technical college budgeted FTE enrollments.
Near General Fund-State Operating Appropriations per Budgeted Student FTE
for Washington Public Higher Education Institutions by Sector
Sources: For Appropriation Data: Office of Financial Management Budget Allocation and Support System. For Budgeted Student FTE Data: Legislative Evaluation and Accountability Program (LEAP) Committee Legislative Budget Notes.

Chapter II: How Washington Pays for Higher Education
Key Facts about Higher Education in Washington Page | 17
Differing roles influence amounts institutions receive from non-state sources The differing missions of Washington’s higher education institutions are reflected in the revenue they receive from funding sources other than tuition and state appropriations. For example, faculty at the University of Washington and Washington State University are more engaged in research than the state’s other public baccalaureate institutions or its community and technical colleges. The latter are primarily engaged in teaching. As a result, the two research institutions receive more money from research grants and contracts. In addition, the UW has the unique mission in this state of operating a university hospital, which generated $1.5 billion in the 2009-11 biennium.
Public Higher Education Institution Funding Sources by Sector, 2009-11
Community & Technical Colleges Total: $2.2 billion
Research Institutions Total: $7.3 billion
Comprehensive Institutions Total: $1 billion
Note: Revenue is measured as the expenditure from a given funding source during the 2009-11 biennium.
Source: HECB staff analysis of data from Washington State Fiscal Information. Retrieved from fiscal.wa.gov, 11/9/11.

Chapter II: How Washington Pays for Higher Education
Key Facts about Higher Education in Washington Page | 18
Providing educational system infrastructure Over the decades, Washington has invested heavily in the classrooms, research facilities, administrative offices, and support structures that constitute the brick and mortar of its public colleges and universities. These structures account for more than half of the state’s physical plant.
The state provides three kinds of facility support: 1) building maintenance; 2) repair and renovation; and 3) expanded capacity to meet increased levels of enrollment. Operating budget funds are earmarked for repair and renovation, and capital funds are used to support new construction.
Since 1997, about 70 percent of all higher education capital appropriations have come from borrowing through the sale of general obligation bonds. The remaining 30 percent come from local, dedicated sources.
Because state law limits the amount of state debt incurred through general obligation bonds, institutional requests for new capital construction must be prioritized on a biennial basis. Institutions submit capital budget proposals to the Office of Financial Management, which creates a prioritized list that is sent to the Higher Education Coordinating Board. The Board then makes funding recommendations based on the OFM list and sends them to OFM and the Legislature.
Capital spending, on the rise since 1997, has fallen sharply in the current and previous biennia due to the recession and the absence of Gardner-Evans Bonds, which helped finance facility preservation projects. Authority to issue Gardner-Evans Bonds ended in 2009.
Higher Education Capital Appropriations by Source IPD Adjusted Constant 2011-2013 Dollars in Millions
Note: Data reflects new appropriations only. Does not include alternative finance projects. Sources: Capital Appropriations Data: HECB analysis of data from Washington State Fiscal Information. Retrieved from fiscal.wa.gov, 12/15/11. Biennial IPD Adjustments: Legislative Evaluation and Accountability Program (LEAP) Committee, Economic Forecast Data.

Chapter II: How Washington Pays for Higher Education
Key Facts about Higher Education in Washington Page | 19
What students pay: It’s more than just tuition Statutory tuition consists of two components:
• Operating Fees: Primarily used to fund the instructional activities of an institution. • Building Fees: Cover debt service on the institution’s buildings.
Tuition and the following additional fees are commonly referred to as the “sticker price” to attend a higher education institution:
• Services and Activities Fees: Support student activities. • Technology Fees: Charged at some institutions to support technology enhancements.
However, tuition and fees are not the only cost of a college education. Other expenses, including room, board, books, transportation, and incidentals must be considered in determining a total cost. In addition, federal and state financial aid, institutional aid, scholarships, and work study jobs help determine the “net price” a student actually pays to attend a college or university.
Both sticker price and total costs vary among public institutions. To help offset reductions in state appropriations, the 2011 Legislature gave public baccalaureate institutions authority to set their own tuition rates—with some stipulations—through the 2018-19 academic year.
The 2011-13 state budget assumed 16 percent annual resident-undergraduate tuition increases at the UW, WSU, and Western; 14 percent at Central and The Evergreen State College; 12 percent at the community and technical colleges; and 11 percent at Eastern Washington University. Only the UW exceeded those amounts, raising in-state tuition 20 percent for the 2011-12 academic year.
2011-12 Selected Tuition and Fee Rates at Washington Public Higher Education Institutions (Includes Tuition, Service & Activities, and Technology fees. Other fees may apply.)
Washington Resident Nonresident
Undergraduate Graduate Undergraduate Graduate University of Washington
UW Seattle $10,223 $12,5471 $27,707 $25,4171 UW Bothell $10,241 $12,5651 $27,725 $25,4351 UW Tacoma $10,343 $12,6671 $27,827 $25,5371
Washington State University $9,886 $10,188 $21,164 $23,342 Central Washington University $7,125 $8,187 $17,796 $18,144 Eastern Washington University $6,794 $9,036 $16,473 $20,736 The Evergreen State College $6,909 $7,568 $18,089 $20,048 Western Washington University $7,048 $7,520 $17,395 $17,200
Washington Resident Nonresident
Undergraduate Upper Division in
Applied Baccalaureate
Undergraduate Upper Division in
Applied Baccalaureate
Community & Technical Colleges2 $3,542 $6,701 $8,777 $18,021 1 The University of Washington uses a tiered graduate tuition system. These tuition rates assume Tier I tuition levels. 2 These tuition rates are an average of all community and technical colleges. Note: See full tuition and fee schedule at: http://www.hecb.wa.gov/sites/default/files/Tuition-2011-12Tuition-Fees.pdf. Source: 2011-12 tuition and fee rates collected by HECB.

Chapter II: How Washington Pays for Higher Education
Key Facts about Higher Education in Washington Page | 20
Tuition covers a growing share of higher education costs In recent years, Washington has witnessed a major change in the way higher education programs are funded at public colleges and universities. Taxpayers and students still share the cost of higher education, but the dramatic drop in state support caused by the recession has meant that the portion students now pay through tuition and fees is much higher, especially at four-year colleges and universities.
Prior to the 2009-11 biennium, state funding accounted for the majority of per-student funding at public institutions; by 2009-11, that had reversed at four of the state’s six public baccalaureate institutions, where tuition accounted for a majority of per-student funding. In the 2011-13 biennium, that trend has accelerated, with all public baccalaureate institutions now expected to generate a majority of their per-student funding from tuition—most by roughly two thirds, as shown below. At the community and technical colleges, state funding is still the primary source of per-student dollars, although that contribution has declined relative to tuition in recent years.
Maintaining a proper balance between the two revenue sources is consistent with the principle that higher education benefits both individuals who attend colleges and universities and the general public.
State Funding and Tuition Revenue per Budgeted Student FTE by Institution, 2007-09 Compared to 2011-13
Source: State Funding and Tuition: HECB analysis of data from Washington State Fiscal Information. Retrieved from fiscal.wa.gov, 12/15/11; Budgeted Student FTE: Legislative Evaluation and Accountability Program (LEAP) Committee Legislative Budget Notes.
Fund
s use
d fo
r Ins
truct
ion
(NGF
-S S
tate
Fun
ding
, 149
-6 T
uitio
n Re
venu
e)
per B
udge
ted
Stud
ent F
TE.
2007-09, 2009 Supplemental
2011-13, First Phase 2012 Supplemental

Chapter II: How Washington Pays for Higher Education
Key Facts about Higher Education in Washington Page | 21
Student financial aid helps bridge the gap between college costs and family income State and federal financial aid programs are a critical component of Washington’s higher education funding system. Without financial aid, the goal of a college degree or certificate would be beyond the reach of many Washington families.
How much students are expected to pay toward the cost of attendance is based on variables such as family income, assets and family size. The Free Application for Federal Student Aid (FAFSA) is used to establish the amount students will be expected to pay and their eligibility for state and federal financial aid programs.
In 2010-11, a total of $2.4 billion was provided to about 186,800 needy Washington students from state, federal, and other sources. This represents an increase of $207 million and 4,000 students compared to 2009-10 and a 34 percent increase in a two-year period.
This aid took the form of grants, work study awards, and loans. Grants are gifts with an obligation to make academic progress, but they do not need to be repaid. Work Study is a part-time employment opportunity offering subsidized wages. Loans require repayment with interest in the future, usually after graduation.
As in previous years, the federal government provided the majority of financial aid received by Washington students. About 69 percent of the federal aid was in the form of loans.
Financial Aid Received by Washington Need-Based Aid Recipients
2010-11 Academic Year
Source: HECB, 2010-11 Unit Record Report.
Financial Aid by Source Total: $2.4 billion
Financial Aid by Type Total: $2.4 billion

Chapter II: How Washington Pays for Higher Education
Key Facts about Higher Education in Washington Page | 22
Washington offers several types of financial aid programs In 2010-11, about $232 million in state aid was disbursed through programs administered by the HECB. In that year, more than 87,000 students attending 83 colleges and universities received state assistance through these programs.
In 2010-11, about 95 percent of the total program funds administered by the HECB went to need-based programs. Of the rest: 3 percent was directed to workforce programs and 2 percent went to merit programs.
The 2011 Legislature reduced 2010-11 funding to the State Need Grant (SNG) program by $25.4 million mid-year. Participating public SNG institutions were asked to offset the cut by replacing the SNG funds with institutional funds. More than 3,000 SNG-eligible students received the SNG budget cut replacement funds from the institutions.
The estimated expenditures for FY 2012 reflect appropriations contained in the 2011 conference budget. Additional changes for the 2011-12 academic year are not anticipated.
State Student Aid Programs Anticipated Expenditures for Fiscal Year 2012
Public Purpose Program Estimated
Expenditures Students Served
Need-Based State Need Grant $267 million 70,000 State Work Study $7.8 million 3,500 Passport to College $1.4 million 432
Merit-Based
Washington Scholars $2.3 million 268 Washington Award for Vocational Excellence $1 million 188 GEAR UP Scholarships $0.4 million 150 American Indian Endowed Scholarship $ 14,800 14
Targeted Workforce
Future Teachers Conditional Scholarship $40,000 8 Alternative Routes to Teaching $1.5 million 450 GET Ready for Math & Science $1.0 million 99 Health Professional Conditional Scholarship/Loan Repayment $3.0 million 218
WICHE Professional Student Exchange $71,000 4
Total State Funding $285 million 75,331 Note: Includes programs which the HECB administers or serves as the fiscal agent. Other aid programs administered by the SBCTC are not included. Expenditures include the appropriation and/or pre-existing committed funds. The number of served students represented may be duplicated amongst programs. Source: HECB, Student Financial Assistance Division.

Chapter II: How Washington Pays for Higher Education
Key Facts about Higher Education in Washington Page | 23
Institutions provide significant additional financial assistance to students In addition to student financial assistance provided by federal and state governments, institutions and private sources provide significant aid to students:
• More than 76,000 needy students received $479 million in financial aid from institutional and private sources—representing 20 percent of total aid disbursed to needy students in 2010-11.1
• Washington law requires public two- and four-year institutions to set aside at least 3.5 percent of revenue collected from tuition and services and activities fees to be used for needy students (RCW 28B.820). Funds are usually awarded as grants but also may be used to fund work study or loans.
• In 2010-11, $44.5 million was offered in grants to 24,000 needy students through this funding source.
In 2011, the requirements for institutional aid were modified with the tuition-setting authority legislation (E2HB 1795). The portion of revenue that must be provided to needy students as financial aid was increased to 4 percent for the public baccalaureate campuses or 5 percent if tuition is raised above the amount provided in the budget.
• The estimate of tuition revenue collections for public institutions is $1.088 billion for fiscal year 2012.2
• Based on the return-to-aid requirements noted above, an estimated $46 million would be provided to students in institutional financial aid in 2012.
The 2011 legislation also requires that campuses choosing to raise tuition beyond budgeted levels provide financial aid to offset tuition increases above State Need Grant award levels. The requirements are directed toward the lowest income students and prorated on a sliding income scale.
Other Forms of Institutional Aid: Additional local financial aid comes in the form of tuition waivers. Both required and voluntary waivers exist for various categories of students including veterans, teachers, and state employees. Institutions that have resources from endowments, gifts, and other sources often use those funds to augment student aid as well.
1 HECB, 2010-11 Unit Record Report as submitted by 68 public and private institutions. 2 2011-13 Operating budget as Enacted FY 2011, Fund total for Tuition Revenue for State Supported Programs (Fund 149-6). Source: Office of Financial Management Budget Allocation and Support System.

Chapter II: How Washington Pays for Higher Education
Key Facts about Higher Education in Washington Page | 24
Borrowing remains a necessity for many students as college costs go up Despite the availability of student financial aid, many low- and middle-income students still need to borrow to help pay for postsecondary education. The amount of college-related debt some students carry with them into post-college lives and careers is an increasing concern.
The table below shows the average level of borrowing by resident undergraduate students in Washington who received either need-based financial aid or non-need based loans during the 2010-11 academic year. The average loan amount incurred by non-needy students was slightly higher than for needy students ($9,600 versus $7,700, respectively). Dramatic changes in tuition and state financial aid policies could have a direct impact on borrowing behavior by students in the future. As tuition and other costs increase, students’ financial need increases. If grant aid is not sufficient to cover the rising cost of attendance and the increasing numbers of financially needy students, students will need to borrow more, work more, drop out, or defer enrollment.
Resident Undergraduate Borrowing by Sector, 2010-11
Sector
Need-Based Aid Recipients
with Loans* Average
Annual Loan
Non Need-Based Loan Recipients*
Average Annual Loan
Four-Year Public 35,650 $8,342 7,974 $11,221
Two-Year Public 33,685 $5,528 3,481 $4,958
Four-Year Private 10,126 $10,984 1,376* $11,112*
Private Career 6,260 $9,072 347 $9,974
Total 85,130 $7,654 13,135 $9,533
*These figures do not include aggregate loan data for Non Need Based Aid recipients at Seattle University. The Total represents unduplicated headcount and average loan was manually calculated. Source: 1011 URR for Resident Undergraduates with loans. (Grouped by SSN and Sector, Sum of Loan, where YearInSchool <5, Resident=1, and Loan>0)
Source: HECB, 2010-2011 Unit Record Report.

Chapter II: How Washington Pays for Higher Education
Key Facts about Higher Education in Washington Page | 25
GET program helps families save for future college expenses To encourage Washington families to save for college, the state Legislature, in 1997, authorized an IRS Section 529 prepaid college tuition plan called the Guaranteed Education Tuition (GET) program. GET, which began operation in August 1998, allows families to purchase tuition units now for use at a later date. The funds are invested and the purchaser is guaranteed a return to help cover future tuition.
Families can purchase between one and 500 units. The state guarantees that 100 units will cover one year of resident undergraduate tuition and state-mandated fees at the highest-priced public college or university in Washington. Students may use their GET units at any eligible in-state or out-of-state public or private accredited educational institution.
The Committee on Advanced Tuition Payment, commonly referred to as the GET Committee, governs the program. The committee is comprised of the executive director of the Higher Education Coordinating Board (chair), the State Treasurer, the director of the Office of Financial Management, and two citizen members. The HECB administers the GET program, while the State Investment Board oversees its investments.
As of June 2011, Washington families had opened nearly 135,000 accounts, valued at $1.9 billion. More than 20,766 students have used their GET accounts to attend colleges and universities in all 50 states and in five foreign countries. GET is one of the nation’s fastest-growing prepaid tuition plans in both assets and number of accounts.
The GET Committee annually sets the price of a GET unit, currently $163. Families can buy units by setting up a customized monthly payment plan or by making lump sum purchases. The annual enrollment period runs November 1 through May 31. For more information, visit www.get.wa.gov or call 1-800-955-2318.
Source: HECB, Guaranteed EducationTuition program.
7,830 10,321 13,098
23,817
36,010 43,981
54,955
66,122
78,787
90,716
106,419
119,819
134,969
0
20,000
40,000
60,000
80,000
100,000
120,000
140,000
1998 1999 2000 2001 2002 2003 2004 2005 2006 2007 2008 2009 2010
Cum
ulat
ive
GET
Enr
ollm
ents
Cumulative GET Enrollments

Chapter II: How Washington Pays for Higher Education
Key Facts about Higher Education in Washington Page | 26
GET and the rising cost of tuition In 2011, a Legislative Advisory Committee was established to advise the GET Committee and the State Actuary regarding decisions on pricing guidelines, the unit price and the payout value. The GET Committee sets the unit purchase price based on an actuarial formula that takes into account expected future tuition costs, expected return on investments, inflation, administrative costs, and a reserve to assist in periods of higher-than-expected tuition increases or lower-than-expected investment returns. GET is self-sustaining and receives no ongoing state appropriations.
Over the years, the unit price has steadily increased to accommodate the rising cost of college tuition. Current tuition increases, and those predicted for the future, have recently led to a significant increase in the GET unit price.
The unit price increase was caused in large part by a change in state tuition policy. In 2011, universities were given expanded authority to set tuition levels through 2015, and universities increased tuition as much as 20 percent for the 2011-12 academic year. The impact of these changes raised concerns among some legislators about the long-term solvency of the program. In light of current and expected tuition increases, the concern was whether the state would incur liability if it continues to guarantee that GET units will cover the full cost of tuition and fees in the future.
However, a recent study of the fund by the State Actuary indicated that the program remains financially solvent. As long as large tuition increases do not continue indefinitely and tuition units are appropriately priced, the GET program’s actuarial stability is expected to continue. By carefully structuring the unit price and reviewing it annually, the program should be able to manage payout values over future years and still recover from any current unfunded liability.
Source: The Guaranteed Education Tuition (GET) Program: Program Options and Analysis, Report to the Governor and Legislature of the State of Washington. October 2011. http://www.hecb.wa.gov/sites/default/files/GET-MASTER%20Leg%20Report-Final.pdf
History of the GET Unit Price