Chapter - I PROFILE OF THE DISTRICT - Office of the … of Town & Country Planning, Kerala District...
8
Department of Town & Country Planning, Kerala Department of Town & Country Planning, Kerala District Urbanisation Report - Kasaragod PROFILE OF THE DISTRICT 1 Chapter - I PROFILE OF THE DISTRICT “Meeting point of multiple cultures and languages, drawing vital energy from the port city of Mangalore and the high ranges of Kodagu, Kasaragod has a unique position as spatial ground of cultural amalgamation.” 1.0 INTRODUCTION The level of urbanization is not only an indicator of economic development but considered a stimulator of growth. The settlement pattern in the state has not been in line with that of other states in the country due to various physical, cultural and socio-economic reasons. For example, the number of urban settlements decreased from 197 in 1991 to 159 in 2001 in the state contrary to the national experience of increase in urban settlements. However, the urban agglomerations increased from 9 in 1981 to 17 in 2001. The population growth rate in urban local bodies mostly had been on the decline in the state, but showing an increased growth in peri urban areas. All these indicate a dispersed urban growth with blurred boundaries between urban and rural settlements reinforcing the popularly held concept of rurban continuum. The urbanization pattern of the state needs a thorough examination which necessitates the study of urbanization of each district. The district of Kasaragod has a slightly different story to tell in this regard. The district shows a higher growth rate of urbanization when compared to state average which may be due to a lower level of urbanization to start with compared to other regions in the state. The urban population also shows an inclining trend in the district. Along with this, the Fig 1.1 Kerala Map showing Kasaragod distirct growth rate in pre urban areas is also on the rise. All these factors necessitate a detailed study of urbanization pattern and extent in the district. 1.1 AREA AND POPULATION The Kasaragod district has a total area of 1992 Sq.km. It accounts for 5.13 percentage of the total area of the state with a total population of 12, 04,078 persons, (as per 2001 census), that is approximately over 4.7% of total population of state. Population density of Kasaragod district is 604 per/sq.km, which is below state average. Kasaragod is ranked 12th in the state as per 2001 census.
Transcript of Chapter - I PROFILE OF THE DISTRICT - Office of the … of Town & Country Planning, Kerala District...

Department of Town & Country Planning, KeralaDepartment of Town & Country Planning, Kerala
District Urbanisation Report - Kasaragod PROFILE OF THE DISTRICT 11
Chapter - IPROFILE OF THE DISTRICT
“Meeting point of multiple cultures and languages,drawing vital energy from the port city of Mangaloreand the high ranges of Kodagu, Kasaragod has a uniqueposition as spatial ground of cultural amalgamation.”
1.0 INTRODUCTION
The level of urbanization is not only an indicator ofeconomic development but considered a stimulatorof growth. The settlement pattern in the state has notbeen in line with that of other states in the countrydue to various physical, cultural and socio-economicreasons. For example, the number of urbansettlements decreased from 197 in 1991 to 159 in 2001in the state contrary to the national experience ofincrease in urban settlements. However, the urbanagglomerations increased from 9 in 1981 to 17 in 2001.The population growth rate in urban local bodiesmostly had been on the decline in the state, butshowing an increased growth in peri urban areas. Allthese indicate a dispersed urban growth with blurredboundaries between urban and rural settlementsreinforcing the popularly held concept of rurbancontinuum. The urbanization pattern of the state needsa thorough examination which necessitates the studyof urbanization of each district.
The district of Kasaragod has a slightly differentstory to tell in this regard. The district shows a highergrowth rate of urbanization when compared to stateaverage which may be due to a lower level ofurbanization to start with compared to other regionsin the state. The urban population also shows aninclining trend in the district. Along with this, the
Fig 1.1 Kerala Map showing Kasaragod distirct
growth rate in pre urban areas is also on the rise. Allthese factors necessitate a detailed study ofurbanization pattern and extent in the district.1.1 AREA AND POPULATION
The Kasaragod district has a total area of 1992Sq.km. It accounts for 5.13 percentage of the total areaof the state with a total population of 12, 04,078persons, (as per 2001 census), that is approximatelyover 4.7% of total population of state. Populationdensity of Kasaragod district is 604 per/sq.km, which isbelow state average. Kasaragod is ranked 12th in thestate as per 2001 census.
admin
Text Box
< CONTENTS >

PROFILE OF THE DISTRICT District Urbanisation Report - Kasaragod22
Department of Town & Country Planning, KeralaDepartment of Town & Country Planning, Kerala
Name of Taluk Taluk Head Quarters
Kasaragod Kasaragod
Hosdurg Kanhangad
Table 1.1 Taluk and Taluk Head quarters.
1.2 ADMINISTRATIVE DIVISIONSThe district is divided into 75 Villages in two Taluks,
Kasaragod and Kanhangad. The Collectorate functions atthe Civil Station at Vidyanagar in Chengala Panchayat, 5kmaway from the Kasaragod town. Kasaragod is the onlyrevenue division in the district and has its head quarters atKanhangad. During 1991-2001, two more Grama Panchayatswere formed in the District, bifurcating Bedadaka intoBedadeka and Kuttikole , and Panathady into Panathadyand Kallar Grama Panchayats, thus increasing the totalnumber of Grama Panchayats to 39. These two newlyformed Grama Panchyats came into being with effect fromthe 1st October 2000 vide G.O. (Ms) No. 266/99 LSGD dated29-12-1999. Further, Nileswaram was made to be aMunicipality in 2010, reducing the number of panchayatsto 38. The District has 6 block panchayats, and threeMunicipalities. The name of the Blocks, Block headquarters and Block wise distribution of population isshown in the Table 1.2 and Fig 1.3.
Source: Census Report, 2001
Table 1.2 Block panchayats, Municipalities and their Head Quarters
Name of Block Panchayat/
Head Quarters
Name of Panchayat where
Municipality Block Head Quarters is
situated
1 Kasaragod Kasaragod Kasaragod Municipality
2 Manjeswaram Manjeswaram Manjeswaram
3 Kanhangad Kanhangad Kanhangad Municipality
4 Nileswaram Nileswaram Nileswaram Municipality
5 Karadka Mulleria Karadka
6 Parappa Parappa Kinanoor-Karindalam
7 Kasaragod Municipality Kasaragod Kasaragod Municipality
8 Kanhangad Municipality Kanhangad Kanhangad Municipality
9 Nileswaram MunicipalityNileswaram Nileswaram Municipality
Sl.No.
Fig 1.2 Taluks and their headquarters
DAKSHINA KANNADA DISTRICTKarnataka State
KODAGU DISTRICTKarnataka State
KANNUR DISTRICT
KODAGU DISTRICTKarnataka State
DAKSHINA KANNADA DISTRICTKarnataka State
KANNUR DISTRICT
Fig 1.3 Blocks Panchayats ,Municipalities and their Head Quarters

Department of Town & Country Planning, KeralaDepartment of Town & Country Planning, Kerala
District Urbanisation Report - Kasaragod PROFILE OF THE DISTRICT 33
Table 1.3 Grama Panchayats in Kasaragod District.
Sl.No. LSGs Grade
1 Chengala Special2 Chemnad First3 Badiadka Special4 Madhur Special5 Mogral – Puthur Special6 Kumbla Special
1 Mangalpady Special2 Vorkady First3 Puthige First4 Meenja First5 Manjeshwaram Special6 Paivalike First7 Enmakaje First
Kanhangad
1 Udma Special2 Ajanur Special3 Madikai First4 Pallikkara Special5 Pullur - Periya First
1 Cheruvathur Special2 Kayyur – Cheemeni First3 Pilicode First4 Trikaripur First5 Padne First6 Valiyaparamba First
1 Bedadka Special2 Bellur First3 Delampady First4 Karadka First5 Kumbadaje First6 Kuttikol First7 Muliyar First
1 Balal First2 East Eleri First3 Kinanoor-Karindalam First4 Kallar First5 Kodom belur First6 Panathady First7 West Eleri First
Karadka Block Panchayat
Parappa Block Panchayat
Kasaragod Block Panchayat
Manjeswaram Block Panchayat
Kanhangad Block Panchayat
Nileshwaram Block Panchayat
The 6 Block panchayats are divided into 38 GramaPanchayats as follows:
Fig 1.4 District Map showing all Panchayats in 1991
DAKSHINA KANNADA DISTRICTKarnataka State
KODAGUDISTRICT
Karnataka State
KANNUR DISTRICT
Fig 1.5 District Map showing all Panchayats in 2001
DAKSHINA KANNADA DISTRICTKarnataka State
KODAGU DISTRICTKarnataka State
KANNUR DISTRICT

PROFILE OF THE DISTRICT District Urbanisation Report - Kasaragod44
Department of Town & Country Planning, KeralaDepartment of Town & Country Planning, Kerala
1.4. PHYSICAL FEATURESKasaragod is the most northern district of
Kerala. The district is bounded by Mangalore district(Karnataka state) on the north, Coorg district (Karnatakastate) on the east, Kannur district on the south and Ara-bian Sea on the west. Kasaragod District lies between120 12’ and 12048’ North latitudes and between 740 52’and 750 26’ East longitudes. Figure 1.7 shows physical
setting of Kasaragod District.
A. CLIMATEThe diversity of the physical features results in a
corresponding diversity of climate. In the plains, theclimate is generally hot. Though the mean maximumtemperature is only around 320C, the heat is oppressivein the moisture-laden atmosphere of the plains. Humidityis very high and rises to about 32 % during the southwestmonsoon. The annual variation of temperature is small.The diurnal range is only about -12o C.
Table 1.4 Average rain fall during 2004Month Rainfall, mm
January 30.9February 0March 0April 38.1May 339.9June 1056.5July 675.4August 553September 74.2October 306.3November 28.1December 49.8Annual 3152.2
Source: District Census Handbook, 2004
1.3 PHYSIOGRAPHYThe District is classified under three physio-
graphic types. The highland region is made of laterite.The soil type in the midland region is red ferruginousloam of lateritic origin with an admixture of clay andsand. The coastal strip is sandy.
Fig 1.6 Physiography of the District
DAKSHINA KANNADA DISTRICTKarnataka State
KODAGU DISTRICTKarnataka State
KANNUR DISTRICT
Fig 1.7 Physical setting of Kasaragod district
DAKSHINA KANNADA DISTRICTKarnataka State
KODAGU DISTRICTKarnataka State
KANNUR DISTRICT

District Urbanisation Report - Thiruvananthapuram REGIONAL ASPECTS
Department of Town & Country Planning, KeralaDepartment of Town & Country Planning, Kerala
55The South-West monsoon starts towards the
end of May or the beginning of June-heralded bythunder-storms and holds till September when therains fade out. October brings in the North-Eastmonsoon. Dry weather sets in the end of December.December and January are the coolest months of theyear. February, March, and April are generally very hot.Table 1.4 shows the average rainfall during the year2004.
B. FORESTKasaragod district has a forest area of 117.54.sq.kms,falling under the Kannur Forest Division. Reserve foreststretches to 86.02 sq.kms, and vested forest to 31.52sq.kms, in two ranges-Kasaragod and Kanhangad.
Table 1.5 Rivers in Kasaragod district:Origin and length
Source: District Census Handbook 2004
Total Navigable
1 Manjeshwar Kadandur hills 16 32 Uppala Kudipadi hills 50 -
3 Shiriya Kanakad hills 61 54 Kumbala Yedanad 11 35 Mogral Kanlur village 34 -6 Chandragiri Patti forests 105 137 Kalnad Chetianchal 8 -8 Bekal Kaniyadka 25 -9 Chitari Kundiya 25 -
10 Nileshwar Kinanur 47 1111 Kariangode Padinalkad 64 2412 Kavvayi Cheemeni 23 10
Length in kmSl.no. Name of river Place of origin
C. RIVERS
There are 12 rivers in this District. All the rivers areflowing westwards.The District is blessed withbeautiful backwaters Kumbala, Kalanad, Bekal, Chittariand Kavvai. Kavvai is the longest kayal in Malabar. Ithas been identified as a wetland of national importancewith an area of 21.92sq.km. It connects 8 panchayatsand one Municipality. Fig 1.9 and Table 1.5 shows riversin Kasaragod District.
D. MOUNTAINSThe chief hill ranges in this district are
Kottamcheri hill and Ranipuram. Kottamcheri hill is abeautiful picnic centre, which is also ideal for trekking.“Talakkaveri” in the Brahmagiri Mountains of Coorg isquite near Kottamcheri hills.The former Madathumala is known as Ranipuram. Lying780 m above sea level, it is only 9 km from Panathurwhich is 48km east of Kanhangad. The extensive forestof Madathumala merges with the forest of Karnataka.The natural beauty is comparable to that of hill stationslike Ooty.
The forest produces are shegai bark, sheakoy,cardamom, canes, fibers, etc. Sambar, the fastest deer,is seen in some areas.
KODAGU DISTRICTKarnataka State
Figure 1.8 Forest in Kasaragod District.
DAKSHINA KANNADA DISTRICTKarnataka State
KANNUR DISTRICT

PROFILE OF THE DISTRICT District Urbanisation Report - Kasaragod66
Department of Town & Country Planning, KeralaDepartment of Town & Country Planning, Kerala
E. NATURAL SUB DIVISIONSThe District can be classified into five depending onterrain as follows:-1.Lowland within 20m of MSL consisting of paddy fields.2.Mid land within an elevation of 20m to 200m MSL.3.Moderately elevated highlands within MSL 100m to 300 m4.Highland with 50% slope and lying between MSL 300mto 600m.5.Hill areas at elevation of 800m and above from MSL.
Three soil types are available in the district. Thehighland region has laterite. Red ferruginous loam oflateritic origin with admixture of clay and sand is seenin the midland. The coastal strip is sandy.1.5. SOCIO-ECONOMIC ASPECTSA.LITERACY RATEAs per 2001 census, Kerala is the most literate state in Indiahaving literacy rate of 90.92%. The Saksharatha programmeof the government was well received and due to the zealouscampaign conducted by the Government as well asvoluntary organizations, and the level of literacy has amarked improvement. As per the statistics, Kasaragod ispositioned 11th among the 14th Districts in the stateregarding literacy rate. Achievements of Kasaragod on theliteracy front might not seem impressive at the first glance.But the innovative programme drafted and implementedin the district by the District Literacy Mission and itsachievement compared to the base line has won the SatyanMaitre Award 2006 of the National Literacy Mission, forimplementing literacy and continuous literacy programmesin the best manner. As per available statistics, the districthas 896,367 literates, of which 464,844 are male and 431521are female. B. WORK FORCE PARTICIPATION RATIO
The work participation ratio (WPR) in Kerala hasincreased from 34.75 to 35.93 during 1991 to 2001.Kasaragod District recorded 34.75 of WPR during 2001,which is below the state average.C. POTENTIAL OF THE DISTRICT
The potential of a district depends primarilyon the resource endowment and connectivity.
Persons Percentage Male Percentage Female Percentage
T 896367 74.49 464844 79.08 431523 70.1R 713595 73.59 371861 78.3 341734 69.08U 182772 78.19 92983 82.39 89789 74.28T 447722 72.66 236585 77.58 211137 67.84R 372883 71.71 198284 76.91 174599 66.61U 74839 77.77 38301 81.21 36538 74.46T 448645 76.41 228259 80.72 220386 72.41R 340712 75.77 173577 79.96 167135 71.87U 107933 78.49 54682 83.23 53251 74.16
Kasaragod District
Kasaragod Taluk
Hosdurg Taluk
Table 1.6 Literacy
T-Total, R-Rural,U. Urban.
Source: Census handbook –2001.
Fig 1.9 Rivers in Kasaragod District
DAKSHINA KANNADA DISTRICTKarnataka State
KODAGU DISTRICTKarnataka State
KANNUR DISTRICT

Department of Town & Country Planning, KeralaDepartment of Town & Country Planning, Kerala
District Urbanisation Report - Kasaragod PROFILE OF THE DISTRICT 77
YearState
HighwayMajor District
RoadsOther District
RoadsVillage Roads.
1990-91 28 85 545 2531991-92 28 85 379 4541992-93 28.97 84.59 376.69 466.561993-94 28.97 84.56 376.42 482.821994-95 28.97 84.56 376.42 544.071995-96 28.97 84560 376.42 726.271996-97 142.78 1.25 324.076 557.7731997-98 249.84 1.25 283.281 527.1631998-99 227-485 273.857 134.13 251.843
1999-2000 227.49 273.857 254.815 161.357
Table 1.7 Length of PWD roads (in km) based on type of the road for the period 1990-2000.
Sl.No. Institutions Govt: Aided Unaided Total1 Lower Primary School 158 80 5 2432 Upper primary school 92 56 1 1493 High School 51 25 8 844 Vocational Higher
Secondary School 16 6 - 225 Higher Secondary School 51 13 17 816 Colleges 2 3 10 157 Engineering Colleges 2 28 Teachers Training 1 3 49 Teacher Education Centre 1 - 4 5
10 Special School for blind 1 - - 111 Special School for deaf 1 112 Poly Technic 2 1 313 I.T.I/ITC 1 0 7 814 Food Crafts Institute 1 115 Agricultural College 1 116 Agricultural Research
Institute 1 117 Central Plantation
Research Institute 1 118 Arabic College 1 119 Sanskrit College 1 1
20Junior nursing health training school 1 1
21 Kendriya Vidyalaya 2 222 Navodaya Vidyalaya 1 123 CBSE Schools 20 20
Table 1.8 Educational facilities in Kasaragod, 2009
The District is blessed with many resources likeagricultural produces, minerals, horticultural produces,Cattle & Livestock, forest produces etc. The majoragricultural products include rice,coconut,banana,groundnut, cotton etc, and offer amajor share of employment. There are opportunitiesfor development of tourism with tourist spots like BakelFort, Kottamcherry, Ranipuram etc.
D.PER CAPITA INCOME (PCI)The per capita income of Kasaragod District is
Rs.27584- and the per capita income of Kerala state isRs.31642/- as in 2001 Census.
E.SHARE OF WORKERS:The work force participation Ratio (WPR) in
Kerala has increased from 34.75% to 35.93% from 1991to 2001. In the District 78.4 percent of workers are Mainworkers and 21.6 percent are Marginal workers in 2001census. The District has the highest percentage ofworkers in house hold industry (12.1. percent) in 2001census.1.6 STATUS OF INFRASTRUCTUREA. ROAD LENGTH
Statistics reveals that with a total road lengthof 21937.76 km, Kerala state accounts for 3.78% of thatof the nation. Out of which, the share of Kasaragod isonly 5.39%.B. EDUCATIONAL FACILITIES:The district has 606 schools constituting 4.94 % of 12274schools in the state. In the case of higher educationfacilities Kasaragod District has 17 Colleges.
C. HEALTH INSTITUTIONSThere are 2748 health institution in Kerala under public
sector, out of which 153 are in Kasaragod. Table 1.9
shows the details of modern medical facilities in
Kasaragod District.
Source: Executive Engineer PWD, Kasaragod-2009
PROFILE OF THE DISTRICT District Urbanisation Report - Kasaragod88
Department of Town & Country Planning, KeralaDepartment of Town & Country Planning, Kerala
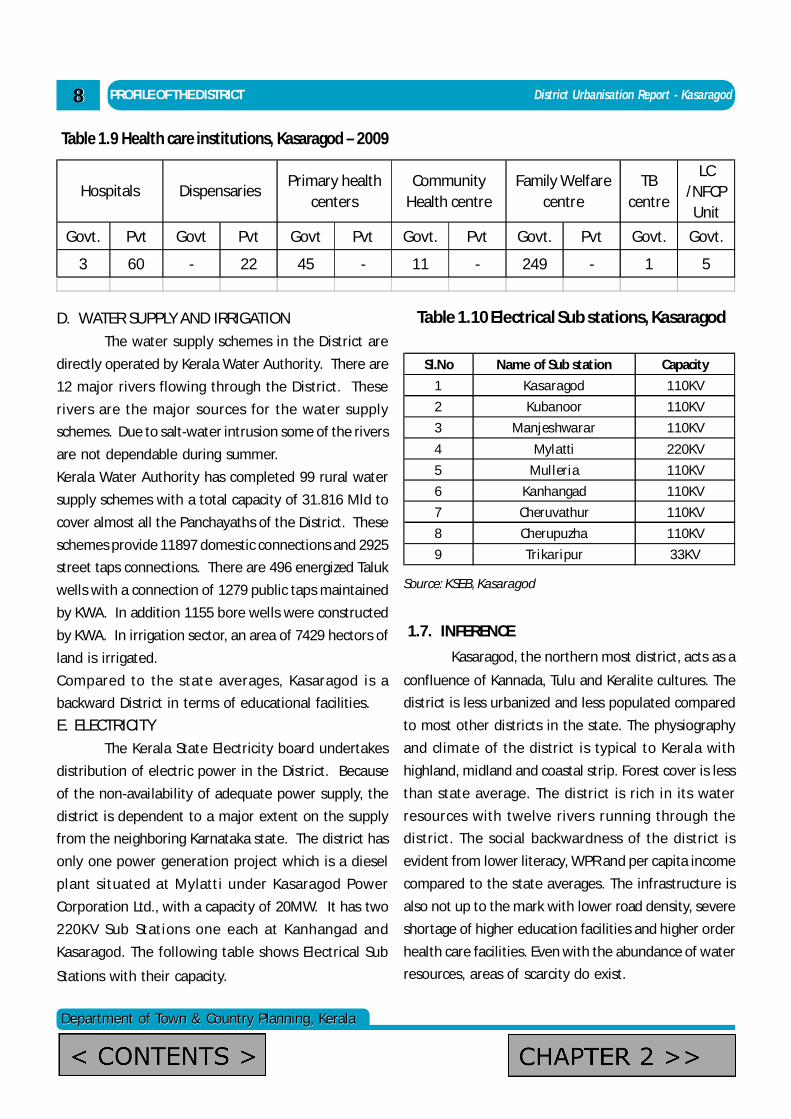
Table 1.10 Electrical Sub stations, KasaragodD. WATER SUPPLY AND IRRIGATIONThe water supply schemes in the District are
directly operated by Kerala Water Authority. There are12 major rivers flowing through the District. Theserivers are the major sources for the water supplyschemes. Due to salt-water intrusion some of the riversare not dependable during summer.Kerala Water Authority has completed 99 rural watersupply schemes with a total capacity of 31.816 Mld tocover almost all the Panchayaths of the District. Theseschemes provide 11897 domestic connections and 2925street taps connections. There are 496 energized Talukwells with a connection of 1279 public taps maintainedby KWA. In addition 1155 bore wells were constructedby KWA. In irrigation sector, an area of 7429 hectors ofland is irrigated.Compared to the state averages, Kasaragod is abackward District in terms of educational facilities.E. ELECTRICITY
The Kerala State Electricity board undertakesdistribution of electric power in the District. Becauseof the non-availability of adequate power supply, thedistrict is dependent to a major extent on the supplyfrom the neighboring Karnataka state. The district hasonly one power generation project which is a dieselplant situated at Mylatti under Kasaragod PowerCorporation Ltd., with a capacity of 20MW. It has two220KV Sub Stations one each at Kanhangad andKasaragod. The following table shows Electrical Sub
Stations with their capacity.
1.7. INFERENCEKasaragod, the northern most district, acts as a
confluence of Kannada, Tulu and Keralite cultures. Thedistrict is less urbanized and less populated comparedto most other districts in the state. The physiographyand climate of the district is typical to Kerala withhighland, midland and coastal strip. Forest cover is lessthan state average. The district is rich in its waterresources with twelve rivers running through thedistrict. The social backwardness of the district isevident from lower literacy, WPR and per capita incomecompared to the state averages. The infrastructure isalso not up to the mark with lower road density, severeshortage of higher education facilities and higher orderhealth care facilities. Even with the abundance of waterresources, areas of scarcity do exist.
Table 1.9 Health care institutions, Kasaragod – 2009
Sl.No Name of Sub station Capacity1 Kasaragod 110KV2 Kubanoor 110KV3 Manjeshwarar 110KV4 Mylatti 220KV5 Mulleria 110KV6 Kanhangad 110KV7 Cheruvathur 110KV8 Cherupuzha 110KV9 Trikaripur 33KV
Source: KSEB, Kasaragod
TB centre
LC /NFCP Unit
Govt. Pvt Govt Pvt Govt Pvt Govt. Pvt Govt. Pvt Govt. Govt.
3 60 - 22 45 - 11 - 249 - 1 5
Family Welfare centre
Hospitals DispensariesPrimary health
centersCommunity
Health centre
admin
Text Box
< CONTENTS >
admin
Text Box
CHAPTER 2 >>