CHAPTER - I EXECUTIVE SUMMARY 1 - Karnatakakea.karnataka.gov.in/sites/default/files/Evaluation...
27
1 CHAPTER - I EXECUTIVE SUMMARY 1.1 Background The social security plantation is a very important component of the SCP implemented in almost all the divisions. The component involves raising one hectare of plantation of usufructs and economically valuable species. The degraded forests are selected nearer to the beneficiary’s habitations and the plantation is established in consultation with the beneficiary by choosing the species based on silvicultural and economic criteria. The planting and seedling cost is borne by the scheme while the beneficiary is paid for his labor during the land preparation and planting activity. The subsequent maintenance and the watch and ward are the responsibility of the beneficiary. 1.2 Activities 1.2.1 Seedling distribution/Social security plantations Distribution of seedling is a major component of the SCP program. In this component seedlings of high quality economically valuable species are selected and give n o the beneficiaries free of cost. The seedlings are planted on their own farm lands of beneficiaries and protection is given to the plants till their establishment and maturity. During the maintenance stage technical advice is given to the beneficiaries. Besides supplying two seedlings the social security plantations were raised by supplying 100 seedlings of usufructs. 1.2.2 Supply of Casurina and Eucalyptus poles Supply of Casurina and Eucalyptus poles to the beneficiaries is done with an objective of providing construction material to the beneficiaries to repair and build the dwellings and cattle sheds. In certain cases the raw material is also used for the value addition. 1.2.3 Supply of Saralavale/ Smokeless chullas Under the SCP the forest department has been supplying the smoke less chullas to the beneficiaries with an objective of assisting the beneficiaries to use less firewood while reducing the smoke impact on the health of womenfolk who are subjected to environmental hazard. 1.2.4 Supply of LPG Under the SCP the forest department has been supplying the LPG kits to the beneficiaries with an objective of assisting the beneficiaries to use less firewood while reducing the smoke impact on the health of women folk who are subjected to environmental hazard.
Transcript of CHAPTER - I EXECUTIVE SUMMARY 1 - Karnatakakea.karnataka.gov.in/sites/default/files/Evaluation...

1
CHAPTER - I
EXECUTIVE SUMMARY
1.1 Background
The social security plantation is a very important component of the SCP implemented in almost all
the divisions. The component involves raising one hectare of plantation of usufructs and
economically valuable species. The degraded forests are selected nearer to the beneficiary’s
habitations and the plantation is established in consultation with the beneficiary by choosing the
species based on silvicultural and economic criteria. The planting and seedling cost is borne by the
scheme while the beneficiary is paid for his labor during the land preparation and planting activity.
The subsequent maintenance and the watch and ward are the responsibility of the beneficiary.
1.2 Activities
1.2.1 Seedling distribution/Social security plantations
Distribution of seedling is a major component of the SCP program. In this component seedlings of
high quality economically valuable species are selected and give n o the beneficiaries free of cost.
The seedlings are planted on their own farm lands of beneficiaries and protection is given to the
plants till their establishment and maturity. During the maintenance stage technical advice is given to
the beneficiaries. Besides supplying two seedlings the social security plantations were raised by
supplying 100 seedlings of usufructs.
1.2.2 Supply of Casurina and Eucalyptus poles
Supply of Casurina and Eucalyptus poles to the beneficiaries is done with an objective of providing
construction material to the beneficiaries to repair and build the dwellings and cattle sheds. In certain
cases the raw material is also used for the value addition.
1.2.3 Supply of Saralavale/ Smokeless chullas
Under the SCP the forest department has been supplying the smoke less chullas to the beneficiaries
with an objective of assisting the beneficiaries to use less firewood while reducing the smoke impact
on the health of womenfolk who are subjected to environmental hazard.
1.2.4 Supply of LPG
Under the SCP the forest department has been supplying the LPG kits to the beneficiaries with an
objective of assisting the beneficiaries to use less firewood while reducing the smoke impact on the
health of women folk who are subjected to environmental hazard.

2
1.2.5 Supply of Solar lamp
Under the SCP the forest department has been supplying the solar lamps to the beneficiaries with an
objective of helping the beneficiaries to have access to better quality of life, single or two bulbs have
been supplied for house lightings.
Evaluation of Social Security Plantation
The survey has shown that the all the beneficiaries reported in the data base have actually received
two seedlings. The numbers of seedlings received were also found to be accurate. In Dharwad 6
beneficiaries have not received the seedlings. In other divisions all the beneficiaries have received
the seedlings. The species supplied is mango and Sapota, coconut and teak.
Table showing beneficiaries receiving for 2 Seedlings category
Year Belgaum Bagalkot Bidar Gulbarga Dharwad Gokak Raichur Bijapur
2009-11 190 80 61 9 16 42 110 133
Table showing beneficiaries received for 100 Nos. Seedlings category
Year Belgaum Bagalkot Gokak Bidar Raichur Bijapur Gulbarga Dharwad
2009-10 207 31 9 15 22 9 13 6
The verification of the100 seedlings supplied to beneficiaries has been found accurate for all the
beneficiaries. The seedlings supplied are Mango, Coconut and Sapota.
(a) Survival rate. The survival rates were counted by observing the seedlings surviving in the field.
The table gives the survival rate for different division. To calculate the survival all the seedlings
supplied under the program have been counted and the survival rate has been calculated.
Table showing survival % in two seedlings scheme:
Year Belgaum Bagalkot Bidar Gulbarga Dharwad Gokak Raichur Bijapur W. Avg
2009-
11 84 48 9.83 5.5 20 26.19 57.72 0 39.61%
Results: The survey has shown that the survival of seedlings varying from 0 -84% across divisions.
Bijapur recorded 100% mortality. However the lowest survival was found in Gulbarga with 5.5%
and the highest in Belgaum with 84%. The overall survival rate (estimated by calculating the
weighted average) is 39.61%.

3
Graph representing survival percentage among Divisions for 2 seedlings category:
Survival of plantation of 100 seedlings category
Year Belgaum Bagalkot Gokak Bidar Raichur Bijapur Gulbarga W. Avg
2009-10 1.8 17.62 34.33 6.13 56.13 21.66 0.76 9%
The survival rate of the seedlings has shown that the survival rate of seedlings is very poor in many
divisions except in Belgaum and Dharwad where the rainfall is very good. In other drier divisions
like Bagalkot, Gulbarga and Bidar the survival rate is very low which needs a proper strategic level
planning and improvement .The overall weighted average is 9%.
Graph showing survival percentage among Divisions (100 Seedlings category):
0
10
20
30
40
50
60
70
80
90
Belgaum Bagalkot Bidar Gulbarga Dharwad Gokak Raichur
Pe
rce
nta
ge (
%)
Divisions
0
10
20
30
40
50
60
Belgaum Bagalkot Gokak Bidar Raichur Bijapur Gulbarga
Pe
rce
nta
ge (
%)
Divisions

4
A. Species wise Survival rate: From this survey it is found that, Mango and sapota had very high
survival rate as compared to other species. They prefer of beneficiaries are also was found to be
more for mango and sapota as compared to other species.
B. Supply of number of Seedlings: Supply of just two seedlings are highly risky as there are no
options available to replace the mortality. As the morality rate of seedlings are almost 50 % in
high rainfall areas, to ensure survival of 2 seedlings, minimum 4 seedlings needs to be supplied.
C. Viability of seedlings numbers: In very few cases, 100 seedlings ( mango) has given 90-100 %
success perhaps the beneficiary thinks worthwhile to spend his time and effort to protect bigger
numbers than the two numbers as more numbers means an economic advantage to the
beneficiary.
D. Suitability of species: The beneficiaries have expressed that un-suitability of species.
Evaluation of Smokeless stoves:
The survey has shown 90% of beneficiaries using the Astra valae/ Smokeless chullas in different
divisions. The respondents have shown keen interest in using the improved stoves, as it has very high
energy efficiency and less pollution (indoors), which has helped the beneficiaries. The pattern of use
as regular users, occasional and no users are presented in the table and graph.
Table representing pattern of use in different divisions:
Division Regular users % Occasional users% Non-users%
Bagalkot 86.66 13.33 0
Bijapur 75 25 0
Gokak 100 0 0
Dharwad 84.61 15.39 0
Gadag 56.25 12.5 31.25
Haveri 58.8 11.76 29.41
Gulbarga 12.96 33.33 53.70
Bidar 0 33.33 66.6

5
Graph representing smokeless stoves pattern of use in different divisions:
Health Impacts:
The survey of Health impact upon the use of smokeless chulas has shown that there was positive
health impact on the beneficiaries using the improved stove.
LPG kits distribution: The distribution among the sampled beneficiaries has indicated 98% of the
beneficiaries have received the benefits.
The LPG kit distribution evaluation has shown that nearly 50% beneficiaries are not using the
benefits due to non availability of gas.
Solar lamps: Solar lamps have been distributed in seven divisions and the evaluation done in all the
divisions are tabulated here.
Table showing the use pattern of solar lamps
Year Division Regular users % Occasional users% Non-users%
2010-11 Bijapur 68.75 31.25 0
2010-11 Dharwad 63.83 9.09 27.27
2012-13 Dharwad 87.5 12.5 0
2010-11 Gadag 100 0 0
2012-13 Gadag 50 40 10
2012-13 Haveri 80 20 0
0
20
40
60
80
100
120
Pe
rce
nta
ge(%
)
Divisions
Regular users %
Occasional users%
Non-users%

6
Graph showing the use pattern of solar lamps:
Poles Distribution: The survey has shown that, the Eucaluptus and Casuarina poles distributed were
not used by more than 70% beneficiaries in Bagalkot division. Only 21.05% beneficiaries used the
material for household needs.
0
20
40
60
80
100
120
Bijapur Dharwar Dharwar Gadag Gadag Haveri
Pe
rce
nta
ge(%
)
Divisions
% Regular users
% occasional
Not used %

7
CHAPTER – II
INTRODUCTION
A. Special Component Plan (SCP) is a centrally sponsored program funded by Government of
India. The main objective of the program is to help the poor and marginalized scheduled caste
households to create economic assets through plantation development and to grow usufructs plants
and to value add to the raw material supplied to them for improving their livelihood systems. The
scheme is implemented throughout the state of Karnataka and the beneficiaries selected based on
their caste and economic status.
B. Objectives of the program.
1. To assist Scheduled caste families to improve their livelihood and living standards.
2. To help the beneficiaries to grow usufructs seedlings of high nutritional quality for
improving livelihood systems.
3. Smokeless chullas are supplied to the beneficiaries to improve the energy efficiency of
stoves which in turn will reduce the firewood consumption and help in reducing carbon
dioxide emission.
C. Funding. The funds are shared by state and central government. The states are required to
earmark 15% of the state outlay under this program. The details of the funds year wise are mentioned
in the next page.
D. Program and Activities.
Components of the SCP program: The components of the programs are selected as per the
guidelines issued by the GOI from time to time and local conditions to enable the beneficiaries to
make use of the assistance to develop durable assets. The components of the program implemented
during 2009-2013 survey period are as follows.
(1) Social security plantations (SSP): The social security plantation is a very important component
of the SCP implemented in almost all the divisions. The component involves raising one hectare of
plantation of usufructs and economically valuable species. The degraded forests are selected nearer
to the beneficiary’s habitations and the plantation is established in consultation with the beneficiary
by choosing the species based on silvicultural and economic criteria. The planting and seedling cost
is borne by the scheme while the beneficiary is paid for his labour during the land preparation and
planting activity. The subsequent maintenance and the watch and ward are the responsibility of the
beneficiary.

8
SCP: UNIT - 1
Sl.
No. Circle Division
2009-10 (in lakhs) 2010-11 (in lakhs) 2011-12 (in lakhs) 2012-13 (in lakhs) Total (in lakhs)
Fin
target
Amount
released
Amount
spent
Fin
target
Amount
released
Amount
spent
Fin
target
Amount
released
Amoun
t spent
Fin
target
Amount
released
Amount
spent
Fin
target
Amount
released
Amount
spent
0 1 2 3 4 5 6 7 8 9 10 11 12 13 14 15 16 17
1
Gulbarga
Gulbarga 0.228 0.228 0.228 1 1 1 36.7 36.7 36.7 30.716 25.716 25.716 68.644 63.644 63.644
2 Bidar 3.996 3.996 3.995 16.779 16.779 16.773 22.6 22.6 22.451 36.478 31 30.328 79.853 74.375 73.547
3 Raichur 0 0 0
4 Yadgir 0 0 0 0.992 0.992 0.992 17.5 17.5 17.5 10.256 10.256 10.256 28.748 28.748 28.748
Total 4.224 4.224 4.223 18.771 18.771 18.765 76.8 76.8 76.651 77.45 66.972 66.3 177.245 166.767 165.939
5
Belgaum
Belgaum 6.197 6.196 6.196 26.014 26.014 26.014 15.01 15.01 15.014 12.57 12.57 12.57 59.791 59.79 59.794
6 Gokak 1.542 1.542 1.542 6.475 6.475 6.475 20 20 20 14.1 14.1 14.1 42.117 42.117 42.117
7 Bagalkot 2.1382 2.138 2.138 14.077 14.077 14.077 18.896 18.896 18.896 29.998 29.998 29.998 65.109 65.109 65.109
8 Bijapur 4.479 4.479 4.479 18.806 18.806 18.806 25.2 24.197 24.197 23.752 23.752 23.752 72.237 71.234 71.234
Total 14.356 14.355 14.355 65.372 65.372 65.372 79.106 78.103 78.107 80.42 80.42 80.42 239.254 238.250 238.254
9
Dharwad
Dharwad 1.757 1.757 1.757 7.376 7.376 7.376 10 10 10 15.009 15.009 15.009 34.142 34.142 34.142
10 Gadag 1.837 1.837 1.837 7.714 7.714 7.714 10.3 10.3 10.3 19.5 19.5 19.5 39.351 39.351 39.351
11 Haveri 0 1.547 1.547 0 9.845 9.845 0 13.33 13.33 0 18.355 18.355 0 43.077 43.077
Total 3.594 5.141 5.141 15.09 24.935 24.935 20.3 33.63 33.63 34.509 52.864 52.864 73.493 116.570 116.570

9
(2) Seedling distribution: Distribution of seedling is another major component of the SCP program.
In this component seedlings of high quality economically valuable species are selected and given to
the beneficiaries free of cost. The seedlings are planted on their own farm lands of the beneficiaries
and protection is given to the plants till their establishment and maturity. During the maintenance
stage technical advice is given to the beneficiaries.
(3) Supply Eucalyptus and Casuarinas Poles: Supply of Bamboo to the beneficiaries is done with
an objective of providing construction material to the beneficiaries to repair and build the dwellings
and cattle sheds. In certain cases the raw material is also used for the value addition.
(4) Supply of Saralavalae/Smokeless chullas and Astra valae/LPG: Under the SCP the forest
department has been supplying the smoke less chullas to the beneficiaries with an objective of
assisting the beneficiaries to use less firewood while reducing the smoke impact on the health of
womenfolk who are subjected to environmental hazard.
(5) Supply of Solar lamp: Under SCP in few places solar lamps have been supplied to beneficiaries
for house lightings with single or two bulbs. The scheme is aimed at helping the beneficiaries to have
access to better quality of life.
E. Evaluation objectives.
The Evaluation of the program implemented during 2009-2013 was undertaken with the following
objectives.
Survey and Assessment of the physical assets created and the genuineness of the beneficiaries
(according to eligibility)
Evaluation of the Quality of the Assets and durability of the benefits.
Physical verification of the Assets to assess the cost worthiness.
Impact assessment of the scheme against the stated objectives.

10
CHAPTER – III: SAMPLE WORK
Circle Division Year
Supply of Poles
(Casurina &
Eucaluptus)
Solar
Lamp
Sarala Valae/
Smokeless Stoves LPG Stove
Social Security
Plantation
Grand
Total
Beneficiary Beneficiary Beneficiary Beneficiary Beneficiary Beneficiary
Bel
ga
um
Bagalkot
2009-10 0 0 0 0 94 94
2010-11 39 0 0 0 18 57
2011-12 0 0 180 0 9 189
2012-13 0 0 405 0 0 405
745
Belgaum
2009-10 0 0 0 0 175 175
2010-11 0 0 0 0 207 207
2011-12 0 0 138 0 10 148
2012-13 0 0 138 0 11 149
679
Bijapur
2009-10 0 0 0 0 126 126
2010-11 0 0 25 0 0 25
2011-12 0 0 125 0 12 137
2012-13 0 12 0 65 7 84
372
Gokak
2009-10 0 0 0 0 44 44
2010-11 0 0 0 0 22 22
2011-12 0 0 185 0 14 198
2012-13 0 0 195 0 195 390
654
Dh
arw
ad
Dharwad
2009-10 0 0 0 0 50 50
2010-11 0 0 0 0 16 16
2011-12 0 13 0 0 4 17
2012-13 0 18 133 0 0 151
234
Gadag
2009-10 0 0 0 0 4 4
2010-11 0 0 0 0 14 14
2011-12 0 11 0 0 4 15
2012-13 0 22 158 0 0 180
213
Haveri
2009-10 0 0 0 0 32 32
2010-11 0 26 0 0 1 27
2011-12 0 18 0 0 13 31
2012-13 0 15 143 0 4 162
252
Gu
lbu
rga
Bidar
2009-10 0 0 0 0 45 45
2010-11 0 0 0 105 0 105
2011-12 0 26 0 0 10 36
2012-13 0 0 184 0 10 194
380
Gulbarga
2009-10 0 0 0 0 7 7
2010-11 0 0 0 7 0 7
2011-12 0 32 0 32 15 79
2012-13 0 55 75 0 0 130
223
Raichur
2009-10 0 0 0 0 120 120
2010-11 0 0 112 0 0 112
2011-12 0 27 0 0 10 37
2012-13 0 53 0 0 9 62
331
Total 4083

11
CHAPTER – IV
MATERIAL AND METHODS
Methodology followed in evaluation:
The contact work was split into cluster of circles which are adjacent to each other by the Forest
department for the management convenience. Accordingly In each unit there were approximately
three to four circles comprising of 11 forest Divisions. In each division there were 800 to 1000
beneficiaries in each year. It was agreed that there should be 10 % sampling intensity covering at
least one activity in each division. The probabilistic sampling method was employed to select the
samples from each Range with 10% intensity. The samples selected were again checked to ensure the
coverage of all the ranges.
Defining the parameters for Evaluation: The following parameters were selected and defined to
assess the program uniformly throughout the study.
Plantation and seedlings distribution. The plantation was evaluated using the Performa
developed and used for the plantation evaluation by FDA and other centrally sponsored
schemes. The following parameters have been used to assess the plantations.
a) Survival %.
b) Collar diameter.
c) Vigor of the plantation.
d) Species suitability.
Eucalyptus and Casurina poles - Physical verification and usage types.
Sarala vale/ Astra valae and Smoke less chullas - Physical verification/use frequency/
Health impacts and fuel wood consumption rate.
LPG Stove - Physical verification/use frequency/ Health impacts and fuel wood consumption
rate

12
CHAPTER - V
ANALYSIS AND EVALUATION RESULTS
5.1 Evaluation of seedling distribution under SCP
Under the special component program distribution of seedlings to the beneficiaries was an important
activity. Its main objective is to supply seedlings of usufruct value to be planted in the vacant back
yard and to raise them to get the benefits. The seedlings supplied were mainly Mango, Sapota,
coconut, and such other fruit species seedlings. The number of seedlings supplied varied from 2 to
100 depending upon local conditions.
Evaluation of the success of the social security plantation was done by selecting more than 1022
beneficiaries in different divisions. For the purpose of presenting the results the circle level pooling
of data has been done, the division level results are given in the annexure.
The circles evaluated are Belgaum, Dharwad and Gulbarga.
5.1.1 Survey of 2 seedlings category:
Table showing the pattern of distribution of two seedlings
Year Division No. of Beneficiaries
(Reported) Received % Received
2009-10 Bijapur 133 133 100
2010-11 Dharwad 80 74 92
2009-10 Gokak 275(52 surveyed) 52 (surveyed) 100 (against 52)
2009-10 Bagalkot 121(111 surveyed) 111 100 (against 111)
2009-10 Raichur 110 103 93.63
2009-10 Belgaum 403(397 surveyed) 397 100 (against 397)
2010-11 Bidar 61 61 100
2010-11 Gulbarga 9 9 100
(a) Evaluation of survival of seedlings: The evaluation was done by selecting 10% sample from
the total number of beneficiaries. House to House survey was done to verify the physical
execution of the program. The other important aspect of the evaluation was to assess the quality
of the execution and the success of the program. Under this program two seedlings have been
supplied.
(b) Physical verification of seedlings planted: The verification was done by making the door to
door visit. The results are tabulated below. Circle level results are presented by pooling the data.

13
Table showing beneficiaries receiving for 2 Seedlings category
Year Belgaum Bagalkot Bidar Gulbarga Dharwad Gokak Raichur Bijapur
2009-11 190 80 61 9 16 42 110 133
The figure in the parenthesis indicates the beneficiaries were not found*.
The survey has shown that the all the beneficiaries reported in the data base have actually received
two seedlings. The numbers of seedlings received were also found to be accurate. In Dharwad, 6
beneficiaries have not received the seedlings. In other divisions all the beneficiaries have received
the seedlings. The species supplied is mango and sapota coconut, teak.
Table showing beneficiaries received for 100 No: Seedlings category.
Year Belgaum Bagalkot Gokak Bidar Raichur Bijapur Gulbarga Dharwad
2009-10 207 31 9 15 22 9 13 6
The verification of the100 seedlings supplied to beneficiaries has been found accurate for all the
beneficiaries. The seedlings supplied are mango, coconut and sapota.
(b) Survival rate. The survival rates were counted by observing the seedlings surviving in the field.
The table gives the survival rate for different circle. To calculate the survival all the seedlings
supplied under the program have been counted and the survival rate has been calculated.
Table showing survival % in two seedlings scheme:
Year Belgaum Bagalkot Bidar Gulbarga Dharwad Gokak Raichur Bijapur W. Avg
2009-11 84 48 9.83 5.5 20 26.19 57.72 0 39.61%
Results: The survey has shown that the survival of seedlings varying from 0 -84% across divisions.
Bijapur recorded 100% mortality. However the lowest survival was found in Gulbarga with 5.5%
and the highest in Belgaum with 84%. The overall survival rate ( estimated by calculating the
weighted average)is 39.61%.

14
Graph representing survival percentage among Divisions:
5.1.2 Survey of 100 seedlings category:
(c) Survival of plantation of 100 seedlings category.
Year Belgaum Bagalkot Gokak Bidar Raichur Bijapur Gulbarga W. Avg
2009-10 1.8 17.62 34.33 6.13 56.13 21.66 0.76 9%
The survival rate of the seedlings has shown that the survival rate of seedlings is very poor in many
divisions except in Belgaum and Dharwad where the rainfall is very good. In other drier divisions
like Bagalkot, Gulbarga and Bidar the survival rate is very low which needs a proper strategic level
planning and improvement. The overall weighted average is 9%.
Graph showing survival percentage among Divisions (100 Seedlings category):
0
10
20
30
40
50
60
70
80
90
Belgaum Bagalkot Bidar Gulbarga Dharwar Gokak Raichur
Pe
rce
nta
ge(%
)
Divisions
0
10
20
30
40
50
60
Belgaum Bagalkot Gokak Bidar Raichur Bijapur Gulbarga
Pe
rce
nta
ge(%
)
Divisions

15
(a) Suitability of species. The beneficiaries have expressed that un-suitability of species
to the soil and local climate as one reason for the failure. Sapota and mango was not
suited to drier climate. Similarly Amla and Jackfruit requires good rainfall to establish
and survive. Mango was the most preferred species and its survival rate is
comparatively higher compared to other species.
(b) Beneficiaries’ choice. Beneficiaries preferred species of different kind than what has
been supplied.
(c) Suitability of land. The suitability of land was another factor that was examined, It
appears the land where the social security plantations have been raised are unsuitable
for tree cultivation as they are very shallow and lack any organic matter.
(d) Size of the seedlings. Most of the places they were smaller than one meter in height.
(e) Replacement. There were no seedlings for replacement.
(f) It is essential to integrate the follow-up and after care into the program. The
incentives may be linked to the program implementation.
Species survival assessment: The species survival rate was assessed based on the date collected.
The following table gives the species survival rate in different circles.
i) Mango. In Belgaum the mango was found to have 90% rate of survival compared
to sapota and coconut. However in Bijapur, Bagalkot, Gulbarga the survival rate
is as low as 0-20%
ii) Coconut. Coconut supplied in Belgaum had 84% success. In other divisions it was
not supplied
iii) Sapota recorded very low survival rate in all divisions.
Key findings:
Low survival rates. The overall survival rate is very poor and does not have any impact on the
beneficiaries. The scheme objectives are good but needs a good package and protocol to control the
quality of the implementation.
1. Viability of holdings. Supplying 2 to 10 seedlings may be avoided as they are not viable
for the maintenance.
2. Among different species supplied Mango is doing well with more than good survival.
Others particularly Sapota and Jamoon have not done well.
3. In very drier climate supplying Drumstick and Zizyphus (two year old grafted seedlings)
may be very promising than supplying mango seedlings.

16
5.2 Supply of Energy saving devices
Under the special component program the supply of smokeless chullas of different types has been
undertaken, as part of the evaluation the assessment of the impact of the program and the physical
verification of assets distributed has been given in the table below.
5.2.1 Sarala valae, Astra valae and Smokeless chullas:
(a) Physical verification of Assets. The physical verification of assets distributed to beneficiaries
was verified by randomly selecting the beneficiaries (10%). The results of the survey are tabulated in
the table.
Table showing the distribution of saralavale assets:
Year Division No. of
Beneficiaries
Actually
Received in % % Received
2012-13 Gulbarga 75 75 100
2012-13 Bidar 184 148 89
2010-11 Raichur 112 110 99
2012-13 Gadag 158 158 100
2012-13 Dharwad 133 133 100
2012-13 Haveri 143 143 100
2011-12 Belgaum 138 138 100
2012-13 Belgaum 138 138 100
2011-12 Bijapur 125 125 100
2011-12 Bagalkot 180 180 100
2012-13 Bagalkot 405 405 100
Results and analysis. The survey has shown the distribution was as per the data supplied by the
department. There was almost 100% accuracy in the distribution of assets to the beneficiaries in the
sampled villages. However Bidar and Raichur the beneficiaries actually found having received the
assets are 89 and 99% respectively.
Specifications. The specification and quality of the assets were also evaluated and found that the
specifications were as per the approved standards. The size of the stove and the length of the pies
were also verified as part of the exercise.
(b) Patten of use. During the survey the beneficiaries were asked whether they are using the stoves
regularly, occasionally or not using at all to ascertain the pattern of use. The findings are tabulated
below in the table.

17
Table showing the pattern of use of Sarala Valae , Astra valae and Smokeless chullas.
Division Regular use (%) Occasional (%) Not used (%)
Belgaum 50.5 15.5 31.5
Bagalkot 53 39 5.4
Gokak 100 0 0
Gulbarga 9 55 38.6
Raichur 66.3 21.8 13
Bidar 40 6 54.8
Dharwad 83 14 2
Gadag 90.28 0 9.72
Haveri 63 7.4 28.73
% 49.0 17.55 33.45
Results. The survey has shown that the use of smokeless chulla was varying from 56-100% in
different divisions. The overall % of beneficiaries using the smokeless chulla regularly was 49% and
17.5% were found using it occasionally. The rest were found not using it at all.
Graph representing pattern of use of Smokeless chullas among Divisions:
0
10
20
30
40
50
60
70
80
90
100
Per
cen
tag
e (%
)
Divisions
Regular use (%)
Occasional (%)
Not used (%)
18
Belgaum. In Belgaum circle, Belgaum division was found to have 49% regular users and Bagalkot
with 56% users.
Gulbarga. In Gulbarga circle the non-users were highest in numbers with 38%. The reason could be
easy availability of agricultural waste as the fuelwood material.
Dharwad. Dharwad circle had the maximum use pattern in all the divisions with 90.28% in Gadag
and 83% in Dhaward.
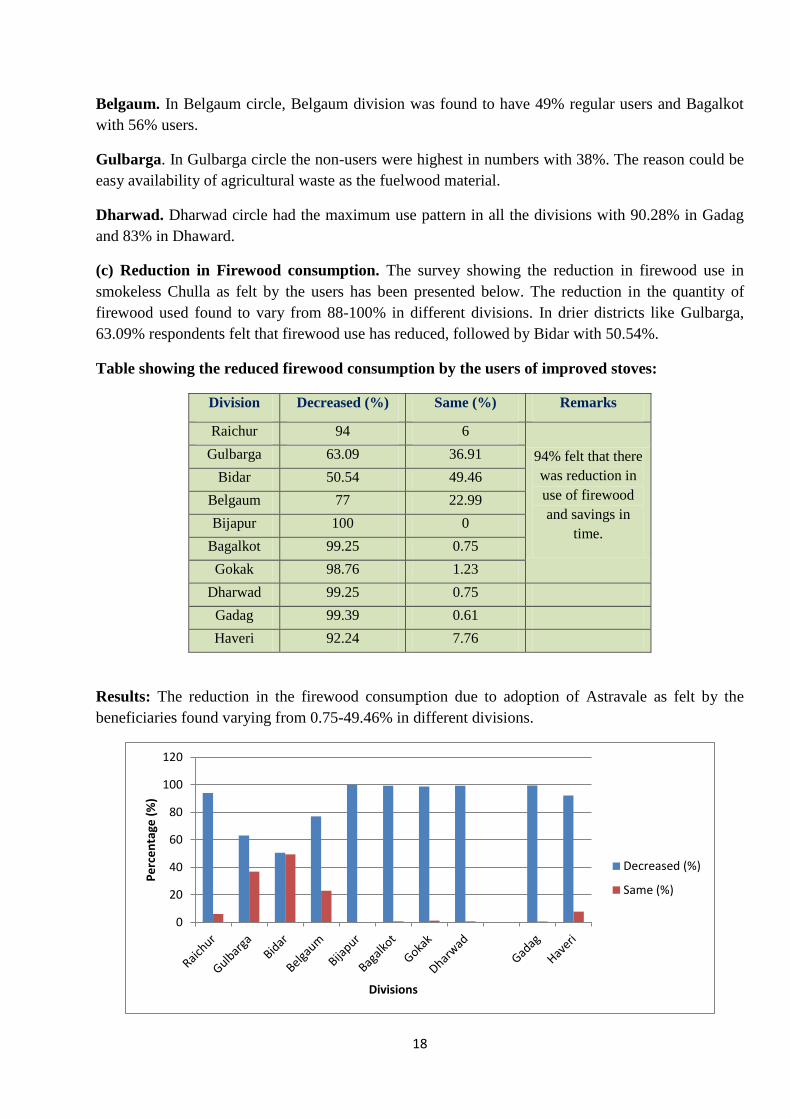
(c) Reduction in Firewood consumption. The survey showing the reduction in firewood use in
smokeless Chulla as felt by the users has been presented below. The reduction in the quantity of
firewood used found to vary from 88-100% in different divisions. In drier districts like Gulbarga,
63.09% respondents felt that firewood use has reduced, followed by Bidar with 50.54%.
Table showing the reduced firewood consumption by the users of improved stoves:
Division Decreased (%) Same (%) Remarks
Raichur 94 6
94% felt that there
was reduction in
use of firewood
and savings in
time.
Gulbarga 63.09 36.91
Bidar 50.54 49.46
Belgaum 77 22.99
Bijapur 100 0
Bagalkot 99.25 0.75
Gokak 98.76 1.23
Dharwad
99.25 0.75
Gadag 99.39 0.61
Haveri 92.24 7.76
Results: The reduction in the firewood consumption due to adoption of Astravale as felt by the
beneficiaries found varying from 0.75-49.46% in different divisions.
0
20
40
60
80
100
120
Pe
rce
nta
ge (
%)
Divisions
Decreased (%)
Same (%)

19
Gulbarga. In Gulbarga division 36.91% beneficiaries felt that there was perceptible reduction in the
firewood consumption due to the adoption of Astravale.
Bidar. In Bidar, 49.46% respondents felt that there was reduction in firewood consumption after
adoption of Astravale.
Raichur. In Raichur, 94% of the respondents felt that there was reduction in firewood consumption.
Belgaum. In Belgaum, 22.99% respondents felt that there was reduction in firewood consumption.
(D) Health impacts. The health impact was surveyed to know the impacts due to adoption of
Astravale resulting in the reduced indoor pollution. The results are tabulated and the represented in
the graphs.
Table showing health improvement status due to use of improved stoves
Division Improved Same
Raichur 94 6
Gulbarga 58.3 41.7
Bidar 49.54 50.55
Belgaum 71.5 28.46
Bagalkot 100 0
Bijapur 100 0
Gokak 100 0
Dharwad 100 0
Haveri 90.51 9.49
Gadag 99.39 0.7
Results: The results show that there is positive health impact due to use of Astravale and others
stoves. In Raichur 94% respondents felt positive impacts on the health followed by 90% and 80% in
Gulbarga and Bidar respectively. However in Bagalkot and Bijapur the respondents did not feel any
change in the health status.

20
Graph showing the health improvement status due to use of improved stoves.
(E) Time savings: The survey was conducted to assess the time saved due to use of the
smokeless assets and the respondents have said there was reduction in the time used for
cooking and firewood collection.
Table showing Time saved due to use of efficient stoves.
Division Improved Same
Raichur 94 6
Gulbarga 60.71 39.29
Bidar 50.54 49.46
Belgaum 82.11 17.88
Bagalkot 98.5 1.41
Bijapur 100 0
Gokaka 100 0
Dharwad 98.5 1.49
Haveri 91.37 8.63
Gadag 98.78 1.22
Results: The reduced time in both cooking and the firewood collection was varied from 25% to 50%
of their original time as recorded in the questionnaires. In Raichur, 94% beneficiaries felt that there
was reduction in cooking and firewood collection time. Among Gulbarga respondents 60% felt the
reduced time in cooking followed by 50% in Bidar.
0
20
40
60
80
100
120
Per
cen
tag
e (%
)
Divisions
Improved
Same

21
Graph showing Time saved due to use of efficient stoves
5.3 LPG kit
The LPG kit has been supplied to the beneficiaries in Bijapur and Bidar division to reduce the
firewood use by the beneficiaries and to adapt to the cleaner energy use practices. The evaluation
results are tabulated below.
Year Division No of
Beneficiaries
% of Beneficiaries
Receiving
% of Beneficiaries
Not Receiving
Remarks.
(Sample Size)
2010-11 Bidar 1049 97.85 2.15 105
2012-13 Bijapur 647 100 0 65
Pattern of use: The pattern of use was evaluated as regular, occasional and non-users of the LPG
kits. The results are tabulated below.
Table showing the pattern of use of LPG kits:
Year Division Regular users Occasional users Non users
2010-11 Bidar 30.10 19.35 50.53
2012-13 Bijapur 95.31 4.68 0
Results: In Bidar 30.10 % of beneficiaries were found using the LPG regularly. However the non
users were accounting for nearly 50.53% indicating low adoption rate. Further 19.5% beneficiaries
were found using occasionally.
Low adoption: The main reason for the low adoption is non availability of gas to the beneficiaries
which needs to be addressed before selecting the beneficiaries.
0
20
40
60
80
100
120
Raichur Gulbarga Bidar BelgaumBagalkot Bijapur Gokaka Dharwad Haveri Gadag
Per
cen
tag
e (%
)
Divisions
Improved
Same

22
5.4 Eucalyptus and Casuarinas Poles distribution.
Under SCP program Eucalyptus and Casuarinas poles have been distributed in Bagalkot division.
(a) Physical verification of assets: The evaluation has shown that there was 100 percent
beneficiaries had received the assets. The results are presented in the table below.
Table showing sampled beneficiaries receiving/ not receiving assets:
Division Year Beneficiaries Sample size % receiving Remarks
Bagalkot 2009-11 390 39 100 All the beneficiaries have received
a. Value addition. The survey was done to ascertain the value addition efforts made by the
beneficiaries. The results are tabulated below.
Division House use Crafts Agriculture Sold Not used
Bagalkot 21.05 0 0 0 78.94
The survey has shown that the eucalyptus poles were distributed in Bagalkot division to 390
beneficiaries. .Out of 39 sampled all were found receiving the benefits. The use pattern shows only
21.05% used the material for the household and the rests have not used the material for any other
purpose.
5.4 Solar lamp
Solar lamps have been distributed to beneficiaries to provide light to households which are not
connected by grid connected electricity supply.
(a) Physical verification of assets
Year Division % received % not received
2012-13 Bijapur 100 0
2011-13 Dharwad 93.55 6.45
2011-13 Gadag 100 0
2010-13 Haveri 100 0
2011-12 Bidar 96.16 3.84
2011-13 Gulbarga 100 0
2011-13 Raichur 100 0

23
Results: The physical verification was found to have 100% accuracy in all the divisions except in
Dharwad division, where 6.45% have not received the assets. Similarly in Bidar division also 3.84%
respondents had not received the assets.
Table showing the use of assets (Solar lamp)
Year Division Regular use (%) Occasional users (%) Not used
2012-13 Bijapur 41.6 25 33
2011-13 Dharwad 0 0 100
2011-13 Gadag 94 4.38 0.87
2010-13 Haveri 53.42 8.21 24.5
2011-12 Bidar 36.3 15.16 48.42
2011-13 Gulbarga 55.5 9.5 34.92
2011-13 Raichur 57.14 41.83 1.02
Graph showing the use of assets (Solar lamp):
0
20
40
60
80
100
120
Bijapur Dharwar Gadag Haveri Bidar Gulbarga Raichur
Pe
rce
nta
ge(%
)
Division
Regular use(%)
Occasional users(%)
Not used

24
Results and analysis:
Bijapur. 41% of the respondents in Bijapur have stated that they use the solar lamps regularly, while
33% are not using it due to technical issues in the lamps. The rest are using it occasionally. Provision
for servicing of the lamps may be necessary after providing the assets to the beneficiaries.
Dharwad. No beneficiary is using the solar lamps due to servicing problem.
Gadag. The majority of the beneficiaries are using the solar lamps, and only 4.38% are not using it.
Haveri. In Haveri, 53.42% respondents are using and the rest are not able to use due to servicing
problem.
Bidar. In Bidar, 36.3% respondents are using the solar lamps and the rests are not able to use.
Gulbarga. In Gulbarga, 55.5% are using and 34.92% are not using due to some problems in
servicing.
Raichur. In Raichur, 57.14% are using it regularly and 41.83% are using it occasionally.

25
CHAPTER – VI
OBESERVATIONS AND IMPACT ANALYSIS
The activities undertaken under the special component program were analysed for their impact on the
objectives of the scheme.
1. Distribution of seedlings: The distribution of seedlings was one of the important
activities of the program; the assessment of the success rate has shown very poor survival
of seedlings which has not achieved the objective of the program. However the program
has done relatively netter in the high rainfall areas as compared to low rainfall areas.
Two seedlings per family looks very low as there are not enough seedlings to give
minimum success rate. Considering the mortality rate minimum ten seedlings are required
to ensure survival of two seedlings.
2. Smokeless chullas: The distribution of smoleless chullas and its usage has shown very
encouraging results with more beneficiaries showing interest to use them due to their
efficiency factor. This is also well demonstrated as the assets are well maintained and
retained without any damage.
3. Environment impacts: The use of efficient chillas has helped to reduce the firewood
consumption resulting in the reduced emission. The reduction in the indoor pollution has
improved the health of women who were affected by the indoor pollution.
4. Economic benefits to the beneficiaries: The use of smokeless chullas has saved the time
of firewood gathering which is used for the gainful employment.
5. Distribution of Bamboos/poles: The supply of bamboo and the poles was given to the
beneficiaries has helped the beneficiaries to use the materials for various uses including
the value addition, The value addition for making bamboo article has helped some
families in earning additional income. The material also has been used for the house use
and other agriculture purpose.

26
CHAPTER – VII
RECOMMENDATIONS
Seedling Distribution: The activity covering supply of two usufructs seedlings has not fared well
due to inherent problems in the concept of the program. Supplying of two seedlings assuming 100%
survival is a false notion. Further why only two seedlings, as there are many schemes within the
department, where supply is free and unrestricted. Under the newly started program “Krishi
Protsaha”, incentives are given to encourage farmers to grow more trees, which is better
conceptualized and structured than the “two seedlings” concept under SSP. Similarly 100 seedlings
program may be linked to incentives as done in “Krishi Protsaha”program.
1. Supply of Improved stoves: LPG kit linked to societies organizing gas procurement is doing
well in some divisions. Similar structured and organized supplying LPG Kit with assured gas
supply may be effective.
Sarala valae/ Smokeless Chullas: These activities need good servicing and
maintenance support to improve the program. Better monitoring and training should
be linked to this program.
Supply of Bamboo: Only artisans who can add value to the raw material should be
encouraged. Training, skill development and marketing must be linked under this
program
2. Demand based assets/ Benefits: KFD should have package of activities/ programs/ assistance
linked to site specific needs and demand. Beneficiaries may be given range of options to
choose the benefit.
3. Evaluation of Program :
The activities like seedlings / social security plantations must be evaluated after 5
years to assess the success rate. Further evaluation at 10th
year would be useful to
know the impact of the program.
Smokeless Chullas / Bamboo: These activities must be evaluated annually to verify
the assets.
4. Concurrent monitoring: Concurrent monitoring of the program is very helpful to take up mid-
course correction of the program.
Methodology:
1. 10% sampling intensity is too high: The robust statistical design must be adopted to
determine the sample size and a statistical package (methodology) must be part of
TOR. All the out sourced agencies doing evaluation should adopt the same method.
2. Questionnaires/ Formats: Data formats and Questionaries’ and Statistical tools must
be standardized and adopted.
3. Evaluation against standards or Base lines: To assess the components of the programs,
it is better to fix standards and base line indicators against which evaluation must be
done.
4. Data Formats: The data formats at division level must be entered in a uniform format,
so that classification and assessment and adoption of filters are easier.

27