CHAPTER FIVE: EXTREME PRECIPITATION INDICES. · 2009-12-22 · 111 CHAPTER FIVE: EXTREME...
21
111 CHAPTER FIVE: EXTREME PRECIPITATION INDICES. 5.1. INTRODUCTION. On September 14 1988, Hurricane Gilbert hit Cancún on the east coast of the Yucatan Peninsula, and a few days later (on September 17) caused severe damage in Monterrey in north-eastern Mexico. Gilbert is considered the storm of the twentieth century with records for size, straightness of track, lowest atmospheric pressure and total energy (Meyer-Arendt, 1991). At the centre of Gilbert the pressure reached an outstanding low of 888 mb. The beginning of the twentieth-first century has also shown in Mexico one of the most dangerous faces of anthropogenic climate change: weather extremes. In the Atlantic Ocean Basin, 2005 was the most active hurricane season in history (Lawrimore et al., 2005). Several southern Mexican states (Yucatan, Chiapas, Oaxaca, Puebla and Veracruz) were hit by Stan from October 1 to 5 (Hernández-Unzón and Bravo, 2005a), and it was not long (October 22) before Wilma, the strongest hurricane on record, struck the Yucatan Peninsula. This storm set the lowest atmospheric pressure (882 mb) ever recorded, and the highest 24 hrs accumulated precipitation in Mexico (1576 mm at Isla Mujeres), seriously damaging the touristic infrastructure of Cancún (Hernández-Unzón and Bravo, 2005b). These sorts of events illustrate the delicate balance of the climate system between extremes and average weather. Extreme weather events fall within the "probability distribution" fringes of meteorological variables; most of the time revealing an "unexpected" aspect of the known distributional patterns for a location or region. Seeking simplicity in the description of rainfall extreme indices for 15 stations with daily precipitation (Table 5.1; see also Table 3.2 and Fig. 3.6), we partition the data into two different aspects: one dealing with depth or intensity (amount and rate) and the other with frequency (number of occurrences). We will then examine both sets of indices using linear correlation (with time) involving Kendall’s tau (see section 4.5.1). For some of the most important statistically significant correlations (as Kendall’s tau does not compute the trend magnitude), additionally we plot the least-squares linear trends. Natural mechanisms that partially control their patterns are discussed in relation to all these
Transcript of CHAPTER FIVE: EXTREME PRECIPITATION INDICES. · 2009-12-22 · 111 CHAPTER FIVE: EXTREME...

111
CHAPTER FIVE: EXTREME PRECIPITATION INDICES.
5.1. INTRODUCTION.
On September 14 1988, Hurricane Gilbert hit Cancún on the east coast of the Yucatan
Peninsula, and a few days later (on September 17) caused severe damage in Monterrey in
north-eastern Mexico. Gilbert is considered the storm of the twentieth century with
records for size, straightness of track, lowest atmospheric pressure and total energy
(Meyer-Arendt, 1991). At the centre of Gilbert the pressure reached an outstanding low
of 888 mb. The beginning of the twentieth-first century has also shown in Mexico one of
the most dangerous faces of anthropogenic climate change: weather extremes. In the
Atlantic Ocean Basin, 2005 was the most active hurricane season in history (Lawrimore
et al., 2005). Several southern Mexican states (Yucatan, Chiapas, Oaxaca, Puebla and
Veracruz) were hit by Stan from October 1 to 5 (Hernández-Unzón and Bravo, 2005a),
and it was not long (October 22) before Wilma, the strongest hurricane on record, struck
the Yucatan Peninsula. This storm set the lowest atmospheric pressure (882 mb) ever
recorded, and the highest 24 hrs accumulated precipitation in Mexico (1576 mm at Isla
Mujeres), seriously damaging the touristic infrastructure of Cancún (Hernández-Unzón
and Bravo, 2005b). These sorts of events illustrate the delicate balance of the climate
system between extremes and average weather. Extreme weather events fall within the
"probability distribution" fringes of meteorological variables; most of the time revealing
an "unexpected" aspect of the known distributional patterns for a location or region.
Seeking simplicity in the description of rainfall extreme indices for 15 stations with daily
precipitation (Table 5.1; see also Table 3.2 and Fig. 3.6), we partition the data into two
different aspects: one dealing with depth or intensity (amount and rate) and the other with
frequency (number of occurrences). We will then examine both sets of indices using
linear correlation (with time) involving Kendall’s tau (see section 4.5.1). For some of the
most important statistically significant correlations (as Kendall’s tau does not compute
the trend magnitude), additionally we plot the least-squares linear trends. Natural
mechanisms that partially control their patterns are discussed in relation to all these

112
extreme parameters. The study seeks to find coherent spatial patterns of change among
the indices of precipitation extremes, especially when comparing local against regional
scales as in the case of the PRCPTOT index (see Table 3.1), or within the resulting
regions of the Principal Component Analysis (Section 4.2.1). Therefore, one of the main
targets of this chapter (of the indices of rainfall extremes) is the identification of
consistencies among several statistically significant correlations, of one single station or a
group of stations.
In the second part of the chapter, the hypothesis of a climatic transition between different
parts of Mexico is explored further. The Tropic of Cancer has been defined as a
geographical threshold for this purpose. Statistically significant correlations of the
precipitation extreme indices with time are contrasted either side of this imaginary line
for both positive/negative correlations and wet/dry conditions.
5.2. DISCUSSION.
For the purposes of this chapter, the rainfall extreme indices (defined in Table 3.1 of
Section 3.3.4) can be classified into two groups: one group measures the precipitation
depth (mm) or intensity (mm/day) (PRCPTOT, SDII, R95P, R99P, RX1day and RX5day)
and the other calculates the frequency (number of cases) of the index exceeding or not
exceeding its defined threshold (CDD, CWD, R10mm, R20mm). It is expected that this
separation of magnitude and frequency can give an additional insight into the often subtle
differences of the climatic regions across Mexico (Table 5.1).
5.2.1. PRECIPITATION EXTREME INDICES.
As PRCPTOT is probably the most important index reflecting rainfall variations over the
entire year, the discussion of extremes will start with the changes of this parameter at
local and regional levels. At regional scales (recall the methods to calculate regional
series see Section 3.3.3), the most striking characteristic in this index [Fig 5.1. d)] is that
significant negative correlations are observed in two different southern regions. The fist
is decreasing regional precipitation [Fig 5.1. d)] over the Michoacán coastal

113
Table 5.1. List of temperature stations (with data from 1941 to 2001) show correlations (Kendall’s tau) between
the precipitation extreme indices with time, that are statistically significant at the 5 and 1% level. * Stations
numbers are in correspondence with Table 3.2 and Fig. 3.6.
Number* STATION STATE Non Significant Correlations
2 PRESA RODRIGUEZ BCN R99P, RX1day, RX5day, CDD, CWD, R10mm, R25mm
7 SAN JOSE DEL CABO BCS PRCPTOT, SDII, R95P, R99P, RX1day, RX5day, CDD, CWD, R25mm
10 CHAMPOTON CMP R99P, RX5day, R10mm, R20mm, R25mm
11 OJINAGA CHIH PRCPTOT, R95P, R99P, RX5day, R10mm, R20mm, R25mm
12 FCO. I. MADERO DUR PRCPTOT, SDII, R95P, R99P, RX1day, RX5day, CDD, CWD, R10mm, R20mm, R25mm
13 GUANACEVI DUR PRCPTOT, R95P, R99P, RX1day, RX5day, CDD, CWD, R10mm, R20mm, R25mm
16 CELAYA GTO PRCPTOT, SDII, R95P, R99P, RX1day, RX5day, CDD, CWD, R10mm, R20mm, R25mm
17 IRAPUATO GTO PRCPTOT, SDII, R95P, R99P, RX1day, RX5day, CDD, CWD, R10mm, R20mm, R25mm
20 APATZINGAN MICH PRCPTOT, R95P, R99P, RX1day, RX5day, CDD, CWD, R10mm, R25mm
27 JUCHITAN MICH PRCPTOT, SDII, R95P, R99P, RX1day, RX5day, CDD, CWD, R10mm, R20mm, R25mm
31 BADIRAGUATO SIN PRCPTOT, SDII, R95P, R99P, RX1day, RX5day, CDD, CWD, R10mm, R20mm, R25mm
32 YECORA SON PRCPTOT, SDII, R95P, R99P, RX1day, RX5day, CDD, CWD, R10mm, R20mm, R25mm
33 SAN FERNANDO TAM PRCPTOT, SDII, R95P, R99P, RX1day, RX5day, CDD, CWD, R10mm, R20mm, R25mm
34 ATZALAN VER PRCPTOT, SDII, R95P, R99P, RX1day, RX5day, CDD, R10mm, R20mm, R25mm
35 LAS VIGAS VER PRCPTOT, SDII, R95P, R99P, RX1day, RX5day, CDD, CWD, R10mm, R20mm, R25mm
Table 5.2. List of temperature stations (with data from 1941 to 2001) for which weather extreme indices show
correlations (Kendall’s tau) between the precipitation extreme indices with time that are no statistically
significant. * Stations numbers are in correspondence with Table 3.2 and Fig. 3.6.

114
area (Region 10 in table 4.1) which is statistically significant at the 1% level. There are
two geographical features of this region: the first is that it is located on the Mexican
Southern Pacific Coast, so the Pacific Ocean certainly acts as one of the modulators of
climatic variations in the area (Mitchell et al., 2002). The second characteristic is that the
area is a well known forest zone (Villers-Ruiz and Trejo-Vazquez, 1998). The second is
the Southeast rainforest region (Region 9 in table 4.1) which also has a negative
correlation and it is statistical significant at the 5% level. This is an area of dense
vegetation (García, 1988), within one of the wettest parts of the country. The effects of
deforestation are a research topic that could be explored, as both regions are clearly
reflecting that the precipitation is decreasing (Masera et al., 1997) that can be caused by
the loss of vegetation. But, as will be addressed in Chapter 7, the El Niño Southern
Oscillation (ENSO) phenomenon is another atmospheric modulator, complicating the
understanding of the causes which control these climatic regions.
At the local level [(Fig 5.1. c)], in opposition to what has been observed with the regional
PRCPTOT averages [(Fig 5.1. d)], a positive and significant correlation (with time) is
evident for a number of stations. For Champotón, in Campeche State (station number 10
in Table 5.1, see Section 3.3.4.1) the correlation is significant at the 1% level and for
Presa Rodríguez in Tijuana at 5% (station number 5 in Table 5.1). It is interesting that
both rainfall stations are located at the heads of Peninsulas: Champotón within the
Yucatan and Tijuana for the Baja California Peninsula respectively. The rainfall station at
Champotón has been added for this analysis of extremes; it was not considered during the
Principal Component Analysis (PCA) due to completeness and minimum time-series
length conditions not being fulfilled. In Chapter 4, we saw that only during the dry season
(November to April) could a climatic-related region be isolated here, as a result of the
Principal Components Analysis (PCA). For this coastal area in the Gulf of Mexico
Hurricanes during the wet season affect the annual totals (Englehart and Douglas, 2002),
often leading to a completely different rainfall pattern when compared with the remaining
stations across the country (see section 4.2). For Yecora station (number 32 in Table 5.1)
within the North American Monsoon Region (NAMR) or Mexican Monsoon Region (see

115
Fig. 5.1. Extreme precipitation indices maps. A Kendall’s tau-b (linear) correlation analysis has been applied
between the precipitation extreme indices and time. Circles red represent a positive and in blue negative
correlations.

116
Fig. 5.1. Extreme precipitation indices maps. A Kendall’s tau-b (linear) correlation analysis has been applied
between the precipitation extreme indices and time. Circles red represent a positive and in blue negative
correlations.

117
section 4.2), a positive correlation can be observed as well but this time it is not
statistically significant.
One index that takes into account not only the total amount of precipitation throughout
the year but also reflects changes in daily rainfall is the Simple Daily Intensity Index
(SDII). SDII [(Fig 5.1 l)] combines the total amount of annual precipitation and the
number of days when rainfall (greater than 0.1 mm) actually occurs (see Table 3.1 in
Section 3.3.4). A roughly longitudinal transition can be observed in the results, with an
east-west differentiation relatively clear. Positive correlations along the Pacific Coast are
evident, suggesting that the ocean can be partly modulating the spatial pattern of SDII.
For all the stations along the western side of the country the statistical significance
remains below the 5% level. Contrasting negative correlations are observed along the
eastern side, the partial connection with the Gulf of Mexico is weaker when compared
with the former results along the Pacific Ocean. One pair of stations, Champotón and
Ojinaga (station number 10 and 11 in Table 5.1) is below the 1% statistical level of
significance for the SDII index. Champotón lies within an area frequently affected by the
passing of hurricanes along the Atlantic coast (Jauregui, 2003).
The R95P and R99P [Fig 5.1. h) and i)] indices are used to measure heavy precipitation
that exceeds the 95 and 99 percentile thresholds. Statistically significant negative
correlations (with time) are found at Las Vigas (station number 35 in Table 5.1) for both
indices: at 1% level of significance for R95P and 5% for R99P. As observed for local
PRCPTOT [(Fig 5.1. c)], there is a marked positive correlation for the stations located at
the head of the Peninsulas (Champotón and Tijuana, see Table 5.1 and Fig. 3.6) when
R95P is considered. It can be stated that positive correlations are observed at the
Peninsulas and negative correlations for those stations which are more continental.
Very heavy or intense rainfall is measured using the RX1day and RX5day [(Fig 5.1. j)
and k)] indices, respectively. Clear negative correlations are observed for Las Vigas
(number 35 in table 3.2), which is part of a large rainforest region. Although both
extreme indices for this station are statistically significant, it is the RX1day index that lies
118
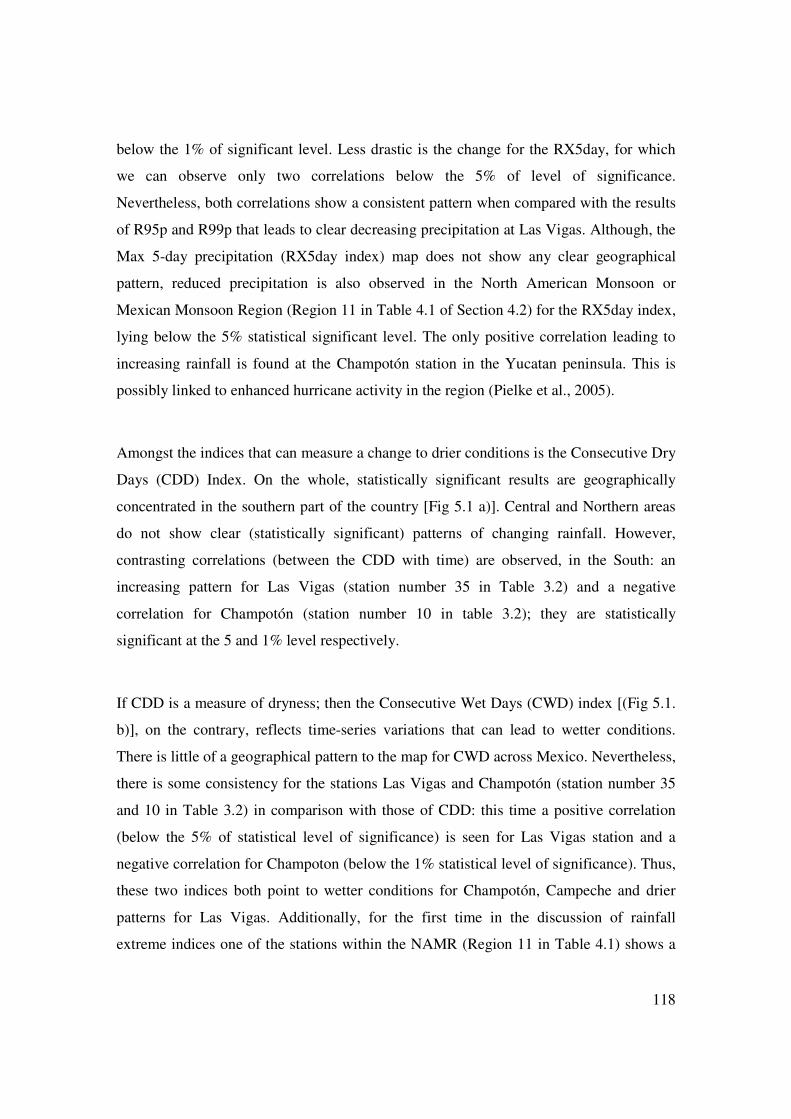
below the 1% of significant level. Less drastic is the change for the RX5day, for which
we can observe only two correlations below the 5% of level of significance.
Nevertheless, both correlations show a consistent pattern when compared with the results
of R95p and R99p that leads to clear decreasing precipitation at Las Vigas. Although, the
Max 5-day precipitation (RX5day index) map does not show any clear geographical
pattern, reduced precipitation is also observed in the North American Monsoon or
Mexican Monsoon Region (Region 11 in Table 4.1 of Section 4.2) for the RX5day index,
lying below the 5% statistical significant level. The only positive correlation leading to
increasing rainfall is found at the Champotón station in the Yucatan peninsula. This is
possibly linked to enhanced hurricane activity in the region (Pielke et al., 2005).
Amongst the indices that can measure a change to drier conditions is the Consecutive Dry
Days (CDD) Index. On the whole, statistically significant results are geographically
concentrated in the southern part of the country [Fig 5.1 a)]. Central and Northern areas
do not show clear (statistically significant) patterns of changing rainfall. However,
contrasting correlations (between the CDD with time) are observed, in the South: an
increasing pattern for Las Vigas (station number 35 in Table 3.2) and a negative
correlation for Champotón (station number 10 in table 3.2); they are statistically
significant at the 5 and 1% level respectively.
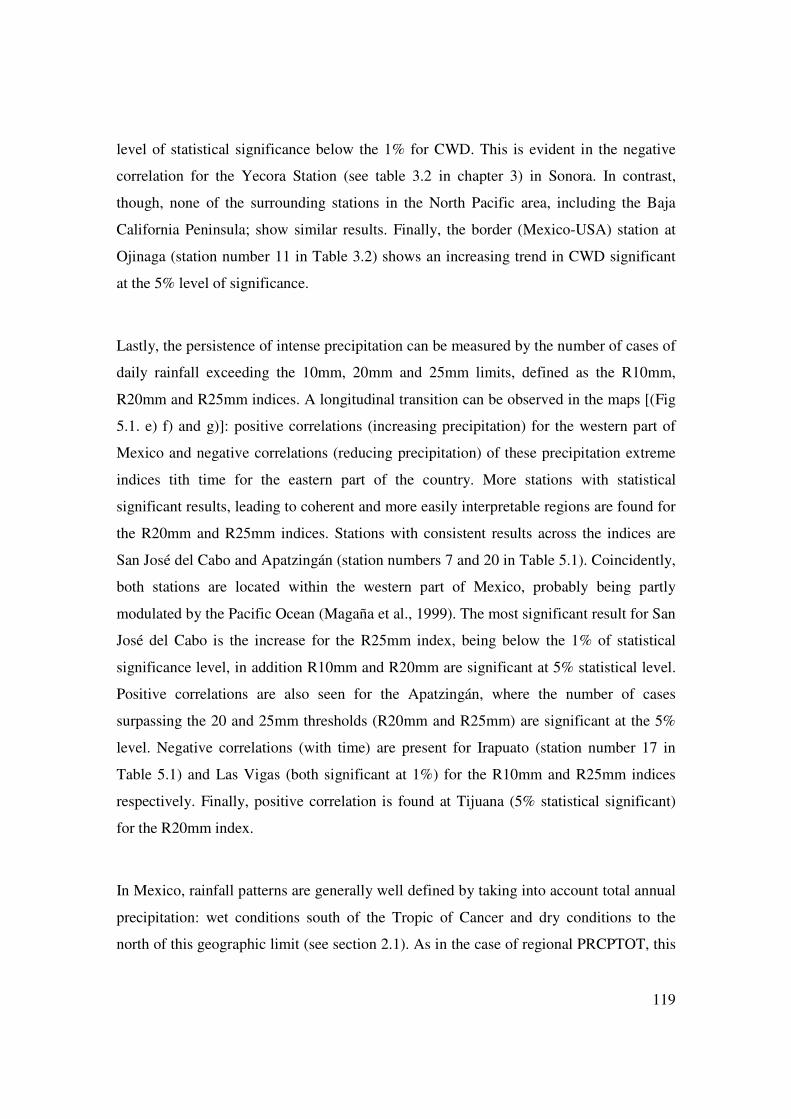
If CDD is a measure of dryness; then the Consecutive Wet Days (CWD) index [(Fig 5.1.
b)], on the contrary, reflects time-series variations that can lead to wetter conditions.
There is little of a geographical pattern to the map for CWD across Mexico. Nevertheless,
there is some consistency for the stations Las Vigas and Champotón (station number 35
and 10 in Table 3.2) in comparison with those of CDD: this time a positive correlation
(below the 5% of statistical level of significance) is seen for Las Vigas station and a
negative correlation for Champoton (below the 1% statistical level of significance). Thus,
these two indices both point to wetter conditions for Champotón, Campeche and drier
patterns for Las Vigas. Additionally, for the first time in the discussion of rainfall
extreme indices one of the stations within the NAMR (Region 11 in Table 4.1) shows a
119
level of statistical significance below the 1% for CWD. This is evident in the negative
correlation for the Yecora Station (see table 3.2 in chapter 3) in Sonora. In contrast,
though, none of the surrounding stations in the North Pacific area, including the Baja
California Peninsula; show similar results. Finally, the border (Mexico-USA) station at
Ojinaga (station number 11 in Table 3.2) shows an increasing trend in CWD significant
at the 5% level of significance.
Lastly, the persistence of intense precipitation can be measured by the number of cases of
daily rainfall exceeding the 10mm, 20mm and 25mm limits, defined as the R10mm,
R20mm and R25mm indices. A longitudinal transition can be observed in the maps [(Fig
5.1. e) f) and g)]: positive correlations (increasing precipitation) for the western part of
Mexico and negative correlations (reducing precipitation) of these precipitation extreme
indices tith time for the eastern part of the country. More stations with statistical
significant results, leading to coherent and more easily interpretable regions are found for
the R20mm and R25mm indices. Stations with consistent results across the indices are
San José del Cabo and Apatzingán (station numbers 7 and 20 in Table 5.1). Coincidently,
both stations are located within the western part of Mexico, probably being partly
modulated by the Pacific Ocean (Magaña et al., 1999). The most significant result for San
José del Cabo is the increase for the R25mm index, being below the 1% of statistical
significance level, in addition R10mm and R20mm are significant at 5% statistical level.
Positive correlations are also seen for the Apatzingán, where the number of cases
surpassing the 20 and 25mm thresholds (R20mm and R25mm) are significant at the 5%
level. Negative correlations (with time) are present for Irapuato (station number 17 in
Table 5.1) and Las Vigas (both significant at 1%) for the R10mm and R25mm indices
respectively. Finally, positive correlation is found at Tijuana (5% statistical significant)
for the R20mm index.
In Mexico, rainfall patterns are generally well defined by taking into account total annual
precipitation: wet conditions south of the Tropic of Cancer and dry conditions to the
north of this geographic limit (see section 2.1). As in the case of regional PRCPTOT, this

120
characteristic opens the possibility of exploring this climatic transition for weather
extreme indices as well.
Is there also a latitudinal transition when we study the rainfall extreme indices? Do they
preserve the contrasting picture observed for the total annual precipitation (regional
PRCPTOT)? Are these patterns following what has been shown for PCA regions (see
section 4.2.1)? Table 5.1 shows the distribution of positive and negative Kendall’s tau
correlations, when levels are statistically significant at 5 or 1%. The patterns of
positive/negative correlations with time show the (defined) climatic transition. This can
be clearly perceived with statistically significant positive correlations at 1%, in which the
number of cases clearly changes from South to North (3 to 0). Champotón (station
number 10 in table 5.1) has two statistically significant indices: CWD and PRCPTOT;
and R25mm is the statistically significant index for San José del Cabo (station number 7
in Table 5.1). The same contrasting pattern is true when values with negative correlations
statistically significant at the 1% level (9 cases) are greater compared to their
counterparts at 5% (2 cases). In general, positive correlations that are statistically
significant at 5% are more frequent than those at 1% (14 versus 3). In fact, about one half
of the numbers of total cases (29 statistically significant correlations) are concentrated in
the positive correlations at 5% (14), and around one third with negative correlations
significant at 1% (9). Therefore, together they account for about 75% of the cases in total.
South to North contrasting conditions are also evident when statistically significant levels
are studied (Table 5.2). The climatic transition is better observed when positive
correlations at 5% (8 to 6) are compared to those at 1% (3 to 0), the difference is more
drastic for the latter. The eight statistically significant positive correlations at the 5%
level in the South are distributed as follows: San José del Cabo (R10mm, and R20mm),
Champotón (R95P, RX1day), Apatzingán (R20mm, R25mm, and SDII) and Las Vigas
(CDD). Values are greater in the South for both 5 and 1% significant levels regardless of
whether positive/negative correlations (of the precipitation extreme indices with time) are
considered.
121
North South Total
Pos. Corr. (5%) 6 8 14
Pos. Corr. (1%) 0 3 3
Neg. Corr. (5%) 1 2 3
Neg. Corr. (1%) 3 6 9
Total 10 19 29
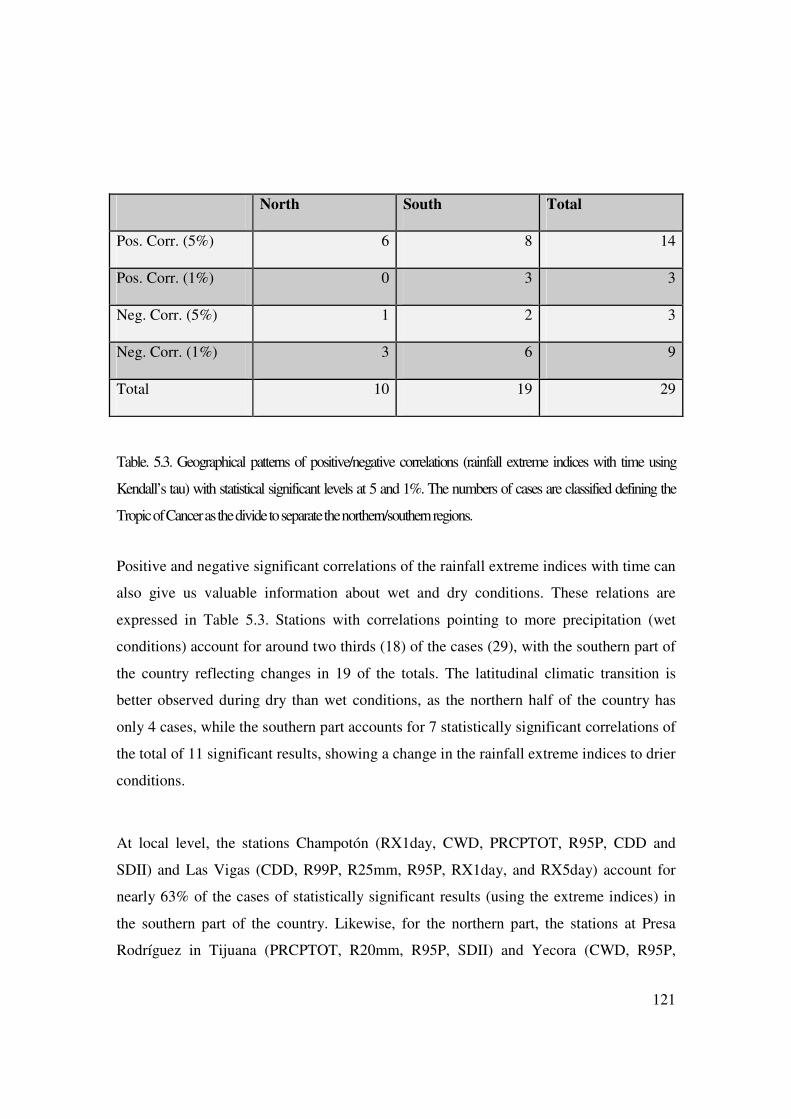
Table. 5.3. Geographical patterns of positive/negative correlations (rainfall extreme indices with time using
Kendall’s tau) with statistical significant levels at 5 and 1%. The numbers of cases are classified defining the
Tropic of Cancer as the divide to separate the northern/southern regions.
Positive and negative significant correlations of the rainfall extreme indices with time can
also give us valuable information about wet and dry conditions. These relations are
expressed in Table 5.3. Stations with correlations pointing to more precipitation (wet
conditions) account for around two thirds (18) of the cases (29), with the southern part of
the country reflecting changes in 19 of the totals. The latitudinal climatic transition is
better observed during dry than wet conditions, as the northern half of the country has
only 4 cases, while the southern part accounts for 7 statistically significant correlations of
the total of 11 significant results, showing a change in the rainfall extreme indices to drier
conditions.
At local level, the stations Champotón (RX1day, CWD, PRCPTOT, R95P, CDD and
SDII) and Las Vigas (CDD, R99P, R25mm, R95P, RX1day, and RX5day) account for
nearly 63% of the cases of statistically significant results (using the extreme indices) in
the southern part of the country. Likewise, for the northern part, the stations at Presa
Rodríguez in Tijuana (PRCPTOT, R20mm, R95P, SDII) and Yecora (CWD, R95P,

122
RX5day) together have around 64% of the totals of statistical significant results.
Therefore, for both the north and south, only two stations have about two thirds of the
indices with significant correlations.
North South Total
Wet 6 12 18
Dry 4 7 11
Total 10 19 29
Table. 5.4. Geographical patterns of positive/negative correlations (rainfall extreme indices with time using
Kendall’s tau) with statistical significant levels at 5 and 1%. The number of cases are classified defining the
Tropic of Cancer as the divide to separate northern/southern results.
5.2.2. LINEAR TREND ANALYSIS.
Until now, for non-parametric correlations applied in this chapter on rainfall extreme
indices, statistically significant results and spatial analyses have shown us a geographical
(north-south) transition in the results. Giving the impossibility of the Kendall-tau test (see
section 3.3.5) to calculate the magnitude of the trends, we are now going to study the
trends and plots computed by the R software (section 3.3.4) utilizing least-squares
fittings. A positive autocorrelation can affect severely the detection of a significant trend,
leaving the calculation unreliable (Zhang et al., 2005). In order to test this possibility,
serial correlation magnitudes were computed using SPSS 14.0 before the estimation of
significant trends, and none of them show a considerable positive autocorrelation able to
influence the results.

123
There is one characteristic that both halves of Mexico (defining the tropic of Cancer as
the geographic divide) share: two stations concentrate about two thirds of the total of the
statistically significant correlations (Table 5.1). Champotón and Las Vigas in the
southern half and Presa Rodríguez and Yecora in the northern half of the country were
chosen to evaluate the trends for several rainfall extreme indices. The most prevalent
indices among the stations were selected for this assessment. For instance, R95P has
statistically significant results in all the stations evaluated, and two of the most important
indices PRCPTOT and SDII (see table 3.1) in three of the four stations considered.
The selected indices also give different insights about the secular changes of precipitation
in Mexico, like changes in totals (PRCPTOT) or in percentiles as is the case for the R95P
and R20mm indices. In this sense, it is expected that the chosen indices will be sufficient
to get information on the rainfall indices variations across Mexico, and also to test the
hypothesis of (north-south) climatic transition in the country.
The first rainfall extreme index to be analysed is the annual total precipitation
(PRCPTOT see Table 5.1). This is one of the most extensively analysed indices in
climatology, in which we can clearly observe the differences in the rainfall amounts
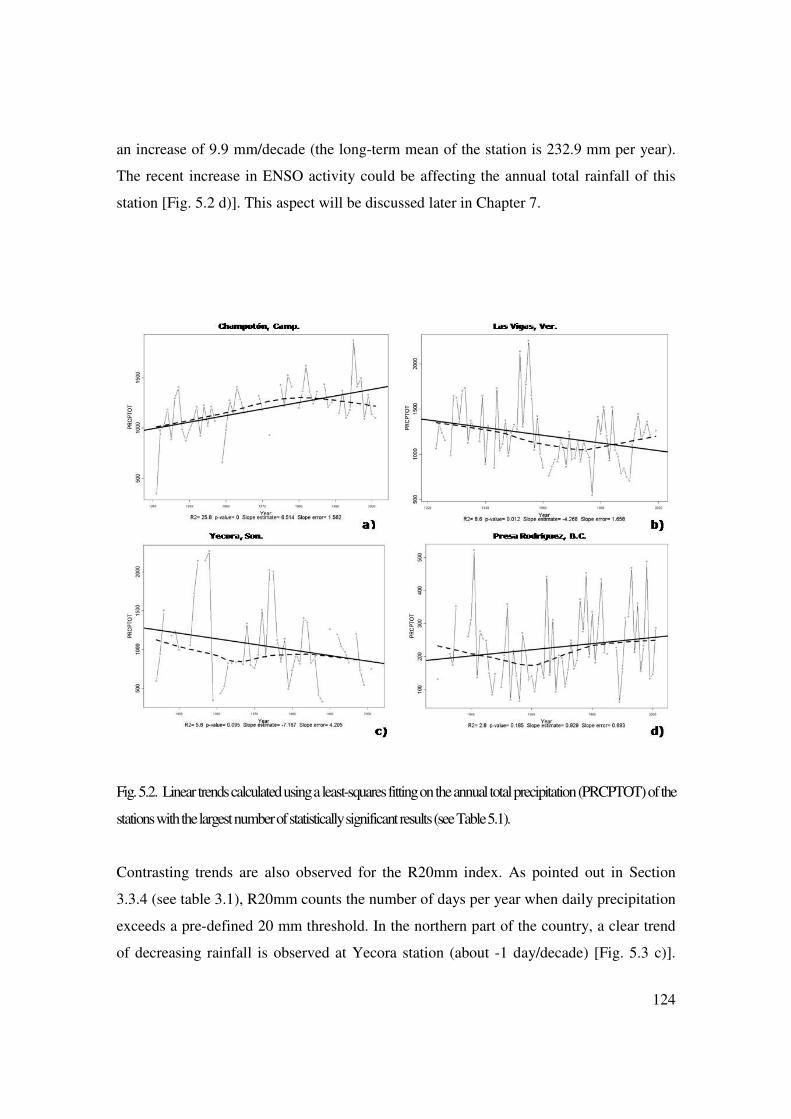
across the year among the stations considered. A downward trend is found at Las Vigas
(station number 35 in table 5.1) pointing towards drier conditions. The magnitude of the
trend calculated by least-squares is about -42.7 mm/decade for a climatological mean of
1152.1 mm per year, with a clear decrease in total rainfall since the 1960s [Fig. 5.2 b)].
Wetter conditions are also observed at Champotón, the other southern station assessed
[Fig. 5.2 a)]. In fact its positive trend is larger than the observed trend for Las Vigas
(+65.1 mm/decade with an annual mean of 1261.7 mm per year). The slight positive
trend in hurricane activity during recent decades is likely to be affecting this increased
precipitation (IPCC, 2007; Jauregui, 2003). Contrasting trends are also observed in the
northern part of the country. Although having several missing years, Yecora station
shows a clear decreasing trend (-71.7 mm/decade, and a long-term mean of 1117.6 mm
per year) [Fig. 5.2 c)]. Meanwhile a modest positive slope is found for the Presa
Rodríٕguez station in Tijuana with a changing pattern to wetter conditions, its trend shows
124
an increase of 9.9 mm/decade (the long-term mean of the station is 232.9 mm per year).
The recent increase in ENSO activity could be affecting the annual total rainfall of this
station [Fig. 5.2 d)]. This aspect will be discussed later in Chapter 7.
Fig. 5.2. Linear trends calculated using a least-squares fitting on the annual total precipitation (PRCPTOT) of the
stations with the largest number of statistically significant results (see Table 5.1).
Contrasting trends are also observed for the R20mm index. As pointed out in Section
3.3.4 (see table 3.1), R20mm counts the number of days per year when daily precipitation
exceeds a pre-defined 20 mm threshold. In the northern part of the country, a clear trend
of decreasing rainfall is observed at Yecora station (about -1 day/decade) [Fig. 5.3 c)].

125
Wetter conditions are observed at Tijuana (Presa Rodríguez station), its positive trend
(+0.14 days/decade), is, though, almost imperceptible [Fig. 5.3 d)]. The Mexican
Monsoon and the ENSO phenomenon are the possible physical mechanisms that partially
modulate the R20mm index at Yecora and the Presa Rodríguez stations. Gradual changes
in R20mm are also observed in the southern half of the country. A slight positive trend
(+0.19 days/decade) is observed at Champotón (station number 10 in Table 5.1), in which
sudden jumps occur in a quasi-cyclic mode according to the plot [Fig 5.3 a)], likely being
partially modulated regularly by hurricane activity. A modest change towards drier
conditions (negative trend of -0.32/decade) is observed at Las Vigas near to the Gulf of
Mexico [Fig 5.3 b)]. Therefore, we can say that contrasting conditions are observed in
both the northern and the southern part of Mexico. Positive trends are observed in those
stations located in the Peninsulas (Presa Rodríguez and Champotón), while negative
trends are found in the more continental stations (Yecora and Las Vigas).
Fig. 5.3. Linear trends calculated using a least-square fitting on the Very Heavy Precipitation Days (R20mm)
index of the stations with the largest number of statistically significant results (see Table 5.1).

126
Contrasting patterns can be appreciated between the stations in both the northern and
southern part of Mexico for the R95P index. For instance, in the northern part of Mexico
a clear downward trend (-52.7 mm/decade) is observed at Yecora within the Mexican
Monsoon (North American Monsoon) Region (see section 4.2.1). A clear decrease in
magnitude (amounts) of the peaks is evident for the most recent years. An upward slope
is seen for Presa Rodríguez, it has a less pronounced trend than Yecora with a change of
about +6.8 mm/decade, and the most important peaks of the indices are found in the
1990s. It is important here to point out that this upward trend in recent peaks is coincident
with a period of long "El Niños" during the same decade (Allan and D’Arrigo, 1999). In
the South of Mexico, Las Vigas shows an important downward trend (-46.8 mm/decade),
leading to drier conditions. As mentioned above for the PRCPTOT index, deforestation
(along with El Niño influence discussed in Chapter 7) may be playing an important role
in modulating the climate at this location. Meanwhile a recent increasing hurricane
activity (Jauregui, 2003) seems to be affecting the R95P index pattern at Champotón
(station number 10 in Table 5.1 and Fig. 3.6). A trend of +26.0 mm/decade is found at
this station. Overall, for the R95P index, upward trends are found for the stations in the
peninsulas (Champotón in the Yucatán peninsula, and Presa Rodríguez in the peninsula
of Baja California), and downward trends for the stations within the main continental
land (Las Vigas and Yecora).
In the northern part of the country, we can observe consistency with the former indices
evaluated when the trends of SDII are considered. An upward trend (+0.2
mm/day/decade) is found at Presa Rodríguez station in Tijuana. A marked increase in the
precipitation intensity is especially observed during the last two decades of the records
that is apparently in phase with a period of longer El Niños (Allan and D’Arrigo, 1999),
and is also linked to an increase in the amount of annual total rainfall [Fig. 5.2 d)] for this
station. Slightly larger in magnitude is the negative slope (when compared with Presa
Rodríguez station in Tijuana) at Yecora station (-0.7 mm/day/decade). This pattern
leading towards drier conditions seems to be directly linked to a decrease in the annual
total precipitation [as in Fig. 5.2 d)] rather than the number of wet days [Fig. 5.1 b)]. The

127
southern half of Mexico also shows contrasting patterns between the analysed stations
when the SDII is assessed. An almost imperceptible positive trend (+0.16
mm/day/decade) is found at Las Vigas. This is an interesting case, because as we
Fig. 5.4. Linear trends calculated using a least-square fitting on the Very Wet Day Precipitation (R95P) index of
the stations with the largest number of statistically significant results (see Table 5.1).
have seen the PRCPTOT index [as in Fig. 5.2 b)] pointing towards drier conditions; it
seems that the number of wet days has a greater influence on the SDII index [Fig. 5.1 b)].
It is clear that the annual total precipitation is decreasing at a slower rate than the number
of days when rains occurs. Finally the clearest trend on SDII is found at Champotón
within the Yucatán peninsula. The downward trend (-1.4 mm/day/decade) is directly
affected by an increase in the number of wet days [Fig. 5.1 b)] rather than the annual total
precipitation (PRCPTOT) that shows a pattern towards wetter conditions. It can be said
that this region (Yucatán peninsula) has been recently affected by increasing hurricane

128
activity (IPCC, 2007), but in also more rainy days have been observed during the year,
leading to a decrease in the daily intensity index (SDII) at Champotón.
Fig. 5.5. Linear trends calculated using a least-square fitting on the Severity Daily Intensity Index (SDII) index of
the stations with the largest number of statistically significant results (see Table 5.1).
Although subtle differences appear when the daily intensity index (SDII) is evaluated, the
analysis of trends, for the stations having more statistically significant correlations, has
shown consistency across the results. The pattern is clear: increasing trends in the
peninsulas and negative trends in the mainland stations. Presa Rodríguez in the peninsula
of Baja California, and Champotón in Yucatán are evident examples of how even modest
changes in large-atmospheric controls can affect local climates. Within a semi-arid region
in Tijuana, the precipitation at the Presa Rodríguez station is strongly affected even with
changes in normal atmospheric conditions, like those occurring during El Niño years in
this part of the country (Dettinger et al., 2001, Trenberth and Caron, 2000). A different
129
large-atmospheric control is observed at Champotón station within the Yucatán
peninsula. Hurricane associated rainfalls can completely disrupt the local climate in
comparison with neighbouring locations. This separation from normality is fully
appreciated in the PCA of rainfall (section 4.2.1) when a pattern can only be extracted in
the dry season (Nov-Apr), evidently linked to the hurricane-free period in the North
Atlantic Ocean basin. Less evident are the physical causes that invoke changes in the
precipitation extremes in the stations located in main continental Mexico. Nevertheless,
Yecora has consistently shown the largest trends of the four studied stations; but we have
to say that Yecora also has the greatest percent of missing data, especially for recent
years, and this might be affecting the results. Being at the core of the Mexican Monsoon
Region (Region 11 in Table 4.1) and with an altitude of 1500 m.a.s.l., Yecora is directly
impacted by the secular changes of the summer rainfall patterns (Cavazos et al., 2002). It
is important to point out here the contrasting trends (for the different rainfall extreme
indices studied) observed between Yecora in Sonora state and Presa Rodríguez in the
northern part of the Baja Californian peninsula; the sea of Cortez can be counted as a
possible cause for these different climatic patterns (Stensrud et al., 1997). Finally, as Las
Vigas station is located within a region of dense vegetation; deforestation is likely to be
the main physical force modulating the trends that lead to drier conditions (Villers-Ruíz
and Trejo-Vázquez, 1998). However, as is going to be explored in Chapter 7, the El Niño
phenomenon cannot be discarded as another atmospheric control partially modulating its
rainfall extremes.

130
5.3. CONCLUSIONS TO THE CHAPTER.
The occurrence of climate extremes is very rare in terms of their frequency, but large
when referred to intensity. Therefore, the study of these sorts of events is of great
importance because of the impacts they can have on our socio-economic activities. The
knowledge of the patterns and changes over time contribute to understand their nature
and causes and indirectly to mitigate their damages.
Total Annual Precipitation (PRCPTOT) shows contrasting conditions for local or
regional patterns. Regional precipitation reflects a southern decreased precipitation
especially for forested regions possibly suggesting a link to deforestation. However,
locally increasing precipitation is observed for those stations located at the head of the
Baja California and Yucatan Peninsulas.
In different ways both oceans modulate weather extremes in Mexico. If we only consider
statistical significant results, increased precipitation patterns are found in the stations near
the Pacific Coast; contrasting with a downward trend observed for those along the Gulf of
Mexico. The indices considered to identify this geographic transition are expressed as
frequency (number of cases) instead of magnitude and rate.
There is another interesting geographic pattern observed in the (linear) correlations of
precipitation extreme indices with time across Mexico. Increasing rainfall trends are
found for those stations located at the head of the Peninsulas; in contrast to rainfall
stations with a continentality factor that show a reduced precipitation. The partial
modulation of the climate by the ocean is suggested here as well.
The analysis performed in this chapter is leading towards some interesting results. When
considering statistical significant levels, around 60% of the total accounts for the results
significant at 5%, and consequently the remaining near 40% are related to a statistical
significance at 1%. Disregarding the sign of the correlations and the statistical
significance, the number of cases in the south is greater than in the north of the country.
131
This latitudinal climatic transition is also repeated when wet weather is contrasted to dry
conditions. Once more, the southern part of the country consistently outnumbers the
number of cases of significant correlations, than in the north.
Four stations involve about two thirds of the total number of statistically significant
results: Presa Rodríguez and Yecora (stations number 2 and 32 in Table 5.1) in the
northern part of Mexico; in the south Champotón and Las Vigas (stations number 10 and
35 in Table 5.1). When an analysis of trends is performed for these stations, the results
show consistency with the other analyses applied in this chapter: stations in the
peninsulas exhibit trends towards wetter conditions, while stations within the continent
are pointing towards drier patterns. Those stations at the head of the peninsulas
(Champotón and Presa Rodríguez) are directly affected by sudden changes in large-
atmospheric controls like Hurricanes or ENSO. Although modulated by more gradual
variability (mostly deforestation and the Mexican Monsoon) clear changes on rainfall
extremes are found for Las Vigas and Yecora station. There is one clear geographical
feature after the analysis of trends: either continental or peninsular, all the stations
evaluated are close to the Mexican coasts. Therefore, both the Atlantic and Pacific
Oceans play a key role partially controlling the evolution of the rainfall extremes across
Mexico.