CHAPTER FIVE ANALYSIS AND INTERPRETATION 5.1...
83
129 CHAPTER FIVE ANALYSIS AND INTERPRETATION 5.1 INTRODUCTION Analysis of the data means studying the tabulated material in order to determine inherent facts or meanings. It involves presenting the data in new arrangements for the purpose of interpretation. The data was studied from as many angles as possible to find out new and newer facts. The collected data was statistically analyzed and interpreted using descriptive and inferential analysis. 5.2 DESCRIPTIVE ANALYSIS The scores got from the attitude scale, the role performance of teachers, and the problems of teachers on various aspects of the study of inclusive school teachers as, locality, type of teachers dealing CWSN, class, gender, age group, community, educational qualification, marital status, teaching experience in years, class taught to CWSN, special training taken, vocational training taken, are worked out to find frequency, mean and percentage. The area of the present study covered inclusive schools from 9 blocks of Salem District in Tamilnadu, India. Out of 460 teachers to whom the research tools were given, only 211 teachers returned the filled up tools (attitude scales, role performance scales and problem checklists). Even after repeated visits and request by the researcher, some teachers refused to cooperate and fill the forms. Some teachers demanded for additional forms but did not bother to return.
Transcript of CHAPTER FIVE ANALYSIS AND INTERPRETATION 5.1...

129
CHAPTER FIVE
ANALYSIS AND INTERPRETATION
5.1 INTRODUCTION
Analysis of the data means studying the tabulated material in order to
determine inherent facts or meanings. It involves presenting the data in new
arrangements for the purpose of interpretation. The data was studied from
as many angles as possible to find out new and newer facts.
The collected data was statistically analyzed and interpreted using
descriptive and inferential analysis.
5.2 DESCRIPTIVE ANALYSIS
The scores got from the attitude scale, the role performance of
teachers, and the problems of teachers on various aspects of the study of
inclusive school teachers as, locality, type of teachers dealing CWSN, class,
gender, age group, community, educational qualification, marital status,
teaching experience in years, class taught to CWSN, special training taken,
vocational training taken, are worked out to find frequency, mean and
percentage. The area of the present study covered inclusive schools from 9
blocks of Salem District in Tamilnadu, India. Out of 460 teachers to whom
the research tools were given, only 211 teachers returned the filled up tools
(attitude scales, role performance scales and problem checklists). Even after
repeated visits and request by the researcher, some teachers refused to
cooperate and fill the forms. Some teachers demanded for additional forms
but did not bother to return.

130
The general information of teachers who provided the data, dealing
with different categories of CWSN in inclusive schools are given in following
table- 5.
TABLE - 5
GENERAL INFORMATION OF INCLUSIVE SCHOOL TEACHERS Number of teachers=211
S. NO VARIABLE TEACHER
CATEGORY FREQUENCY PERCENTAGE
1 TEACHERS DEALING CWSN
1 Visually Impaired 26 12.32 2 Hearing Impaired 63 29.86 3 Mentally Retarded 71 33.65 4 Orthopedically
Impaired 51 24.17
2 LOCALITY 1 Rural 132 62.56 2 Urban 79 37.44
3 CLASS TAUGHT TO CWSN
1 I 19 9.00 2 II 32 15.00 3 III 56 26.54 4 IV 47 22.27 5 V 57 27.01
4 GENDER 1 Male 69 32.70 2 Female 142 67.30
5 AGE GROUP 1 <=35 years 83 39.34
2 36-45 years 85 40.25
3 >=46 years
43 20.38
6
COMMUNITY 1 FC 14 6.64 2 BC 98 46.45 3 MBC 57 27.01 4 SC/ST 42 19.91
7 EDUCATIONAL QUALIFICATION
1 DTE 142 67.30 2 Graduates with
DTE 37 17.54
3 Graduates with B.Ed
32
15.17
8 MARITAL STATUS 1 Married 189 89.57 2 Unmarried 22 10.43
9 OVERALL TEACHING EXPERIENCE
1 <= 5 years 83 39.34 2 6-10 years 53 25.12 3 11-20 years 41 19.43 4 > 20 years 34 16.11
10 EXPERIENCE IN TEACHING CWSN
1 <= 3 years 175 82.94 2 4-6 years 21 9.95 3 >6 years 15 7.11
11 SPECIAL TRAINING TAKEN 1 YES 94 44.55 2 NO 117 55.45
12 VOCATIONAL TRAINING 1 YES 12 5.69 2 NO 119 94.31

131
1. From the table-5, it is found that highest percentage of teachers is
dealing with mentally retarded children followed by teachers dealing
with hearing impaired and orthopedically impaired respectively. The
lowest percentage of teachers is dealing with the visually impaired.
2. Larger percentage of teachers is working in inclusive schools of rural
locality comparatively the percentage of teachers from urban locality is
low.
3. The largest percentage of teachers dealing CWSN is in class V in
inclusive schools followed by class III .The lowest percentage of
teacher is dealing CWSN in class-I.
4. The percentage of female teachers dealing with CWSN in inclusive
schools is higher than the percentage of male teachers.
5. The largest percentage of teachers dealing CWSN is in the age group
36-45 years followed by <=35 years. The lowest percentage of teacher
dealing CWSN is in the age group >=46 years.
6. Largest percentage of teachers dealing CWSN is of the BC community
followed by MBC and SC/ST. The lowest percentage of teachers
dealing CWSN is of the FC community.
7. Highest percentage of teachers dealing CWSN is with the Educational
Qualification DTE followed by Graduates with DTE. The lowest
percentage of teachers is Graduates with B.Ed.
8. A larger percentage of married teachers are working in inclusive
schools compared to low percentage of unmarried teachers.
9. The largest percentage of teachers dealing CWSN has teaching
experience <= 5 years in inclusive schools followed by 6-10 years and

132
11-20 years. The lowest percentage of teachers has the teaching
experience > 20 years.
10. It is found that largest percentage of teachers dealing CWSN has
teaching experience to CWSN<= 3 years followed by teachers of 4-6
years. The lowest percentage of teacher dealing CWSN is with the
experience > 6 years.
11. A higher percentage of teachers without special training is dealing
CWSN, compared to low percentage of teachers with special training.
12. A Higher percentage of teachers without vocational training is dealing
CWSN, compared to low percentage of teachers with vocational
training.
5.2.1 Mean scores and S.D.s of Attitude of Teachers, Role Performance
of Teachers and Problems Faced by Teachers dealing CWSN in
inclusive schools.
From table-6, it is found that Mean score of teachers’ attitude towards
teaching CWSN in inclusive schools is the highest indicating high positive
attitude of inclusive schools, followed by high attitude towards education of
CWSN in inclusive schools. Comparatively teachers’ attitude towards
inclusive schools is favorable but moderate. Mean scores of role performance
of teachers dealing with VI children, HI children and OH children are similar
and low; the mean score of teachers dealing with MR children is lower.
Problems faced by teachers dealing VI children are more followed by the
teachers dealing with HI children and teachers dealing with OH children.
The high values of S.D.s in problems faced by teachers indicate much
dispersion as to individual teachers’ variations within the category of

133
teachers. On the whole many problems are faced by teachers according to
the category of CWSN they deal with.
Figures show Mean scores and S.D.s of Attitude of Teachers, Role
Performance of Teachers and Problems Faced by Teachers dealing CWSN in
inclusive schools.
TABLE-6
Mean scores and S.D.s of Attitude of Teachers, Role Performance of
Teachers and Problems Faced by Teachers dealing
CWSN in inclusive schools
Number of teachers=211
S. No
Variables of the study Number
of teachers
MEAN SD
Attitude of Teachers
1 Attitude towards inclusive school 211 77.04 8.44
2 Attitude towards education of CWSN in inclusive school 211 83.96 9.57
3 Attitude towards teaching CWSN in inclusive school 211 86.52 7.76
Role Performance of Teachers
1 Role Performance of teachers dealing with VI children 26 61.65 7.87
2 Role Performance of teachers dealing with HI children 63 61.01 8.25
3 Role Performance of teachers dealing with MR children 71 58.57 6.79
4 Role Performance of teachers dealing with OH children 51 60.23 8.56
Problems Faced by teachers
1 Problems faced by teachers dealing with VI children 26 66.43 34.57
2 Problems faced by f teachers dealing with HI children 63 62.70 24.08
3 Problems faced by teachers dealing with MR children 71 54.40 28.67
4 Problems faced by teachers dealing with OH children 51 62.75 27.38

134
5.2.2 ATTITUDE OF TEACHERS
Attitude of teachers working in inclusive schools is measured under
three sub scales, namely, a) attitude towards inclusive schools b) attitude
towards education of CWSN in inclusive schools and c) attitude towards
teaching CWSN in inclusive schools.
a) Attitude of teachers towards inclusive schools
The tool measuring attitude of teachers towards inclusive schools
consists of 20 statements (8 negative&12 positive statements).The responses
were converted into scores as per description given in chapter-IV. The mean
score of teachers dealing CWSN to each statement in “Attitude of teachers
towards inclusive schools” were calculated. Three levels of attitude were
classified on the basis of Mean scores, LAL-Low Attitude level 1-1.99, MAL-
Moderate Attitude level-2.00-2.50, HAL-High Attitude level-2.51-3.00.
TABLE –7
Attitude of teachers towards inclusive schools:
Statement-wise Mean score and Level of Attitude
S. NO Statement Mean LOA 1 Students will learn in school better than in the house 2.95 HAL
2 My ambition is to treat CWSN equal with others 2.86 HAL
3 BY Mingling with normal students CWSN’S mentality will
be changed.
2.73 HAL
4 Our school is better suited to make CWSN members of
the society.
2.55 HAL
5 I will change the classroom atmosphere for CWSN 2.14 MAL
6 If we admit CWSN in school, the workload will be more. 2.07 MAL
7 It is better to teach CWSN in my school than in the
special schools.
1.99 LAL

135
S. NO Statement Mean LOA 8 We can teach CWSN in our school itself 2.37 MAL
9 Teachers only can enable CWSN to mingle with the
society
2.67 HAL
10 They are neglected in the class. 1.21 LAL
11 If we admit CWSN in school, the other students’
achievement will come down.
1.45 LAL
12 If we admit CWSN in school, the other students’
achievement will increase.
1.67 LAL
13 We cannot teach properly because of insufficient number
of teachers.
2.06 MAL
14 If they are in classroom, normal students learning ability
will decrease.
1.47 LAL
15 Separate honorarium should be given to teacher for
teaching CWSN.
1.91 LAL
16 I can’t deal CWSN equal with others 1.97 LAL
17 While teaching CWSN other students in the class are
disturbed by CWSN
1.44 LAL
18 Their presence in the classroom is a problem. 1.54 LAL
19 If we admit CWSN in school, there is no change in
workload of teachers.
2.00 MAL
20 There is no necessity of special schools for CWSN 1.55 LAL
Form the table-7, it is found that the mean score for the statement
no.1 “Students will learn in school better than in the house” is the highest
and sl.no. 2, 3, 4 and 9 also have high mean it indicates favorable High
attitude towards CWSN, mingling with normals in inclusive schools.
The statements 5, 6, 8, 13 and 19 indicate favorable Moderate attitude
towards, classroom, workload and inclusive schools. Teacher attitude in the
statement 7, 10, 11, 12, 14, 15, 16, 17, 18 and 20 indicate Low attitude

136
level about achievement, learning ability, and presence of CWSN in the
classroom, and separate honorarium for teachers in inclusive schools.
Teachers’ attitude to inclusive schools is found to be moderate to
low(50% high and moderate, while 50% low).
b) Attitude of teachers towards education of CWSN in inclusive schools
The tool measuring attitude of teachers towards education of CWSN in
inclusive schools consists of 16 statements (3 negative and 13 positive
statements).The responses were converted into scores as per description
given in chapter-IV. The mean scores of teachers dealing CWSN, to each
statement in “Attitude of teachers towards education of CWSN in inclusive
school” were calculated. Three levels of attitude were classified on the basis:
Mean scores, LAL-Low Attitude level 1-1.99, MAL- Moderate Attitude level-
2.00-2.50, HAL-High Attitude level-2.51-3.00.
TABLE - 8
Attitude of teachers towards education of CWSN in inclusive schools:
Statement- wise Mean score and Level of Attitude
S.No Statement Mean LOA
1 We can give quality education in inclusive schools. 2.36 MAL
2 CWSN will slowly improve in their education. 2.78 HAL
3 Minimum level of attainment is enough to CWSN. 2.54 HAL
4 It is difficult to teach, if we admit CWSN in the
inclusive school. 1.84 LAL
5 I will start my teaching with individual care of CWSN. 2.64 HAL
6 I will use same methodology for teaching all CWSN. 2.08 MAL

137
S.No Statement Mean LOA
7 If we use suitable learning methodology, the learning
ability of CWSN will increase. 2.24 MAL
8 There is no use in special coaching. 1.46 LAL
9 I will change my teaching methodology with the help
of special educator. 2.69 HAL
10 Individualized Education plan is necessary to all
CWSN. 2.55 HAL
11 We can give quality education for all together. 2.80 HAL
12 I will be happy, If CWSN get higher level of
achievement 2.94 HAL
13 If we use different learning methodology, their
learning achievement will increase 2.86 HAL
14 If we use suitable learning methodology, then
learning rate of all will change. 2.36 MAL
15 If we use suitable learning methodology, then the
class learning achievement also Increase. 2.38 MAL
16 If we use suitable learning methodology, then the
individuals learning achievement also increases. 2.41 MAL
Form the table-8, it is found that the statement “I will be happy, if
CWSN get higher level of achievement” has highest mean score, followed by
sl.no 13, 11, 2, 9, 5, 10, and 3. It indicates high favorable attitude towards,
achievement, quality education, slowly improve, help of special educator,
individual care, individualized education plan and minimum level
attainment for education of CWSN.
The statements 1, 6, 7, 14, 15 and 16 indicate Moderate favorable
attitude towards quality, teaching method, learning ability, learning rate and
achievement of CWSN in inclusive schools.

138
The statements 8 and 4 show low attitude level about special coaching
and difficult to teach CWSN in inclusive schools.
Teachers’ attitude to education of CWSN in inclusive schools is high to
moderate(87.5% High and moderate, while 12.5% Low).
c) Attitude of teachers towards teaching in inclusive schools
The tool measuring attitude of teachers towards education teaching in
inclusive schools consists of 14 statements (2 negative and 12 positive
statements).The responses were converted into scores as per description
given in chapter-IV. The mean scores of teachers dealing CWSN, to each
statement in “Attitude of teachers towards teaching in inclusive schools”
were calculated. Three levels of attitude were classified on the basis of Mean
scores, LAL-Low Attitude level 1-1.99, MAL- Moderate Attitude level-2.00-
2.50, HAL-High Attitude level-2.51-3.00.
TABLE – 9
Attitude of teachers towards teaching in inclusive schools
Statement-wise mean score and level of Attitude
S.No Statement MEAN LOP
1 I am able to teach CWSN 2.74 HAL
2 I will take much interest in the CWSN 2.75 HAL
3 I will change my teaching methods for CWSN. 2.56 HAL
4 Teaching methods used to normal children are
enough to CWSN. 1.63 LAL
5 Special attention is needed to CWSN. 2.89 HAL
6 I will try to use different kinds of methodology in
teaching 2.79 HAL

139
S.No Statement MEAN LOP
7 Special training should be given to teachers for
teaching CWSN. 2.79 HAL
8 I will use separate methodology for each of the CWSN. 2.52 HAL
9 I will try to understand the feeling of CWSN’S 2.92 HAL
10 I will take care of CWSN. 2.93 HAL
11 We should have a variety of abilities to teach CWSN. 2.61 HAL
12 I will try to improve learning level of CWSN. 2.97 HAL
13 Every teacher should use suitable teaching method
for CWSN 2.86 HAL
14 There is no use, if special attention is given to these
CWSN 1.40 LAL
From table-9, it is found that the statement “I will try to improve
learning level of CWSN” has the highest mean score, followed by sl.no 10, 9,
13, 5, 6, 7, 2, 1, 11, 3 and 8. It indicates high favorable attitude towards
care of CWSN, feelings, suitable teaching method, attention, different kind of
methodology, special training, interest, care, abilities to teach and variety of
abilities. Mean scores in the statements 4 and 14 indicate low attitude level
towards teaching methods same as for normal children and no use of special
attention to CWSN.
Teachers’ attitude to teaching CWSN in inclusive schools is highly
favorable (85.7% High, while14.28%low).
5.2.3 ROLE PERFORMANCE OF TEACHERS
In the present study, role performance of teachers dealing with the
CWSN of the four categories, namely, VI, HI, MR and OH of inclusive schools

140
are considered. Thus, teachers dealing VI children have specific teaching
and training role to perform to the VI as well as teaching the normal
children in the class in inclusive school. This is pertaining to those teachers
who deal with HI/MR/OH children in the class. The role performance of
teachers categories are measured using the Role Performance Rating Scales
developed by G. Lokanadha Reddy (2005). According to the category of
CWSN children the teachers deal, the respective scale of role performance
was relevant.
1. Rating scale to measure the role performance of teachers dealing with
visually impaired children in inclusive schools
2. Rating scale to measure the role performance of teachers dealing with HI
children in inclusive schools
3. Rating scale to measure the role performance of teachers dealing with
MR children in inclusive schools
4. Rating scale to measure the role performance of teachers dealing with
OH children in inclusive schools.
Role Performance of inclusive school teachers dealing with VI, HI, MR
and OH Children
Role Performance of teachers of inclusive schools in performing their roles of
teaching and training CWSN in inclusive schools were discussing below
a) Role Performance of inclusive school teachers dealing with
Visually Impaired Children
The tool measuring role performance of teachers dealing with
visually impaired children in inclusive schools consists of 28 statements.
The responses were converted into scores as per description given in

141
chapter-IV. The mean score of teachers dealing CWSN to each statement
were calculated. Three levels of performance were classified on the basis of
mean scores: LPL-low performance level below 3.25, MPL- moderate
performance level-3.26-4.25, HPL-high performance level-above 4.26.
The level of role performance of Teachers dealing Visually Impaired
Children based on their mean performance is presented in the table –10
Table-10
Mean Performance of Teachers dealing with Visually Impaired Children
based on their level of performance
Statement-wise Mean score and Level of performance
S. NO Role Performance Statement (VIC) Mean LOP
1 Encouraging blind children frequently to apply touch for the purpose of cognition. 2.92 LPL
2 Competency in making VI children to be self-sufficient in orientation and mobility skills. 3.15 MPL
3 Giving training to the VI children in attaining certain social skills such as exhibiting appropriate facial expressions through behavioral principles.
2.65 LPL
4 Making necessary change of curriculum to suit the needs of VI children 2.96 LPL
5 Competency in teaching reading through Braille. 2.85 LPL
6 Competency in making the visually impaired to use their remaining sight in reading.
3.08 MPL
7 Development of listening skills in VI children. 3.15 LPL
8 Providing the methods of aiding VI children to read large print books and magnifying devices.
3.38 MPL
9 Knowledge and use of the various aids that help the VI children's ability.
3.12 LPL
10 Knowledge about the different technological special aids (new electronic devices) and their use for the education of VI individuals
2.96 LPL

142
S. NO Role Performance Statement (VIC) Mean LOP
11 Integrating VI children with their normal peers to develop co-operative attitude and mutual help with each other
3.42 MPL
12 Competency in conducting I.Q. tests and identifying the creative talents in VI children
3.00 LPL
13 Encouraging blind children to explore the things to facilitate better concept development.
3.27 MPL
14 Providing cane mobility skills to VI children. 3.08 LPL
15 Providing vocational skills to the VI children. 3.04 LPL
16 Development of independent living skills in VI children. 3.15 LPL
17 Respecting and encouraging the blind person’s individuality, capability and independence.
3.23 LPL
18 Identifying the visual problems in children through vision screening tests.
3.31 MPL
19 Competency in development and use of adoption of instructional materials.
3.19 LPL
20 Using concrete material and hands on learning to improve instruction for VI students.
3.19 LPL
21 Providing sensory training to the VI children. 3.27 MPL
22 Providing pre vocational training skills (such as weaving, recanting of chairs, plastic bag making etc.).
3.04 LPL
23 Competency in the development and use of psycho-educational assessment tools for the VI children.
2.92 LPL
24 Providing stimulating experiences to develop imagery and orient the VI children.
2.85 LPL
25 Competency in using mathematical devices such as abacus and tailor frame in teaching Methods to the VI children instead of normal methods.
3.04 LPL
26 Knowledge and skill in the use of tools and procedures for teaching VI children.
3.00 LPL
27 Familiarity with resources, aids, materials, and skill in adopting, modifying and creating the needed teaching aids.
3.04 LPL
28 Competency in evaluation procedures in the education of the VI children.
3.04 LPL
143
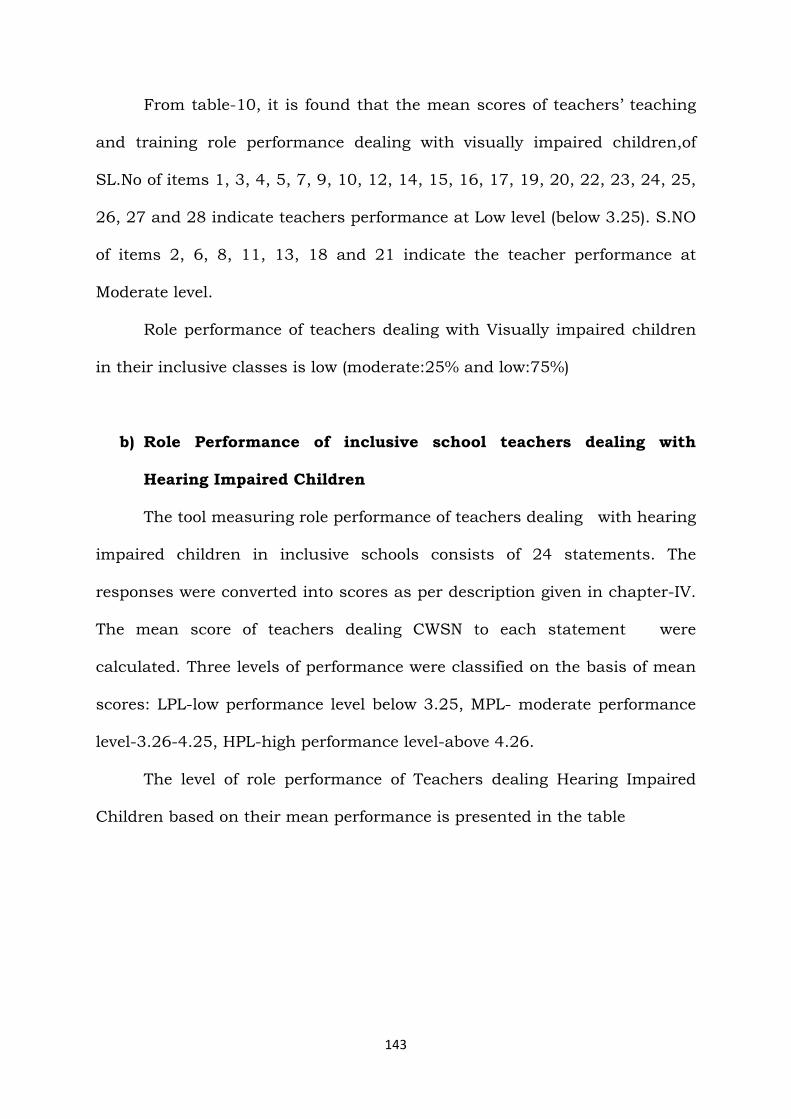
From table-10, it is found that the mean scores of teachers’ teaching
and training role performance dealing with visually impaired children,of
SL.No of items 1, 3, 4, 5, 7, 9, 10, 12, 14, 15, 16, 17, 19, 20, 22, 23, 24, 25,
26, 27 and 28 indicate teachers performance at Low level (below 3.25). S.NO
of items 2, 6, 8, 11, 13, 18 and 21 indicate the teacher performance at
Moderate level.
Role performance of teachers dealing with Visually impaired children
in their inclusive classes is low (moderate:25% and low:75%)
b) Role Performance of inclusive school teachers dealing with
Hearing Impaired Children
The tool measuring role performance of teachers dealing with hearing
impaired children in inclusive schools consists of 24 statements. The
responses were converted into scores as per description given in chapter-IV.
The mean score of teachers dealing CWSN to each statement were
calculated. Three levels of performance were classified on the basis of mean
scores: LPL-low performance level below 3.25, MPL- moderate performance
level-3.26-4.25, HPL-high performance level-above 4.26.
The level of role performance of Teachers dealing Hearing Impaired
Children based on their mean performance is presented in the table

144
Table-11
Mean Performance of Teachers dealing with Hearing Impaired Children
based on their level of performance
Statement-wise Mean score and Level of performance
S.No Role performance statement (HIC) Mean LOP
1 Making necessary change of curriculum to suit the needs
of HI children.
2.76 LPL
2 Acquiring competency in manual sign language for HI
children.
3.11 LPL
3 Having competency in using non-verbal communication
with HI children.
2.78 LPL
4 Acquiring competency in both oral and manual methods of
communication(total communication approach
3.05 LPL
5 Having competency in using auditory training to the deaf or
hard of-hearing children
3.22 LPL
6 Acquiring knowledge about the rapid technological
advances in the development of the hearing aids.
3.30 MPL
7 Having competency in teaching HI children to use visual
information to understand what is being said to them.
2.94 LPL
8
Having ability to teach HI child to discriminate among the
various speech sounds by relying on visual clues from lips,
tongue and jaw.
3.02 LPL
9
Identifying the hearing threshold levels of HI children and
their impact on communication and language in
educational settings
2.68 LPL
10 Competency in using computer assisted instruction (micro-
computers) in instructing HI students
2.95 LPL
11
Competency in modifying the physical environment like
changes in seating, changes in sounds, permitting free
movement around the class-room and flexible seating
arrangements
3.02 LPL

145
S.No Role performance statement (HIC) Mean LOP
12
Using teaching formats such as exhibits, demonstrations,
experiments and simulations to provide hand on
experiences, which in turn promote understanding the
lectures and whole- class discussions easily.
3.46 MPL
13
Giving short writing directions, simple sentences and using
pictures to supplement oral explanation during
demonstrations.
3.27 MPL
14
Identifying and defining important vocabulary words and
providing lecture notes to enhance comprehension in HI
children
3.59 MPL
15 Providing non verbal cues and using facial expressions,
body movements and gestures
2.97 LPL
16 Use verbal information with graphic pictorial forms such as
diagrams, pictures, graphs and graphic outlines.
3.37 MPL
17
Using the peer tutoring and buddy arrangements to
encourage increased communication and social interaction
within the students
3.29 MPL
18
Encouraging the HI children to participate in social
activities outside the school (going out to dinner and
attending after school-sports events).
3.16 LPL
19
Providing information to the HI children about the
monitoring tests at least twice a year to know about their
amplification services and keep up their languages learning
3.06 LPL
20 Conducting proper auditory stimulation Programme to the
HI children
2.97 LPL
21 Developing the method of teaching on the basis of HI
child's capability
3.05 LPL
22
Acquiring competency in providing vocational skills, like
photography, leather works, plumbing, welding, computer
data entry, and printing etc
2.79 LPL

146
S.No Role performance statement (HIC) Mean LOP
23 Teaching the HI child to learn the words, he/ she need to
use most often.
3.17 LPL
24 Competency in making the HI children to use hearing aids
and do minor repairs of the same.
3.00 LPL
From table-11, it is found that the mean scores of role performance of
teachers dealing with Hearing impaired children the Sl.no of items
1,2,3,4,5,7,8,9,10,11 15,18,19,20,21,22,23 and 24 were performed by the
teacher at Low Level (below 3.25). S.NO of items 6, 12, 13, 14, 16 and17
were performed by the teacher at Moderate level.
Role performance of teachers dealing with hearing impaired children
in their inclusive classes is low (moderate:25% and low:75%).
c) Role Performance of inclusive school Teachers dealing with Mentally
Retarded Children
The tool measuring role performance of teachers dealing with hearing
impaired children in inclusive schools consists of 32 statements. The
responses were converted into scores as per description given in chapter-IV.
The mean score of teachers dealing MR to each statement were calculated.
Three levels of performance were classified on the basis of mean scores: LPL-
low performance level below 3.25, MPL- moderate performance level-3.26-
4.25, HPL-high performance level-above 4.26.
The level of role performance of Teachers dealing Mentally Retarded
Children based on their mean performance is presented in the table-12

147
Table-12
Mean Performance of Teachers dealing with Mentally Retarded children
based on their level of performance
Statement-wise Mean score and Level of performance
S.NO Role Performance Statement (MRC) Mean LOP
1 Giving self-help skills to the students keeping the
psychologists report in mind. 2.82 LPL
2
Teaching only the basic living skills to the severally
mentally retarded children instead of teaching reading,
writing and arithmetic.
2.82 LPL
3 Development of functional skills for mentally retarded
in the community setting than in segregated set up. 3.11 LPL
4 Training MR children to learn functional skills in day-
to-day life 3.06 LPL
5 Providing learning materials in a structural and
systematic way to the MR children. 3.10 LPL
6
Using task analysis, goal setting and rewards in a
systematic way to develop self-confidence in MR
children.
3.20 LPL
7 Showing attention to the individual needs of the child
rather than group needs. 3.00 LPL
8 Organizing training in vocational skills to open new
avenues for job placements to MR children. 2.94 LPL
9
Providing education to MR children based on the
function rather than modified versions of general
curriculum.
3.23 LPL
10
Conducting informal educational evaluation to
determine whether the child has attained certain skills
or not.
2.83 LPL
11 Development of curriculum based on the principles of
flexibility and diversity. 2.83 LPL

148
S.NO Role Performance Statement (MRC) Mean LOP
12 Development of curriculum based on expressive and
receptive language. 2.86 LPL
13 Providing environment to stimulate the MR child to be
ready to learn. 2.97 LPL
14 Stimulate motivation and the desire to learn or
participate. 3.10 LPL
15 Reinforcing desorbed behavior in MR child frequently
by giving rewards. 3.27 MPL
16
To improve the rate of learning and overcome the
forgetfulness in MR child, many opportunities should
be provided for exercise and more practice.
2.97 LPL
17 Encouraging the MR children to be an active
participant in the learning process. 2.99 LPL
18
Ensuring that the skill or the concept being taught is
mastered before proceeding to new or more difficult
ones.
2.62 LPL
19 Ensuring accuracy instead of speed in MR student’s
work. 2.65 LPL
20 Using small steps in learning new skills. 3.18 LPL
21 Teaching MR child should proceed from simple to
complex, known to unknown. 3.00 LPL
22 Making use of materials and teaching devices that are
attractive and colorful. 3.34 MPL
23 Giving instruction to appeal all senses of the MR to
enhance the efficiently in his/her learning. 2.92 LPL
24 Providing concrete materials in teaching learning
situations than abstract ones. 2.90 LPL
25 Organizing/conducting filed experience to provide the real settings of learning. (For e.g., making a purchase, eating out etc.).
3.03 LPL

149
S.NO Role Performance Statement (MRC) Mean LOP
26 Providing routine schedule activities and procedures to
the education of MR children. 2.65 LPL
27
Evaluation of the Programme of instruction periodically
to determine the efficiency of the specific teaching
materials and to determine additional needs.
2.56 LPL
28 Knowledge about the objectives and need for education
of MR children. 2.76 LPL
29
Knowledge and use of mechanical devices (computers)
in training MR children particularly in speech related
aspects.
2.55 LPL
30 Developing and providing age appropriate curriculum
to the MR children. 2.77 LPL
31 Providing/using applied behavior analysis to teach the
MR children in their development. 2.82 LPL
32
Developing a process of non-verbal conversation to the
MR children who are having speech defects for their
better understanding.
2.87 LPL
From table-12,it is found that Mean scores of role performance of
teachers dealing with Mentally Retarded children of item No.s 1,to14, and16
to21, and 23 to 32 were performed by the teachers at low level (below 3.25).
The S.No of items 15 and 22 were performed by the teacher at moderate
level.
Role performance of teachers dealing with mentally retarded children
in their inclusive classes is low (moderate:6.25% and low:93.75%).

150
d) Role Performance of inclusive school teachers dealing with
Orthopedically handicapped children
The tool measuring role performance of teachers dealing with
orthopedically handicapped children in inclusive schools consists of 17
statements. The responses were converted into scores as per description
given in chapter-IV. The mean score of teachers dealing OH to each
statement were calculated. Three levels of performance were classified on
the basis of mean scores: LPL-low performance level below 3.25, MPL-
moderate performance level-3.26-4.25, HPL-high performance level-above
4.26.
The level of role performance of Teachers dealing Orthopedically
handicapped Children based on their mean performance is presented in the
table- 13
Table- 13 Mean Performance of Teachers dealing with Orthopedically
Handicapped Children based on their level of performance
Statement wise Mean score and Level of performance
S.NO Role Performance Statement (OHC) Mean LOP 1 Understanding the emotional and social behaviors of
the OH children. 2.90 LPL
2 Conducting Programmes to the students which
emphasis cognitive process through which the
content and academic skills are learnt. 2.90 LPL
3 Competency in using different neuropathic techniques
for muscle coordination in spastic and cerebral palsy
cases. 2.71 LPL

151
S.NO Role Performance Statement (OHC) Mean LOP 4 Acquiring competency on neurological treatment of
cerebral palsy. 2.55 LPL
5 Ability to provide and train to use adequate facilities
and equipment such as wheel chairs, crutches or
braces to the children affected by polio. 3.33 MPL
6 Acquiring knowledge and use of physiotherapy.
3.10 LPL
7 Acquiring knowledge about inflammation of the joints
and the ways and means of overcoming the same 2.96 LPL
8 Ability to develop the feeling of security and self-
concept in OH children. 3.29 MPL
9 Competency in using behavioral neuropathic
techniques to overcome emotional disorders in OH
children. 2.67 LPL
10
Competency in providing suitable occupation skills to
the OH children. 2.86 LPL
11
Capacity to develop the ability of tolerance and
acceptance of disability in the OH children to reduce
their frustration. 3.00 LPL
12 Paying individual attention towards the OH children. 3.27 MPL
13 Acquiring knowledge and to the use the same in
providing physical facilities in SCHOOLS to the OH
children. 3.04 LPL
14
Providing manipulative materials such as pegboards,
form boards, colored blocks, puzzles and etc. games
and devices, which develop their eye hand-
coordination.
3.14 LPL
15
Competency in physiotherapy, speech therapy and
occupational therapy and occupational therapy to
make these children to learn some craft or vocation. 3.14 LPL

152
S.NO Role Performance Statement (OHC) Mean LOP
16 Competency in giving mobility training by using
technological devices like wheel chairs, walkways and
ramps etc. 3.16 LPL
17
Competency in the use of assistive equipment and
special teaching aids to teach OH children. 3.18 LPL
From table-13,it is found that the mean scores of teachers role
performance of teachers dealing with orthopedically handicapped children,
of item No.s 1,2,3,4,6,7,9,10,11, 13,14,15,16,and 17 indicate that the role
were performed by the teacher at low level (below 3.25). Mean scores of S.NO
of items 5, 8, and12 indicate a moderate performance by the teachers.
Role performance of teachers dealing with orthopedically handicapped
children in their inclusive classes is low (moderate:17.59 % and
low:82.41%).
5.2.4 PROBLEMS FACED BY TEACHERS DEALING WITH CWSN IN
INCLUSIVE SCHOOLS
Problems faced by teachers of inclusive schools in performing their
roles of teaching and training CWSN in inclusive schools were measured
using Problem Checklists developed by D.Lokanadha Reddy(2005) as
described in Chapter-IV.
1. Problem checklist to identify the problems faced by the teachers dealing
with VI children in inclusive schools
2. Problem checklist to identify the problems of teachers dealing with HI
children in inclusive schools

153
3. Problem checklist to identify the problems of teachers dealing with MR
children in inclusive schools
4. Problem checklist to identify the problems of teachers dealing with OH
children in inclusive schools.
Problem Checklists covered 11 problems under teaching and training
for VI children, 18 for HI children, 16 for MR children and 9 for OH children.
Against each problem statement, ‘yes’ or ‘no’ is given and the teachers are
requested to point out a tick mark on ‘Yes’ when they are facing the problem
and put a tick mark on ‘No’ facing the problem. The scores are given as 1 or
0 for ‘Yes’ and ‘No’ responses respectively.
Number and percentage of teachers VI, HI, MR and OH Facing and Not
Facing the Problems in performance of their Roles
Problems faced by teachers of inclusive schools in performing their roles of
teaching and training CWSN in inclusive schools are discussed below
a) Problems faced by teachers dealing with VI children
The problem checklist pertaining to problems faced in dealing Visually
Impaired children has 11 statements which are related to the teachers’ role
performance. The response whether ‘facing problem’ or ‘not facing problem’
as ticked by teachers for each problem are counted and converted to
percentages. Number and percentage of teachers (VI) Facing and Not Facing
each Problem in performing their role are presented in Table -14

154
Table-14
Number and percentage of teachers (dealing with VI children) Facing
and Not facing the Problems in performing their role
S. No Statement of the Problem (VI)
Facing the Problem
Not Facing the
Problem
Count % Count %
1 Inadequate materials to diagnose visual efficiency in
children 15 57.69 11 42.31
2 Lack of psychologists and eye specialists for
establishing better rapport 18 69.23 8 30.77
3 Lack of knowledge in conducting action research to
solve the problems of individual cases. 16 61.54 10 38.46
4 Large number of children in each class is the
problem to the teacher to pay individual attention. 18 69.23 8 30.77
5
Lack of adequate brail material and lack of audio
records to develop listening skills among VI
children.
16 61.54 10 38.46
6 Inadequate large print books and magnifying
devices 16 61.54 10 38.46
7 Inadequate knowledge about the new technological
devices 18 69.23 8 30.77
8 Lack of facilities to provide vocational skills to the VI
In school 23 88.46 3 11.54
9 Difficulty in providing sensory training for concept
development 17 65.38 9 34.62
10 Lack of abacus and tailor frame in teaching Math’s
to VI children 17 65.38 9 34.62
11 Lack of time to solve the academic problems of VI
children. 16 61.54 10 38.46
From table-14, it is found that the highest percentage (88.46) of
teachers dealing with Visually Impaired children (VI) are facing the problem
“Lack of facilities to provide vocational skills to the VI in school” followed by

155
problems S.NO of items 2 to11 by more than 60 percentage of teachers. The
least problem S.NO.1, “Inadequate materials to diagnose visual efficiency in
children” is faced by57.69 percentages of teachers.
Conclusion
It is found that all the teachers are facing problems such as large
class strength, inadequate large print books and magnifying devices,
inadequate materials to diagnose visual efficiency in children. These
problems affect the teaching-training role performance of Teachers of
inclusive schools dealing with visually impaired children (VI)
b) Problems faced by teachers dealing with HI children
The problem checklist pertaining to problems faced in dealing Visually
Impaired children has 14 statements which are related to the teachers’ role
performance. The responses whether ‘facing problem’ or ‘not facing problem’
as ticked by teachers for each problem are counted and converted to
percentages. Number and percentage of teachers (HI) Facing and Not Facing
the Problem in performing their role are presented in Table-15
Table-15
Number and percentage of teachers (dealing with HI children) Facing
and Not facing the Problems in performing their role
S. NO Statement of the Problem (HI)
Facing the Problem
Not Facing the
Problem
Cou
nt
%
Cou
nt
%
1 Lack of knowledge in conducting screening tests to identify the degree of hearing impairment.
39 61.90 24 38.10
2 Inadequate knowledge about the nature of speech impairment and remedial strategies. 40 63.49 23 36.51

156
S. NO Statement of the Problem (HI)
Facing the Problem
Not Facing the
Problem
Cou
nt
%
Cou
nt
%
3 Lack of trained speech therapist/ audiologist in the school. 47 74.60 16 25.40
4 Lack of competency in the utilization of studies, slides, video tapes and films to facilitate speech reading.
40 63.49 23 36.51
5 Lack of speech and auditory training materials. 53 84.13 10 15.87
6 Lack of competency in organizing vocational training Programmes to HI children. 47 74.60 16 25.40
7 Lack of skill in using auditory training. 39 61.90 24 38.10
8 Insufficient knowledge in the advancement of hearing aids. 41 65.08 22 34.92
9 Inability to use cues to discriminate among various speech sounds. 37 58.73 26 41.27
10 Lack of microcomputers and skill in using the same in the school. 54 85.71 9 14.29
11 Lack of skill in using group hearing system and loop induction system to teach HI children.
25 39.68 38 60.32
12 Problems arising due to different age grades of HI children in the same class. 25 39.68 38 60.32
13 Teaching children with different degrees of hearing loss in the same class.
25 39.68 38 60.32
14 Lack of skill in using non-verbal clues and body movements and gestures to convey the message to HI children.
41 65.08 22 34.92
From table-15, it is found that the highest percentage 85.71 of the
Teachers dealing with Hearing Impaired Children are facing the problem
“Lack of microcomputer’’ and “skill in using same in the school” followed by
problems “Lack of speech and auditory training materials”. Most of the
Teachers facing above 60% problem in’ Lack of knowledge in conducting
screening tests , in the remedial strategies , in the speech therapist ,

157
Utilizing of studies , vocabulary training , advancement of hearing aids and
Lack of skill in using non-verbal clues’.
The Teachers are facing nearly 40% problems in lack of skills in using
group hearing system , due to different age grades of HI children , different
degree of hearing loss.
Conclusion
It is found that all the teachers are facing problems such as Lack of
microcomputer and skill in using same in the school, lack of speech and
auditory training materials, the speech therapist not available, lack of
competency in organizing vocational training programmes to HI children,
inadequate vocabulary training, insufficient knowledge of advancement of
hearing aids and lack of skill in using non-verbal clues.
These problems affect the teaching-training role performance of
Teachers of inclusive schools dealing with hearing impaired children (HI)
c) Problems faced by teachers dealing with MR children
The problem checklist pertaining to problems faced in dealing mentally
retarded children has 16 statements which are related to the teachers’ role
performance. The response whether ‘facing problem’ or ‘not facing problem’
as ticked by teachers for each problem are counted and converted to
percentages. Number and percentage of teachers (MR) Facing and Not
Facing the Problem in performing their role are presented in Table-16

158
Table-16
Number and percentage of teachers (Dealing with MR Children ) Facing
and Not Facing the each Problems in performing their role
S.No statement of the problem(MR)
Facing the
Problem
Not Facing the
Problem
N
% N
%
1 Lack of materials to disseminate information
to upgrade teacher’s knowledge. 48 67.61 23 32.39
2
Negative attitude of the SCHOOLS to
integrate borderline MR children with their
normal peers to develop their self-concept.
26 36.62 45 63.38
3
Lack of knowledge about case study
approach in understanding the
developmental aspects of MR children.
40 56.34 31 43.66
4 Lack of knowledge about task analysis to
teach daily living skills to MR children. 29 40.85 42 59.15
5 Lack of psychologists services in the schools. 46 64.79 25 35.21
6
Lack of skill in the preparation and use of
audio-visual aids suitable to the teaching of
MR children.
36 50.70 35 49.30
7
Non-availability of structured and
systematic learning materials for MR
children.
54 76.06 17 23.94
8 Lack of vocational skills on the part of the
teacher. 17 23.94 54 76.06

159
S.No statement of the problem(MR)
Facing the
Problem
Not Facing the
Problem
N
% N
%
9 Lack of knowledge about the informal
educational evaluation procedures. 30 42.25 41 57.75
10
Lack of adequate facilities to provide
simulative environment to the MR child for
learning.
50 70.42 21 29.58
11 Lack of knowledge about the motivational
techniques on the part of the teacher. 16 22.54 55 77.46
12 The large number of students in the
classroom. 47 66.20 24 33.80
13
Lack of knowledge about the appropriate
pedagogical techniques of teaching to MR
child.
34 47.89 37 52.11
14 Problems in providing instructions to appeal
all the senses of the MR child. 57 80.28 14 19.72
15 Problems in use of non-verbal
communication. 48 67.61 23 32.39
16 Lack of time to concentrate on the special
needs of MR children. 40 56.34 31 43.66
From table-16, it is found that the highest percentage (80.28) of Teachers
dealing with Mentally Retarded children are facing the problem “problems in
providing instructions to appeal all the senses of the MR child” followed by

160
70 to-60 % of teachers facing problems Sl.No. 7, 10, 15, 1, 12 and 5. Non-
verbal communication, large number of students in the class, psychologists
services, materials to upgrade teacher’s knowledge.
Most of the Teachers facing problem below56 to 36% in the lack of
case study approach, Non-availability of structured and systematic learning
materials, simulative environment, use of non-verbal communication, large
number of students in the class; lack of psychologists services, lack of skill
in the preparation and use of audio-visual aids and lack of time.Teachers
are facing the least problem (22%), as lack of knowledge of motivational
techniques.
Conclusion
All the teachers are facing problems such as problems in providing
instructions to appeal all the senses of the MR Child, lack of skill in non-
verbal communication, large number of students in the class, lack of
psychologists’ services, lack of materials to upgrade teacher’s knowledge,
lack of skill in the preparation and use of audio-visual aids and lack of time.
These problems affect the teaching-training role performance of
Teachers of inclusive schools dealing with mentally retarded children (MR)
d) Problems faced by teachers dealing with OH children
The problem checklist pertaining to problems faced in dealing mentally
retarded children has 9 statements which are related to the teachers’ role
performance. The response whether ‘facing problem’ or ‘not facing problem’
as ticked by teachers for each problem are counted and converted to

161
percentages. Number and percentage of teachers (OH) Facing and Not
Facing the Problem in performing their role are presented in Table-17
Table-17
Number and percentage of teachers (dealing with OH children) Facing
and Not facing the Problems in performing their role
S. NO
Statement of the Problem(OH) Facing the Problem
Not Facing the Problem
N % N %
1 Difficulty in acquiring knowledge about the different aspects of human brain.
33 64.71 18 35.29
2 Lack of knowledge about the causes of neuron-motor defectives and health impairments in children.
35 68.63 16 31.37
3 Lack of skill in assessing the emotional changes occurring in OH children.
29 56.86 22 43.14
4 Lack of suitable materials needed for the academic progress of OH children.
34 66.67 17 33.33
5 Lack of knowledge and skill in providing vocational training required for OH children.
66 50.98 25 49.02
6 Lack of knowledge and skill in using various behavioral therapeutic techniques.
29 56.86 22 43.14
7 Inadequate time to pay individual attention towards OH children. 33 64.71 18 35.29
8 Lack of adequate manipulative materials in the school. 41 80.39 10 19.61
9
Lack of training skills in using general education as well as special education techniques, in teaching orthopedically handicapped.
28 54.90 23 45.10
From table-17, it is found that the highest percentage 80.39 of
teachers dealing with OH children are facing the problem “Lack of adequate
manipulative materials in the school” followed by statement No. 2,4,7 and 1

162
facing the problem above 60% of the teachers. It indicates teacher facing
the problem: neuron-motor defectives, lack of suitable materials, lack of
time to pay individual attention and lack of knowledge about different
aspects of human brain. The statement No.s 3,6 and 9 above 50% of the
teachers are facing the problems which indicate lack of skill in assessing the
emotional changes, various behavioral therapeutic techniques and training
skills in special schools.
The least problem faced by50.98%of the teachers is lack of knowledge and
skill in providing vocational training required for OH children.
Conclusion
All the teachers are facing problems such as Lack of adequate
manipulative materials in the school, lack of suitable materials needed for
the academic progress of OH children, difficulty in acquiring knowledge
about the different aspects of human brain and lack of time to pay
individual attention to OH children. These problems affect the teaching-
training role performance of Teachers of inclusive schools dealing with
orthopedically handicapped children (OH).
5.3 INFERENTIAL ANALYSIS
The hypotheses formulated at the beginning of the study were verified
using suitable statistical tests. For Differential analysis, two-tailed test of
significance of difference between mean scores of two groups were used.

163
TESTING THE HYPOTHESES OF THE STUDY Hypothesis-1-Male and Female Teachers differ significantly in the
attitude with reference to 1.Inclusive School, 2.Education of CWSN in
inclusive schools, 3.Teaching in inclusive schools
Table-18
‘t’-values: significance of difference between mean
scores of attitude of teachers according to gender
Dimension of Attitude
Male Teachers Female Teachers t-values P-values
N Mean SD N Mean SD 1 Inclusive
School 69 77.63 8.61 142 76.75 8.37 0.71 0.477
2 Education of CWSN in inclusive schools
69 85.57 8.73 142 83.17 9.89 1.71 0.088
3 Teaching in inclusive schools
69 87.99 6.97 142 85.80 8.05 2.04 0.043**
NOTE: * Denotes significant at 0.05 Level **Denotes significant at 0.01 Level
From table-18, it is found that the t-value is significant at 0.01 level
with respect to attitude of Inclusive School teachers towards Teaching in
inclusive schools, indicating Male and Female Teachers differ significantly.
Hypothesis no.1 is accepted with respect to attitude of teachers to
teaching in inclusive schools.
CONCLUSION Gender has significantly influenced the attitude of teachers to
teaching in inclusive schools. Male teachers have more favorable attitude
than the Female teachers to teaching CWSN in inclusive schools.
Male and female teachers do not differ significantly in their attitude to
inclusive schools, and education of CWSN in inclusive schools.

164
Hypothesis-2
Male and Female teachers differ significantly in their role performance with
reference to the type of children with special needs.
TABLE-19
‘t’-values: significance of difference between mean scores of role
performance of teachers according to gender
Teachers dealing with CWSN
Male Teachers Female Teachers t-
values
P-
values N Mean SD N Mean SD
1 VI 11 66.82 7.47 15 57.86 5.86 3.43 0.002** 2 HI 26 60.74 8.87 37 61.19 7.91 0.21 0.831 3 MR 17 60.59 7.09 54 57.93 6.63 1.42 0.160 4 OH 15 61.41 9.65 36 59.74 8.16 0.63 0.530 5 Total sample of
teachers 69 61.81 8.54 142 59.23 7.37 2.27 0.024*
NOTE: * Denotes significant at 0.05 Level **Denotes significant at 0.01 Level From table-19, it is found that the t-value is significant at 0.01 level with
respect to role performance of teachers, indicating Male and Female
Teachers dealing VI children differ significantly in their role performance
The t-value of Male and Female Teachers in the total sample indicates
significant difference at 0.05 level, in their role performance
With reference to male and female Teachers dealing with HI, MR and OH
children, there is no difference the role performance.
Hypothesis no.2 is accepted with respect to teachers dealing VI children and
total sample of teachers irrespective of the type of CWSN in inclusive
schools.

165
CONCLUSION
Male teachers’ role performance is higher than role performance of
female teachers in dealing with visually impaired children in inclusive
schools.
There is no significant difference in the role performance of male and
female teachers dealing with hearing impaired, mentally retarded, and
orthopedically handicapped children in inclusive schools.
For the total sample, the role performance of male teachers is higher
than that of the female teachers, irrespective of the category of CWSN they
deal with in inclusive schools.

166
Hypothesis-3
Male and Female Teachers dealing with different categories of children
with special needs differ significantly in the problems faced by them.
TABLE –20
‘t’-values: significance of difference between mean scores of problems
faced by teachers according to gender
Teachers dealing with CWSN
Male Teachers Female Teachers t-values
P-values N Mean SD N Mean SD
1 VI 11 66.97 33.84 15 66.06 36.28 0.06 0.950
2 HI 26 65.93 25.66 37 60.42 23.00 0.89 0.376 3 MR 17 58.82 29.98 54 53.01 28.39 0.73 0.470 4 OH 15 68.89 22.69 36 60.19 29.02 1.04 0.306 5 Problems of
total sample
of teachers
69 64.98 27.23 142 58.13 28.22 1.67 0.096
From table-20,it is found that the‘t’ values are not found to be
significant with respect to problems faced by male and female teachers
dealing with CWSN in inclusive schools.
Hypothesis-3 is not accepted with respect to problems faced by male and
female teachers dealing with different categories of children with special
needs in inclusive schools.
CONCLUSION
Male and female teachers of inclusive schools do not differ
significantly in the problems faced by them in dealing with any category of
CWSN in inclusive schools.

167
Hypothesis-4
Teachers with less than or equal to 5 years experience and teachers
with greater than 5 years experience differ significantly in the attitude with
reference to 1.Inclusive School, 2.Education of CWSN in inclusive schools,
3. Teaching in inclusive schools
Table-21
‘t’-values: significance of difference between mean scores of attitude of
teachers according to teaching experience
Dimension of Attitude
Teaching Experience <=5 yrs
Teaching Experience >5 Yrs t-
values P-
values N Mean SD N Mean SD 1 Inclusive
School 83 77.35 8.59 128 76.84 8.37 0.43 0.667
2 Education
of CWSN in
inclusive
schools
83 84.41 9.50 128 83.66 9.64 0.56 0.578
3 Teaching
in inclusive
schools 83 86.57 6.71 128 86.48 8.40 0.09 0.929
From table-21,it is found that the‘t’ values are not found to be
significant with respect to teachers with less than or equal to 5 years
experience and teachers with greater than 5 years experience in their
attitude.
Hypothesis-4 is not accepted with respect to teachers with less than
or equal to 5 years experience and teachers with greater than 5 years
experience in their attitude to inclusive schools, education of CWSN in
inclusive schools and teaching in inclusive schools .

168
CONCLUSION
Teachers with less than or equal to 5 years experience and teachers
with greater than 5 years experience do not differ significantly in their
attitude with reference to 1.Inclusive Schools, 2. Education of CWSN in
inclusive schools, 3. Teaching in inclusive schools
Hypothesis-5
Teachers with less than or equal to 5 years experience and teachers
with greater than 5 years experience differ significantly in their role
performance with reference to the type of children with special needs.
TABLE –22
‘t’-values: significance of difference between mean scores of role
performance of teachers according to teaching experience
Teachers dealing with
CWSN
Teaching Experience <=5yrs
Teaching Experience > 5yrs t-
values P-
values N Mean SD N Mean SD 1 VI 11 63.96 10.03 15 59.95 5.61 1.30 0.206
2 HI 24 59.72 5.77 39 61.79 9.45 0.97 0.337
3 MR 22 58.95 6.02 49 58.39 7.15 0.32 0.752
4 OH 26 60.00 8.90 25 60.47 8.37 0.19 0.847
5 Total sample
of teachers 83 60.16 7.57 128 60.01 8.05 0.13 0.894
From table-22,it is found that the ‘t’ values are not found to be
significant with respect to teachers with less than or equal to 5 years
experience and teachers with greater than 5 years experience in role
performance .

169
Hypothesis-5 is not accepted with respect to teachers with less than or equal to 5
years experience and teachers with greater than 5 years experience in their role
performance dealing with CWSN in inclusive schools.
CONCLUSION
Teachers with less than or equal to 5 years experience and teachers
with greater than 5 years experience do not differ significantly in their role
performance with reference to the type of children with special needs in
inclusive schools.
Hypothesis-6
Teachers with less than or equal to 5 years experience and teachers
with greater than 5years experience differ significantly in the problems faced
by them, with reference to the type of children with special needs.
TABLE-23
‘t’-values: significance of difference between mean scores of problems
faced by teachers according to teaching experience
Problems of total sample of teachers
Teaching experience <= 5 years
Teaching experience > 5 years t-
values P-
values N Mean SD N Mean SD
1 VI 11 66.12 28.77 15 66.67 39.28 0.04 0.969
2 HI 24 71.43 23.07 39 57.33 23.38 2.34 0.023*
3 MR 22 51.42 27.14 49 55.74 29.50 0.58 0.561
4 OH 26 58.12 26.16 25 67.56 28.31 1.24 0.222
5 Problems of total sample of teachers
83 61.25 26.64 128 59.81 28.97 0.36 0.716
NOTE: * Denotes significant at 0.05 Level

170
From table-22, it is found that the ‘t’ value is found to be significant
with respect to teachers with less than or equal to 5 years experience and
teachers with greater than 5 years experience in problems faced dealing
with hearing impaired children. ‘t’ values of other groups are nor found to be
significant.
Hypothesis-6 is not accepted with respect to teachers with less than or
equal to 5 years experience and teachers with greater than 5 years
experience in facing problems in dealing hearing impaired children in
inclusive schools.
CONCLUSION
Teachers with less than or equal to 5 years experience face more
problems than teachers with greater than 5 years experience, in dealing
with the hearing impaired children in inclusive schools.
Teachers with less than or equal to 5 years experience and teachers
with greater than 5 years experience do not differ significantly in the
problems faced in dealing with visually impaired children, mentally retarded
children and orthopedically handicapped children in inclusive schools.

171
Hypothesis-7
Teachers received special training and teachers not received special
training differ significantly in their attitude with reference to 1.Inclusive
School, 2. Education of CWSN in inclusive schools, 3.Teaching in inclusive
schools.
Table-24
‘t’-values: significance of difference between mean scores of
attitude of teachers according to special training
Dimension of Attitude
t-
values
P-
values Special Training
Taken Special Training
not Taken N Mean SD N Mean SD
1 Inclusive
School 94 79.06 6.95 117 75.41 9.18 3.19 0.002*
2 Education
of CWSN
inclusive
schools
94 83.95 9.30 117 83.96 9.83 0.00 0.998
3 Teaching
in
inclusive
schools
94 87.61 7.52 117 85.63 7.88 1.85 0.065
NOTE: * Denotes significant at 0.05 Level
From table-24,it is found that the ‘t’ value is significant at 0.05 level
with respect to difference in attitude of ‘Special Training Taken’ teachers and
‘Special Training not Taken’ teachers to inclusive schools. ‘t’ values are not
significant for other dimensions of attitude.
Hypothesis no.7 is accepted with respect to attitude of teachers towards
inclusive schools.

172
CONCLUSION
Special Training Taken and Special Training not Taken has significantly
influenced the attitude of teachers’ towards inclusive schools. The attitude
of ‘Special Training Taken’ teachers to inclusive schools is more favorable
than the teachers ‘Not Taken Special Training’
Teachers’ attitude to education of CWSN in inclusive schools and attitude
to teaching in inclusive schools is not affected by special training taken by
the teachers dealing with CWSN in inclusive schools.
Hypothesis-8
Teachers received special training and teachers not received special
training differ significantly in their role performance with reference to the
type of children with special needs.
TABLE –25
‘t’-values: significance of difference between mean scores of
Role performance of teachers according to special training
Role Performance of
Teachers
t-values
P-
values
Special Training Taken
Special Training not Taken
N Mean SD N Mean SD
1 VI 11 65.13 8.70 15 59.10 6.32 2.05 0.051
2 HI 33 60.20 8.00 30 61.89 8.57 0.81 0.422
3 MR 30 59.23 5.66 41 58.08 7.54 0.70 0.485
4 OH 20 61.35 7.72 31 59.51 9.11 0.75 0.458
5
Total sample
of teachers 94 60.71 7.45 117 59.56 8.15 1.06 0.292

173
From table-25,it is found that the ‘t’ values are not found to be
significant with respect to teachers received special training and teachers
not received special training in dealing with different categories of children
with special needs in inclusive schools.
Hypothesis-8 is not accepted with respect to teachers received special
training and teachers not received special training in dealing with different
categories of children with special needs
CONCLUSION
Teachers received special training and teachers not received special
training do not differ significantly in their role performance with reference to
the type of children with special needs in inclusive schools.
174
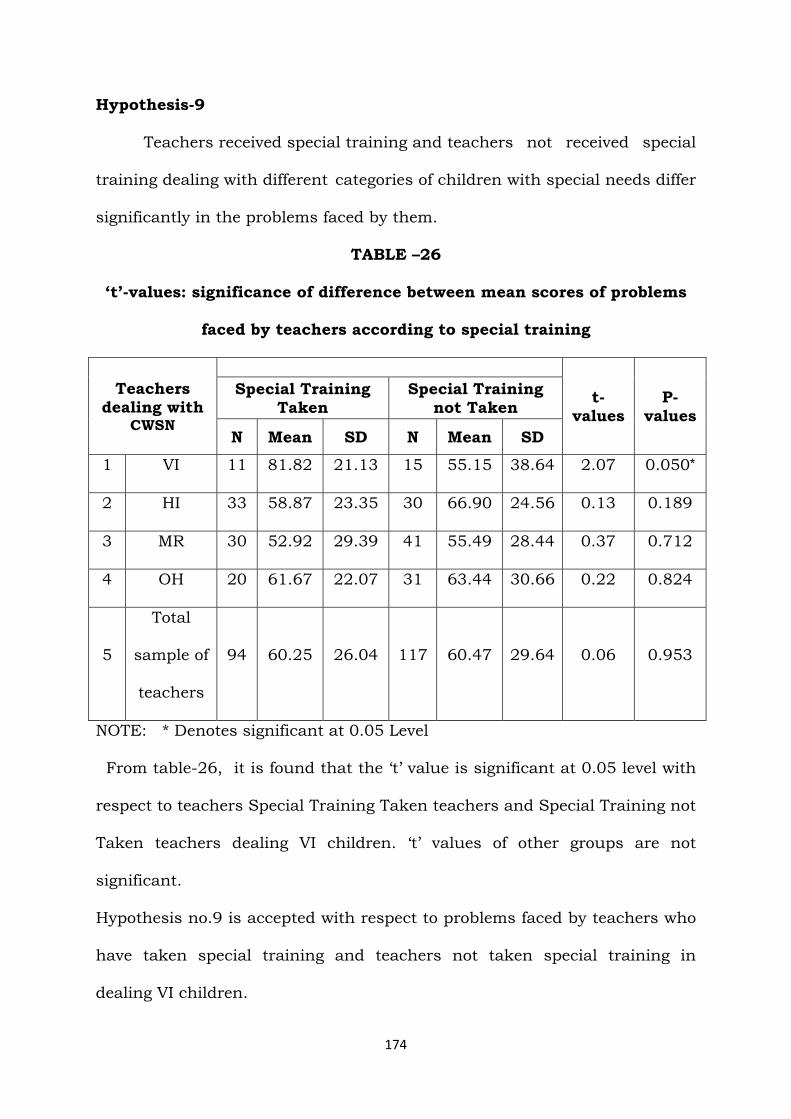
Hypothesis-9
Teachers received special training and teachers not received special
training dealing with different categories of children with special needs differ
significantly in the problems faced by them.
TABLE –26
‘t’-values: significance of difference between mean scores of problems
faced by teachers according to special training
Teachers dealing with
CWSN
t-values
P-values
Special Training Taken
Special Training not Taken
N Mean SD N Mean SD 1 VI 11 81.82 21.13 15 55.15 38.64 2.07 0.050*
2 HI 33 58.87 23.35 30 66.90 24.56 0.13 0.189
3 MR 30 52.92 29.39 41 55.49 28.44 0.37 0.712
4 OH 20 61.67 22.07 31 63.44 30.66 0.22 0.824
5
Total
sample of
teachers
94 60.25 26.04 117 60.47 29.64 0.06 0.953
NOTE: * Denotes significant at 0.05 Level
From table-26, it is found that the ‘t’ value is significant at 0.05 level with
respect to teachers Special Training Taken teachers and Special Training not
Taken teachers dealing VI children. ‘t’ values of other groups are not
significant.
Hypothesis no.9 is accepted with respect to problems faced by teachers who
have taken special training and teachers not taken special training in
dealing VI children.

175
CONCLUSION
The teachers who have taken special training and dealing Visually impaired
children face more problems than teachers who have not taken special
training and dealing Visually impaired children in inclusive schools.
Special training taken by teachers does not affect the problems faced by
teachers dealing hearing impaired, mentally retarded and orthopedically
handicapped children in inclusive schools.
Hypothesis-10
Teachers differ significantly in the attitude towards inclusive schools
according to the type of children with special needs.
Table-27
Analysis of Variance: Calculated F value of Teachers dealing with CWSN
and Attitude of teachers towards inclusive schools
Teachers dealing with
CWSN
Attitude of teachers towards inclusive schools F-value P-value
N Mean SD 1 VI 26 77.69 7.93
2.87 0.037 2 HI 63 75.13 9.09
3 MR 71 76.62 8.36
4 OH 51 79.64 7.45
From table-27, it is found that the Based on DUNCAN MULTIPLE
RANGE TEST, the calculated F value is found to be significant at 0.05 level.
Since it is Homogeneous subset 1,(highest and lowest means are not
significantly different),it may be concluded that Teachers dealing with HI

176
children, Teachers dealing with MR children, and Teachers dealing with VI
children do not differ in their attitude towards inclusive schools.
Similarly, in Homogeneous subset 2,(Teachers dealing with MR
children, Teachers dealing with VI children, and Teachers dealing with OH
children do not differ in their attitude towards inclusive schools.
To find out if there exists difference between sub set 1 and sub set 2,
further calculation revealed that –
‘t’ value 2.51 is significant at 0.05 level for d.f.=112 with reference to
teachers dealing with HI children and teachers dealing with OH children in
their attitude towards inclusive school.
‘t’ value 2.09 is significant at 0.05 level for d.f.=120 with reference to
teachers dealing with MR children and teachers dealing with OH children in
their attitude towards inclusive school.
Hypothesis-10 is accepted with reference to teachers dealing with HI
children and teachers dealing with OH children; teachers dealing with MR
children and teachers dealing with OH children in their attitude towards
inclusive school.
Conclusion
Teachers dealing with HI children and teachers dealing with OH children
differ significantly in the attitude towards inclusive schools.
Teachers dealing with MR children and teachers dealing with OH children
differ significantly in the attitude towards inclusive schools.
Teachers dealing with OH children have more favorable attitude towards
inclusive schools than teachers dealing with HI and MR children.

177
Hypothesis-11
Teachers differ significantly in the attitude towards Education of
CWSN in inclusive schools according to the type of children with special
needs.
TABLE-28
Analysis of Variance: Calculated F value of Teachers dealing with CWSN
and Attitude of teachers towards education of CWSN in inclusive
schools
Teachers dealing with CWSN
Attitude of teachers towards education of CWSN
F-value P-value N Mean SD
1 VI 26 86.54 8.90
2.3778 0.0709 2 HI 63 81.71 10.15 3 MR 71 83.77 9.70 4 OH 51 85.66 8.55
From table-28, it is found that Based on DUNCAN MULTIPLE
RANGE TEST, the calculated F value is found to be not significant at 0.05
level.
Hypothesis-11 is not accepted.
Conclusion
Teachers do not differ significantly in the attitude towards Education
of CWSN in inclusive schools according to the type of children with special
needs they deal with.

178
Hypothesis-12
Teachers differ significantly in the attitude towards teaching in
inclusive schools according to the type of children with special needs.
Table-29
Analysis of Variance: Calculated F value of Teachers dealing with CWSN
and Attitude of teachers towards teaching in inclusive schools
Teachers dealing with CWSN
Attitude of teachers towards teaching in inclusive
schools F-value p-value
N Mean SD
1 VI 26 86.72 7.50
0.296 0.828 2 HI 63 86.09 7.12
3 MR 71 86.22 9.01
4 OH 51 87.35 6.89
From table-29, it is found that Based on DUNCAN MULTIPLE
RANGE TEST, the calculated F value is found to be not significant at 0.05
level.
Hypothesis-12 is not accepted.
Conclusion
Teachers do not differ significantly in the attitude towards teaching in
inclusive schools according to the type of children with special needs they
deal with.

179
Hypothesis-13
Teachers differ significantly in the role performance in inclusive
schools according to the type of children with special needs.
Table-30
Analysis of Variance: Calculated F value of Teachers dealing with CWSN
and role performance of teachers
Teachers dealing with CWSN
role performance of teachers F-value P-values
N MEAN SD 1 VI 26 61.65 8.87
1.535 0.206
2 HI 63 61.01 8.25
3 MR 71 58.57 6.79
4 OH 51 87.35 8.56
From table-30, it is found that Based on DUNCAN MULTIPLE
RANGE TEST, the calculated F value is found to be not significant at 0.05
level.
Hypothesis-13 is not accepted.
Conclusion
Teachers do not differ significantly in the role performance in inclusive
schools according to the type of children with special needs they deal with.

180
Hypothesis-14
Teachers differ significantly in the problems faced in inclusive schools
according to the type of children with special needs.
Table-31
Analysis of Variance: Calculated F value of Teachers dealing with CWSN
and problems faced by teachers
Teachers dealing with
CWSN
problems faced by teachers F-value P-value
N Mean SD
1 VI 26 66.43 36.57
1.765 0.155 2 HI 63 62.70 24.08 3 MR 71 54.40 28.67 4 OH 51 62.75 27.38
From table-31, it is found that Based on DUNCAN MULTIPLE RANGE
TEST, the calculated F value is found to be not significant at 0.05 level.
Hypothesis-14 is not accepted.
Conclusion
Teachers do not differ significantly in the problems faced in inclusive
schools according to the type of children with special needs they deal with.

181
Hypothesis - 15
There is association between teachers according to category of CWSN
and their attitude, role performance and problems faced by them in
inclusive schools.
TABLE-32
Chi-Square values of association between type of teachers dealing
CWSN and attitude, role performance and problems faced by teachers in
inclusive schools
Variables level
teachers dealing Type of CWSN
Total Chi-
Square Value
p-
value VIC
HIC
MR
C
OH
C
Attitude of teachers towards inclusive schools
Low 7 (11.7) [26.9]
26 ( 43.3) [41.3]
21 (35.0) [29.6]
6 (10.0) [11.8]
60 13.38
0.037 Average 12
(12.5) [46.2]
24 (25.0) [38.1]
34 (35.4) [47.9]
26 (27.1) [51.0]
96
High 7 (12.7) [26.9]
13 (23.6) [20.6]
16 (29.1) [22.5]
19 (34.5) [37.3]
55
Attitude of teachers towards
education of CWSN in inclusive schools
Low 5 (9.8) [19.2]
18 ( 35.3) [28.6]
17 (33.3) [23.9]
11 (21.6) [21.6]
51
5.64
0.463 Average
11
(10.9) [42.3]
34 (33.7) [54.0]
32 (31.7) [45.1]
24 (23.8) [47.1]
101
High 10 (16.9) [38.5]
11 (18.6) [17.5]
22 (37.3) [31.0]
16 (27.1) [31.4]
59
Attitude of teachers towards
teaching in inclusive schools
Low 7 (15.2) [26.9]
15 ( 32.6) [23.8]
14 (35.4) [19.7]
10 (21.7) [19.6]
46
1.733
0.941 Average 13
(10.3) [50.0]
38 (30.2) [60.3]
44 (34.9) [62.0]
31 (24.6) [60.8]
126
High
6 (15.4) [23.1]
10 (25.6) [15.9]
13 (33.3) [18.3]
10 (25.6) [19.6]
39
Role Performance of Teachers
Low 8 (17.4) [30.8]
10 ( 21.7) [15.9]
17 (37.0) [23.9]
11 (21.9) [11.8]
46
10.77
0.095 Average 9
(7.9) [34.6]
37 (32.5) [58.7]
44 (38.6) [62.0]
24 (21.1) [47.1]
114
High 9 (17.6) [34.6]
16 (31.5) [25.4]
10 (19.6) [14.1]
16 (31.4) [31.4]
51
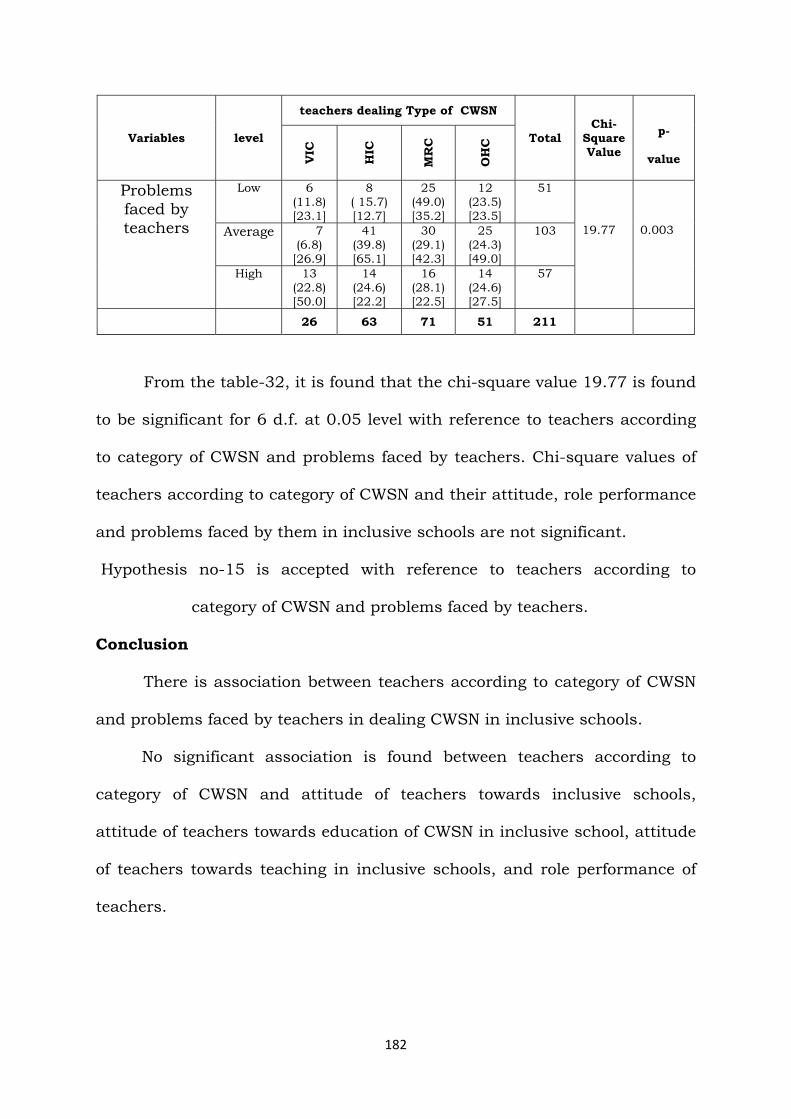
182
Variables level
teachers dealing Type of CWSN
Total Chi-
Square Value
p-
value VIC
HIC
MR
C
OH
C
Problems faced by teachers
Low 6 (11.8) [23.1]
8 ( 15.7) [12.7]
25 (49.0) [35.2]
12 (23.5) [23.5]
51
19.77
0.003 Average 7 (6.8) [26.9]
41 (39.8) [65.1]
30 (29.1) [42.3]
25 (24.3) [49.0]
103
High 13 (22.8) [50.0]
14 (24.6) [22.2]
16 (28.1) [22.5]
14 (24.6) [27.5]
57
26 63 71 51 211
From the table-32, it is found that the chi-square value 19.77 is found
to be significant for 6 d.f. at 0.05 level with reference to teachers according
to category of CWSN and problems faced by teachers. Chi-square values of
teachers according to category of CWSN and their attitude, role performance
and problems faced by them in inclusive schools are not significant.
Hypothesis no-15 is accepted with reference to teachers according to
category of CWSN and problems faced by teachers.
Conclusion
There is association between teachers according to category of CWSN
and problems faced by teachers in dealing CWSN in inclusive schools.
No significant association is found between teachers according to
category of CWSN and attitude of teachers towards inclusive schools,
attitude of teachers towards education of CWSN in inclusive school, attitude
of teachers towards teaching in inclusive schools, and role performance of
teachers.

183
Hypothesis-16
There is association between teachers according to locality and their
attitude, role performance and problems faced by them in inclusive schools.
TABLE –33
Chi-Square values of association between locality and attitude, role
performance and problems faced by teachers in inclusive schools
Variables Level Locality
TOTAL Chi-
Square value
p-value Urban Rural
Attitude of teachers towards inclusive
schools
Low 33
(55.0) [41.8]
27 (45.0) [20.5]
60
11.106 *
0.003
Average 30
(31.3) [38.0]
66 (68.8) [50.o]
96
High 16
( 29.1) [20.3]
39 (70.9) [29.5]
55
Attitude of teachers towards education
of CWSN in inclusive school
Low 23
(45.1) [29.1]
28 (54.9) [21.2]
51
2.488 0.288 Average
38 (37.6) [48.1]
63 (62.4) [47.7]
101
High 18
( 30.5) [22.8]
41 (69.5) [31.1]
59
Attitude of teachers towards teaching
in inclusive schools
Low 23
(45.1) [29.1]
28 (54.9) [21.2]
51
2.488
0.288 Average
38 (37.6) [48.1]
63 (62.4) [47.7]
101
High 18
( 30.5) [22.8]
41 (69.5) [31.1]
59
Low 23
(45.1) 28
(54.9)
51
0.288

184
Variables Level Locality
TOTAL Chi-
Square value
p-value Urban Rural
Role Performance of
Teachers
[29.1] [21.2]
2.488
Average 38
(37.6) [48.1]
63 (62.4) [47.7]
101
High 18
( 30.5) [22.8]
41 (69.5) [31.1]
59
Problems of
teachers
Low 23
(45.1) [29.1]
28 (54.9) [21.2]
51
2.488
0.288 Average
38 (37.6) [48.1]
63 (62.4) [47.7]
101
High 18
( 30.5) [22.8]
41 (69.5) [31.1]
59
79 132 211
From the table-33, it is found that the Chi-Square value 11.106 is
found to be significant for 2 d.f. at 0.01 level. The association with reference
to locality and attitude of teachers towards inclusive school is significant.
Chi square values indicate that the association between locality and attitude
towards education of CWSN in inclusive schools, attitude towards teaching
CWSN in inclusive schools, role performance of teachers and problem faced
by teachers of inclusive schools, is not significant.
Hypothesis no-16 is accepted with reference to locality of teachers and
attitude of teachers towards inclusive school.
Conclusion
There is significant association between locality of teachers and their
attitude towards inclusive schools.

185
There is no significant association between teachers’ locality and
teachers' attitude towards education of CWSN in inclusive schools, attitude
towards teaching CWSN in inclusive schools, teachers’ role performance and
problems faced by teachers in dealing CWSN in inclusive schools.
Hypothesis-17
There is association between class taught to CWSN by teachers and
their attitude, role performance and problems faced by them in inclusive
schools.
TABLE – 34 Chi-Square values of association between classes taught to CWSN and
attitude, role performance and problems faced by teachers in inclusive
schools.
Variable Level CLASS TAUGHT
TOTAL Chi-
Square Value
p- value I II III IV V
Attitude of
teachers
towards
inclusive
schools
Low 8
(13.3)
[42.1]
9
(15.0)
[28.1]
15
(25.0)
[26.8]
11
(18.3)
[23.4]
17
(28.3)
[29.8]
60
10.332
0.242
Average 6
(6.3)
[31.6]
11
(11.5)
[34.4]
30
(31.3)
[53.6]
27
(28.I)
[57.4]
22
(22.9)
[38.6]
96
High 5
(9.1)
[26.1]
12
(21.8)
[37.5]
11
(20.0)
[19.6]
9
(16.4)
[19.1]
18
(32.7)
[31.6]
55
Attitude of
teachers
towards
education of
CWSN in
inclusive
school
Low 7
(13.7)
[36.8]
8
(15.7)
[25.0]
14
(27.5)
[25.0]
8
(15.7)
[17.0]
14
(27.5)
[24.6]
51
8.577 0.379 Average
9
(8.9)
[47.4]
16
(15.8)
[50.0]
22
(21.8)
[39.3]
29
(28.7)
[61.7]
25
(24.8)
[43.9]
101
High 3
(5.1)
[15.8]
8
(13.6)
[25.0]
20
(33.9)
[35.7]
10
(16.9)
[21.3]
18
(30.5)
[31.6]
59

186
Variable Level CLASS TAUGHT
TOTAL Chi-
Square Value
p- value I II III IV V
Attitude of
teachers
towards
teaching in
inclusive
schools
Low 5
(10.9)
[26.3]
10
(21.7)
[31.3]
14
(30.4)
[25.0]
6
(13.0)
[12.8]
12
(23.9)
[19.3]
46
14.267
0.075
Average 11
(8.7)
[57.9]
15
(11.9)
[46.9]
31
(24.6)
[55.4]
27
(21.4)
[57.4]
42
(33,3)
[73.7]
126
High 3
(7.7)
[15.8]
7
(17.9)
[21.9]
21
(28.2)
[19.6]
14
(35.9)
[29.8]
4
(10.3)
[7.0]
39
Role
Performance
of Teachers
Low 3
(6.5)
[15.8]
6
(13.0)
[18.8]
18
(39.1)
[32.1]
8
(17.4)
[17.0]
11
(23.9)
[19.3]
46
6.73 0.565 Average 13
(11.4)
[68.4]
17
(14.9)
[53.1]
25
(21.9)
[44.6]
26
(22.8)
[55.3]
33
(28.9)
[57.9]
114
High
3
(5.9)
[15.8]
9
(17.6)
[28.1]
13
(25.5)
[23.2]
13
(25.5)
[27.7]
13
(25.5)
[22.8]
51
Problems of
teachers
Low 8
(15.7)
[42.7]
6
(11.8)
[18.8]
14
(27.5)
[25.0]
10
(19.6)
[21.3]
13
(25.5)
[22.8]
51
10.17
0.253
Average 6
(5.8)
[31.6]
19
(18.4)
[59.4]
22
(21.8)
[39.3]
28
(27.2)
[59.6]
28
(27.2)
[49.1]
103
High 5
(8.8)
[26.3]
7
(12.3)
[21.9]
20
(35.1)
[35.7]
9
(15.8)
[19.1]
16
(28.1)
[28.1]
57
19 32 56 47 57 211
From the table-34, it is found that the Chi-Square values are found to
be not significant for 8 d.f. at 0.05 level. There is no association between
class taught to CWSN by teachers and attitude of teachers towards inclusive
school, attitude towards education of CWSN in inclusive schools, attitude
towards teaching CWSN in inclusive schools, role performance of teachers
and problem faced by teachers of inclusive schools.

187
Hypothesis no-17 is not accepted.
Conclusion:
There is no significant association between class taught to CWSN by
teachers and teachers’ attitude towards inclusive school, attitude towards
education of CWSN in inclusive schools, attitude towards teaching CWSN in
inclusive schools, role performance of teachers and problems faced by
teachers of inclusive schools.
Hypothesis-18
There is association between gender of teachers and their attitude,
role performance and problems faced by them in inclusive schools.
TABLE – 35
Chi-Square values of association between teachers according to gender
and attitude, role performance and problems faced by teachers in
inclusive schools
Variables Levels
Gender
Total Chi-
Square Value
p- value
Male Female
Attitude of teachers towards inclusive schools
Low 16
(26.7) [23.2]
44 (73.3) [ 31.0]
60
1.45
0.484 Average
33 (34.4) [47.8]
63 (65.6) [44.4]
96
High 20
(36.4) [29.0]
35 (63.6) [24.6]
55

188
Variables Levels
Gender
Total Chi-
Square Value
p- value
Male Female
Attitude of teachers towards education of CWSN in inclusive school
Low 12
(23.5) [17.4]
39 (76.5) [ 27.5]
51
2.57
0.276
Average
36 (35.6) [52.2]
65 (64.4) [45.8]
101
High 21
(35.6) [30.4]
38 (64.4) [26.8]
59
Attitude of teachers towards teaching in inclusive schools
Low 9
(19.6) [13.0]
37 (80.4) [ 26.1]
46
5.82
0.054
Average 43
(34.1) [62.3]
83 (65.9) [58.5]
126
High 17
(43.6) [24.6]
22 (56.4) [15.5]
39
Role Performance of Teachers
Low 8
(17.4) [11.6]
34 (82.6) [ 26.8]
46
11.13
0.003
Average 36
(31.6) [52.2]
78 (68.4) [54.9]
114
High
25 (49.0) [36.2]
26 (51.0) [18.3]
51
Problems of teachers
Low
11 (21.6) [15.9]
40 (78.4) [ 28.2]
51
4.009 0.134 Average 36
(35.0) [52.2]
67 (65.0) [47.2]
103
High 22
(38.6) [31.9]
35 (61.4) [24.6]
57
69 142 211
From the table-35, it is found that the Chi-Square value 11.13 is
found to be significant for 2 d.f. at 0.01 level with reference to gender and

189
role performance of teachers. Chi-square values of other groups are not
significant. There is no association between gender and attitude of teachers
towards inclusive school, attitude towards education of CWSN in inclusive
schools, attitude towards teaching CWSN in inclusive schools, and problems
faced by teachers of inclusive schools.
Hypothesis No.18 is accepted with reference to association between
gender and role performance of teachers of inclusive schools.
Conclusion
There is significant association between gender and role performance
of teachers in inclusive schools.
There is no significant association between gender of teachers and
their attitude and problems faced by them in inclusive schools.
Hypothesis-19
There is association between age level of teachers and their attitude,
role performance and problems faced by them in inclusive schools.
TABLE – 36
Chi-Square values of association between teachers according to age
level of teachers and attitude, role performance and problems of total
sample of teachers in inclusive schools.
Variables Levels
Age levels of teachers
TOTAL CHI
Square values
P-values ≤35 yr 36—
45yr ≥46 yr
Attitude of teachers
towards inclusive
schools
Low 17
(28.3) [20.5]
28 (46.7) [32.9]
15 (25.0) [34.9]
60
4.49
0.34
Average 43
(44.8) [51.8]
35 (36.5) [41.9]
18 (18.8) [41.9]
96
High 23
(41.8) [27.7]
22 (40.0) [25.9]
10 (18.2) [23.3]
55

190
Variables Levels
Age levels of teachers
TOTAL CHI
Square values
P-values ≤35 yr 36—
45yr ≥46 yr
Attitude of teachers
towards education of
CWSN in inclusive
school
Low 14
(27.5) [16.9]
27 (52.9) [31.8]
10 (19.6) [23.3]
51
5.919
0.205
Average
42 (41.6) [50.6]
36 (35.6) [42.4]
23 (22.8) [53.5]
101
High 27
(45.8) [32.5]
22 (37.3) [25.9]
10 (16.9) [23.3]
59
Attitude of teachers
towards teaching in
inclusive schools
Low 16
(34.8) [19.3]
20 (43.5) [23.5]
10 (21.7) [23.3]
46
1.485
0.829
Average 53
(42.1) [63.9]
47 (37.3) [55.3]
26 (20.6) [60.5]
126
High 14
(35.9) [16.9]
18 (46.2) [21.2]
7 (17.9) [16.3]
39
Role Performance
of Teachers
Low 17
(37.0)
[20.5]
18
(39.1)
[21.2]
11
(23.9)
[26.6]
46
2.598
0.627
Average 42
(36.8)
[50.6]
47
(41.2)
[55.3]
25
(21.9)
[581]
114
High 24
(47.1)
[28.9]
20
(39.2)
[23.5]
7
(13.7)
[16.3]
51
Problems of
teachers
Low 24
(47.1)
[28.9]
19
(37.3)
[22.4]
8
(15.7)
[18.6]
51
5.011
0.286
Average 37
(35.9) [44.6]
47 (45.6) [55.3]
19 (18.4) [44.2]
103
High 22
(38.6)
[26.5]
19
(33.3)
[22.4]
16
(28.1)
[37.2]
57
83 85 43 211
From the table-36, it is found that the Chi-Square values are not
significant for 4 d.f. at 0.05 level. There is no association between age levels
of teachers and attitude of teachers towards inclusive school, attitude
towards education of CWSN of inclusive schools, attitude towards teaching

191
CWSN of inclusive schools, role performance of teachers and problems faced
by teachers of inclusive schools.
Hypothesis -19 is not accepted.
Conclusion
There is no significant association between age level of teachers and
attitude of teachers towards inclusive school, attitude towards education of
CWSN of inclusive schools, attitude towards teaching CWSN of inclusive
schools, role performance of teachers and problem faced by teachers of
inclusive schools.
Hypothesis-20
There is association between community of teachers and their
attitude, role performance and problems faced by them in inclusive schools.
TABLE – 37
Chi-Square values of association between teachers according to
community and attitude, role performance and problems faced by
teachers in inclusive schools.
variables Levels community of teachers
total Chi-
Square value
P- values
FC BC MBC SC/ST Attitude of
teachers
towards
inclusive
schools
Low 6
(10.0)
[42.9]
32
(53.3)
[32.7]
11
(18.3)
[19.3]
11
(18.3)
[26.2]
60
8.85
0.181
Average 6
6.3)
[42.9]
44
(45.8)
[44.9]
31
(32.3)
[54.4]
15
(15.6)
[35.7]
96
High 2
(3.6)
[14.3]
22
(40.0)
[22.4]
15
(27.3
[26.3])
16
(29.1)
[38.1]
55
Attitude of Low
3
(5.9)
[21.4]
21
(41.2)
[21.4]
17
(33.3)
[29.8]
10
(19.6)
[23.8]
51

192
variables Levels community of teachers
total Chi-
Square value
P- values
FC BC MBC SC/ST teachers
towards
education of
CWSN in
inclusive
school
Average
7
(6.9)
[50.0]
49
(48.5)
[50.0]
21
(20.8)
[36.8]
24
(23.8)
[57.1]
101
5.20
0.517
High
4
(6.8)
[28.6]
20
(47.5)
[28.6]
19
(32.2)
[33.3])
8
(13.6)
[19.0]
59
Attitude of
teachers
towards
teaching in
inclusive
schools
Low 6
(10.9)
[35.7]
21
(45.7)
[21.4]
10
(21.7)
[17.5]
10
(21.7)
[23.8]
46
11.747
0.067
Average 7
(5.6)
[50.0]
61
(48.4)
[62.2]
40
(31.7)
[70.2]
14
(14.3)
[42.9]
126
High 2
(5.1)
[14.3]
16
(41.0)
[16.3]
7
(17.9)
[12.3]
14
(35.9)
[33.3]
39
Role
Performance
of Teachers
Low 3
(6.5)
[21.4]
22
(47.8)
[22.4]
8
(17.4)
[14.0]
13
(28.3)
[31.0]
46
5.48
0.48 Average 6
(5.3)
[42.9]
52
(45.6)
[53.1]
35
(30.7)
[61.4]
21
(18.4)
[50.0]
114
High
5
(9.8)
[35.7]
24
(47.1)
[24.5]
14
(27.5)
[24.6]
8
(15.7)
[19.0]
51
Problems of
teachers
Low
3
(5.9)
[21.4]
20
(39.2)
[20.4]
15
(29.4)
[26.3]
13
(25.5)
[31.0]
51
5.83
0.44
Average 5
(4.9)
[35.7]
52
(50.5)
[53.1]
30
(29.1)
[52.6]
16
(15.5)
[38.1]
103
High 6
(10.5)
[42.9]
26
(45.6)
[26.5]
12
(21.1)
[21.1]
13
(22.8)
[31.0]
57
14 98 57 42 211

193
From the table-37,it is found that, the Chi-Square value are not
significant for 6 d.f. at 0.05 level. There is no association between
community of teachers and attitude of teachers towards inclusive school,
attitude towards education of CWSN of inclusive schools, attitude towards
teaching CWSN in inclusive schools, role performance of teachers and
problems faced by teachers of inclusive schools.
Hypothesis No.20 is not accepted.
Conclusion
There is no significant association between community of
teachers and attitude of teachers towards inclusive school, attitude towards
education of CWSN of inclusive schools, attitude towards teaching CWSN of
inclusive schools, role performance of teachers and problem faced by
teachers of inclusive schools.

194
Hypothesis-21 There is association between educational qualification of teachers and
their attitude, role performance and problems faced by them in inclusive
schools.
TABLE –38
Chi-Square values of association between teachers according to
educational qualification and attitude, role performance and problems
faced by teachers in inclusive schools.
variables Levels Educational Qualification of teachers CHI-
square value
P- values DTE Graduate Graduate with B.Ed total
Attitude of
teachers
towards
inclusive
schools
Low 39
(65.0)
[27.5]
9
(15.0)
[24.3]
12
(20.0)
[37.5]
60
2.59
0.627
Average 68
(70.8)
[47.9]
17
(17.7)
[45.9]
11
(11.5)
[34.4]
96
High 35
(63.6)
[24.6]
11
(20.0)
[29.7]
9
(16.4)
[28.1]
55
Attitude of
teachers
towards
education of
CWSN in
inclusive school
Low 26
(51.0)
[18.3]
12
(23.5)
[32.4]
13
(25.5)
[40.6]
60
9.377
0.052
Average 75
(74.3)
[52.8]
14
(13.9)
[37.8]
12
(11.9)
[37.5]
96
High 41
(69.5)
[28.9]
11
(18.6)
[29.7]
7
(11.9)
[21.9]
55
Attitude of
teachers
towards
teaching in
inclusive
schools
Low 26 (56.5) [18.3]
9 (19.6) [24.3]
11 (23.9) [34.4]
46
5.51
0.238
Average 90
(71.4)
[63.4]
19
(15.1)
[51.4]
17
(13.5)
[53.1]
126
High 26
(66.7)
[18.3]
9
(23.1)
[24.3]
4
(10.3)
[12.5]
39

195
variables Levels Educational Qualification of teachers CHI-
square value
P- values DTE Graduate Graduate with B.Ed total
Role
Performance
of Teachers
Low 31
(67.4)
[21.8]
10
(21.7)
[27.0]
5
(10.9)
[15.6]
46
2.24
0.690
Average 74
(64.9)
[52.1]
20
(17.5)
[54.1]
20
(17.5)
[62.5]
114
High 37
(72.5)
[26.1]
7
(13.7)
[18.9]
7
(13.7)
[21.9]
51
Problems of
teachers
Low 37
(72.5)
[26.1]
3
(5.9)
[8.1]
11
(21.6)
[34.4]
51
9.11
0.058 Average 71
(68.9)
[50.0]
19
(18.4)
[51.4]
13
(12.6)
[40.6]
103
High 34
(59.6)
[23.9]
15
(26.3)
[40.5]
8
(14.0)
[20.0]
57
142 37 32 211
From the table-38, it is found that, the Chi-Square values are not
significant for 4 d.f. at 0.05 level. There is no association between
educational qualification of teachers and attitude of teachers towards
inclusive school, attitude towards education of CWSN in inclusive schools,
attitude towards teaching CWSN in inclusive schools, role performance of
teachers and problem faced by teachers of inclusive schools.
Hypothesis 21 is not accepted.
Conclusion:
There is no association between educational qualification of teachers
and attitude of teachers towards inclusive school, attitude towards

196
education of CWSN of inclusive schools, attitude towards teaching CWSN of
inclusive schools, role performance of teachers and problems faced by
teachers of inclusive schools.
Hypothesis-22
There is association between marital status of teachers and their
attitude, role performance and problems faced by them in inclusive schools.
TABLE – 39
Chi-Square values of association between teachers according to marital
status and attitude, role performance and problems faced by teachers
in inclusive schools.
variables Levels Marital status
TOTAL Chi-
Square Value
p- value Married Unmarried
Attitude of
teachers towards
inclusive schools
Low
54
(90.0)
[28.6]
6
(10.0)
[27.3]
60
0.025
0.987
Average
86
(89.6)
[45.5]
10
(10.4)
[45.5]
96
High
49
(89.1)
[25.9]
6
(10.9)
[27.3]
55
Attitude of
teachers towards
education of
CWSN in
inclusive school
Low
45
(88.2)
[23.8]
6
(11.8)
[27.3]
51
0.476
0.787
Average
92
(91.1)
[48.7]
9
(8.9)
[40.9]
101
High
52
(88.1)
[27.5]
7
(11.9)
[31.8]
59

197
variables Levels Marital status
TOTAL Chi-
Square Value
p- value Married Unmarried
Attitude of
teachers towards
teaching in
inclusive schools
Low
43
(93.5)
[22.8]
3
(6.5)
[13.6]
46
1.779
0.410
Average
113
(89.7)
[59.8]
13
(10.3)
[59.1]
126
High
33
(84.6)
[17.5]
6
(15.4)
[27.3]
39
Role
Performance of
Teachers
Low
45
(97.8)
[23.8]
1
(2.2)
[4.5]
46
13.51
0.001
Average
105
(92.1)
[55.6]
9
(7.9)
[40.9]
114
High
39
(76.5)
[20.6]
12
(23.5)
[54.5]
51
Problems of
teachers
Low
46
(90.2)
[24.3]
5
(9.8)
[22.7]
51
0.287
0.865
Average
93
(90.3)
[49.2]
10
(9.7)
[45.5]
103
High
50
(87.7)
[26.5]
7
(12.3)
[31.8]
57
189 22 211

198
From the table-39, it is found that, the Chi-Square value 13.51 is
significant for 2 d.f. at 0.01 level, with reference to marital status and role
performance of teachers. Chi square values of other groups are not
significant. There is no association between marital status and attitude of
teachers towards inclusive school, attitude towards education of CWSN of
inclusive schools, attitude towards teaching CWSN of inclusive schools, and
problems faced by teachers of inclusive schools.
Hypothesis No. 22 is accepted with reference to association between
marital status of teachers and their role performance.
Conclusion
There is significant association between marital status and role
performance of teachers of inclusive schools.
There is no significant association between marital status and
attitude of teachers towards inclusive school, attitude towards education of
CWSN in inclusive schools, attitude towards teaching CWSN of inclusive
schools, and problems faced by teachers of inclusive schools.

199
Hypothesis-23
There is association between total teaching experience of teachers and
their attitude, role performance and problems faced by them in inclusive
schools.
TABLE – 40
Chi-Square values of association between teachers according to
teaching experience and attitude, role performance and problems faced
by teachers in inclusive schools.
variables levels
teaching experience
total Chi-
square value
p- value
<= 5 yr > 5 yr
Attitude of teachers
towards inclusive schools
Low
21
(35.0)
[25.3]
39
(65.0)
[30.5]
60
0.96
0.61
Average
41
(42.7)
[49.4]
55
(57.3)
[43.0]
96
High
21
(38.2)
[25.3]
34
(61.8)
[26.6]
55
Attitude of teachers
towards education of
CWSN in inclusive school
Low
21
(41.2)
[25.3]
30
(58.8)
[23.4]
51
2.02
0.36
Average
35
(34.7)
[42.2]
66
(65.3)
[51.6]
101
High
27
(45.8)
[35.5]
32
(54.2)
[25.0]
59

200
variables levels
teaching experience
total Chi-
square value
p- value
<= 5 yr > 5 yr
Attitude of teachers
towards teaching in
inclusive schools
Low
43
(93.5)
[22.8]
3
(6.5)
[13.6]
46
1.04
0.41
Average
113
(59.8)
[59.8]
13
(10.3)
[59.1]
126
High
33
(84.6)
[17.5]
6
(14.4)
[27.3]
39
Role Performance of
Teachers
Low
20
(43.5)
[24.1]
26
(56.5)
[20.3]
46
0.700
0.704
Average
42
(36.8)
[50.6]
72
(63.2)
[56.3]
114
High
21
(41.2)
[25.3]
30
(58.8)
[23.4]
51
Problems of teachers
Low
19
(37.3)
[22.9]
32
(62.7)
[25.0]
51
0.126
0.938
Average
41
(39.8)
[49.4]
62
(60.2)
[48.4]
103
High
23
(40.4)
[27.7]
34
(59.6)
[26.6]
57
83 128 211

201
From the table-40, it is found that the Chi-Square values are not
significant for 2 d.f. at 0.05 level. There is no association between teaching
experience of teachers and attitude of teachers towards inclusive school,
attitude towards education of CWSN of inclusive schools, attitude towards
teaching CWSN of inclusive schools, role performance of teachers and
problem faced by teachers of inclusive schools.
Hypothesis No.23 is not accepted.
Conclusion There is no significant association between teaching experience of
teachers and attitude of teachers towards inclusive school, attitude towards
education of CWSN of inclusive schools, attitude towards teaching CWSN of
inclusive schools, role performance of teachers and problems faced by
teachers of inclusive schools.
Hypothesis-24 There is association between teachers’ experience of teaching special
needs children and teachers’ attitude, role performance and problems faced
by them in inclusive schools.
TABLE – 41
Chi-Square values of association between teachers according to
experience of teaching special need children and attitude, role
performance and problems faced by teachers in inclusive schools.
Variables Levels Experience of teaching CWSN
Total Chi-
square Value
p-Value <=3 yrs 4-6 yrs >6 yrs
Attitude of teachers towards inclusive
schools
Low 49
(80.2) [28.0]
7 (11.7) [ 33.3]
4 (6.7) [26.7]
60
2.58
0.629
Average 77
(80.2) [44.0]
10 (10.4) [ 47.6]
9 (9.4)
[ 60.0] 96
High 49
(89.1) [28.0]
4 (7.3) [19.0]
2 (3.6) [13.3]
55

202
Variables Levels Experience of teaching CWSN
Total Chi-
square Value
p-Value <=3 yrs 4-6 yrs >6 yrs
Attitude of teachers towards education
of CWSN in inclusive school
Low 35
(68.6) [20.9]
9 (17.6) [ 42.9]
7 (13.7) [46.7]
51
12.15
0.016
Average 85
(84.2) [48.6]
9 (8.9)
[ 42.9]
7 (6.9)
[ 46.7] 101
High 55
(93.2) [31.4]
3 (5.1) [14.3]
1 (1.7) [6.7]
59
Attitude of teachers towards teaching
in inclusive schools
Low 37
(80.4) [21.1]
4 (8.7)
[ 19.0]
5 (10.9) [33.3]
46
2.80
0.94
Average 107
(84.9) [61.1]
11 (8.7)
[ 52.4]
8 (6.3)
[ 53.3] 126
High 31
(79.5) [17.7]
6 (15.4) [28.6]
2 (5.1) [13.3]
39
Role Performance of
Teachers
Low 37
(80.4) [21.1]
4 (8.7) [19.0]
5 (10.9) [33.3]
46
1.67
0.795
Average 96
(84.2) [54.9]
12 (10.5) [ 57.1]
6 (5.3)
[ 40.0] 114
High 42
(82.4) [24.0]
5 (9.8) [23.8]
4 (7.8) [26.7]
51
Problems of teachers
Low 46
(90.2) [26.3]
4 (7.8)
[ 19.0]
1 (2.0) [6.7]
51
3.933
0.498
Average 83
(80.6) [47.4]
12 (11.7) [ 57.1]
8 (7.8)
[ 53.3] 103
High 46
(80.7) [26.3]
5 (8.8) [23.8]
6 (10.5) [40.5]
57
175 21 15 211
From table-41, it is found that, the Chi-Square values is significant for
2 d.f. at 0.05 level with reference to teachers’ experience of teaching special
need children and attitude towards education of CWSN of inclusive schools.
Chi square values of other groups are not significant. There is no
significant association between experience of teaching special need children
and attitude of teachers towards inclusive school, attitude towards teaching

203
CWSN of inclusive schools, role performance of teachers and problem faced
by teachers of inclusive schools.
Hypothesis No.24 is accepted with reference to association between
teachers’ experience of teaching special need children and their attitude
towards education of CWSN of inclusive schools.
Conclusion
There is significant association between teachers’ experience of
teaching special need children and their attitude towards education of
CWSN of inclusive schools.
There is no significant association between teachers’ experience of
teaching special need children and attitude of teachers towards inclusive
school, attitude towards teaching CWSN of inclusive schools, role
performance of teachers and problem faced by teachers of inclusive schools.

204
Hypothesis-25
There is association between special training taken by teachers and
their attitude, role performance and problems faced by them in inclusive
schools.
TABLE – 42
Chi-Square values of association between special training taken
by teachers and their attitude, role performance and problems faced by
them in inclusive schools.
variables Levels
No. of teachers
Total
chi- square value
p-value
Special Training Taken
Special Training
not Taken
Attitude of teachers
towards inclusive
schools
Low
17
(28.3)
[18.1]
43
(71.7)
[36.]
60
9.05
0.010
Average
50
(52.1)
[53.2]
46
(47.9)
[39.3]
96
High
27
(49.1)
[28.7]
28
(50.9)
[23.9]
55
Attitude of teachers
towards education of
CWSN in inclusive
school
Low
23
(45.1)
[24.5]
28
(54.9)
[23.9]
51
2.21
0.33
Average
45
(44.6)
[47.9]
56
(55.4)
[47.9]
101
High
26
(44.1)
[27.7]
33
(55.9)
[28.2]
59
Attitude of teachers
towards teaching in
inclusive schools
Low
17
(37.0)
[18.1]
29
(63.0)
[24.8]
46

205
variables Levels
No. of teachers
Total
chi- square value
p-value
Special Training Taken
Special Training
not Taken
Average
55
(43.1)
[58.5]
71
(56.3)
[60.7]
126
3.33
0.188
High
22
(56.4)
[23.4]
17
(43.6)
[14.5]
39
Role Performance of
Teachers
Low
18
(39.1)
[19.1]
28
(60.9)
[23.9]
46
0.96
0.61
Average
51
(44.7)
[54.3]
63
(55.3)
[53.8]
114
High
25
(49.0)
[26.6]
26
(51.0)
[22.2]
51
Problems of teachers
Low
20
(39.2)
[21.3]
31
(60.8)
[26.5]
51
1.39
0.498
Average
50
(48.5)
[53.2]
53
(51.5)
[45.3]
103
High
24
(42.1)
[25.5]
33
(57.9)
[28.2]
57
94 117 211
From the table-42, it is found that, the Chi-Square value 9.05 is found
to be significant for 2 d.f. at 0.05 level, with reference to special training

206
taken and attitude of teachers towards inclusive school. Chi square values
of other groups are not significant. The is no association between special
training taken and attitude towards education of CWSN in inclusive schools,
attitude towards teaching CWSN in inclusive schools, role performance of
teachers and problems faced by teachers of inclusive schools.
Hypothesis No.25 is accepted with reference to special training taken
and attitude of teachers towards inclusive schools.
Conclusion
There is significant association between special training taken by
teachers and their attitude towards inclusive schools.
The is no significant association between special training taken and
attitude towards education of CWSN in inclusive schools, attitude towards
teaching CWSN in inclusive schools, role performance of teachers and
problems faced by teachers of inclusive schools.
HYPOTHESIS-26 There is significant correlation between teachers’ attitude
and teachers’ role performance, teachers’ attitude and problems faced by
teachers, and teachers’ role performance and problems faced by teachers.
From table - 43, it is found that ‘r’ values are significant at0.01 level
(2-tailed) Denoting significant and high coefficient of correlation between
1. Attitude to inclusive schools and attitude to education of CWSN in
inclusive schools, teaching CWSN in inclusive schools, role performance of
teachers in inclusive schools
2. Attitude to education of CWSN in inclusive schools and attitude to
inclusive schools, role performance of teachers in inclusive schools

207
3. Teaching CWSN in inclusive schools and role performance of teachers in
inclusive schools
4. Role performance of teachers in inclusive schools Problems faced by
teachers dealing different categories of CSWN
Table-43
Matrix of Coefficients of Correlation (‘r’) of Inclusive Teachers’
Attitude, Role Performance and Problems Faced
Inclusive Teachers N=211
Variables Attitude to Inclusive School
Attitude to Educ.of CWSN in inc.sch.
Attitude to Techg.in inc.sch.
Role perf.of tchrs to ctgs.
Of CSWN
Problems oftchrs of
ctgs.of CSWN
Attitude to
inclusive school
.4825** .4202** .2731** -.1595*
Attitude to
Educ.of CWSN
in inc.sch
.4480** .3117** -.1161
Attitude to techg.
in inc. sch.
.3054** -.1033
Role
perf.oftchrs to
ctgs. Of CSWN
-
.2109**
Problems
oftchrs of
ctgs.of CSWN
NOTE: * Denotes significant at 0.05 Level
**Denotes significant at 0.01 Level

208
From table-43, it is found that ‘r’ values are significant at0.05 level (2-
tailed) denoting significant and high coefficient of correlation between
attitude to inclusive schools and problems faced.
HYPOTHESIS-26 is accepted with reference to teachers’ attitude,
teachers’ role performance, and problems faced by teachers.
Conclusion There is significant correlation between teachers’ attitude and
teachers’ role performance, teachers’ attitude and problems faced by
teachers, and teachers’ role performance and problems faced by teachers.
5.4 FINDINGS OF IN-DEPTH INTERVIEWS WITH TEACHERS
As mentioned in Research methodology in Ch.-IV, four teachers
were identified and in-depth un-structured interviews were conducted. The
findings are summarized below:
CASE -1.
Female teacher ‘P’ is aged 45; married and has two kids-the first
one, a normal girl aged 6 and the second, a squint-eyed girl aged 4. P’s
Attitude scores respectively are- a) 81; b) 86 & c) 88. P’s Role Performance
score is 55 and Problems faced score is 68. P is D.T.E., and has 15 years
teaching experience; works in a Government Primary school set in rural
locality. P deals with two VI children: one boy in Class III is low vision
category and one girl in Class IV uses magnifying lens. The classes have
large strength (45 students each). P had received two-days in-service
training about Inclusive Education in year 2005. The school has very few
suitable materials to teach VI children. The special educator makes a visit
once a month. In the class a VI child is seated in the first row, but has
difficulty in reading and taking down from the black board. Both the VI

209
children are very slow in reading and writing skills. Both are of average
intelligence. P says that she has to complete the portions of lessons,
regularly conduct tests and has to concentrate on the normal children. P
expresses guilt for not concentrating on the VI children and offers the
needed assistance, which only the special educator can do. More training
and frequent assistance from the special educator are to be provided.
CASE -2.
Male teacher ’N’ is aged 32; unmarried. N’s Attitude scores
respectively are- a) 55; b) 60& c) 60. N’s Role Performance score is 47 and
Problems faced score is 65. N is B.A., B.Ed., and has 7 years of teaching
experience. N works in an urban Panchayat Union Aided Elementary school,
which has class strength 50. N deals with one MR Child -a moderately
affected girl in Class II, irregular in attendance. She is below average in
social skills. But interested in play activities. She is seated in the last row
because the teachers consider her a hindrance to normal children and
teachers. Her personal needs training is not enough and servant has to
assist her in cleaning. The parents being very poor construction workers,
plead the school to allow her attend even if she cannot make academic
performance. N feels that communicating with the MR Child is a problem.
Attempting to educate such disabled children is a waste. Being a girl, being
poor, and being disabled, her future is very bleak. N is not confident of even
trying to make effort.
CASE-3
Female teacher ’S ’is aged 29; unmarried. S’s Attitude scores
respectively are- a)75;b)68&c)76. N’s Role Performance score is 64 and

210
Problems faced score is 65. S is B.Sc., B.Ed.; she is working in an urban
government Middle school. She attended one in-service special education
training programme. S deals with one HI boy in class V. S is appreciative of
the child’s enthusiasm to be active and receive cooperation from his peers.
He has good performance in studies, has very good handwriting and is
talented in drawing.. For the past 8 months she is taking more interest in
the HI child’s class activities and tries to give individual instruction taking
extra time. She often meets the child’s parents. When the special educator
visits the school, S gets more guidance to deal with the HI child. The teacher
‘S’ feels that more equipment and more implements for hearing be availed by
the school.
CASE-4
Female teacher ‘R’ is aged 50; is married. R’s Attitude scores
respectively are- a) 60 b) 55 & c) 53. R’s Role Performance score is 56 and
Problems faced score is 60. R is D.T.E. holder got appointment much later
and has teaching experience of 10 years. R deals with OH female child in
class I. The child has calipers to right leg and fingers of hands are deformed.
She cannot hold writing materials. The child is made to sit at the back of the
class. Her peer students are sympathetic and try to keep company. The
child comes from middle class home background. Because of mother’s
request, the child is admitted in the school. R feels that as the OH child
grows up attending school and studying would be very difficult.” Such
children should not be sent to school, rather sent to residential special
school, or be kept at home only arranging a tutor for individual
instruction”(in the words of R ).

211
Conclusion of analysis
From the interviews it can be understood that teachers working in
inclusive schools express rather mixed picture of favorable attitudes. Their
main concern is education of able children rather than CWSN. The training
given in inclusive education is very short duration and one-time training
covering all the categories of disabilities. The BRTs who conducted the
training are not specialists, but are those who received only two days
training from the faculty of DIETs, who in their turn received training from
specialists. This multi-level training finally when reached the primary school
teachers was much diluted. Primary teachers receiving the training could
not get the needed confidence nor competence to deal with the CWSN in the
classes. The concept of collaboration among regular teachers and
collaboration with special teachers has not permeated in them. Also, lack of
equipment and material as well as lack of skills to use the material for
teaching and training is the main reason for negative attitude and only low
role performance. The problems faced by teachers dealing with each
category of CWSN are many and disability specific. Personal or background
variables of teachers also affect the teachers’ performance.
5.5 SUMMARY
In this chapter, the statistical calculations under quantitative
analysis were given Hypotheses were tested and interpretation was done. It
was followed by in-depth qualitative analysis.
In the next chapter, Summary, discussion of the findings and
implications will be presented. Finally, recommendations and suggestions
will be drawn.