CHAPTER ELEVEN The Efficient Market Hypothesis 11site.iugaza.edu.ps/wdaya/files/2010/02/ch11.pdf ·...
38
ONE OF THE early applications of comput- ers in economics in the 1950s was to analyze economic time series. Business cycle theorists felt that tracing the evolution of several eco- nomic variables over time would clarify and predict the progress of the economy through boom and bust periods. A natural candidate for analysis was the behavior of stock market prices over time. Assuming that stock prices reflect the prospects of the firm, recurrent patterns of peaks and troughs in economic performance ought to show up in those prices. Maurice Kendall examined this proposi- tion in 1953. 1 He found to his great surprise that he could identify no predictable pat- terns in stock prices. Prices seemed to evolve randomly. They were as likely to go up as they were to go down on any particular day, regardless of past performance. The data pro- vided no way to predict price movements. At first blush, Kendall’s results were dis- turbing to some financial economists. They seemed to imply that the stock market is dominated by erratic market psychology, or “animal spirits”—that it follows no logical rules. In short, the results appeared to con- firm the irrationality of the market. On fur- ther reflection, however, economists came to reverse their interpretation of Kendall’s study. It soon became apparent that random price movements indicated a well-functioning or efficient market, not an irrational one. In this chapter we explore the reasoning behind what may seem a surprising conclusion. We show how competition among analysts leads naturally to market efficiency, and we exam- ine the implications of the efficient market hypothesis for investment policy. We also con- sider empirical evidence that supports and contradicts the notion of market efficiency. 1 1 The Efficient Market Hypothesis 1 PART III CHAPTER ELEVEN 2 1 Maurice Kendall, “The Analysis of Economic Time Series, Part I: Prices,” Journal of the Royal Statistical Society 96 (1953).
-
Upload
dangnguyet -
Category
Documents
-
view
227 -
download
0
Transcript of CHAPTER ELEVEN The Efficient Market Hypothesis 11site.iugaza.edu.ps/wdaya/files/2010/02/ch11.pdf ·...

Confirming Pages
ONE OF THE early applications of comput-ers in economics in the 1950s was to analyze economic time series. Business cycle theorists felt that tracing the evolution of several eco-nomic variables over time would clarify and predict the progress of the economy through boom and bust periods. A natural candidate for analysis was the behavior of stock market prices over time. Assuming that stock prices reflect the prospects of the firm, recurrent patterns of peaks and troughs in economic performance ought to show up in those prices.
Maurice Kendall examined this proposi-tion in 1953. 1 He found to his great surprise that he could identify no predictable pat-terns in stock prices. Prices seemed to evolve randomly. They were as likely to go up as they were to go down on any particular day, regardless of past performance. The data pro-vided no way to predict price movements.
At first blush, Kendall’s results were dis-turbing to some financial economists. They seemed to imply that the stock market is dominated by erratic market psychology, or “animal spirits”—that it follows no logical rules. In short, the results appeared to con-firm the irrationality of the market. On fur-ther reflection, however, economists came to reverse their interpretation of Kendall’s study.
It soon became apparent that random price movements indicated a well-functioning or efficient market, not an irrational one. In this chapter we explore the reasoning behind what may seem a surprising conclusion. We show how competition among analysts leads naturally to market efficiency, and we exam-ine the implications of the efficient market hypothesis for investment policy. We also con-sider empirical evidence that supports and contradicts the notion of market efficiency.
11 The Efficient Market Hypothesis 1
PAR
T III CHAPTER ELEVEN
2
1 Maurice Kendall, “The Analysis of Economic Time Series, Part I: Prices,” Journal of the Royal Statistical Society 96 (1953).
bod30700_ch11_343-380.indd 343bod30700_ch11_343-380.indd 343 8/16/10 4:46 PM8/16/10 4:46 PM
Confirming Pages
344 P A R T I I I Equilibrium in Capital Markets
11.1 Random Walks and the Efficient Market Hypothesis
Suppose Kendall had discovered that stock prices are predictable. What a gold mine this would have been. If they could use Kendall’s equations to predict stock prices, investors would reap unending profits simply by purchasing stocks that the computer model implied were about to increase in price and by selling those stocks about to fall in price.
A moment’s reflection should be enough to convince yourself that this situation could not persist for long. For example, suppose that the model predicts with great confidence that XYZ stock price, currently at $100 per share, will rise dramatically in 3 days to $110. What would all investors with access to the model’s prediction do today? Obviously, they would place a great wave of immediate buy orders to cash in on the prospective increase in stock price. No one holding XYZ, however, would be willing to sell. The net effect would be an immediate jump in the stock price to $110. The forecast of a future price increase will lead instead to an immediate price increase. In other words, the stock price will imme-diately reflect the “good news” implicit in the model’s forecast.
This simple example illustrates why Kendall’s attempt to find recurrent patterns in stock price movements was likely to fail. A forecast about favorable future performance leads instead to favorable current performance, as market participants all try to get in on the action before the price jump.
More generally, one might say that any information that could be used to predict stock performance should already be reflected in stock prices. As soon as there is any informa-tion indicating that a stock is underpriced and therefore offers a profit opportunity, inves-tors flock to buy the stock and immediately bid up its price to a fair level, where only ordinary rates of return can be expected. These “ordinary rates” are simply rates of return commensurate with the risk of the stock.
However, if prices are bid immediately to fair levels, given all available information, it must be that they increase or decrease only in response to new information. New infor-mation, by definition, must be unpredictable; if it could be predicted, then the prediction would be part of today’s information. Thus stock prices that change in response to new (unpredictable) information also must move unpredictably.
This is the essence of the argument that stock prices should follow a random walk, that is, that price changes should be random and unpredictable. 2 Far from a proof of market irrationality, randomly evolving stock prices would be the necessary consequence of intel-ligent investors competing to discover relevant information on which to buy or sell stocks before the rest of the market becomes aware of that information.
Don’t confuse randomness in price changes with irrationality in the level of prices. If prices are determined rationally, then only new information will cause them to change. Therefore, a random walk would be the natural result of prices that always reflect all cur-rent knowledge. Indeed, if stock price movements were predictable, that would be damn-ing evidence of stock market inefficiency, because the ability to predict prices would indicate that all available information was not already reflected in stock prices. Therefore,
2 Actually, we are being a little loose with terminology here. Strictly speaking, we should characterize stock prices as following a submartingale, meaning that the expected change in the price can be positive, presumably as compensation for the time value of money and systematic risk. Moreover, the expected return may change over time as risk factors change. A random walk is more restrictive in that it constrains successive stock returns to be independent and identically distributed. Nevertheless, the term “random walk” is commonly used in the looser sense that price changes are essentially unpredictable. We will follow this convention.
bod30700_ch11_343-380.indd 344bod30700_ch11_343-380.indd 344 8/16/10 4:46 PM8/16/10 4:46 PM

Confirming Pages
C H A P T E R 1 1 The Efficient Market Hypothesis 345
the notion that stocks already reflect all available information is referred to as the efficient market hypothesis (EMH). 3
Figure 11.1 illustrates the response of stock prices to new information in an efficient market. The graph plots the price response of a sample of 194 firms that were targets of takeover attempts. In most takeovers, the acquiring firm pays a substantial premium over current mar-ket prices. Therefore, announcement of a takeover attempt should cause the stock price to jump. The figure shows that stock prices jump dramatically on the day the news becomes public. However, there is no further drift in prices after the announcement date, suggesting that prices reflect the new information, including the likely magnitude of the takeover premium, by the end of the trad-ing day.
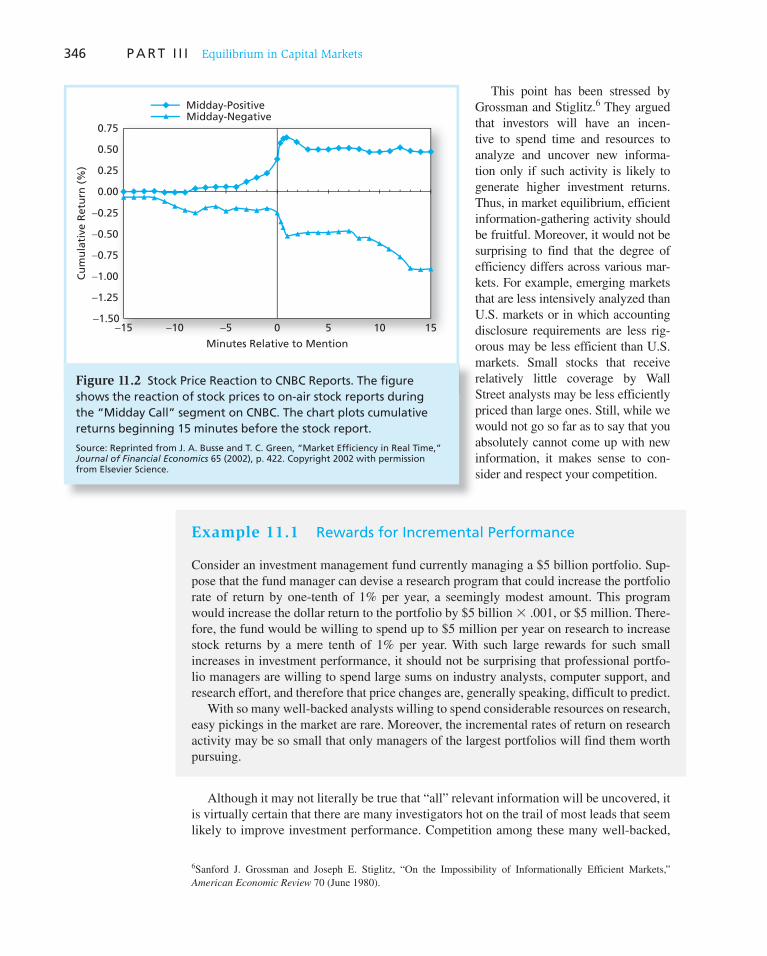
Even more dramatic evidence of rapid response to new information may be found in intraday prices. For example, Patell and Wolfson show that most of the stock price response to corporate dividend or earnings announcements occurs within 10 minutes of the announcement. 4 A nice illustration of such rapid adjustment is provided in a study by Busse and Green, who track minute-by-minute stock prices of firms that are featured on CNBC’s “Morning” or “Midday Call” segments. 5 Minute 0 in Figure 11.2 is the time at which the stock is mentioned on the midday show. The top line is the aver-age price movement of stocks that receive positive reports, while the bottom line reports returns on stocks with negative reports. Notice that the top line levels off, indicating that the market has fully digested the news, within 5 minutes of the report. The bottom line levels off within about 12 minutes.
Competition as the Source of Efficiency Why should we expect stock prices to reflect “all available information”? After all, if you are willing to spend time and money on gathering information, it might seem reasonable that you could turn up something that has been overlooked by the rest of the investment community. When information is costly to uncover and analyze, one would expect invest-ment analysis calling for such expenditures to result in an increased expected return.
3 Market efficiency should not be confused with the idea of efficient portfolios introduced in Chapter 7. An infor-mationally efficient market is one in which information is rapidly disseminated and reflected in prices. An effi-cient portfolio is one with the highest expected return for a given level of risk. 4 J. M. Patell and M. A. Wolfson, “The Intraday Speed of Adjustment of Stock Prices to Earnings and Dividend Announcements,” Journal of Financial Economics 13 (June 1984), pp. 223–52. 5 J. A. Busse and T. C. Green, “Market Efficiency in Real Time,” Journal of Financial Economics 65 (2002), pp. 415–37. You can find an intraday movie version of this figure at www.bus.emory.edu/cgreen/docs/cnbc/ cnbc.html
36
32
28
24
20
16
12
8
4
0
−4
−8
−12
−16−135 −120 −105 −90 −75 −60 −45 −30 −15 0 15 30
Days Relative to Announcement DateC
um
ula
tive
Ab
no
rmal
Ret
urn
(%
)
Figure 11.1 Cumulative abnormal returns before takeover attempts: target companies
Source: Arthur Keown and John Pinkerton, “Merger Announcements and Insider Trading Activity,” Journal of Finance 36 (September 1981). Reprinted by permission of the publisher, Blackwell Publishing, Inc.
bod30700_ch11_343-380.indd 345bod30700_ch11_343-380.indd 345 8/16/10 4:46 PM8/16/10 4:46 PM
Confirming Pages
346 P A R T I I I Equilibrium in Capital Markets
This point has been stressed by Grossman and Stiglitz. 6 They argued that investors will have an incen-tive to spend time and resources to analyze and uncover new informa-tion only if such activity is likely to generate higher investment returns. Thus, in market equilibrium, efficient information-gathering activity should be fruitful. Moreover, it would not be surprising to find that the degree of efficiency differs across various mar-kets. For example, emerging markets that are less intensively analyzed than U.S. markets or in which accounting disclosure requirements are less rig-orous may be less efficient than U.S. markets. Small stocks that receive relatively little coverage by Wall Street analysts may be less efficiently priced than large ones. Still, while we would not go so far as to say that you absolutely cannot come up with new information, it makes sense to con-sider and respect your competition.
Example 11.1 Rewards for Incremental Performance
Consider an investment management fund currently managing a $5 billion portfolio. Sup-pose that the fund manager can devise a research program that could increase the portfolio rate of return by one-tenth of 1% per year, a seemingly modest amount. This program would increase the dollar return to the portfolio by $5 billion � .001, or $5 million. There-fore, the fund would be willing to spend up to $5 million per year on research to increase stock returns by a mere tenth of 1% per year. With such large rewards for such small increases in investment performance, it should not be surprising that professional portfo-lio managers are willing to spend large sums on industry analysts, computer support, and research effort, and therefore that price changes are, generally speaking, difficult to predict.
With so many well-backed analysts willing to spend considerable resources on research, easy pickings in the market are rare. Moreover, the incremental rates of return on research activity may be so small that only managers of the largest portfolios will find them worth pursuing.
Although it may not literally be true that “all” relevant information will be uncovered, it is virtually certain that there are many investigators hot on the trail of most leads that seem likely to improve investment performance. Competition among these many well-backed,
6 Sanford J. Grossman and Joseph E. Stiglitz, “On the Impossibility of Informationally Efficient Markets,” American Economic Review 70 (June 1980).
−15 −10 −5 0 5 10 15
Minutes Relative to Mention
0.75
0.50
0.25
0.00
−0.25
−0.75
−0.50
−1.00
−1.25
−1.50
Cu
mu
lati
ve R
etu
rn (
%)
Midday-PositiveMidday-Negative
Figure 11.2 Stock Price Reaction to CNBC Reports. The figure shows the reaction of stock prices to on-air stock reports during the “Midday Call” segment on CNBC. The chart plots cumulative returns beginning 15 minutes before the stock report.
Source: Reprinted from J. A. Busse and T. C. Green, “Market Efficiency in Real Time,” Journal of Financial Economics 65 (2002), p. 422. Copyright 2002 with permission from Elsevier Science.
bod30700_ch11_343-380.indd 346bod30700_ch11_343-380.indd 346 8/16/10 4:46 PM8/16/10 4:46 PM
Confirming Pages
347
“Outsider Trading” and Too Much Information
The Galleon insider-trading case is just the latest chapter in a drama about the proper role of information in driv-ing markets. The story line so far is that Galleon founder Raj Rajaratnam and his colleagues enticed insiders at major corporations into intentionally divulging material nonpub-lic information. If so, these executives would have violated their fiduciary duties to their employers.
There is evidence to support the prosecution case that Galleon analysts knew the information was gathered illegitimately. This includes damning snippets from con-versations captured through wiretaps, such as a Galleon executive telling a source, “You put me in jail if you talk.”
Still, as more facts come out about this case, it will be interesting to see how clear-cut the issues are. In recent decades, these cases have often ended up on murkier ground, raising fundamental questions about how research can be conducted. This is especially true where people are accused of ferreting out too much accurate information. Employees of companies may have clear fiduciary duties to protect corporate secrets, but traders have no such fiduciary obligation. Instead, the Galleon case is about what might be called “outsider trading”—trading by people who gathered information from insiders about company performance or operations, not trading by the insiders themselves.
The reason the U.S. government should tread care-fully in criminalizing outsider trading is that markets run on information, analysis, and the connecting of dots to determine when prices are too high or too low. Economist Milton Friedman once asserted, “You should want more insider trading, not less. You want to give the people most
likely to have knowledge about deficiencies of the com-pany an incentive to make the public aware of that.”
The rules of information engagement for outsiders are especially murky. Information flows these days are increas-ingly about networks. Sophisticated traders such as hedge funds draw on more selected networks such as their inves-tors. As these networks expand, including online through social networking sites, it will become harder to know whether market-moving information originated improp-erly through an insider’s breach or properly through gath-ering of information in other ways.
Stephen Bainbridge, a UCLA law professor, described on his blog this growing conflict between the need for more information to make markets more efficient and prices more accurate versus a regulatory focus on equal access to information. The issue: “Can the SEC prove not just that Rajaratnam had better access to information than the mar-ket generally, but that he got that information by being a participant after the fact in the tipper’s breach of fiduciary duty?”
Until recently, the vagueness of the insider-trading laws was more of an academic topic than a core issue for how markets operate day to day. In today’s world of immediate, global flows of information, markets need greater clarity about how information can be gathered and used. The les-son so far is that knowing when insiders violate their duty is easier than knowing when outsiders go too far in bring-ing accurate information to markets.
Source: L. Gordon Crovitz, “‘Outsider Trading’ and Too Much Information,” The Wall Street Journal, October 26, 2009.
WO
RD
S FRO
M TH
E STREET
highly paid, aggressive analysts ensures that, as a general rule, stock prices ought to reflect available information regarding their proper levels.
Information is often said to be the most precious commodity on Wall Street, and the com-petition for it is intense. Sometimes the quest for a competitive advantage can tip over into a search for illegal inside information. The nearby box reports on a recent insider trading investigation surrounding the Galleon Group hedge fund but points out that drawing a clear line between legitimate and prohibited sources of information can be difficult in practice.
Versions of the Efficient Market Hypothesis It is common to distinguish among three versions of the EMH: the weak, semistrong, and strong forms of the hypothesis. These versions differ by their notions of what is meant by the term “all available information.”
The weak-form hypothesis asserts that stock prices already reflect all information that can be derived by examining market trading data such as the history of past prices, trad-ing volume, or short interest. This version of the hypothesis implies that trend analysis is fruitless. Past stock price data are publicly available and virtually costless to obtain. The weak-form hypothesis holds that if such data ever conveyed reliable signals about future performance, all investors already would have learned to exploit the signals. Ultimately, the signals lose their value as they become widely known because a buy signal, for instance, would result in an immediate price increase.
bod30700_ch11_343-380.indd 347bod30700_ch11_343-380.indd 347 8/16/10 4:46 PM8/16/10 4:46 PM

Confirming Pages
348 P A R T I I I Equilibrium in Capital Markets
The semistrong-form hypothesis states that all publicly available information regard-ing the prospects of a firm must be reflected already in the stock price. Such information includes, in addition to past prices, fundamental data on the firm’s product line, quality of management, balance sheet composition, patents held, earning forecasts, and account-ing practices. Again, if investors have access to such information from publicly available sources, one would expect it to be reflected in stock prices.
Finally, the strong-form version of the efficient market hypothesis states that stock prices reflect all information relevant to the firm, even including information available only to company insiders. This version of the hypothesis is quite extreme. Few would argue with the proposition that corporate officers have access to pertinent information long enough before public release to enable them to profit from trading on that information. Indeed, much of the activity of the Securities and Exchange Commission is directed toward preventing insiders from profiting by exploiting their privileged situation. Rule 10b-5 of the Security Exchange Act of 1934 sets limits on trading by corporate officers, directors, and substantial owners, requiring them to report trades to the SEC. These insiders, their relatives, and any associates who trade on information supplied by insiders are considered in violation of the law.
Defining insider trading is not always easy, however. After all, stock analysts are in the business of uncovering information not already widely known to market participants. As we saw in Chapter 3 as well as in the nearby box, the distinction between private and inside information is sometimes murky.
CONCEPT CHECK
1
a. Suppose you observed that high-level managers make superior returns on investments in their company’s stock. Would this be a violation of weak-form market efficiency? Would it be a violation of strong-form market efficiency?
b. If the weak form of the efficient market hypothesis is valid, must the strong form also hold? Conversely, does strong-form efficiency imply weak-form efficiency?
11.2 Implications of the EMH
Technical Analysis Technical analysis is essentially the search for recurrent and predictable patterns in stock prices. Although technicians recognize the value of information regarding future economic prospects of the firm, they believe that such information is not necessary for a successful trading strategy. This is because whatever the fundamental reason for a change in stock price, if the stock price responds slowly enough, the analyst will be able to identify a trend that can be exploited during the adjustment period. The key to successful technical analy-sis is a sluggish response of stock prices to fundamental supply-and-demand factors. This prerequisite, of course, is diametrically opposed to the notion of an efficient market.
Technical analysts are sometimes called chartists because they study records or charts of past stock prices, hoping to find patterns they can exploit to make a profit. As an exam-ple of technical analysis, consider the relative strength approach. The chartist compares stock performance over a recent period to performance of the market or other stocks in the same industry. A simple version of relative strength takes the ratio of the stock price to a market indicator such as the S&P 500 index. If the ratio increases over time, the stock is said to exhibit relative strength because its price performance is better than that of the
bod30700_ch11_343-380.indd 348bod30700_ch11_343-380.indd 348 8/16/10 4:46 PM8/16/10 4:46 PM
Confirming Pages
C H A P T E R 1 1 The Efficient Market Hypothesis 349
broad market. Such strength presumably may continue for a long enough period of time to offer profit opportunities.
One of the most commonly heard components of technical analysis is the notion of resistance levels or support levels. These values are said to be price levels above which it is difficult for stock prices to rise, or below which it is unlikely for them to fall, and they are believed to be levels determined by market psychology.
Example 11.2 Resistance Levels
Consider stock XYZ, which traded for several months at a price of $72, and then declined to $65. If the stock eventually begins to increase in price, $72 is considered a resistance level (according to this theory) because investors who bought originally at $72 will be eager to sell their shares as soon as they can break even on their investment. Therefore, at prices near $72 a wave of selling pressure would exist. Such activity imparts a type of “memory” to the market that allows past price history to influence current stock prospects.
The efficient market hypothesis implies that technical analysis is without merit. The past history of prices and trading volume is publicly available at minimal cost. Therefore, any information that was ever available from analyzing past prices has already been reflected in stock prices. As investors compete to exploit their common knowledge of a stock’s price history, they necessarily drive stock prices to levels where expected rates of return are exactly commensurate with risk. At those levels one cannot expect abnormal returns.
As an example of how this process works, consider what would happen if the market believed that a level of $72 truly were a resistance level for stock XYZ in Example 11.2. No one would be willing to purchase the stock at a price of $71.50, because it would have almost no room to increase in price, but ample room to fall. However, if no one would buy it at $71.50, then $71.50 would become a resistance level. But then, using a similar analysis, no one would buy it at $71, or $70, and so on. The notion of a resistance level is a logical conundrum. Its simple resolution is the recognition that if the stock is ever to sell at $71.50, investors must believe that the price can as easily increase as fall. The fact that investors are willing to purchase (or even hold) the stock at $71.50 is evidence of their belief that they can earn a fair expected rate of return at that price.
An interesting question is whether a techni-cal rule that seems to work will continue to work in the future once it becomes widely rec-ognized. A clever analyst may occasionally uncover a profitable trading rule, but the real test of efficient markets is whether the rule itself becomes reflected in stock prices once its value is discovered. Once a useful technical rule (or price pattern) is discovered, it ought to be invalidated when the mass of traders attempts to exploit it. In this sense, price patterns ought to be self-destructing.
Thus the market dynamic is one of a continual search for profitable trading rules, fol-lowed by destruction by overuse of those rules found to be successful, followed by more search for yet-undiscovered rules.
Fundamental Analysis Fundamental analysis uses earnings and dividend prospects of the firm, expectations of future interest rates, and risk evaluation of the firm to determine proper stock prices.
CONCEPT CHECK
2 If everyone in the market believes in resis-tance levels, why do these beliefs not become self- fulfilling prophecies?
bod30700_ch11_343-380.indd 349bod30700_ch11_343-380.indd 349 8/16/10 4:46 PM8/16/10 4:46 PM

Confirming Pages
350 P A R T I I I Equilibrium in Capital Markets
Ultimately, it represents an attempt to determine the present discounted value of all the payments a stockholder will receive from each share of stock. If that value exceeds the stock price, the fundamental analyst would recommend purchasing the stock.
Fundamental analysts usually start with a study of past earnings and an examination of company balance sheets. They supplement this analysis with further detailed economic analysis, ordinarily including an evaluation of the quality of the firm’s management, the firm’s standing within its industry, and the prospects for the industry as a whole. The hope is to attain insight into future performance of the firm that is not yet recognized by the rest of the market. Chapters 17 through 19 provide a detailed discussion of the types of analy-ses that underlie fundamental analysis.
Once again, the efficient market hypothesis predicts that most fundamental analysis also is doomed to failure. If the analyst relies on publicly available earnings and industry infor-mation, his or her evaluation of the firm’s prospects is not likely to be significantly more accurate than those of rival analysts. Many well-informed, well-financed firms conduct such market research, and in the face of such competition it will be difficult to uncover data not also available to other analysts. Only analysts with a unique insight will be rewarded.
Fundamental analysis is much more difficult than merely identifying well-run firms with good prospects. Discovery of good firms does an investor no good in and of itself if the rest of the market also knows those firms are good. If the knowledge is already public, the investor will be forced to pay a high price for those firms and will not realize a superior rate of return.
The trick is not to identify firms that are good, but to find firms that are better than everyone else’s estimate. Similarly, poorly run firms can be great bargains if they are not quite as bad as their stock prices suggest.
This is why fundamental analysis is difficult. It is not enough to do a good analysis of a firm; you can make money only if your analysis is better than that of your competitors because the market price will already reflect all commonly available information.
Active versus Passive Portfolio Management By now it is apparent that casual efforts to pick stocks are not likely to pay off. Competition among investors ensures that any easily implemented stock evaluation technique will be used widely enough so that any insights derived will be reflected in stock prices. Only serious analysis and uncommon techniques are likely to generate the differential insight necessary to yield trading profits.
Moreover, these techniques are economically feasible only for managers of large port-folios. If you have only $100,000 to invest, even a 1% per year improvement in perfor-mance generates only $1,000 per year, hardly enough to justify herculean efforts. The billion-dollar manager, however, reaps extra income of $10 million annually from the same 1% increment.
If small investors are not in a favored position to conduct active portfolio management, what are their choices? The small investor probably is better off investing in mutual funds. By pooling resources in this way, small investors can gain from economies of scale.
More difficult decisions remain, though. Can investors be sure that even large mutual funds have the ability or resources to uncover mispriced stocks? Furthermore, will any mispricing be sufficiently large to repay the costs entailed in active portfolio management?
Proponents of the efficient market hypothesis believe that active management is largely wasted effort and unlikely to justify the expenses incurred. Therefore, they advocate a pas-sive investment strategy that makes no attempt to outsmart the market. A passive strategy aims only at establishing a well-diversified portfolio of securities without attempting to
bod30700_ch11_343-380.indd 350bod30700_ch11_343-380.indd 350 8/16/10 4:46 PM8/16/10 4:46 PM

Confirming Pages
C H A P T E R 1 1 The Efficient Market Hypothesis 351
find under- or overvalued stocks. Passive management is usually characterized by a buy-and-hold strategy. Because the efficient market theory indicates that stock prices are at fair levels, given all available information, it makes no sense to buy and sell securities fre-quently, which generates large brokerage fees without increasing expected performance.
One common strategy for passive management is to create an index fund, which is a fund designed to replicate the performance of a broad-based index of stocks. For example, Vanguard’s 500 Index Fund holds stocks in direct proportion to their weight in the Standard & Poor’s 500 stock price index. The performance of the 500 Index Fund therefore repli-cates the performance of the S&P 500. Investors in this fund obtain broad diversification with relatively low management fees. The fees can be kept to a minimum because Vanguard does not need to pay analysts to assess stock prospects and does not incur transaction costs from high portfolio turnover. Indeed, while the typical annual charge for an actively man-aged equity fund is more than 1% of assets, the expense ratio of the 500 Index Fund is only .18%. Today, Vanguard’s 500 Index Fund is among the largest equity mutual funds with $100 billion of assets in May 2010, and about 10%–15% of equity funds are indexed.
Indexing need not be limited to the S&P 500, however. For example, some of the funds offered by the Vanguard Group track the Wilshire 5000 index, the Salomon Brothers Broad Investment Grade Bond Index, the MSCI index of small-capitalization U.S. companies, the European equity market, and the Pacific Basin equity market. Several other mutual fund complexes have introduced indexed portfolios, but Vanguard dominates the retail market for indexed products.
Exchange-traded funds, or ETFs, are a close (and often lower-expense) alternative to indexed mutual funds. As noted in Chapter 4, these are shares in diversified portfolios that can be bought or sold just like shares of individual stock. ETFs matching several broad stock market indexes such as the S&P 500 or Wilshire 5000 indexes and dozens of international and industry stock indexes are available to investors who want to hold a diversified sector of a market without attempting active security selection.
A hybrid strategy also is fairly common, where the fund maintains a passive core, which is an indexed position, and augments that position with one or more actively managed portfolios.
The Role of Portfolio Management in an Efficient Market If the market is efficient, why not pick stocks by throwing darts at The Wall Street Journal instead of trying rationally to choose a stock portfolio? This is a tempting conclusion to draw from the notion that security prices are fairly set, but it is far too facile. There is a role for rational portfolio management, even in perfectly efficient markets.
You have learned that a basic principle in portfolio selection is diversification. Even if all stocks are priced fairly, each still poses firm-specific risk that can be eliminated through diversification. Therefore, rational security selection, even in an efficient market, calls for the selection of a well-diversified portfolio providing the systematic risk level that the investor wants.
Rational investment policy also requires that tax considerations be reflected in secu-rity choice. High-tax-bracket investors generally will not want the same securities that low bracket investors find favorable. At an obvious level, high-bracket investors find it advanta-geous to buy tax-exempt municipal bonds despite their relatively low pretax yields, whereas those same bonds are unattractive to low-tax-bracket or tax-exempt investors. At a more sub-tle level, high-bracket investors might want to tilt their portfolios in the direction of capital
CONCEPT CHECK
3 What would happen to market efficiency if all investors attempted to follow a passive strategy?
bod30700_ch11_343-380.indd 351bod30700_ch11_343-380.indd 351 8/16/10 4:46 PM8/16/10 4:46 PM

Confirming Pages
352 P A R T I I I Equilibrium in Capital Markets
gains as opposed to interest income, because capital gains are taxed less heavily and because the option to defer the realization of capital gains income is more valuable the higher the current tax bracket. Hence these investors may prefer stocks that yield low dividends yet offer greater expected capital gain income. They also will be more attracted to investment opportunities for which returns are sensitive to tax benefits, such as real estate ventures.
A third argument for rational portfolio management relates to the particular risk profile of the investor. For example, a Toyota executive whose annual bonus depends on Toyota’s profits generally should not invest additional amounts in auto stocks. To the extent that his or her compensation already depends on Toyota’s well-being, the executive is already overinvested in Toyota and should not exacerbate the lack of diversification. This lesson was learned with considerable pain in September 2008 by Lehman Brothers employees who were famously invested in their own firm when the company failed. Roughly 30% of the shares in the firm were owned by its 24,000 employees, and their losses on those shares totaled around $10 billion.
Investors of varying ages also might warrant different portfolio policies with regard to risk bearing. For example, older investors who are essentially living off savings might choose to avoid long-term bonds whose market values fluctuate dramatically with changes in interest rates (discussed in Part Four). Because these investors are living off accumulated savings, they require conservation of principal. In contrast, younger investors might be more inclined toward long-term inflation-indexed bonds. The steady flow of real income over long periods of time that is locked in with these bonds can be more important than preservation of principal to those with long life expectancies.
In conclusion, there is a role for portfolio management even in an efficient market. Investors’ optimal positions will vary according to factors such as age, tax bracket, risk aversion, and employment. The role of the portfolio manager in an efficient market is to tailor the portfolio to these needs, rather than to beat the market.
Resource Allocation We’ve focused so far on the investment implications of the efficient market hypothesis. Deviations from efficiency may offer profit opportunities to better-informed traders at the expense of less-informed ones.
However, deviations from informational efficiency would also result in a large cost that will be borne by all citizens, namely, inefficient resource allocation. Recall that in a capital-ist economy, investments in real assets such as plant, equipment, and know-how are guided in large part by the prices of financial assets. For example, if the value of telecommunica-tion capacity reflected in stock market prices exceeds the cost of installing such capacity, managers might justifiably conclude that telecom investments seem to have positive net present value. In this manner, capital market prices guide allocation of real resources.
If markets were inefficient and securities commonly mispriced, then resources would be systematically misallocated. Corporations with overpriced securities would be able to obtain capital too cheaply, and corporations with undervalued securities might forgo invest-ment opportunities because the cost of raising capital would be too high. Therefore, ineffi-cient capital markets would diminish one of the most potent benefits of a market economy. As an example of what can go wrong, consider the dot-com bubble of the late 1990s, which sent a strong but, as it turned out, wildly overoptimistic signal about prospects for Internet and telecommunication firms and ultimately led to substantial over investment in those industries.
Before writing off markets as a means to guide resource allocation, however, one has to be reasonable about what can be expected from market forecasts. In particular, you
bod30700_ch11_343-380.indd 352bod30700_ch11_343-380.indd 352 8/16/10 4:46 PM8/16/10 4:46 PM
Confirming Pages
C H A P T E R 1 1 The Efficient Market Hypothesis 353
shouldn’t confuse an efficient market, where all available information is reflected in prices, with a perfect foresight market. Even “all available information” is still far from complete information, and generally rational market forecasts will sometimes be wrong; sometimes, in fact, they will be very wrong.
11.3 Event Studies The notion of informationally efficient markets leads to a powerful research methodology. If security prices reflect all currently available information, then price changes must reflect new information. Therefore, it seems that one should be able to measure the importance of an event of interest by examining price changes during the period in which the event occurs.
An event study describes a technique of empirical financial research that enables an observer to assess the impact of a particular event on a firm’s stock price. A stock market analyst might want to study the impact of dividend changes on stock prices, for example. An event study would quantify the relationship between dividend changes and stock returns.
Analyzing the impact of any particular event is more difficult than it might at first appear. On any day, stock prices respond to a wide range of economic news such as updated forecasts for GDP, inflation rates, interest rates, or corporate profitability. Isolating the part of a stock price movement that is attributable to a specific event is not a trivial exercise.
The general approach starts with a proxy for what the stock’s return would have been in the absence of the event. The abnormal return due to the event is estimated as the d ifference between the stock’s actual return and this benchmark. Several methodologies for estimating the benchmark return are used in practice. For example, a very simple approach measures the stock’s abnormal return as its return minus that of a broad market index. An obvious refinement is to compare the stock’s return to those of other stocks matched accord-ing to criteria such as firm size, beta, recent performance, or ratio of price to book value per share. Another approach estimates normal returns using an asset pricing model such as the CAPM or one of its multifactor generalizations such as the Fama-French three-factor model.
Many researchers have used a “market model” to estimate abnormal returns. This approach is based on the index models we introduced in Chapter 9. Recall that a single-index model holds that stock returns are determined by a market factor and a firm-specific factor. The stock return, r t , during a given period t, would be expressed mathematically as
rt 5 a 1 brMt 1 et (11.1)
where r Mt is the market’s rate of return during the period and e t is the part of a security’s return resulting from firm-specific events. The parameter b measures sensitivity to the market return, and a is the average rate of return the stock would realize in a period with a zero market return. 7 Equation 11.1 therefore provides a decomposition of r t into market and firm-specific factors. The firm-specific or abnormal return may be interpreted as the unexpected return that results from the event.
Determination of the abnormal return in a given period requires an estimate of e t . Therefore, we rewrite Equation 11.1:
et 5 rt 2 (a 1 brMt) (11.2)
7 We know from Chapter 9 that the CAPM implies that the intercept a in Equation 11.1 should equal r f (1 � � ). Nevertheless, it is customary to estimate the intercept in this equation empirically rather than imposing the CAPM value. One justification for this practice is that empirically fitted security market lines seem flatter than predicted by the CAPM (see Chapter 13), which would make the intercept implied by the CAPM too small.
bod30700_ch11_343-380.indd 353bod30700_ch11_343-380.indd 353 8/16/10 4:46 PM8/16/10 4:46 PM

Confirming Pages
354 P A R T I I I Equilibrium in Capital Markets
Equation 11.2 has a simple interpretation: The residual, e t , that is, the component presum-ably due to the event in question, is the stock’s return over and above what one would predict based on broad market movements in that period, given the stock’s sensitivity to the market.
The market model is a highly flexible tool, because it can be generalized to include richer models of benchmark returns, for example, by including industry as well as broad market returns on the right-hand side of Equation 11.1, or returns on indexes constructed to match characteristic such as firm size. However, one must be careful that regression parameters in Equation 11.1 (the intercept a and slope b ) are estimated properly. In par-ticular, they must be estimated using data sufficiently separated in time from the event in question that they are not affected by event-period abnormal stock performance. In part because of this vulnerability of the market model, returns on characteristic-matched port-folios have become more widely used benchmarks in recent years.
Example 11.3 Abnormal Returns
Suppose that the analyst has estimated that a � .05% and b � .8. On a day that the mar-ket goes up by 1%, you would predict from Equation 11.1 that the stock should rise by an expected value of .05% � .8 � 1% � .85%. If the stock actually rises by 2%, the analyst would infer that firm-specific news that day caused an additional stock return of 2% � .85% � 1.15%. This is the abnormal return for the day.
We measure the impact of an event by estimating the abnormal return on a stock (or group of stocks) at the moment the information about the event becomes known to the market. For example, in a study of the impact of merger attempts on the stock prices of tar-get firms, the announcement date is the date on which the public is informed that a merger is to be attempted. The abnormal returns of each firm surrounding the announcement date are computed, and the statistical significance and magnitude of the typical abnormal return are assessed to determine the impact of the newly released information.
One concern that complicates event studies arises from leakage of information. Leakage occurs when information regarding a relevant event is released to a small group of inves-tors before official public release. In this case the stock price might start to increase (in the case of a “good news” announcement) days or weeks before the official announcement date. Any abnormal return on the announcement date is then a poor indicator of the total impact of the information release. A better indicator would be the cumulative abnormal return, which is simply the sum of all abnormal returns over the time period of interest. The cumulative abnormal return thus captures the total firm-specific stock movement for an entire period when the market might be responding to new information.
Figure 11.1 (earlier in the chapter) presents the results from a fairly typical event study. The authors of this study were interested in leakage of information before merger announce-ments and constructed a sample of 194 firms that were targets of takeover attempts. In most takeovers, stockholders of the acquired firms sell their shares to the acquirer at sub-stantial premiums over market value. Announcement of a takeover attempt is good news for shareholders of the target firm and therefore should cause stock prices to jump.
Figure 11.1 confirms the good-news nature of the announcements. On the announce-ment day, called day 0, the average cumulative abnormal return (CAR) for the sample of takeover candidates increases substantially, indicating a large and positive abnormal return on the announcement date. Notice that immediately after the announcement date the CAR no longer increases or decreases significantly. This is in accord with the efficient mar-ket hypothesis. Once the new information became public, the stock prices jumped almost
bod30700_ch11_343-380.indd 354bod30700_ch11_343-380.indd 354 8/16/10 4:46 PM8/16/10 4:46 PM

Confirming Pages
C H A P T E R 1 1 The Efficient Market Hypothesis 355
immediately in response to the good news. With prices once again fairly set, reflecting the effect of the new information, further abnormal returns on any particular day are equally likely to be positive or negative. In fact, for a sample of many firms, the average abnormal return should be extremely close to zero, and thus the CAR will show neither upward nor downward drift. This is precisely the pattern shown in Figure 11.1 .
The pattern of returns for the days preceding the public announcement date yields some interesting evidence about efficient markets and information leakage. If insider trading rules were perfectly obeyed and perfectly enforced, stock prices should show no abnormal returns on days before the public release of relevant news, because no special firm-specific infor-mation would be available to the market before public announcement. Instead, we should observe a clean jump in the stock price only on the announcement day. In fact, Figure 11.1 shows that the prices of the takeover targets clearly start an upward drift 30 days before the public announcement. It appears that information is leaking to some market participants who then purchase the stocks before the public announcement. Such evidence of leakage appears almost universally in event studies, suggesting at least some abuse of insider trading rules.
Actually, the SEC also can take some comfort from patterns such as that in Figure 11.1 . If insider trading rules were widely and flagrantly violated, we would expect to see abnor-mal returns earlier than they appear in these results. For example, in the case of mergers, the CAR would turn positive as soon as acquiring firms decided on their takeover targets, because insiders would start trading immediately. By the time of the public announce-ment, the insiders would have bid up the stock prices of target firms to levels reflecting the merger attempt, and the abnormal returns on the actual public announcement date would be close to zero. The dramatic increase in the CAR that we see on the announcement date indicates that a good deal of these announcements are indeed news to the market and that stock prices did not already reflect complete knowledge about the takeovers. It would appear, therefore, that SEC enforcement does have a substantial effect on restricting insider trading, even if some amount of it still persists.
Event study methodology has become a widely accepted tool to measure the economic impact of a wide range of events. For example, the SEC regularly uses event studies to measure illicit gains captured by traders who may have violated insider trading or other securities laws. 8 Event studies are also used in fraud cases, where the courts must assess damages caused by a fraudulent activity.
Example 11.4 Using Abnormal Returns to Infer Damages
Suppose the stock of a company with market value of $100 million falls by 4% on the day that news of an accounting scandal surfaces. The rest of the market, however, generally did well that day. The market indexes were up sharply, and on the basis of the usual relation-ship between the stock and the market, one would have expected a 2% gain on the stock. We would conclude that the impact of the scandal was a 6% drop in value, the difference between the 2% gain that we would have expected and the 4% drop actually observed. One might then infer that the damages sustained from the scandal were $6 million, because the value of the firm (after adjusting for general market movements) fell by 6% of $100 million when investors became aware of the news and reassessed the value of the stock.
8 For a review of SEC applications of this technique, see Mark Mitchell and Jeffry Netter, “The Role of Financial Economics in Securities Fraud Cases: Applications at the Securities and Exchange Commission,” The Business Lawyer 49 (February 1994), pp. 545–90.
bod30700_ch11_343-380.indd 355bod30700_ch11_343-380.indd 355 8/16/10 4:46 PM8/16/10 4:46 PM

Confirming Pages
356 P A R T I I I Equilibrium in Capital Markets
11.4 Are Markets Efficient?
CONCEPT CHECK
4 Suppose that we see negative abnormal returns (declining CARs) after an announcement date. Is this a violation of efficient markets?
The Issues Not surprisingly, the efficient market hypothesis does not exactly arouse enthusiasm in the community of professional portfolio managers. It implies that a great deal of the activity of portfolio managers—the search for undervalued securities—is at best wasted effort, and quite probably harmful to clients because it costs money and leads to imperfectly diversified portfolios. Consequently, the EMH has never been widely accepted on Wall Street, and debate continues today on the degree to which security analysis can improve investment performance. Before discussing empirical tests of the hypothesis, we want to note three factors that together imply that the debate probably never will be settled: the magnitude issue, the selection bias issue, and the lucky event issue.
The Magnitude Issue We noted that an investment manager overseeing a $5 billion portfolio who can improve performance by only .1% per year will increase investment earnings by .001 � $5 billion � $5 million annually. This manager clearly would be worth her salary! Yet can we, as observers, statistically measure her contribution? Probably not: A .1% contribution would be swamped by the yearly volatility of the market. Remember, the annual standard deviation of the well-diversified S&P 500 index has been around 20%. Against these fluctuations a small increase in performance would be hard to detect.
All might agree that stock prices are very close to fair values and that only managers of large portfolios can earn enough trading profits to make the exploitation of minor mispric-ing worth the effort. According to this view, the actions of intelligent investment managers are the driving force behind the constant evolution of market prices to fair levels. Rather than ask the qualitative question, Are markets efficient? we ought instead to ask a more quantitative question: How efficient are markets?
The Selection Bias Issue Suppose that you discover an investment scheme that could really make money. You have two choices: either publish your technique in The Wall Street Journal to win fleeting fame, or keep your technique secret and use it to earn millions of dollars. Most investors would choose the latter option, which presents us with a conundrum. Only investors who find that an investment scheme cannot generate abnormal returns will be willing to report their findings to the whole world. Hence opponents of the efficient markets view of the world always can use evidence that various techniques do not provide investment rewards as proof that the techniques that do work simply are not being reported to the public. This is a problem in selection bias; the outcomes we are able to observe have been preselected in favor of failed attempts. Therefore, we cannot fairly evaluate the true ability of portfolio managers to generate winning stock market strategies.
The Lucky Event Issue In virtually any month it seems we read an article about some investor or investment company with a fantastic investment performance over the recent past. Surely the superior records of such investors disprove the efficient market hypothesis.
Yet this conclusion is far from obvious. As an analogy to the investment game, consider a contest to flip the most number of heads out of 50 trials using a fair coin. The expected
bod30700_ch11_343-380.indd 356bod30700_ch11_343-380.indd 356 8/16/10 4:46 PM8/16/10 4:46 PM

Confirming Pages
357
outcome for any person is, of course, 50% heads and 50% tails. If 10,000 people, however, compete in this contest, it would not be surprising if at least one or two contestants flipped more than 75% heads. In fact, elementary statistics tells us that the expected number of contestants flipping 75% or more heads would be two. It would be silly, though, to crown these people the “head-flipping champions of the world.” Obviously, they are simply the contestants who happened to get lucky on the day of the event. (See the nearby box.)
The analogy to efficient markets is clear. Under the hypothesis that any stock is fairly priced given all available information, any bet on a stock is simply a coin toss. There is equal likelihood of winning or losing the bet. However, if many investors using a variety of schemes make fair bets, statistically speaking, some of those investors will be lucky and win a great majority of the bets. For every big winner, there may be many big losers, but we never hear of these managers. The winners, though, turn up in The Wall Street Journal as the latest stock market gurus; then they can make a fortune publishing market newsletters.
Our point is that after the fact there will have been at least one successful investment scheme. A doubter will call the results luck, the successful investor will call it skill. The proper test would be to see whether the successful investors can repeat their performance in another period, yet this approach is rarely taken.
With these caveats in mind, we turn now to some of the empirical tests of the efficient market hypothesis.
CONCEPT CHECK
5
Legg Mason’s Value Trust, managed by Bill Miller, outperformed the S&P 500 in each of the 15 years ending in 2005. Is Miller’s performance sufficient to dissuade you from a belief in efficient markets? If not, would any performance record be sufficient to dissuade you? Now consider that in the next 3 years, the fund dramatically underperformed the S&P 500; by the end of 2008, its cumulative 18-year performance was barely different from the index. Does this affect your opinion?
How to Guarantee a Successful Market Newsletter
Suppose you want to make your fortune publishing a market newsletter. You need first to convince potential subscribers that you have talent worth paying for. But what if you have no talent? The solution is simple: start eight newsletters.
In year 1, let four of your newsletters predict an up- market and four a down-market. In year 2, let half of the originally optimistic group of newsletters continue to pre-dict an up-market and the other half a down-market. Do the same for the originally pessimistic group. Continue in this manner to obtain the pattern of predictions in the table that follows (U � prediction of an up-market, D � prediction of a down-market).
After 3 years, no matter what has happened to the market, one of the newsletters would have had a perfect prediction record. This is because after 3 years there are 2 3 � 8 outcomes for the market, and we have covered all eight possibilities with the eight newsletters. Now, we sim-ply slough off the seven unsuccessful newsletters, and mar-ket the eighth newsletter based on its perfect track record. If we want to establish a newsletter with a perfect track record over a 4-year period, we need 2 4 � 16 newsletters. A 5-year period requires 32 newsletters, and so on.
After the fact, the one newsletter that was always right will attract attention for your uncanny fore-sight and investors will rush to pay large fees for its advice. Your fortune is made, and you have never even researched the market!
WARNING: This scheme is illegal! The point, however, is that with hundreds of market newsletters, you can find one that has stumbled onto an apparently remarkable string of successful predictions without any real degree of skill. After the fact, someone’s prediction history can seem to imply great forecasting skill. This person is the one we will read about in The Wall Street Journal; the others will be forgotten.
Newsletter Predictions
Year 1 2 3 4 5 6 7 8
1 U U U U D D D D
2 U U D D U U D D
3 U D U D U D U D
WO
RD
S FRO
M TH
E STREET
bod30700_ch11_343-380.indd 357bod30700_ch11_343-380.indd 357 8/16/10 4:46 PM8/16/10 4:46 PM

Confirming Pages
358 P A R T I I I Equilibrium in Capital Markets
Weak-Form Tests: Patterns in Stock Returns Returns over Short Horizons Early tests of efficient markets were tests of the weak form. Could speculators find trends in past prices that would enable them to earn abnormal profits? This is essentially a test of the efficacy of technical analysis.
One way of discerning trends in stock prices is by measuring the serial correlation of stock market returns. Serial correlation refers to the tendency for stock returns to be related to past returns. Positive serial correlation means that positive returns tend to fol-low positive returns (a momentum type of property). Negative serial correlation means that positive returns tend to be followed by negative returns (a reversal or “correction” property). Both Conrad and Kaul 9 and Lo and MacKinlay 10 examine weekly returns of NYSE stocks and find positive serial correlation over short horizons. However, the cor-relation coefficients of weekly returns tend to be fairly small, at least for large stocks for which price data are the most reliably up-to-date. Thus, while these studies demonstrate weak price trends over short periods, 11 the evidence does not clearly suggest the existence of trading opportunities.
While broad market indexes demonstrate only weak serial correlation, there appears to be stronger momentum in performance across market sectors exhibiting the best and worst recent returns. In an investigation of intermediate-horizon stock price behavior (using 3- to 12-month holding periods), Jegadeesh and Titman 12 found a momentum effect in which good or bad recent performance of particular stocks continues over time. They conclude that while the performance of individual stocks is highly unpredictable, portfolios of the best-performing stocks in the recent past appear to outperform other stocks with enough reliability to offer profit opportunities. Thus, it appears that there is evidence of short- to intermediate-horizon price momentum in both the aggregate market and cross-sectionally (i.e., across particular stocks).
Returns over Long Horizons Although studies of short- to intermediate- horizon returns have detected momentum in stock market prices, tests 13 of long-horizon returns (i.e., returns over multiyear periods) have found suggestions of pronounced negative long-term serial correlation in the performance of the aggregate market. The latter result has given rise to a “fads hypothesis,” which asserts that the stock market might over-react to relevant news. Such overreaction leads to positive serial correlation (momen-tum) over short time horizons. Subsequent correction of the overreaction leads to poor performance following good performance and vice versa. The corrections mean that a run of positive returns eventually will tend to be followed by negative returns, leading to
9 Jennifer Conrad and Gautam Kaul, “Time-Variation in Expected Returns,” Journal of Business 61 (October 1988), pp. 409–25.
10 Andrew W. Lo and A. Craig MacKinlay, “Stock Market Prices Do Not Follow Random Walks: Evidence from a Simple Specification Test,” Review of Financial Studies 1 (1988), pp. 41–66.
11 On the other hand, there is evidence that share prices of individual securities (as opposed to broad market indexes) are more prone to reversals than continuations at very short horizons. See, for example, B. Lehmann, “Fads, Martingales and Market Efficiency,” Quarterly Journal of Economics 105 (February 1990), pp. 1–28; and N. Jegadeesh, “Evidence of Predictable Behavior of Security Returns,” Journal of Finance 45 (September 1990), pp. 881–98. However, as Lehmann notes, this is probably best interpreted as due to liquidity problems after big movements in stock prices as market makers adjust their positions in the stock.
12 Narasimhan Jegadeesh and Sheridan Titman, “Returns to Buying Winners and Selling Losers: Implications for Stock Market Efficiency,” Journal of Finance 48 (March 1993), pp. 65–91.
13 Eugene F. Fama and Kenneth R. French, “Permanent and Temporary Components of Stock Prices,” Journal of Political Economy 96 (April 1988), pp. 24–73; James Poterba and Lawrence Summers, “Mean Reversion in Stock Prices: Evidence and Implications,” Journal of Financial Economics 22 (October 1988), pp. 27–59.
bod30700_ch11_343-380.indd 358bod30700_ch11_343-380.indd 358 8/16/10 4:46 PM8/16/10 4:46 PM

Confirming Pages
C H A P T E R 1 1 The Efficient Market Hypothesis 359
negative serial correlation over longer horizons. These episodes of apparent overshoot-ing followed by correction give the stock market the appearance of fluctuating around its fair value.
These long-horizon results are dramatic, but the studies offer far from conclusive evi-dence regarding efficient markets. First, these studies need not be interpreted as evidence for stock market fads. An alternative interpretation of these results holds that they indicate only that the market risk premium varies over time. For example, when the risk premium and the required return on the market rises, stock prices will fall. When the market then rises (on average) at this higher rate of return, the data convey the impression of a stock price recov-ery. The apparent overshooting and correction are in fact no more than a rational response of market prices to changes in discount rates.
In addition to studies suggestive of overreaction in overall stock market returns over long horizons, many other studies suggest that over long horizons, extreme performance in particular securities also tends to reverse itself: The stocks that have performed best in the recent past seem to underperform the rest of the market in following periods, while the worst past performers tend to offer above-average future performance. DeBondt and Thaler 14 and Chopra, Lakonishok, and Ritter 15 find strong tendencies for poorly perform-ing stocks in one period to experience sizable reversals over the subsequent period, while the best-performing stocks in a given period tend to follow with poor performance in the following period.
For example, the DeBondt and Thaler study found that if one were to rank the perfor-mance of stocks over a 5-year period and then group stocks into portfolios based on invest-ment performance, the base-period “loser” portfolio (defined as the 35 stocks with the worst investment performance) outperformed the “winner” portfolio (the top 35 stocks) by an average of 25% (cumulative return) in the following 3-year period. This reversal effect, in which losers rebound and winners fade back, suggests that the stock market overreacts to relevant news. After the overreaction is recognized, extreme investment performance is reversed. This phenomenon would imply that a contrarian investment strategy— investing in recent losers and avoiding recent winners—should be profitable. Moreover, these returns seem pronounced enough to be exploited profitably.
Thus it appears that there may be short-run momentum but long-run reversal patterns in price behavior both for the market as a whole and across sectors of the market. One inter-pretation of this pattern is that short-run overreaction (which causes momentum in prices) may lead to long-term reversals (when the market recognizes its past error).
Predictors of Broad Market Returns Several studies have documented the ability of easily observed variables to predict mar-ket returns. For example, Fama and French 16 showed that the return on the aggregate stock market tends to be higher when the dividend/price ratio, the dividend yield, is high. Campbell and Shiller 17 found that the earnings yield can predict market returns. Keim and
14 Werner F. M. DeBondt and Richard Thaler, “Does the Stock Market Overreact?” Journal of Finance 40 (1985), pp. 793–805.
15 Navin Chopra, Josef Lakonishok, and Jay R. Ritter, “Measuring Abnormal Performance: Do Stocks Overreact?” Journal of Financial Economics 31 (1992), pp. 235–68.
16 Eugene F. Fama and Kenneth R. French, “Dividend Yields and Expected Stock Returns,” Journal of Financial Economics 22 (October 1988), pp. 3–25.
17 John Y. Campbell and Robert Shiller, “Stock Prices, Earnings and Expected Dividends,” Journal of Finance 43 (July 1988), pp. 661–76.
bod30700_ch11_343-380.indd 359bod30700_ch11_343-380.indd 359 8/16/10 4:46 PM8/16/10 4:46 PM

Confirming Pages
360 P A R T I I I Equilibrium in Capital Markets
Stambaugh 18 showed that bond market data such as the spread between yields on high- and low-grade corporate bonds also help predict broad market returns.
Again, the interpretation of these results is difficult. On the one hand, they may imply that stock returns can be predicted, in violation of the efficient market hypothesis. More probably, however, these variables are proxying for variation in the market risk premium. For example, given a level of dividends or earnings, stock prices will be lower and divi-dend and earnings yields will be higher when the risk premium (and therefore the expected market return) is higher. Thus a high dividend or earnings yield will be associated with higher market returns. This does not indicate a violation of market efficiency. The predict-ability of market returns is due to predictability in the risk premium, not in risk-adjusted abnormal returns.
Fama and French 19 showed that the yield spread between high- and low-grade bonds has greater predictive power for returns on low-grade bonds than for returns on high-grade bonds, and greater predictive power for stock returns than for bond returns, suggesting that the predictability in returns is in fact a risk premium rather than evidence of market inef-ficiency. Similarly, the fact that the dividend yield on stocks helps to predict bond market returns suggests that the yield captures a risk premium common to both markets rather than mispricing in the equity market.
Semistrong Tests: Market Anomalies Fundamental analysis uses a much wider range of information to create portfolios than does technical analysis. Investigations of the efficacy of fundamental analysis ask whether publicly available information beyond the trading history of a security can be used to improve investment performance, and therefore are tests of semistrong-form market efficiency. Surprisingly, several easily accessible statistics, for example, a stock’s price– earnings ratio or its market capitalization, seem to predict abnormal risk-adjusted returns. Findings such as these, which we will review in the following pages, are difficult to rec-oncile with the efficient market hypothesis, and therefore are often referred to as efficient market anomalies.
A difficulty in interpreting these tests is that we usually need to adjust for portfolio risk before evaluating the success of an investment strategy. Many tests, for example, have used the CAPM to adjust for risk. However, we know that even if beta is a relevant descriptor of stock risk, the empirically measured quantitative trade-off between risk as measured by beta and expected return differs from the predictions of the CAPM. (We review this evidence in Chapter 13.) If we use the CAPM to adjust portfolio returns for risk, inappropriate adjustments may lead to the conclusion that various portfolio strate-gies can generate superior returns, when in fact it simply is the risk adjustment procedure that has failed.
Another way to put this is to note that tests of risk-adjusted returns are joint tests of the efficient market hypothesis and the risk adjustment procedure. If it appears that a portfolio strategy can generate superior returns, we must then choose between rejecting the EMH and rejecting the risk adjustment technique. Usually, the risk adjustment technique is based on more-questionable assumptions than is the EMH; by opting to reject the procedure, we are left with no conclusion about market efficiency.
18 Donald B. Keim and Robert F. Stambaugh, “Predicting Returns in the Stock and Bond Markets,” Journal of Financial Economics 17 (1986), pp. 357–90.
19 Eugene F. Fama and Kenneth R. French, “Business Conditions and Expected Returns on Stocks and Bonds,” Journal of Financial Economics 25 (November 1989), pp. 3–22.
bod30700_ch11_343-380.indd 360bod30700_ch11_343-380.indd 360 8/16/10 4:46 PM8/16/10 4:46 PM

Confirming Pages
C H A P T E R 1 1 The Efficient Market Hypothesis 361
An example of this issue is the discovery by Basu 20 that portfolios of low price–e arnings (P/E) ratio stocks have provided higher returns than high P/E portfolios. The P/E effect holds up even if returns are adjusted for portfolio beta. Is this a confirmation that the market systematically misprices stocks according to P/E ratio? This would be an extremely surprising and, to us, disturbing conclusion, because analysis of P/E ratios is such a simple procedure. Although it may be possible to earn superior returns by using hard work and much insight, it hardly seems plausible that such a simplistic technique is enough to generate abnormal returns.
Another interpretation of these results is that returns are not properly adjusted for risk. If two firms have the same expected earnings, the riskier stock will sell at a lower price and lower P/E ratio. Because of its higher risk, the low P/E stock also will have higher expected returns. Therefore, unless the CAPM beta fully adjusts for risk, P/E will act as a useful additional descriptor of risk, and will be associated with abnormal returns if the CAPM is used to establish benchmark performance.
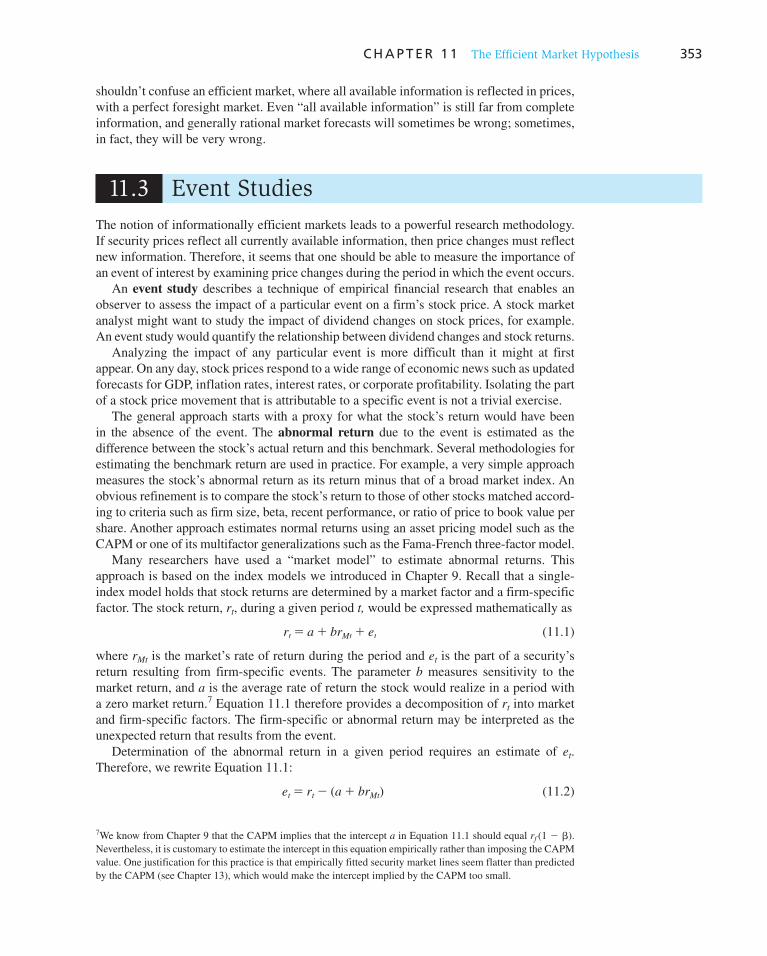
The Small-Firm-in-January Effect The so-called size or small-firm effect, origi-nally documented by Banz, 21 is illustrated in Figure 11.3 . It shows the historical perfor-mance of portfolios formed by dividing the NYSE stocks into 10 portfolios each year according to firm size (i.e., the total value of outstanding equity). Average annual returns between 1926 and 2008 are consistently higher on the small-firm portfolios. The difference
20 Sanjoy Basu, “The Investment Performance of Common Stocks in Relation to Their Price-Earnings Ratios: A Test of the Efficient Market Hypothesis,” Journal of Finance 32 (June 1977), pp. 663–82; and “The Relationship between Earnings Yield, Market Value, and Return for NYSE Common Stocks: Further Evidence,” Journal of Financial Economics 12 (June 1983). 21 Rolf Banz, “The Relationship between Return and Market Value of Common Stocks,” Journal of Financial Economics 9 (March 1981).
0
5
10
15
20
25
1 2
19.34
16.64 16.21 15.6114.6314.76 14.13
13.04 12.4710.77
3 4 5 6 7 8 9 10
An
nu
al R
etu
rn (
%)
Size Decile: 1 = Smallest, 10 = Largest
Figure 11.3 Average annual return for 10 size-based portfolios, 1926–2008
Source: Authors’ calculations, using data obtained from Professor Ken French’s data library at http://mba.tuck.dartmouth.edu/pages/faculty/ken.french/data_library.html.
bod30700_ch11_343-380.indd 361bod30700_ch11_343-380.indd 361 8/16/10 4:46 PM8/16/10 4:46 PM

Confirming Pages
362 P A R T I I I Equilibrium in Capital Markets
in average annual return between portfolio 10 (with the largest firms) and portfolio 1 (with the smallest firms) is 8.57%. Of course, the smaller-firm portfolios tend to be riskier. But even when returns are adjusted for risk using the CAPM, there is still a consistent premium for the smaller-sized portfolios.
Imagine earning a premium of this size on a billion-dollar portfolio. Yet it is remarkable that following a simple (even simplistic) rule such as “invest in low-capitalization stocks” should enable an investor to earn excess returns. After all, any investor can measure firm size at little cost. One would not expect such minimal effort to yield such large rewards.
Later studies (Keim, 22 Reinganum, 23 and Blume and Stambaugh 24 ) showed that the small-firm effect occurs virtually entirely in January, in fact, in the first 2 weeks of January. The size effect is in fact a “small-firm-in-January” effect.
The Neglected-Firm Effect and Liquidity Effects Arbel and Strebel25 gave another interpretation of the small-firm-in-January effect. Because small firms tend to be neglected by large institutional traders, information about smaller firms is less available. This information deficiency makes smaller firms riskier investments that command higher returns. “Brand-name” firms, after all, are subject to considerable monitoring from insti-tutional investors, which promises high-quality information, and presumably investors do not purchase “generic” stocks without the prospect of greater returns.
As evidence for the neglected-firm effect, Arbel 26 divided firms into highly researched, moderately researched, and neglected groups based on the number of institutions hold-ing the stock. The January effect was in fact largest for the neglected firms. An article by Merton 27 shows that neglected firms might be expected to earn higher equilibrium returns as compensation for the risk associated with limited information. In this sense the neglected-firm premium is not strictly a market inefficiency, but is a type of risk premium.
Work by Amihud and Mendelson 28 on the effect of liquidity on stock returns might be related to both the small-firm and neglected-firm effects. As we noted in Chapter 9, inves-tors will demand a rate-of-return premium to invest in less-liquid stocks that entail higher trading costs. In accord with this hypothesis, Amihud and Mendelson showed that these stocks have a strong tendency to exhibit abnormally high risk-adjusted rates of return. Because small and less-analyzed stocks as a rule are less liquid, the liquidity effect might be a partial explanation of their abnormal returns. However, this theory does not explain why the abnormal returns of small firms should be concentrated in January. In any case, exploiting these effects can be more difficult than it would appear. The high trading costs on small stocks can easily wipe out any apparent abnormal profit opportunity.
22 Donald B. Keim, “Size Related Anomalies and Stock Return Seasonality: Further Empirical Evidence,” Journal of Financial Economics 12 (June 1983).
23 Marc R. Reinganum, “The Anomalous Stock Market Behavior of Small Firms in January: Empirical Tests for Tax-Loss Effects,” Journal of Financial Economics 12 (June 1983).
24 Marshall E. Blume and Robert F. Stambaugh, “Biases in Computed Returns: An Application to the Size Effect,” Journal of Financial Economics, 1983.
25 Avner Arbel and Paul J. Strebel, “Pay Attention to Neglected Firms,” Journal of Portfolio Management, Winter 1983.
26 Avner Arbel, “Generic Stocks: An Old Product in a New Package,” Journal of Portfolio Management, Summer 1985. 27 Robert C. Merton, “A Simple Model of Capital Market Equilibrium with Incomplete Information,” Journal of Finance 42 (1987), pp. 483–510.
28 Yakov Amihud and Haim Mendelson, “Asset Pricing and the Bid–Ask Spread,” Journal of Financial Economics 17 (December 1986), pp. 223–50; and “Liquidity, Asset Prices, and Financial Policy,” Financial Analysts Journal 47 (November/December 1991), pp. 56–66.
bod30700_ch11_343-380.indd 362bod30700_ch11_343-380.indd 362 8/16/10 4:46 PM8/16/10 4:46 PM
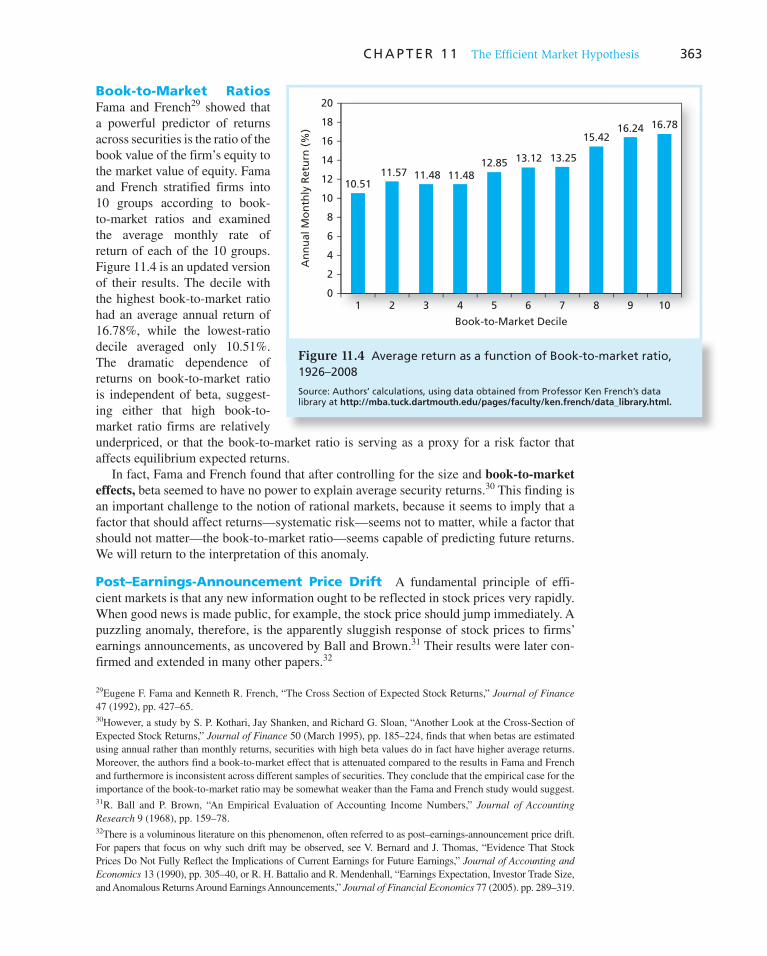
Confirming Pages
C H A P T E R 1 1 The Efficient Market Hypothesis 363
Book-to-Market Ratios Fama and French 29 showed that a powerful predictor of returns across securities is the ratio of the book value of the firm’s equity to the market value of equity. Fama and French stratified firms into 10 groups according to book-to-market ratios and examined the average monthly rate of return of each of the 10 groups. Figure 11.4 is an updated version of their results. The decile with the highest book-to-market ratio had an average annual return of 16.78%, while the lowest-ratio decile averaged only 10.51%. The dramatic dependence of returns on book-to-market ratio is independent of beta, suggest-ing either that high book-to-market ratio firms are relatively underpriced, or that the book-to-market ratio is serving as a proxy for a risk factor that affects equilibrium expected returns.
In fact, Fama and French found that after controlling for the size and book-to-market effects, beta seemed to have no power to explain average security returns. 30 This finding is an important challenge to the notion of rational markets, because it seems to imply that a factor that should affect returns—systematic risk—seems not to matter, while a factor that should not matter—the book-to-market ratio—seems capable of predicting future returns. We will return to the interpretation of this anomaly.
Post–Earnings-Announcement Price Drift A fundamental principle of effi-cient markets is that any new information ought to be reflected in stock prices very rapidly. When good news is made public, for example, the stock price should jump immediately. A puzzling anomaly, therefore, is the apparently sluggish response of stock prices to firms’ earnings announcements, as uncovered by Ball and Brown. 31 Their results were later con-firmed and extended in many other papers. 32
29 Eugene F. Fama and Kenneth R. French, “The Cross Section of Expected Stock Returns,” Journal of Finance47 (1992), pp. 427–65 . 30 However, a study by S. P. Kothari, Jay Shanken, and Richard G. Sloan, “Another Look at the Cross-Section of Expected Stock Returns,” Journal of Finance 50 (March 1995), pp. 185–224, finds that when betas are estimated using annual rather than monthly returns, securities with high beta values do in fact have higher average returns. Moreover, the authors find a book-to-market effect that is attenuated compared to the results in Fama and French and furthermore is inconsistent across different samples of securities. They conclude that the empirical case for the importance of the book-to-market ratio may be somewhat weaker than the Fama and French study would suggest. 31 R. Ball and P. Brown, “An Empirical Evaluation of Accounting Income Numbers,” Journal of Accounting Research 9 (1968), pp. 159–78. 32 There is a voluminous literature on this phenomenon, often referred to as post–earnings-announcement price drift. For papers that focus on why such drift may be observed, see V. Bernard and J. Thomas, “Evidence That Stock Prices Do Not Fully Reflect the Implications of Current Earnings for Future Earnings,” Journal of Accounting and Economics 13 (1990), pp. 305–40, or R. H. Battalio and R. Mendenhall, “Earnings Expectation, Investor Trade Size, and Anomalous Returns Around Earnings Announcements,” Journal of Financial Economics 77 (2005). pp. 289–319.
Book-to-Market Decile
An
nu
al M
on
thly
Ret
urn
(%
)
20
18
16
14
12
10
8
6
4
2
01 2 3 4 5 6 7 8 9 10
10.5111.57 11.48 11.48
12.85 13.12 13.25
15.4216.24 16.78
Figure 11.4 Average return as a function of Book-to-market ratio, 1926–2008
Source: Authors’ calculations, using data obtained from Professor Ken French’s data library at http://mba.tuck.dartmouth.edu/pages/faculty/ken.french/data_library.html.
bod30700_ch11_343-380.indd 363bod30700_ch11_343-380.indd 363 8/16/10 4:46 PM8/16/10 4:46 PM
Confirming Pages
364 P A R T I I I Equilibrium in Capital Markets
The “news content” of an earn-ings announcement can be evaluated by comparing the announcement of actual earnings to the value previ-ously expected by market partici-pants. The difference is the “earnings surprise.” (Market expectations of earnings can be roughly measured by averaging the published earnings forecasts of Wall Street analysts or by applying trend analysis to past earnings.) Rendleman, Jones, and Latané 33 provide an influential study of sluggish price response to earn-ings announcements. They calculate earnings surprises for a large sample of firms, rank the magnitude of the surprise, divide firms into 10 deciles based on the size of the surprise, and calculate abnormal returns for each decile. Figure 11.5 plots cumulative abnormal returns by decile.
Their results are dramatic. The correlation between ranking by earn-ings surprise and abnormal returns across deciles is as predicted. There is a large abnormal return (a jump in cumulative abnormal return) on the earnings announcement day (time 0). The abnormal return is positive for positive-surprise firms and negative for negative-surprise firms.
The more remarkable, and interesting, result of the study concerns stock price move-ment after the announcement date. The cumulative abnormal returns of positive-surprise stocks continue to rise—in other words, exhibit momentum—even after the earnings information becomes public, while the negative-surprise firms continue to suffer negative abnormal returns. The market appears to adjust to the earnings information only gradually, resulting in a sustained period of abnormal returns.
Evidently, one could have earned abnormal profits simply by waiting for earnings announcements and purchasing a stock portfolio of positive-earnings-surprise companies. These are precisely the types of predictable continuing trends that ought to be impossible in an efficient market.
Strong-Form Tests: Inside Information It would not be surprising if insiders were able to make superior profits trading in their firm’s stock. In other words, we do not expect markets to be strong-form efficient; we regulate and
33 Richard J. Rendleman Jr., Charles P. Jones, and Henry A. Latané, “Empirical Anomalies Based on Unexpected Earnings and the Importance of Risk Adjustments,” Journal of Financial Economics 10 (November 1982), pp. 269–87.
10
8
6
4
2
0
−2
−4
−6
−8
−10
−20 −10 0 10 20 30 40 50 60 70 80 90
Cu
mu
lati
ve A
vera
ge
Exce
ss R
etu
rn (
%)
Days from Earnings Announcement
109
8
7
6
5
4
3
2
1
Earnings SurpriseDecile
Figure 11.5 Cumulative abnormal returns in response to earnings announcements
Source: Reprinted from R.J. Rendleman Jr., C. P. Jones, and H. A. Latané, “Empirical Anomalies Based on Unexpected Earnings and the Importance of Risk Adjustments,” Journal of Financial Economics 10 (1982), pp. 269–287. Copyright 1982 with permission from Elsevier Science.
bod30700_ch11_343-380.indd 364bod30700_ch11_343-380.indd 364 8/16/10 4:46 PM8/16/10 4:46 PM

Confirming Pages
C H A P T E R 1 1 The Efficient Market Hypothesis 365
limit trades based on inside information. The ability of insiders to trade profitably in their own stock has been documented in studies by Jaffe, 34 Seyhun, 35 Givoly and Palmon, 36 and others. Jaffe’s was one of the earlier studies that documented the tendency for stock prices to rise after insiders intensively bought shares and to fall after intensive insider sales.
Can other investors benefit by following insiders’ trades? The Securities and Exchange Commission requires all insiders to register their trading activity and it publishes these trades in an Official Summary of Security Transactions and Holdings. Since 2002, insiders must report large trades to the SEC within 2 business days. Once the Official Summary is published, the trades become public information. At that point, if markets are efficient, fully and immediately processing the information released in the Official Summary of trad-ing, an investor should no longer be able to profit from following the pattern of those trades. Several Internet sites contain information on insider trading. See the Web sites at our Online Learning Center ( www.mhhe.com/bkm ) for some suggestions.
The study by Seyhun, which carefully tracked the public release dates of the Official Summary, found that following insider transactions would be to no avail. Although there is some tendency for stock prices to increase even after the Official Summary reports insider buying, the abnormal returns are not of sufficient magnitude to overcome transaction costs.
Interpreting the Anomalies How should we interpret the ever-growing anomalies literature? Does it imply that markets are grossly inefficient, allowing for simplistic trading rules to offer large profit opportuni-ties? Or are there other, more-subtle interpretations?
Risk Premiums or Inefficiencies? The price-earnings, small-firm, market-to-book, momentum, and long-term reversal effects are currently among the most puzzling phenomena in empirical finance. There are several interpretations of these effects. First note that to some extent, some of these phenomena may be related. The feature that small firms, low-market-to-book firms, and recent “losers” seem to have in common is a stock price that has fallen considerably in recent months or years. Indeed, a firm can become a small firm or a low-market-to-book firm by suffering a sharp drop in price. These groups therefore may contain a relatively high proportion of distressed firms that have suffered recent difficulties.
Fama and French 37 argue that these effects can be explained as manifestations of risk premiums. Using their three-factor model, introduced in the previous chapter, they show that stocks with higher “betas” (also known as factor loadings) on size or market-to-book factors have higher average returns; they interpret these returns as evidence of a risk pre-mium associated with the factor. This model does a much better job than the one-factor CAPM in explaining security returns. While size or book-to-market ratios per se are obvi-ously not risk factors, they perhaps might act as proxies for more fundamental determinants of risk. Fama and French argue that these patterns of returns may therefore be consistent with an efficient market in which expected returns are consistent with risk. In this regard, it is worth noting that returns to “style portfolios,” for example, the return on portfolios constructed based on the ratio of book-to-market value (specifically, the Fama-French high
34 Jeffrey F. Jaffe, “Special Information and Insider Trading,” Journal of Business 47 (July 1974).
35 H. Nejat Seyhun, “Insiders’ Profits, Costs of Trading and Market Efficiency,” Journal of Financial Economics 16 (1986).
36 Dan Givoly and Dan Palmon, “Insider Trading and Exploitation of Inside Information: Some Empirical Evidence,” Journal of Business 58 (1985).
37 Eugene F. Fama and Kenneth R. French, “Common Risk Factors in the Returns on Stocks and Bonds,” Journal of Financial Economics 33 (1993), pp. 3–56.
bod30700_ch11_343-380.indd 365bod30700_ch11_343-380.indd 365 8/16/10 4:46 PM8/16/10 4:46 PM

Confirming Pages
366 P A R T I I I Equilibrium in Capital Markets
minus low book-to-market portfolio) or firm size (the return on the small-minus big-firm portfolio) do indeed seem to predict business cycles in many countries. Figure 11.6 shows that returns on these portfolios tend to have positive returns in years prior to rapid growth in gross domestic product. We examine the Fama-French paper in more detail in Chapter 13.
The opposite interpretation is offered by Lakonishok, Shleifer, and Vishney, 38 who argue that these phenomena are evidence of inefficient markets, more specifically, of systematic errors in the forecasts of stock analysts. They believe that analysts extrapolate past perfor-mance too far into the future, and therefore overprice firms with recent good performance and underprice firms with recent poor performance. Ultimately, when market participants recognize their errors, prices reverse. This explanation is consistent with the reversal effect and also, to a degree, is consistent with the small-firm and book-to-market effects because firms with sharp price drops may tend to be small or have high book-to-market ratios.
If Lakonishok, Shleifer, and Vishney are correct, we ought to find that analysts system-atically err when forecasting returns of recent “winner” versus “loser” firms. A study by La Porta 39 is consistent with this pattern. He finds that equity of firms for which analysts predict low growth rates of earnings actually perform better than those with high expected earnings growth. Analysts seem overly pessimistic about firms with low growth prospects and overly optimistic about firms with high growth prospects. When these too-extreme expectations are “corrected,” the low-expected-growth firms outperform high-expected-growth firms.
38 Josef Lakonishok, Andrei Shleifer, and Robert W. Vishney, “Contrarian Investment, Extrapolation, and Risk,” Journal of Finance 50 (1995), pp. 541–78. 39 Raphael La Porta, “Expectations and the Cross Section of Stock Returns,” Journal of Finance 51 (December 1996), pp. 1715–42.
35
30
25
20
15
10
5
0
−5
−10
−15
−20
Past
Yea
r R
etu
rn (
%)
Au
stra
lia
Can
ada
Fran
ce
Ger
man
y
Ital
y
Jap
an
Net
her
lan
ds
Swit
zerl
and
U.K U.S
HML SMB
Figure 11.6 Return to Style Portfolios as Predictors of GDP Growth. Average difference in the return on the style portfolio in years before good GDP growth versus in years with bad GDP growth. Positive value means the style portfolio does better in years prior to good macroeconomic performance. HML � high minus low portfolio, sorted on ratio of book-to-market value. SMB � small minus big portfolio, sorted on firm size.
Source: Reprinted from J. Liew and M. Vassalou, “Can Book-to-Market, Size, and Momentum Be Risk Factors That Predict Economic Growth?” Journal of Financial Economics 57 (2000), pp. 221–45. Copyright 2000 with permission from Elsevier Science.
bod30700_ch11_343-380.indd 366bod30700_ch11_343-380.indd 366 8/16/10 4:46 PM8/16/10 4:46 PM

Confirming Pages
C H A P T E R 1 1 The Efficient Market Hypothesis 367
Anomalies or Data Mining? We have covered many of the so-called anomalies cited in the literature, but our list could go on and on. Some wonder whether these anoma-lies are really unexplained puzzles in financial markets, or whether they instead are an artifact of data mining. After all, if one reruns the computer database of past returns over and over and examines stock returns along enough dimensions, simple chance will cause some criteria to appear to predict returns.
In this regard, it is noteworthy that some anomalies have not shown much staying power after being reported in the academic literature. For example, after the small-firm effect was published in the early 1980s, it promptly disappeared for much of the rest of the decade. Similarly, the book-to-market strategy, which commanded considerable attention in the early 1990s, was ineffective for the rest of that decade.
Still, even acknowledging the potential for data mining, a common thread seems to run through many of the anomalies we have considered, lending support to the notion that there is a real puzzle to explain. Value stocks—defined by low P/E ratio, high book-to-market ratio, or depressed prices relative to historic levels—seem to have provided higher average returns than “glamour” or growth stocks.
One way to address the problem of data mining is to find a data set that has not already been researched and see whether the relationship in question shows up in the new data. Such studies have revealed size, momentum, and book-to-market effects in other security markets around the world. While these phenomena may be a manifestation of a systematic risk premium, the precise nature of that risk is not fully understood.
Bubbles and Market Efficiency Every so often, asset prices seem (at least in retrospect) to lose their grounding in reality. For example, in the tulip mania in 17th-century Holland, tulip prices peaked at several times the annual income of a skilled worker. This episode has become the symbol of a spec-ulative “bubble” in which prices appear to depart from any semblance of intrinsic value. Bubbles seem to arise when a rapid run-up in prices creates a widespread expectation that they will continue to rise. As more and more investors try to get in on the action, they push prices even further. Inevitably, however, the run-up stalls and the bubble ends in a crash.
Less than a century after tulip mania, the South Sea Bubble in England became almost as famous. In this episode, the share price of the South Sea Company rose from £128 in January 1720 to £550 in May, and peaked at around £1,000 in August—just before the bubble burst and the share price collapsed to £150 in September, leading to widespread bankruptcies among those who had borrowed to buy shares on credit. In fact, the company was a major lender of money to investors willing to buy (and thus bid up) its shares. This sequence may sound familiar to anyone who lived through the dot-com boom and bust of 1995–2002 40 or, more recently, the financial turmoil of 2008, with origins widely attri-buted to a collapsing housing price bubble.
The position that security prices in these instances represented rational, unbiased assess-ments of intrinsic value is difficult to defend. And in fact, some economists, most notably Hyman Minsky, have suggested that bubbles arise naturally. During periods of stability and rising prices, investors extrapolate that stability into the future and become more will-ing to take on risk. Risk premiums shrink, leading to further increases in asset prices, and expectations become even more optimistic in a self-fulfilling cycle. But in the end, pricing and risk taking become excessive and the bubble bursts. Ironically, the initial period of stability fosters behavior that ultimately results in instability.
40 The dot-com boom gave rise to the term irrational exuberance. In this vein, consider that one company going public in the investment boom of 1720 described itself simply as “a company for carrying out an undertaking of great advantage, but nobody to know what it is.”
bod30700_ch11_343-380.indd 367bod30700_ch11_343-380.indd 367 8/16/10 4:46 PM8/16/10 4:46 PM

Confirming Pages
368 P A R T I I I Equilibrium in Capital Markets
But beware of jumping to the conclusion that asset prices may generally be thought of as arbitrary and obvious trading opportunities abundant. First, most bubbles become “obvi-ous” only in retrospect. At the time, the price run-up often seems to have a defensible ratio-nale. In the dot-com boom, for example, many contemporary observers rationalized stock price gains as justified by the prospect of a new and more profitable economy, driven by technological advances. Even the irrationality of the tulip mania may have been overblown in its later retelling. 41 In addition, security valuation is intrinsically difficult. Given the considerable imprecision of estimates of intrinsic value, large bets on perceived mispricing may entail hubris.
Moreover, even if you suspect that prices are in fact “wrong,” taking advantage of them can be difficult. We explore these issues in more detail in the following chapter, but for now, we simply point out some impediments to making aggressive bets against an asset, among them, the costs of short selling overpriced securities as well as potential problems obtaining the securities to sell short, and the possibility that even if you are ultimately correct, the market may disagree and prices still can move dramatically against you in the short term, thus wiping out your portfolio.
11.5 Mutual Fund and Analyst Performance
We have documented some of the apparent chinks in the armor of efficient market propo-nents. For investors, the issue of market efficiency boils down to whether skilled investors can make consistent abnormal trading profits. The best test is to look at the performance of market professionals to see if they can generate performance superior to that of a pas-sive index fund that buys and holds the market. We will look at two facets of professional performance: that of stock market analysts who recommend investment positions and that of mutual fund managers who actually manage portfolios.
Stock Market Analysts Stock market analysts historically have worked for brokerage firms, which presents an immediate problem in interpreting the value of their advice: analysts have tended to be overwhelmingly positive in their assessment of the prospects of firms. 42 For example, on a scale of 1 (strong buy) to 5 (strong sell), the average recommendation for 5,628 covered firms in 1996 was 2.04. 43 As a result, we cannot take positive recommendations (e.g., to buy) at face value. Instead, we must look at either the relative strength of analyst recommen-dations compared to those for other firms, or at the change in consensus recommendations.
Womack 44 focuses on changes in analysts’ recommendations and finds that positive changes are associated with increased stock prices of about 5%, and negative changes result in average price decreases of 11%. One might wonder whether these price changes
41 For interesting discussions of this possibility, see Peter Garber, Famous First Bubbles: The Fundamentals of Early Manias (Cambridge: MIT Press, 2000), and Anne Goldgar, Tulipmania: Money, Honor, and Knowledge in the Dutch Golden Age (Chicago: University of Chicago Press, 2007).
42 This problem may be less severe in the future; one recent reform intended to mitigate the conflict of interest in having brokerage firms that sell stocks also provide investment advice is to separate analyst coverage from the other activities of the firm.
43 B. Barber, R. Lehavy, M. McNichols, and B. Trueman, “Can Investors Profit from the Prophets? Security Analyst Recommendations and Stock Returns,” Journal of Finance 56 (April 2001), pp. 531–63.
44 K. L. Womack, “Do Brokerage Analysts’ Recommendations Have Investment Value?” Journal of Finance 51 (March 1996), pp. 137–67.
bod30700_ch11_343-380.indd 368bod30700_ch11_343-380.indd 368 8/16/10 4:46 PM8/16/10 4:46 PM

Confirming Pages
C H A P T E R 1 1 The Efficient Market Hypothesis 369
reflect the market’s recognition of analysts’ superior information or insight about firms or, instead, simply result from new buy or sell pressure brought on by the recommenda-tions themselves. Womack argues that price impact seems to be permanent, and therefore consistent with the hypothesis that analysts do in fact reveal new information. Jegadeesh, Kim, Krische, and Lee 45 also find that changes in consensus recommendations are associ-ated with price changes, but that the level of consensus recommendations is an inconsistent predictor of future stock performance.
Barber, Lehavy, McNichols, and Trueman 46 focus on the level of consensus recom-mendations and show that firms with the most-favorable recommendations outperform those with the least-favorable recommendations. While their results seem impressive, the authors note that portfolio strategies based on analyst consensus recommendations would result in extremely heavy trading activity with associated costs that probably would wipe out the potential profits from the strategy.
In sum, the literature suggests some value added by analysts, but ambiguity remains. Are superior returns following analyst upgrades due to revelation of new information or due to changes in investor demand in response to the changed outlook? Also, are these results exploitable by investors who necessarily incur trading costs?
Mutual Fund Managers As we pointed out in Chapter 4, casual evidence does not support the claim that profes-sionally managed portfolios can consistently beat the market. Figure 4.2 in that chapter demonstrated that between 1972 and 2009 the returns of a passive portfolio indexed to the Wilshire 5000 typically would have been better than those of the average equity fund. On the other hand, there was some (admittedly inconsistent) evidence of persistence in per-formance, meaning that the better managers in one period tended to be better managers in following periods. Such a pattern would suggest that the better managers can with some consistency outperform their competitors, and it would be inconsistent with the notion that market prices already reflect all relevant information.
The analyses cited in Chapter 4 were based on total returns; they did not properly adjust returns for exposure to systematic risk factors. In this section we revisit the question of mutual fund performance, paying more attention to the benchmark against which perfor-mance ought to be evaluated.
As a first pass, we might examine the risk-adjusted returns (i.e., the alpha, or return in excess of required return based on beta and the market index return in each period) of a large sample of mutual funds. But the market index may not be an adequate benchmark against which to evaluate mutual fund returns. Because mutual funds tend to maintain con-siderable holdings in equity of small firms, whereas the capitalization-weighted index is dominated by large firms, mutual funds as a whole will tend to outperform the index when small firms outperform large ones and underperform when small firms fare worse. Thus a better benchmark for the performance of funds would be an index that separately incorpo-rates the stock market performance of smaller firms.
The importance of the benchmark can be illustrated by examining the returns on small stocks in various subperiods. 47 In the 20-year period between 1945 and 1964, for example,
45 N. Jegadeesh, J. Kim, S. D. Krische, and C. M. Lee, “Analyzing the Analysts: When Do Recommendations Add Value?” Journal of Finance 59 (June 2004), pp. 1083–124.
46 Barber et al., op. cit.
47 This illustration and the statistics cited are based on E. J. Elton, M. J. Gruber, S. Das, and M. Hlavka, “Efficiency with Costly Information: A Reinterpretation of Evidence from Managed Portfolios,” Review of Financial Studies 6 (1993), pp. 1–22, which is discussed shortly.
bod30700_ch11_343-380.indd 369bod30700_ch11_343-380.indd 369 8/16/10 4:46 PM8/16/10 4:46 PM
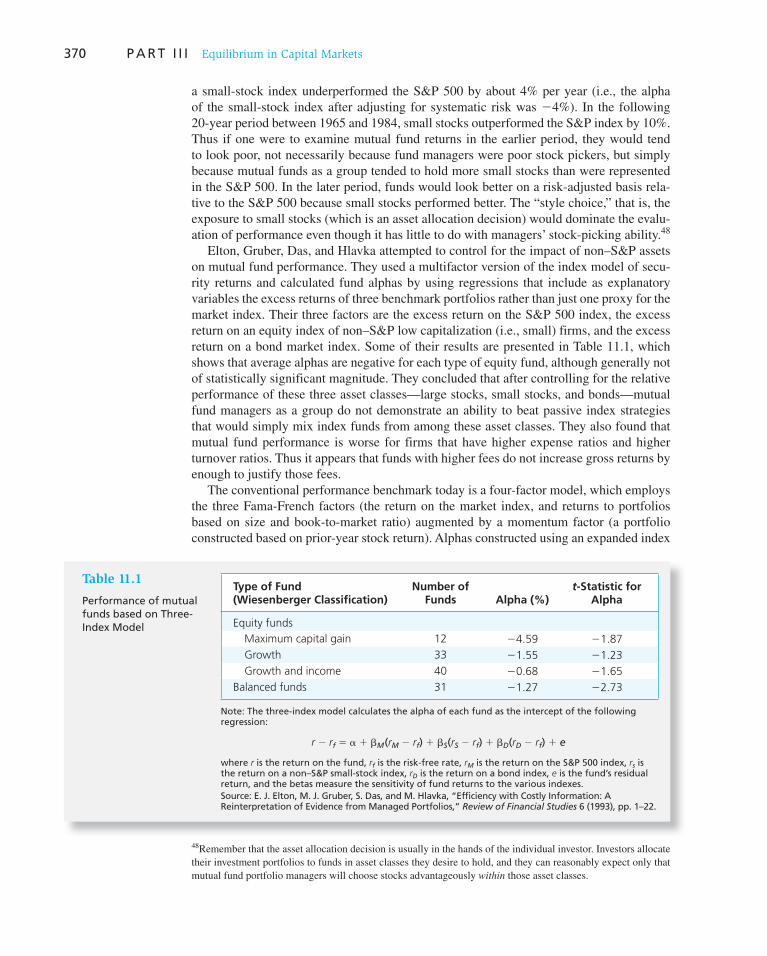
Confirming Pages
370 P A R T I I I Equilibrium in Capital Markets
a small-stock index underperformed the S&P 500 by about 4% per year (i.e., the alpha of the small-stock index after adjusting for systematic risk was �4%). In the following 20-year period between 1965 and 1984, small stocks outperformed the S&P index by 10%. Thus if one were to examine mutual fund returns in the earlier period, they would tend to look poor, not necessarily because fund managers were poor stock pickers, but simply because mutual funds as a group tended to hold more small stocks than were represented in the S&P 500. In the later period, funds would look better on a risk-adjusted basis rela-tive to the S&P 500 because small stocks performed better. The “style choice,” that is, the exposure to small stocks (which is an asset allocation decision) would dominate the evalu-ation of performance even though it has little to do with managers’ stock-picking ability. 48
Elton, Gruber, Das, and Hlavka attempted to control for the impact of non–S&P assets on mutual fund performance. They used a multifactor version of the index model of secu-rity returns and calculated fund alphas by using regressions that include as explanatory variables the excess returns of three benchmark portfolios rather than just one proxy for the market index. Their three factors are the excess return on the S&P 500 index, the excess return on an equity index of non–S&P low capitalization (i.e., small) firms, and the excess return on a bond market index. Some of their results are presented in Table 11.1 , which shows that average alphas are negative for each type of equity fund, although generally not of statistically significant magnitude. They concluded that after controlling for the relative performance of these three asset classes—large stocks, small stocks, and bonds—mutual fund managers as a group do not demonstrate an ability to beat passive index strategies that would simply mix index funds from among these asset classes. They also found that mutual fund performance is worse for firms that have higher expense ratios and higher turnover ratios. Thus it appears that funds with higher fees do not increase gross returns by enough to justify those fees.
The conventional performance benchmark today is a four-factor model, which employs the three Fama-French factors (the return on the market index, and returns to portfolios based on size and book-to-market ratio) augmented by a momentum factor (a portfolio constructed based on prior-year stock return). Alphas constructed using an expanded index
48 Remember that the asset allocation decision is usually in the hands of the individual investor. Investors allocate their investment portfolios to funds in asset classes they desire to hold, and they can reasonably expect only that mutual fund portfolio managers will choose stocks advantageously within those asset classes.
Table 11.1
Performance of mutual funds based on Three-Index Model
Type of Fund (Wiesenberger Classification)
Number of Funds Alpha (%)
t-Statistic for Alpha
Equity funds Maximum capital gain 12 �4.59 �1.87 Growth 33 �1.55 �1.23 Growth and income 40 �0.68 �1.65Balanced funds 31 �1.27 �2.73
Note: The three-index model calculates the alpha of each fund as the intercept of the following regression:
r � rf � � � �M(rM � rf) � �S(rS � rf) � �D(rD � rf) � e
where r is the return on the fund, r f is the risk-free rate, r M is the return on the S&P 500 index, r s is the return on a non–S&P small-stock index, r D is the return on a bond index, e is the fund’s residual return, and the betas measure the sensitivity of fund returns to the various indexes. Source: E. J. Elton, M. J. Gruber, S. Das, and M. Hlavka, “Efficiency with Costly Information: A Reinterpretation of Evidence from Managed Portfolios,” Review of Financial Studies 6 (1993), pp. 1–22.
bod30700_ch11_343-380.indd 370bod30700_ch11_343-380.indd 370 8/16/10 4:46 PM8/16/10 4:46 PM

Confirming Pages
C H A P T E R 1 1 The Efficient Market Hypothesis 371
model using these four factors control for a wide range of mutual fund style choices that may affect average returns, for example, an inclination to growth versus value or small- versus large-capitalization stocks. Figure 11.7 shows a frequency distribution of four- factor alphas for U.S. domestic equity funds. 49 The results show that the distribution of alpha is roughly bell shaped, with a slightly negative mean. On average, it does not appear that these funds outperform their style-adjusted benchmarks.
Carhart 50 reexamines the issue of consistency in mutual fund performance—sometimes called the “hot hands” phenomenon—using the same four-factor model. He finds that after controlling for these factors, there is only minor persistence in relative performance across managers. Moreover, much of that persistence seems due to expenses and transactions costs rather than gross investment returns.
However, Bollen and Busse 51 do find evidence of performance persistence, at least over short horizons. They rank mutual fund performance using the four-factor model over a base quarter, assign funds into one of ten deciles according to base-period alpha, and then look at performance in the following quarter. Figure 11.8 illustrates their results. The solid line is the average alpha of funds within each of the deciles in the base period (expressed on a quarterly basis). The steepness of that curve reflects the considerable dispersion in performance in the ranking period. The dashed line is the average performance of the funds in each decile in the following quarter. The shallowness of this curve indicates that most of the original performance differential disappears. Nevertheless, the plot is still clearly
49 We are grateful to Professor Richard Evans for these data. 50 Mark M. Carhart, “On Persistence in Mutual Fund Performance,” Journal of Finance 52 (1997), pp. 57–82. 51 Nicolas P. B. Bollen and Jeffrey A. Busse, “Short-Term Persistence in Mutual Fund Performance,” Review of Financial Studies 19 (2004), pp. 569–97.
Alpha (% per month)
Freq
uen
cy
20%
25%
15%
10%
5%
0%
−2.0 −1.67 −1.33 −1.0 −0.67 −0.33 0 0.33 0.67 1.0 1.33 1.67
Figure 11.7 Mutual fund alphas computed using a four-factor model of expected return, 1993–2007. (The best and worst 2.5% of observations are excluded from this distribution.)
Source: Professor Richard Evans, University of Virginia, Darden School of Business.
bod30700_ch11_343-380.indd 371bod30700_ch11_343-380.indd 371 8/16/10 4:46 PM8/16/10 4:46 PM
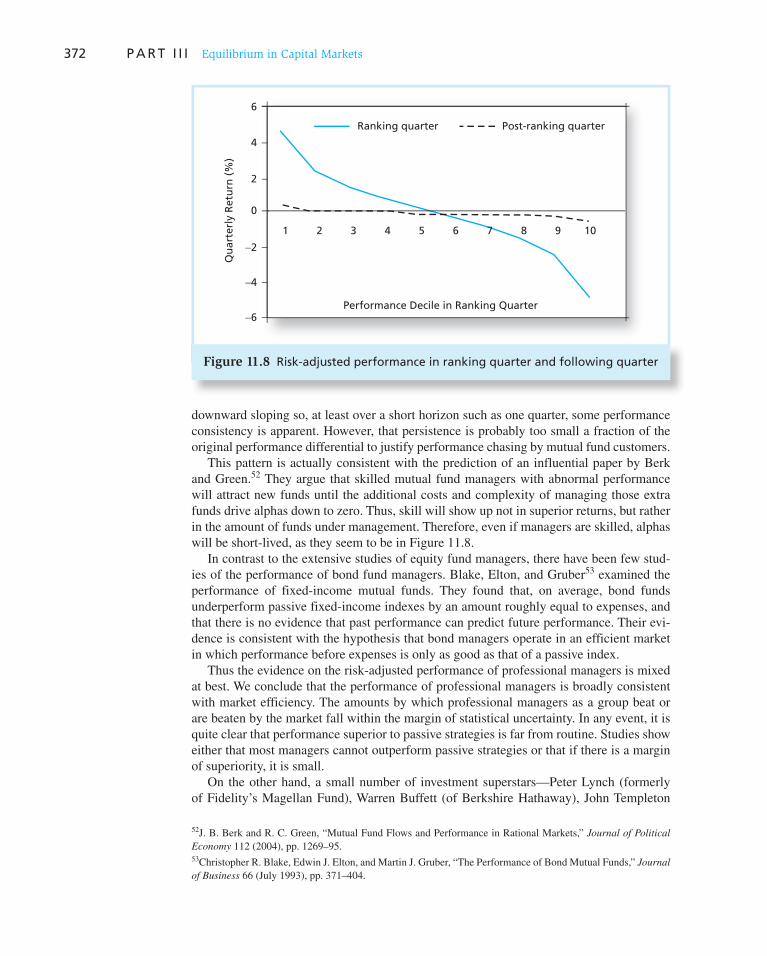
Confirming Pages
372 P A R T I I I Equilibrium in Capital Markets
downward sloping so, at least over a short horizon such as one quarter, some performance consistency is apparent. However, that persistence is probably too small a fraction of the original performance differential to justify performance chasing by mutual fund customers.
This pattern is actually consistent with the prediction of an influential paper by Berk and Green. 52 They argue that skilled mutual fund managers with abnormal performance will attract new funds until the additional costs and complexity of managing those extra funds drive alphas down to zero. Thus, skill will show up not in superior returns, but rather in the amount of funds under management. Therefore, even if managers are skilled, alphas will be short-lived, as they seem to be in Figure 11.8 .
In contrast to the extensive studies of equity fund managers, there have been few stud-ies of the performance of bond fund managers. Blake, Elton, and Gruber 53 examined the performance of fixed-income mutual funds. They found that, on average, bond funds underperform passive fixed-income indexes by an amount roughly equal to expenses, and that there is no evidence that past performance can predict future performance. Their evi-dence is consistent with the hypothesis that bond managers operate in an efficient market in which performance before expenses is only as good as that of a passive index.
Thus the evidence on the risk-adjusted performance of professional managers is mixed at best. We conclude that the performance of professional managers is broadly consistent with market efficiency. The amounts by which professional managers as a group beat or are beaten by the market fall within the margin of statistical uncertainty. In any event, it is quite clear that performance superior to passive strategies is far from routine. Studies show either that most managers cannot outperform passive strategies or that if there is a margin of superiority, it is small.
On the other hand, a small number of investment superstars—Peter Lynch (formerly of Fidelity’s Magellan Fund), Warren Buffett (of Berkshire Hathaway), John Templeton
52 J. B. Berk and R. C. Green, “Mutual Fund Flows and Performance in Rational Markets,” Journal of Political Economy 112 (2004), pp. 1269–95. 53 Christopher R. Blake, Edwin J. Elton, and Martin J. Gruber, “The Performance of Bond Mutual Funds,” Journal of Business 66 (July 1993), pp. 371–404.
Qu
arte
rly
Ret
urn
(%
)
−2
−4
−6
0
6
4
2
Performance Decile in Ranking Quarter
Ranking quarter Post-ranking quarter
1 2 3 4 5 6 7 8 9 10
Figure 11.8 Risk-adjusted performance in ranking quarter and following quarter
bod30700_ch11_343-380.indd 372bod30700_ch11_343-380.indd 372 8/16/10 4:46 PM8/16/10 4:46 PM

Confirming Pages
Vis
it u
s at
ww
w.m
hh
e.co
m/b
km
C H A P T E R 1 1 The Efficient Market Hypothesis 373
(of Templeton Funds), or George Soros among them—have compiled career records that show a consistency of superior performance hard to reconcile with absolutely efficient markets. In a careful statistical analysis of mutual fund “stars,” Kosowski, Timmerman, Wermers, and White 54 conclude that the stock-picking ability of a minority of managers is sufficient to cover their costs, and that their superior performance tends to persist over time. However, Nobel Prize–winner Paul Samuelson 55 reviewed this investment hall of fame and pointed out that the records of the vast majority of professional money manag-ers offer convincing evidence that there are no easy strategies to guarantee success in the securities markets.
So, Are Markets Efficient? There is a telling joke about two economists walking down the street. They spot a $20 bill on the sidewalk. One stoops to pick it up, but the other one says, “Don’t bother; if the bill were real someone would have picked it up already.”
The lesson is clear. An overly doctrinaire belief in efficient markets can paralyze the investor and make it appear that no research effort can be justified. This extreme view is probably unwarranted. There are enough anomalies in the empirical evidence to justify the search for underpriced securities that clearly goes on.
The bulk of the evidence, however, suggests that any supposedly superior investment strategy should be taken with many grains of salt. The market is competitive enough that only differentially superior information or insight will earn money; the easy pickings have been picked. In the end it is likely that the margin of superiority that any professional man-ager can add is so slight that the statistician will not easily be able to detect it.
We conclude that markets are generally very efficient, but that rewards to the especially diligent, intelligent, or creative may in fact be waiting.
54 R. Kosowski, A. Timmerman, R. Wermers, and H. White. “Can Mutual Fund ‘Stars’ Really Pick Stocks? New Evidence from a Bootstrap Analysis,” Journal of Finance 61 (December 2006), pp. 2551–95.
55 Paul Samuelson, “The Judgment of Economic Science on Rational Portfolio Management,” Journal of Portfolio Management 16 (Fall 1989), pp. 4–12.
1. Statistical research has shown that to a close approximation stock prices seem to follow a random walk with no discernible predictable patterns that investors can exploit. Such findings are now taken to be evidence of market efficiency, that is, evidence that market prices reflect all cur-rently available information. Only new information will move stock prices, and this information is equally likely to be good news or bad news.
2. Market participants distinguish among three forms of the efficient market hypothesis. The weak form asserts that all information to be derived from past trading data already is reflected in stock prices. The semistrong form claims that all publicly available information is already reflected. The strong form, which generally is acknowledged to be extreme, asserts that all information, including insider information, is reflected in prices.
3. Technical analysis focuses on stock price patterns and on proxies for buy or sell pressure in the market. Fundamental analysis focuses on the determinants of the underlying value of the firm, such as current profitability and growth prospects. Because both types of analysis are based on public information, neither should generate excess profits if markets are operating efficiently.
4. Proponents of the efficient market hypothesis often advocate passive as opposed to active invest-ment strategies. The policy of passive investors is to buy and hold a broad-based market index.
SUMMARY
bod30700_ch11_343-380.indd 373bod30700_ch11_343-380.indd 373 8/16/10 4:46 PM8/16/10 4:46 PM

Confirming Pages
Vis
it u
s at
ww
w.m
hh
e.co
m/b
kmV
isit
us
at w
ww
.mh
he.
com
/bkm
374 P A R T I I I Equilibrium in Capital Markets
They expend resources neither on market research nor on frequent purchase and sale of stocks. Passive strategies may be tailored to meet individual investor requirements.
5. Event studies are used to evaluate the economic impact of events of interest, using abnormal stock returns. Such studies usually show that there is some leakage of inside information to some market participants before the public announcement date. Therefore, insiders do seem to be able to exploit their access to information to at least a limited extent.
6. Empirical studies of technical analysis do not generally support the hypothesis that such analysis can generate superior trading profits. One notable exception to this conclusion is the apparent success of momentum-based strategies over intermediate-term horizons.
7. Several anomalies regarding fundamental analysis have been uncovered. These include the P/E effect, the small-firm-in-January effect, the neglected-firm effect, post–earnings-announcement price drift, and the book-to-market effect. Whether these anomalies represent market inefficiency or poorly understood risk premiums is still a matter of debate.
8. By and large, the performance record of professionally managed funds lends little credence to claims that most professionals can consistently beat the market.
Related Web sites for this chapter are available at www.mhhe.com/bkm
random walk efficient market hypothesis weak-form EMH semistrong-form EMH strong-form EMH technical analysis resistance levels
support levels fundamental analysis passive investment strategy index fund event study abnormal return cumulative abnormal return
momentum effect reversal effect anomalies P/E effect small-firm effect neglected-firm effect book-to-market effect
KEY TERMS
1. If markets are efficient, what should be the correlation coefficient between stock returns for two non-overlapping time periods?
2. A successful firm like Microsoft has consistently generated large profits for years. Is this a viola-tion of the EMH?
3. “If all securities are fairly priced, all must offer equal expected rates of return.” Comment.
4. Steady Growth Industries has never missed a dividend payment in its 94-year history. Does this make it more attractive to you as a possible purchase for your stock portfolio?
5. At a cocktail party, your co-worker tells you that he has beaten the market for each of the last 3 years. Suppose you believe him. Does this shake your belief in efficient markets?
6. “Highly variable stock prices suggest that the market does not know how to price stocks.” Comment.
7. Why are the following “effects” considered efficient market anomalies? Are there rational expla-nations for any of these effects?
a. P/E effect. b. Book-to-market effect. c. Momentum effect. d. Small-firm effect.
8. If prices are as likely to increase as decrease, why do investors earn positive returns from the market on average?
9. Which of the following most appears to contradict the proposition that the stock market is weakly efficient? Explain.
a. Over 25% of mutual funds outperform the market on average. b. Insiders earn abnormal trading profits. c. Every January, the stock market earns abnormal returns.
PROBLEM SETS
i. Basic
ii. Intermediate
bod30700_ch11_343-380.indd 374bod30700_ch11_343-380.indd 374 8/16/10 4:46 PM8/16/10 4:46 PM

Confirming Pages
Vis
it u
s at
ww
w.m
hh
e.co
m/b
km
C H A P T E R 1 1 The Efficient Market Hypothesis 375
10. Which of the following sources of market inefficiency would be most easily exploited?
a. A stock price drops suddenly due to a large block sale by an institution. b. A stock is overpriced because traders are restricted from short sales. c. Stocks are overvalued because investors are exuberant over increased productivity in the
economy.
11. Suppose that, after conducting an analysis of past stock prices, you come up with the following observations. Which would appear to contradict the weak form of the efficient market hypoth-esis? Explain.
a. The average rate of return is significantly greater than zero. b. The correlation between the return during a given week and the return during the following
week is zero. c. One could have made superior returns by buying stock after a 10% rise in price and selling
after a 10% fall. d. One could have made higher-than-average capital gains by holding stocks with low dividend
yields.
12. Which of the following statements are true if the efficient market hypothesis holds?
a. It implies that future events can be forecast with perfect accuracy. b. It implies that prices reflect all available information. c. It implies that security prices change for no discernible reason. d. It implies that prices do not fluctuate.
13. Respond to each of the following comments.
a. If stock prices follow a random walk, then capital markets are little different from a casino. b. A good part of a company’s future prospects are predictable. Given this fact, stock prices
can’t possibly follow a random walk. c. If markets are efficient, you might as well select your portfolio by throwing darts at the stock
listings in The Wall Street Journal.
14. Which of the following would be a viable way to earn abnormally high trading profits if markets are semistrong-form efficient?
a. Buy shares in companies with low P/E ratios. b. Buy shares in companies with recent above-average price changes. c. Buy shares in companies with recent below-average price changes. d. Buy shares in companies for which you have advance knowledge of an improvement in the
management team.
15. Suppose you find that prices of stocks before large dividend increases show on average consist-ently positive abnormal returns. Is this a violation of the EMH?
16. “If the business cycle is predictable, and a stock has a positive beta, the stock’s returns also must be predictable.” Respond.
17. Which of the following phenomena would be either consistent with or a violation of the effi-cient market hypothesis? Explain briefly.
a. Nearly half of all professionally managed mutual funds are able to outperform the S&P 500 in a typical year.
b. Money managers that outperform the market (on a risk-adjusted basis) in one year are likely to outperform in the following year.
c. Stock prices tend to be predictably more volatile in January than in other months. d. Stock prices of companies that announce increased earnings in January tend to outperform
the market in February. e. Stocks that perform well in one week perform poorly in the following week.
18. An index model regression applied to past monthly returns in Ford’s stock price produces the following estimates, which are believed to be stable over time:
rF 5 .10% 1 1.1rM
If the market index subsequently rises by 8% and Ford’s stock price rises by 7%, what is the abnormal change in Ford’s stock price?
bod30700_ch11_343-380.indd 375bod30700_ch11_343-380.indd 375 8/16/10 4:46 PM8/16/10 4:46 PM

Confirming Pages
Vis
it u
s at
ww
w.m
hh
e.co
m/b
km376 P A R T I I I Equilibrium in Capital Markets
19. The monthly rate of return on T-bills is 1%. The market went up this month by 1.5%. In addi-tion, AmbChaser, Inc., which has an equity beta of 2, surprisingly just won a lawsuit that awards it $1 million immediately.
a. If the original value of AmbChaser equity were $100 million, what would you guess was the rate of return of its stock this month?
b. What is your answer to ( a ) if the market had expected AmbChaser to win $2 million?
20. In a recent closely contested lawsuit, Apex sued Bpex for patent infringement. The jury came back today with its decision. The rate of return on Apex was r A � 3.1%. The rate of return on Bpex was only r B � 2.5%. The market today responded to very encouraging news about the unemployment rate, and r M � 3%. The historical relationship between returns on these stocks and the market portfolio has been estimated from index model regressions as:
Apex: rA 5 .2% 1 1.4rM
Bpex: rB 5 2.1% 1 .6rM
On the basis of these data, which company do you think won the lawsuit?
21. Investors expect the market rate of return in the coming year to be 12%. The T-bill rate is 4%. Changing Fortunes Industries’ stock has a beta of .5. The market value of its outstanding equity is $100 million.
a. What is your best guess currently as to the expected rate of return on Changing Fortunes’ stock? You believe that the stock is fairly priced.
b. If the market return in the coming year actually turns out to be 10%, what is your best guess as to the rate of return that will be earned on Changing Fortunes’ stock?
c. Suppose now that Changing Fortunes wins a major lawsuit during the year. The settlement is $5 million. Changing Fortunes’ stock return during the year turns out to be 10%. What is your best guess as to the settlement the market previously expected Changing Fortunes to receive from the lawsuit? (Continue to assume that the market return in the year turned out to be 10%.) The magnitude of the settlement is the only unexpected firm-specific event during the year.
22. Dollar-cost averaging means that you buy equal dollar amounts of a stock every period, for exam-ple, $500 per month. The strategy is based on the idea that when the stock price is low, your fixed monthly purchase will buy more shares, and when the price is high, fewer shares. Averaging over time, you will end up buying more shares when the stock is cheaper and fewer when it is relatively expensive. Therefore, by design, you will exhibit good market timing. Evaluate this strategy.
23. We know that the market should respond positively to good news and that good-news events such as the coming end of a recession can be predicted with at least some accuracy. Why, then, can we not predict that the market will go up as the economy recovers?
24. You know that firm XYZ is very poorly run. On a scale of 1 (worst) to 10 (best), you would give it a score of 3. The market consensus evaluation is that the management score is only 2. Should you buy or sell the stock?
25. Suppose that during a certain week the Fed announces a new monetary growth policy, Congress surprisingly passes legislation restricting imports of foreign automobiles, and Ford comes out with a new car model that it believes will increase profits substantially. How might you go about measuring the market’s assessment of Ford’s new model?
26. Good News, Inc., just announced an increase in its annual earnings, yet its stock price fell. Is there a rational explanation for this phenomenon?
27. Shares of small firms with thinly traded stocks tend to show positive CAPM alphas. Is this a violation of the efficient market hypothesis?
28. Examine the accompanying figure, 56 which presents cumulative abnormal returns both before and after dates on which insiders buy or sell shares in their firms. How do you interpret this figure? What are we to make of the pattern of CARs before and after the event date?
56 Reprinted from Nejat H. Seyhun, “Insiders, Profits, Costs of Trading and Market Efficiency,” Journal of Financial Economics 16 (1986). Copyright 1986 with permission from Elsevier Science.
iii. Challenge
bod30700_ch11_343-380.indd 376bod30700_ch11_343-380.indd 376 8/16/10 4:46 PM8/16/10 4:46 PM
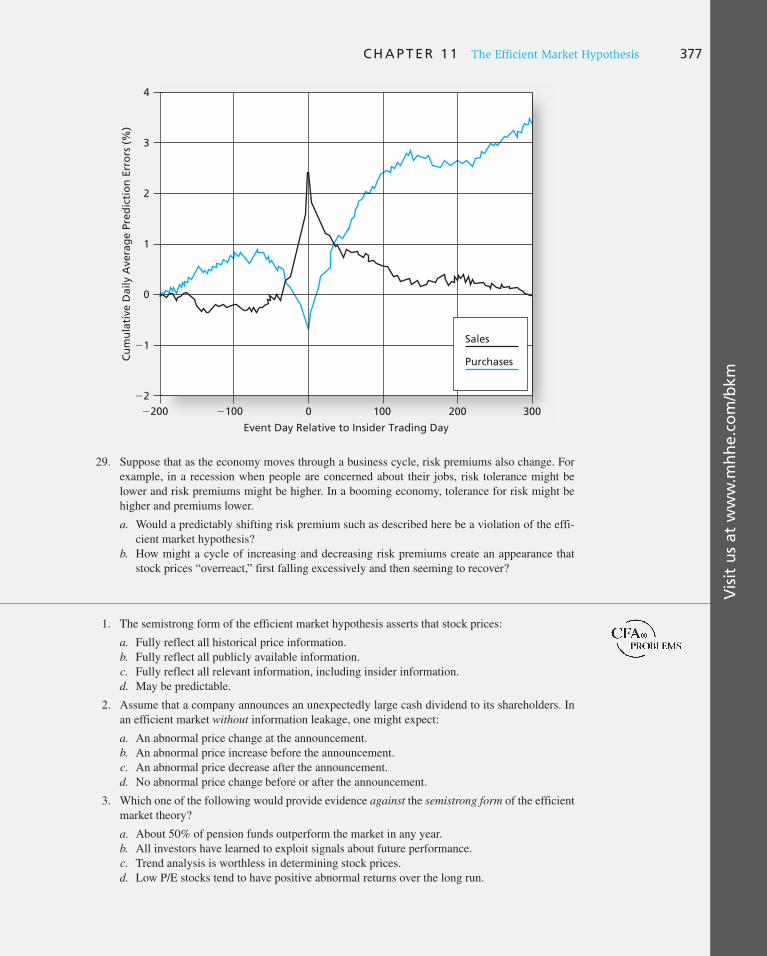
Confirming Pages
Vis
it u
s at
ww
w.m
hh
e.co
m/b
km
C H A P T E R 1 1 The Efficient Market Hypothesis 377
29. Suppose that as the economy moves through a business cycle, risk premiums also change. For example, in a recession when people are concerned about their jobs, risk tolerance might be lower and risk premiums might be higher. In a booming economy, tolerance for risk might be higher and premiums lower.
a. Would a predictably shifting risk premium such as described here be a violation of the effi-cient market hypothesis?
b. How might a cycle of increasing and decreasing risk premiums create an appearance that stock prices “overreact,” first falling excessively and then seeming to recover?
Event Day Relative to Insider Trading Day
Cu
mu
lati
ve D
aily
Ave
rag
e Pr
edic
tio
n E
rro
rs (
%)
200 100 0 100 200 300
Sales
Purchases
2
1
0
1
2
3
4
1. The semistrong form of the efficient market hypothesis asserts that stock prices:
a. Fully reflect all historical price information. b. Fully reflect all publicly available information. c. Fully reflect all relevant information, including insider information. d. May be predictable.
2. Assume that a company announces an unexpectedly large cash dividend to its shareholders. In an efficient market without information leakage, one might expect:
a. An abnormal price change at the announcement. b. An abnormal price increase before the announcement. c. An abnormal price decrease after the announcement. d. No abnormal price change before or after the announcement.
3. Which one of the following would provide evidence against the semistrong form of the efficient market theory?
a. About 50% of pension funds outperform the market in any year. b. All investors have learned to exploit signals about future performance. c. Trend analysis is worthless in determining stock prices. d. Low P/E stocks tend to have positive abnormal returns over the long run.
bod30700_ch11_343-380.indd 377bod30700_ch11_343-380.indd 377 8/16/10 4:46 PM8/16/10 4:46 PM

Confirming Pages
Vis
it u
s at
ww
w.m
hh
e.co
m/b
km378 P A R T I I I Equilibrium in Capital Markets
4. According to the efficient market hypothesis:
a. High-beta stocks are consistently overpriced. b. Low-beta stocks are consistently overpriced. c. Positive alphas on stocks will quickly disappear. d. Negative alpha stocks consistently yield low returns for arbitrageurs.
5. A “random walk” occurs when:
a. Stock price changes are random but predictable. b. Stock prices respond slowly to both new and old information. c. Future price changes are uncorrelated with past price changes. d. Past information is useful in predicting future prices.
6. Two basic assumptions of technical analysis are that security prices adjust:
a. Gradually to new information, and study of the economic environment provides an indica-tion of future market movements.
b. Rapidly to new information, and study of the economic environment provides an indication of future market movements.
c. Rapidly to new information, and market prices are determined by the interaction between supply and demand.
d. Gradually to new information, and prices are determined by the interaction between supply and demand.
7. When technical analysts say a stock has good “relative strength,” they mean:
a. The ratio of the price of the stock to a market or industry index has trended upward. b. The recent trading volume in the stock has exceeded the normal trading volume. c. The total return on the stock has exceeded the total return on T-bills. d. The stock has performed well recently compared to its past performance.
8. Your investment client asks for information concerning the benefits of active portfolio manage-ment. She is particularly interested in the question of whether active managers can be expected to consistently exploit inefficiencies in the capital markets to produce above-average returns without assuming higher risk.
The semistrong form of the efficient market hypothesis asserts that all publicly available information is rapidly and correctly reflected in securities prices. This implies that investors cannot expect to derive above-average profits from purchases made after information has become public because security prices already reflect the information’s full effects.
a. Identify and explain two examples of empirical evidence that tend to support the EMH implication stated above.
b. Identify and explain two examples of empirical evidence that tend to refute the EMH impli-cation stated above.
c. Discuss reasons why an investor might choose not to index even if the markets were, in fact, semistrong-form efficient.
9. a. Briefly explain the concept of the efficient market hypothesis (EMH) and each of its three forms—weak, semistrong, and strong—and briefly discuss the degree to which existing empirical evidence supports each of the three forms of the EMH.
b. Briefly discuss the implications of the efficient market hypothesis for investment policy as it applies to:
i. Technical analysis in the form of charting. ii. Fundamental analysis.
c. Briefly explain the roles or responsibilities of portfolio managers in an efficient market environment.
10. Growth and value can be defined in several ways. “Growth” usually conveys the idea of a portfolio emphasizing or including only issues believed to possess above-average future rates of per-share earnings growth. Low current yield, high price-to-book ratios, and high price-to- earnings ratios are typical characteristics of such portfolios. “Value” usually conveys the idea of
bod30700_ch11_343-380.indd 378bod30700_ch11_343-380.indd 378 8/16/10 4:46 PM8/16/10 4:46 PM

Confirming Pages
Vis
it u
s at
ww
w.m
hh
e.co
m/b
km
C H A P T E R 1 1 The Efficient Market Hypothesis 379
portfolios emphasizing or including only issues currently showing low price-to-book ratios, low price-to-earnings ratios, above-average levels of dividend yield, and market prices believed to be below the issues’ intrinsic values.
a. Identify and provide reasons why, over an extended period of time, value-stock investing might outperform growth-stock investing.
b. Explain why the outcome suggested in ( a ) should not be possible in a market widely regarded as being highly efficient.
Earnings Surprises Several Web sites list information on earnings surprises. Much of the information sup-plied is from Zacks.com . Each day the largest positive and negative surprises are listed. Go to www.zacks.com/research/earnings/today_eps.php and identify the top positive and the top negative earnings surprises for the day. The table will list the time and date of the announcement. Do you notice any difference between the times of day positive announcements tend to be made versus negative announcements?
Identify the tickers for the top three positive surprises. Once you have identified the top surprises, go to finance.yahoo.com. Enter the ticker symbols and obtain quotes for these securities. Examine the 5-day charts for each of the companies. Is the information incorporated into price quickly? Is there any evidence of prior knowledge or anticipation of the disclosure in advance of the trading?
Choose one of the stocks listed and click on its symbol to follow the link for more infor-mation. Click on the link for Interactive Chart that appears under the graph. You can move the cursor over various parts of the graph to investigate what happened to the price and trading volume of the stock on each trading day. Do you notice any patterns?
E-INVEST-MENTS EXERCISES
SOLUTIONS TO CONCEPT CHECKS 1. a. A high-level manager might well have private information about the firm. Her ability to
trade profitably on that information is not surprising. This ability does not violate weak-form efficiency: The abnormal profits are not derived from an analysis of past price and trading data. If they were, this would indicate that there is valuable information that can be gleaned from such analysis. But this ability does violate strong-form efficiency. Apparently, there is some private information that is not already reflected in stock prices.
b. The information sets that pertain to the weak, semistrong, and strong form of the EMH can be described by the following illustration:
The weak-form information set includes only the history of prices and volumes. The semistrong-form set includes the weak form set plus all publicly available information. In turn, the strong-form set includes the semistrong set plus insiders’ information. It is illegal
Strong-formset
Semistrong-formset
Weak-formset
bod30700_ch11_343-380.indd 379bod30700_ch11_343-380.indd 379 8/16/10 4:46 PM8/16/10 4:46 PM

Confirming Pages
Vis
it u
s at
ww
w.m
hh
e.co
m/b
km380 P A R T I I I Equilibrium in Capital Markets
to act on this incremental information (insiders’ private information). The direction of valid implication is
Strong-form EMH 1 Semistrong-form EMH 1 Weak-form EMH
The reverse direction implication is not valid. For example, stock prices may reflect all past price data (weak-form efficiency) but may not reflect relevant fundamental data (semistrong-form inefficiency).
2. The point made in the preceding discussion is that the very fact that we observe stock prices near so-called resistance levels belies the assumption that the price can be a resistance level. If a stock is observed to sell at any price, then investors must believe that a fair rate of return can be earned if the stock is purchased at that price. It is logically impossible for a stock to have a resistance level and offer a fair rate of return at prices just below the resistance level. If we accept that prices are appropriate, we must reject any presumption concerning resistance levels.
3. If everyone follows a passive strategy, sooner or later prices will fail to reflect new information. At this point there are profit opportunities for active investors who uncover mispriced securities. As they buy and sell these assets, prices again will be driven to fair levels.
4. Predictably declining CARs do violate the EMH. If one can predict such a phenomenon, a profit opportunity emerges: Sell (or short sell) the affected stocks on an event date just before their prices are predicted to fall.
5. The answer depends on your prior beliefs about market efficiency. Miller’s record through 2005 was incredibly strong. On the other hand, with so many funds in existence, it is less surprising that some fund would appear to be consistently superior after the fact. Exceptional past performance of a small number of managers is possible by chance even in an efficient market. A better test is provided in “continuation studies.” Are better performers in one period more likely to repeat that performance in later periods? Miller’s record after 2005 fails the continuation or consistency criterion.
bod30700_ch11_343-380.indd 380bod30700_ch11_343-380.indd 380 8/16/10 4:46 PM8/16/10 4:46 PM