Chapter consumer surplus. Efficiency and Fairness of ...traynham/ch06lecture.pdf · Efficiency and...
12
1 Efficiency and Fairness of Markets Chapter 6 Copyright © 2002 Addison Wesley CHAPTER CHECKLIST 1. Distinguish between value and price and define consumer surplus. 2. Distinguish between cost and price and define producer surplus. 3. Explain the conditions in which markets are efficient and inefficient. 4. Explain the main ideas about fairness and evaluate claims that competitive markets result in unfair outcomes. LECTURE TOPICS <Efficiency: A Refresher <Value, Price, and Consumer Surplus <Cost, Price, and Producer Surplus <Are Markets Efficient? <Are Markets Fair? <Marginal Benefit Marginal benefit is the benefit that a person receives from consuming one more unit of a good or service. Marginal benefit is measured as the maximum amount that a person is willing to pay for one more unit of the good or service. The marginal benefit decreases as more of the good is consumed—the principle of decreasing marginal benefit. EFFICIENCY: A REFRESHER
Transcript of Chapter consumer surplus. Efficiency and Fairness of ...traynham/ch06lecture.pdf · Efficiency and...

1
Efficiency andFairness of
Markets
Chapter
6
Copyright © 2002 Addison Wesley
CHAPTER CHECKLIST
1. Distinguish between value and price and define consumer surplus.
2. Distinguish between cost and price and define producer surplus.
3. Explain the conditions in which markets are efficient and inefficient.
4. Explain the main ideas about fairness and evaluate claims that competitive markets result in unfair outcomes.
LECTURE TOPICS
<Efficiency: A Refresher<Value, Price, and Consumer Surplus<Cost, Price, and Producer Surplus<Are Markets Efficient?<Are Markets Fair?
<Marginal Benefit
Marginal benefit is the benefit that a person receives from consuming one more unit of a good or service.
Marginal benefit is measured as the maximum amount that a person is willing to pay for one more unit of the good or service.
The marginal benefit decreases as more of the good is consumed—the principle of decreasing marginal benefit.
EFFICIENCY: A REFRESHER

2
<Marginal Cost
Marginal cost is the opportunity cost of producing one more unit of a good or service.
The marginal cost is measured as the value of the best alternative forgone to get one more unit of the good or service.
The marginal cost increases as more of the good is produced—the principle of increasing marginal cost.
EFFICIENCY: A REFRESHER
<Allocative Efficiency
The efficient quantity of a good is the quantity that makes marginal benefit from the good equal to marginal cost of producing it.
If marginal benefit exceeds marginal cost, resources use will be more efficiently if the quantity is increased.
If marginal cost exceeds marginal benefit, resource use will be more efficiently if the quantity is increased.
EFFICIENCY: A REFRESHER
Figure 6.1 shows theefficient quantity.
1. Marginal benefit exceeds marginal cost: Efficient quantity is larger.
2. Marginal cost exceeds marginal benefit: Efficient quantity is smaller.
3. Marginal benefit equals marginal cost: Quantity is efficient.
EFFICIENCY: A REFRESHER 6.1 VALUE, PRICE, CONSUMER SURPLUS
<Demand and Marginal Benefit
Buyers distinguish between value and price.• Value is what the buyer gets.• Price is what the buyer pays.
The value of one more unit of a good or service is its marginal benefit.
Marginal benefit can be measured as the maximum price that people are willing to pay for another unit of the good or service.
3
6.1 VALUE, PRICE, CONSUMER SURPLUS
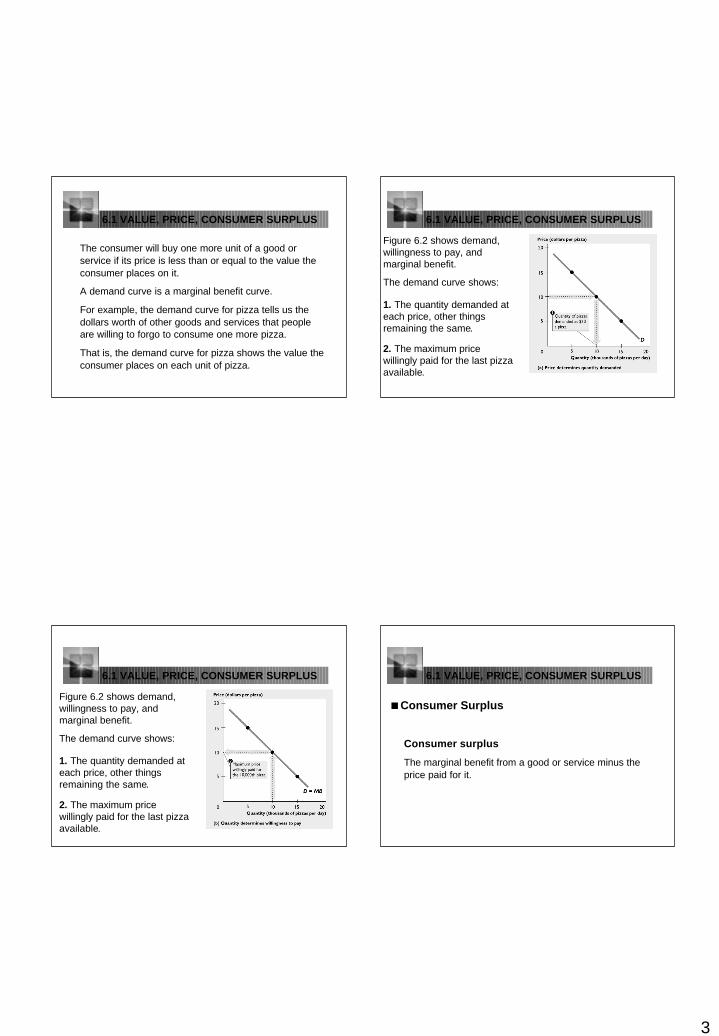
The consumer will buy one more unit of a good or service if its price is less than or equal to the value the consumer places on it.
A demand curve is a marginal benefit curve.
For example, the demand curve for pizza tells us the dollars worth of other goods and services that people are willing to forgo to consume one more pizza.
That is, the demand curve for pizza shows the value the consumer places on each unit of pizza.
6.1 VALUE, PRICE, CONSUMER SURPLUS
The demand curve shows:
2. The maximum price willingly paid for the last pizza available.
1. The quantity demanded at each price, other things remaining the same.
Figure 6.2 shows demand, willingness to pay, and marginal benefit.
6.1 VALUE, PRICE, CONSUMER SURPLUS
The demand curve shows:
2. The maximum price willingly paid for the last pizza available.
1. The quantity demanded at each price, other things remaining the same.
Figure 6.2 shows demand, willingness to pay, and marginal benefit.
6.1 VALUE, PRICE, CONSUMER SURPLUS
<Consumer Surplus
Consumer surplus
The marginal benefit from a good or service minus the price paid for it.
4
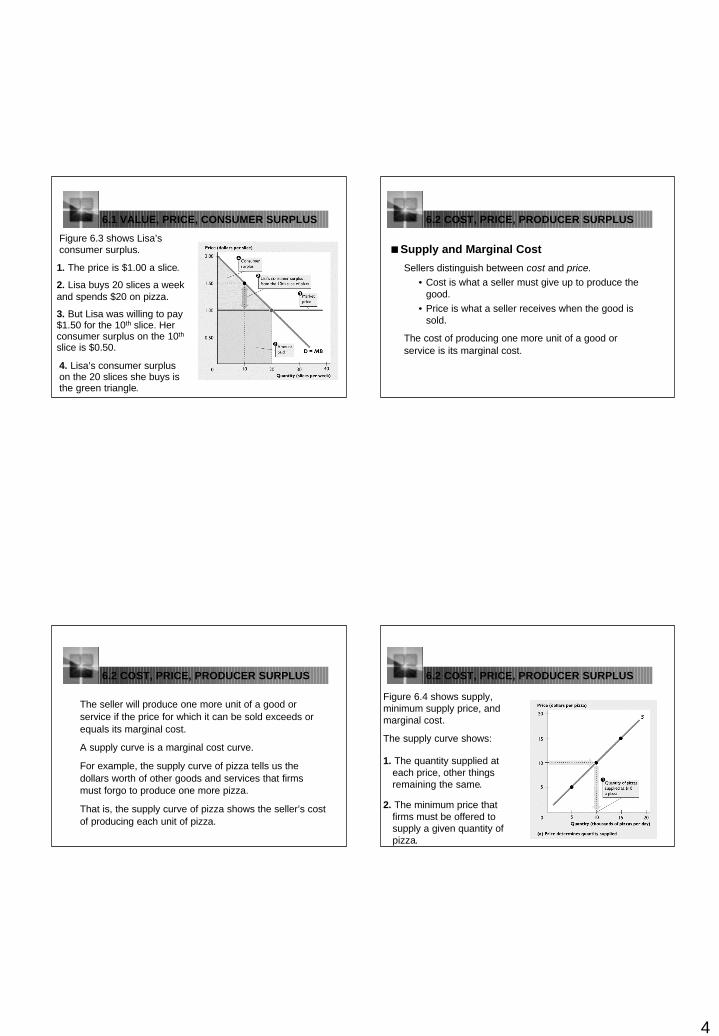
6.1 VALUE, PRICE, CONSUMER SURPLUS
1. The price is $1.00 a slice.
2. Lisa buys 20 slices a week and spends $20 on pizza.
3. But Lisa was willing to pay $1.50 for the 10th slice. Her consumer surplus on the 10th
slice is $0.50.
4. Lisa’s consumer surplus on the 20 slices she buys is the green triangle.
Figure 6.3 shows Lisa’s consumer surplus.
6.2 COST, PRICE, PRODUCER SURPLUS
<Supply and Marginal Cost
Sellers distinguish between cost and price.• Cost is what a seller must give up to produce the
good.• Price is what a seller receives when the good is
sold.
The cost of producing one more unit of a good or service is its marginal cost.
6.2 COST, PRICE, PRODUCER SURPLUS
The seller will produce one more unit of a good or service if the price for which it can be sold exceeds or equals its marginal cost.
A supply curve is a marginal cost curve.
For example, the supply curve of pizza tells us the dollars worth of other goods and services that firms must forgo to produce one more pizza.
That is, the supply curve of pizza shows the seller’s cost of producing each unit of pizza.
6.2 COST, PRICE, PRODUCER SURPLUS
The supply curve shows:
2. The minimum price that firms must be offered to supply a given quantity of pizza.
1. The quantity supplied at each price, other things remaining the same.
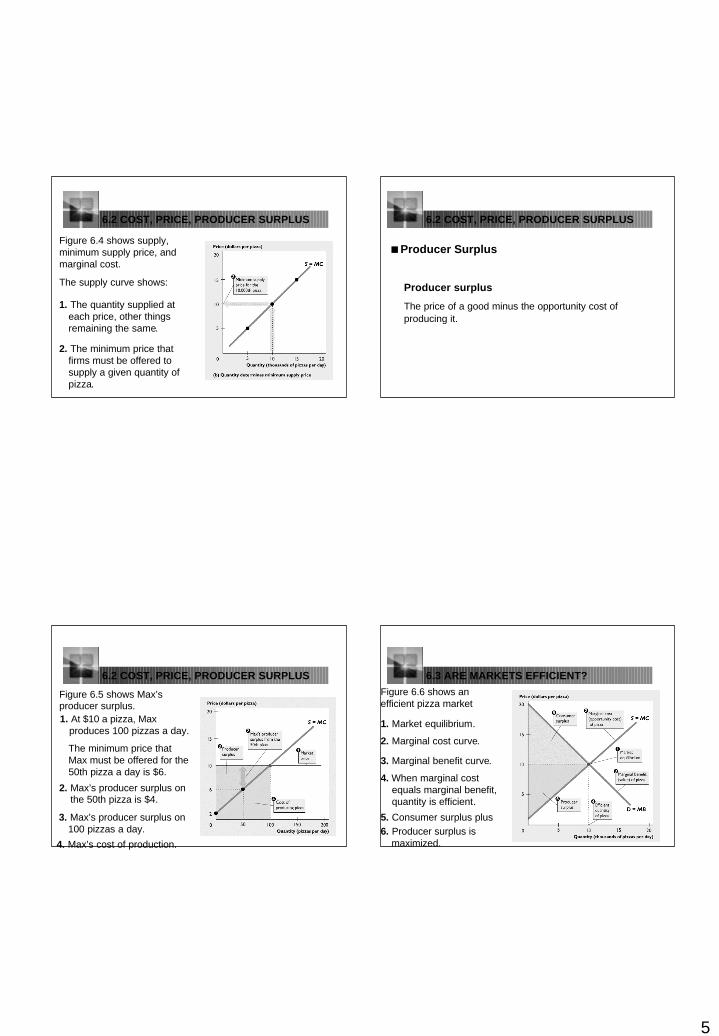
Figure 6.4 shows supply, minimum supply price, and marginal cost.
5
6.2 COST, PRICE, PRODUCER SURPLUS
The supply curve shows:
2. The minimum price that firms must be offered to supply a given quantity of pizza.
1. The quantity supplied at each price, other things remaining the same.
Figure 6.4 shows supply, minimum supply price, and marginal cost.
6.2 COST, PRICE, PRODUCER SURPLUS
<Producer Surplus
Producer surplus
The price of a good minus the opportunity cost of producing it.
6.2 COST, PRICE, PRODUCER SURPLUS
1. At $10 a pizza, Max produces 100 pizzas a day.
The minimum price that Max must be offered for the 50th pizza a day is $6.
Figure 6.5 shows Max’s producer surplus.
2. Max’s producer surplus on the 50th pizza is $4.
3. Max’s producer surplus on 100 pizzas a day.
4. Max’s cost of production.
6.3 ARE MARKETS EFFICIENT?
5. Consumer surplus plus6. Producer surplus is
maximized.
3. Marginal benefit curve.
4. When marginal cost equals marginal benefit, quantity is efficient.
2. Marginal cost curve.
Figure 6.6 shows an efficient pizza market
1. Market equilibrium.
6
6.3 ARE MARKETS EFFICIENT?
<Efficiency of Competitive EquilibriumAt the market equilibrium, resources are used efficiently.
Equilibrium quantity is the quantity that people value most highly.
To produce more of one good, some of another good that is valued more highly must be given up.
To produce less of one good, more of another good that is not valued as highly as the one forgone will be produced.
6.3 ARE MARKETS EFFICIENT?
In a competitive market:• The demand curve shows buyers’ marginal benefit. • The supply curve shows the sellers’ marginal cost.
So at the equilibrium in a competitive market, marginal benefit equals marginal cost.
Resources are used efficiently.
So the competitive market is efficient.
6.3 ARE MARKETS EFFICIENT?
<The Invisible Hand
Adam Smith in the Wealth of Nations (1776) suggested that competitive markets send resources to the uses in which they have the highest value.
Smith believed that each participant in a competitive market is “led by an invisible hand to promote an end which was no part of his intention.”
6.3 ARE MARKETS EFFICIENT?
<Obstacles to Efficiency
Markets generally do a good job of sending resources to where they are most highly valued.
But markets do not always produce the efficient quantities.
Obstacles to achieving an efficient use of resources are:• Externalities• Public goods• Monopoly

7
6.3 ARE MARKETS EFFICIENT?
Externalities
Costs or benefits that arises from a production activity that fall on someone other than the producer, or
Costs or benefits that arise from a consumption activity that falls on someone other than the consumer.
Externalities create • External costs• External benefits
6.3 ARE MARKETS EFFICIENT?
Public Goods
Good or services that are consumed simultaneously by everyone, even if they don’t pay for it.
Examples: National defense and law enforcement.
6.3 ARE MARKETS EFFICIENT?
Public Goods
Good or services that are consumed simultaneously by everyone, such as national defense and law enforcement.
Competitive markets produce less of a public good than the efficient quantity because of a free-rider problem
Free-rider problem is the fact that it is in each person’s interest to avoid paying for her or his share of a public good.
6.3 ARE MARKETS EFFICIENT?
Monopoly
A monopoly is a firm that has sole control of a market, such as the supplier of the town’s water supply.
The monopoly increases its profit by producing less than the competitive market would produce and charging a higher price for it.
A monopoly produces less than the efficient quantity.
8
6.3 ARE MARKETS EFFICIENT?
Governments influence markets in a variety of ways, and some of these can create inefficiency. They are:
• Price ceilings and price floors• Taxes, subsidies, and quotas
6.3 ARE MARKETS EFFICIENT?
Price Ceilings and Price Floors
Price ceiling
A regulation that makes it illegal to charge a price higher than a specified level. An example is a rent ceiling on apartment.
Price floor
A regulation that makes it illegal to pay a lower price than a specified level. An example is the minimum wage.
6.3 ARE MARKETS EFFICIENT?
Taxes, Subsidies, and Quotas
Taxes:• Increase the prices paid by buyers.• Lower the prices received by sellers. • Decrease the quantity produced to less than the
efficient quantity.
Governments levy high taxes are on gasoline, alcohol, and tobacco.
6.3 ARE MARKETS EFFICIENT?
Subsidies:• Payments by the government to sellers or buyers.• Decrease the prices paid by buyers.• Increase the prices received by sellers. • Increase the quantity produced to more than the
efficient quantity.
9
6.3 ARE MARKETS EFFICIENT?
Quotas:• Limit the quantity that a firm is permitted to
produce.• Restrict output to less than the efficient quantity. • For example: U.S. sugar growers receive
subsidies.
All these impediments to efficiency result in two possible outcomes:
• Underproduction• Overproduction.
6.3 ARE MARKETS EFFICIENT?
Underproduction
When a firm cuts production to less than the efficient quantity, a deadweight loss is created.
Deadweight loss
The decrease in consumer surplus and producer surplus that results from an inefficient level of production.
The deadweight loss is borne by the entire society. It is a social loss.
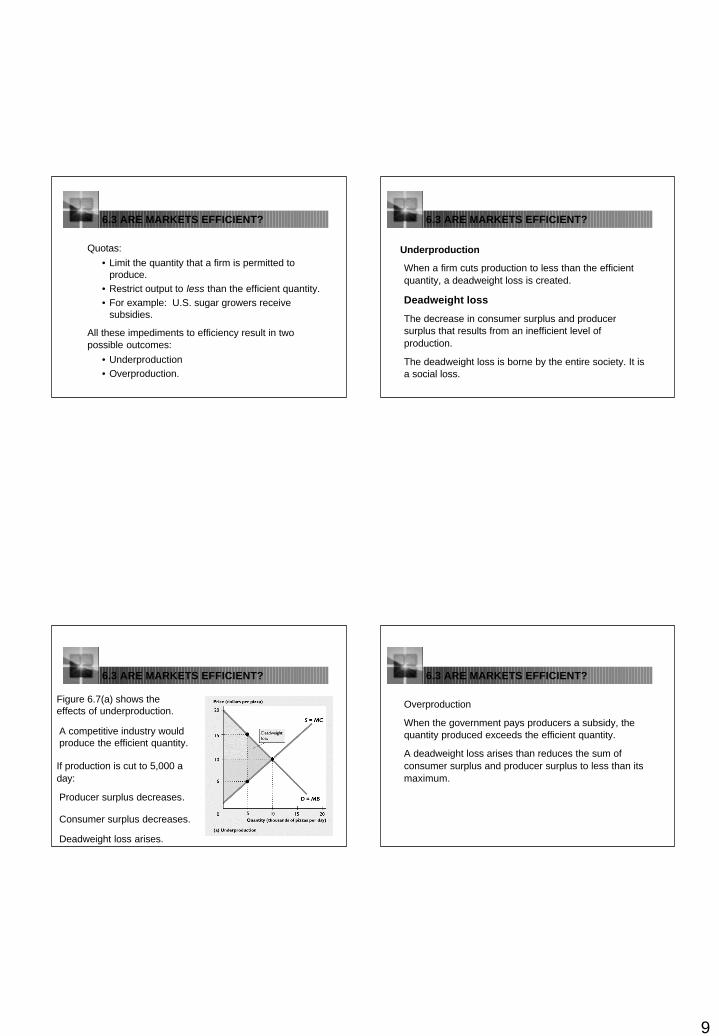
If production is cut to 5,000 a day:
Figure 6.7(a) shows the effects of underproduction.
A competitive industry would produce the efficient quantity.
Producer surplus decreases.
Consumer surplus decreases.
Deadweight loss arises.
6.3 ARE MARKETS EFFICIENT? 6.3 ARE MARKETS EFFICIENT?
Overproduction
When the government pays producers a subsidy, the quantity produced exceeds the efficient quantity.
A deadweight loss arises than reduces the sum of consumer surplus and producer surplus to less than its maximum.
10
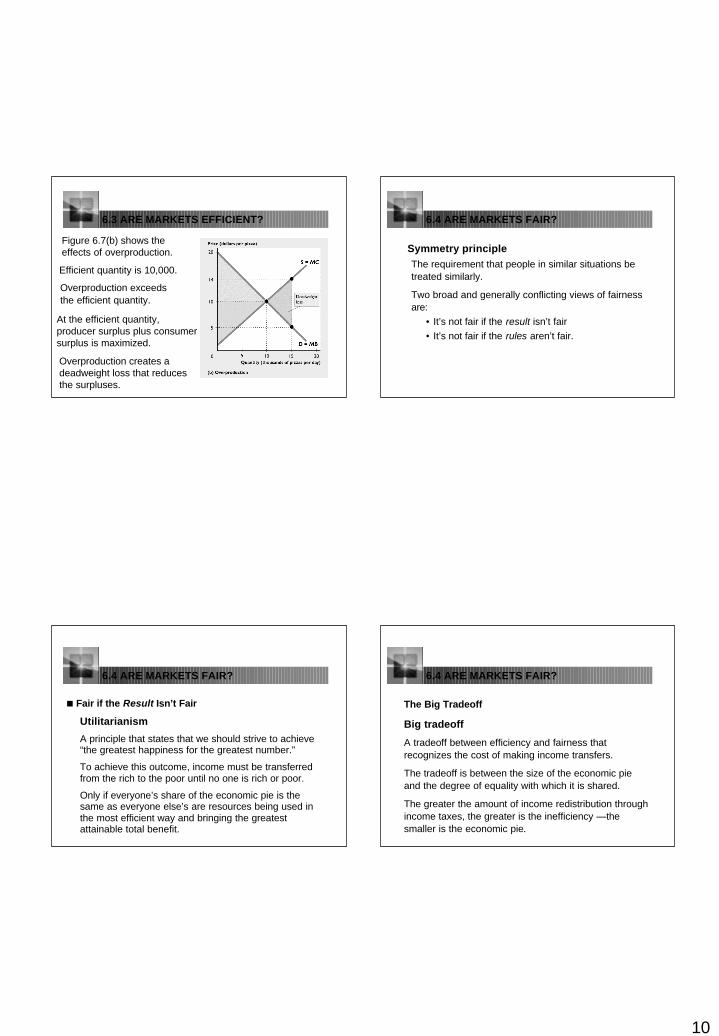
6.3 ARE MARKETS EFFICIENT?
Overproduction exceeds the efficient quantity.
At the efficient quantity, producer surplus plus consumer surplus is maximized.
Figure 6.7(b) shows the effects of overproduction.
Efficient quantity is 10,000.
Overproduction creates a deadweight loss that reduces the surpluses.
6.4 ARE MARKETS FAIR?
Symmetry principleThe requirement that people in similar situations be treated similarly.
Two broad and generally conflicting views of fairness are:
• It’s not fair if the result isn’t fair• It’s not fair if the rules aren’t fair.
6.4 ARE MARKETS FAIR?
<Fair if the Result Isn’t Fair
Utilitarianism
A principle that states that we should strive to achieve “the greatest happiness for the greatest number.”
To achieve this outcome, income must be transferred from the rich to the poor until no one is rich or poor.
Only if everyone’s share of the economic pie is the same as everyone else’s are resources being used in the most efficient way and bringing the greatest attainable total benefit.
6.4 ARE MARKETS FAIR?
The Big Tradeoff
Big tradeoff
A tradeoff between efficiency and fairness that recognizes the cost of making income transfers.
The tradeoff is between the size of the economic pie and the degree of equality with which it is shared.
The greater the amount of income redistribution through income taxes, the greater is the inefficiency —the smaller is the economic pie.
11
6.4 ARE MARKETS FAIR?
Make the Poorest as Well Off as Possible
Harvard philosopher, John Rawls, proposed a modified version of utilitarianism in A Theory of Justice (1971).
Taking all the costs of income transfers into account, the fair distribution of the economic pie is the one that makes the poorest person as well off as possible.
The “fair results” ideas require a change in the results after the game is over. Some say that this in itself is unfair.
6.4 ARE MARKETS FAIR?
<It’s Not Fair if the Rules Aren’t Fair
This idea translates into “equality of opportunity.”
Harvard philosopher, Robert Nozick, in Anarchy, State, and Utopia, (1974) argues that the rules must be fair and must respect two principles:
• The state must enforce laws that establish and protect private property.
• Private property may be transferred from one person to another only by voluntary exchange.
6.4 ARE MARKETS FAIR?
A Price Hike in a Natural Disaster
Shop Offers Water for $5
He owns the water. It is not fair that he should be compelled to help.
Government Buys Water for $8
Government offers the water for sale for $1 a bottle, its “normal” price.
The government must use some mechanism to ration the available quantity – a lottery.
6.4 ARE MARKETS FAIR?
The main difference between the government scheme and Chip’s private charitable contributions lies in the fact that to buy the water for $8 and sell it for $1, the government must tax someone $7 for each bottle sold.
Whether this arrangement is fair depends on whether the taxes are fair.
12
The End
Chapter
6
Copyright © 2002 Addison Wesley