CHAPTER 9 Surface Plasmon Fluorescence Techniques for...
38
CHAPTER 9 Surface Plasmon Fluorescence Techniques for Bioaffinity Studies WOLFGANG KNOLL, AMAL KASRY, JING LIU, THOMAS NEUMANN, 1 LIFANG NIU, HYEYOUNG PARK, 2 HARALD PAULSEN, 3 RUDOLF ROBELEK, DANFENG YAO AND FANG YU 4 Max Planck Institute for Polymer Research, Ackermannweg 10, D-55128 Mainz, Germany 9.1 Introduction Among the various sensing principles proposed for bioaffinity studies, optical evanescent wave techniques have gained the lead in popularity. Next to evanescent ellipsometry [1] and the various optical waveguide platforms [2,3], surface plasmon resonance (SPR) spectroscopy [4–6], in particular, has found widespread applications and has demonstrated its potential for the sensitive detection of bioanalytes in numerous examples [7–9]. Since its introduction as a method for bioaffinity studies in 1983 by Liedberg et al. [10] and since the presentation of the first commercial instrument by Biacore in 1990 [11], the number of papers published has grown exponentially to currently more than 1500 contributions each year (Figure 9.1). This success story is largely based on the fact that SPR represents a label-free detection principle – the mere presence of the bound analyte slightly changes the optical architecture at the sensor surface which is probed by the surface plasmon mode propagating along this 1 Present address: Graffinity, Heidelberg, Germany. 2 Present address: Samsung, Seoul, Korea. 3 Johannes Gutenberg University of Mainz, FB Biology, Gresemundweg 2, D-55099 Mainz, Germany. 4 Present address: Stanford University, Stanford, CA, USA. 275
Transcript of CHAPTER 9 Surface Plasmon Fluorescence Techniques for...
CHAPTER 9
Surface Plasmon FluorescenceTechniques for BioaffinityStudies
WOLFGANG KNOLL, AMAL KASRY, JING LIU,THOMAS NEUMANN,1 LIFANG NIU, HYEYOUNGPARK,2 HARALD PAULSEN,3 RUDOLF ROBELEK,DANFENG YAO AND FANG YU4
Max Planck Institute for Polymer Research, Ackermannweg 10, D-55128Mainz, Germany
9.1 Introduction
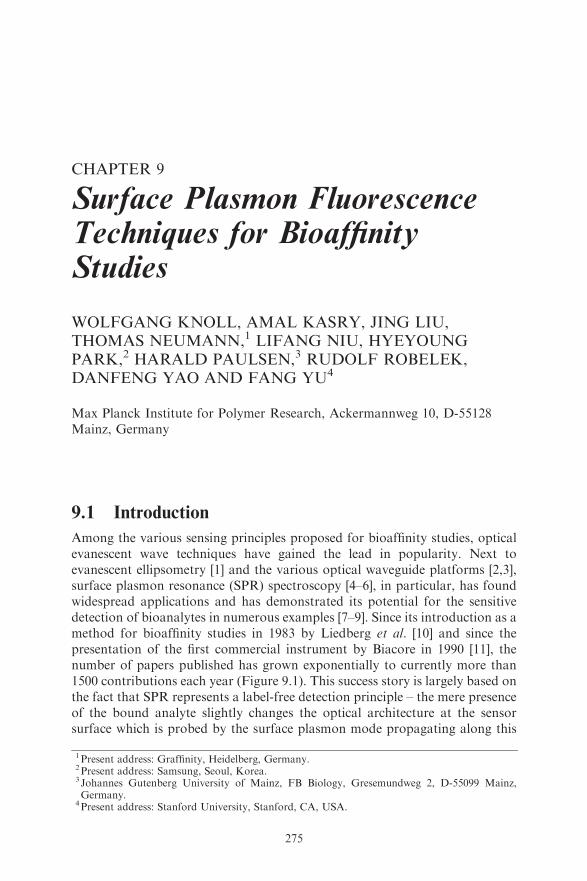
Among the various sensing principles proposed for bioaffinity studies, opticalevanescent wave techniques have gained the lead in popularity. Next toevanescent ellipsometry [1] and the various optical waveguide platforms [2,3],surface plasmon resonance (SPR) spectroscopy [4–6], in particular, has foundwidespread applications and has demonstrated its potential for the sensitivedetection of bioanalytes in numerous examples [7–9]. Since its introduction as amethod for bioaffinity studies in 1983 by Liedberg et al. [10] and since thepresentation of the first commercial instrument by Biacore in 1990 [11], thenumber of papers published has grown exponentially to currently more than1500 contributions each year (Figure 9.1). This success story is largely based onthe fact that SPR represents a label-free detection principle – the mere presenceof the bound analyte slightly changes the optical architecture at the sensorsurface which is probed by the surface plasmon mode propagating along this
1Present address: Graffinity, Heidelberg, Germany.2Present address: Samsung, Seoul, Korea.3 Johannes Gutenberg University of Mainz, FB Biology, Gresemundweg 2, D-55099 Mainz,Germany.
4Present address: Stanford University, Stanford, CA, USA.
275
metal/dielectric interface. Moreover, these SPR-based detection principles offervery attractive sensitivities for in situ and real-time monitoring of bio-analytes.Another reason for the rapid growth of SPR biosensing applications is
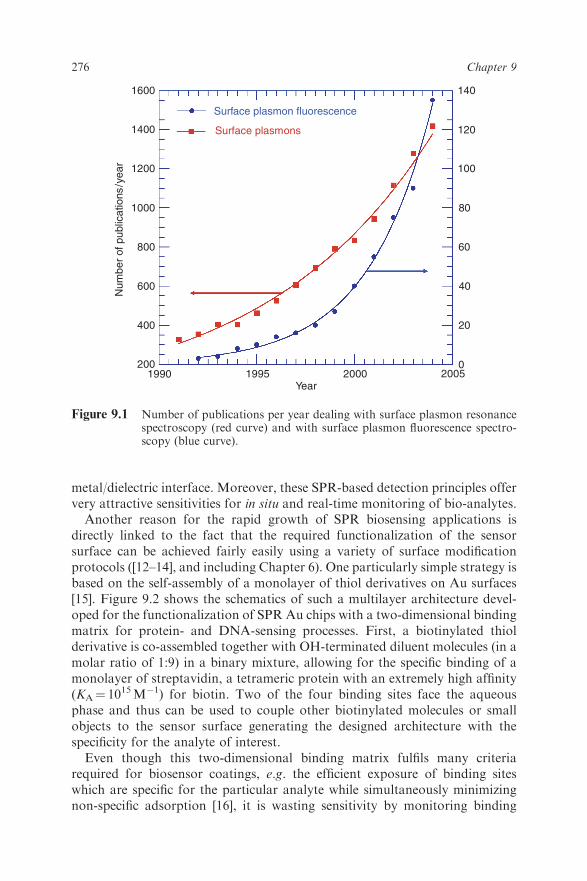
directly linked to the fact that the required functionalization of the sensorsurface can be achieved fairly easily using a variety of surface modificationprotocols ([12–14], and including Chapter 6). One particularly simple strategy isbased on the self-assembly of a monolayer of thiol derivatives on Au surfaces[15]. Figure 9.2 shows the schematics of such a multilayer architecture devel-oped for the functionalization of SPR Au chips with a two-dimensional bindingmatrix for protein- and DNA-sensing processes. First, a biotinylated thiolderivative is co-assembled together with OH-terminated diluent molecules (in amolar ratio of 1:9) in a binary mixture, allowing for the specific binding of amonolayer of streptavidin, a tetrameric protein with an extremely high affinity(KA¼ 1015M�1) for biotin. Two of the four binding sites face the aqueousphase and thus can be used to couple other biotinylated molecules or smallobjects to the sensor surface generating the designed architecture with thespecificity for the analyte of interest.Even though this two-dimensional binding matrix fulfils many criteria
required for biosensor coatings, e.g. the efficient exposure of binding siteswhich are specific for the particular analyte while simultaneously minimizingnon-specific adsorption [16], it is wasting sensitivity by monitoring binding
200
400
600
800
1000
1200
1400
1600
0
20
40
60
80
100
120
140
1990 1995 2000 2005Year
Num
ber
of p
ublic
atio
ns/y
ear
Surface plasmons
Surface plasmon fluorescence
Figure 9.1 Number of publications per year dealing with surface plasmon resonancespectroscopy (red curve) and with surface plasmon fluorescence spectro-scopy (blue curve).
276 Chapter 9
events only within a thin two-dimensional slice of the analyte solution that isprobed by the evanescent surface plasmon wave reaching some 150 nm out intothe buffer [6]. Hence it was a natural next step to use a quasi-three-dimensionalbinding matrix based on a polymer brush that is partially coupled to thesubstrate and reaches out into the analyte solution some 100 nm in the case ofBiacore’s dextran brush, matching the extent of the evanescent surface plasmonfield. This way, binding events away from the interface, but still within theevanescent tail of the surface plasmon mode probing the brush, also contributeto the sensor signal (although with an exponentially decreasing weightingfactor). Roughly 3–5 times more protein compared with the 2D matrix boundper unit area of the sensor surface is monitored, thus enhancing the sensitivityof the technique considerably.However, if very small analyte molecules with a low molecular mass are to be
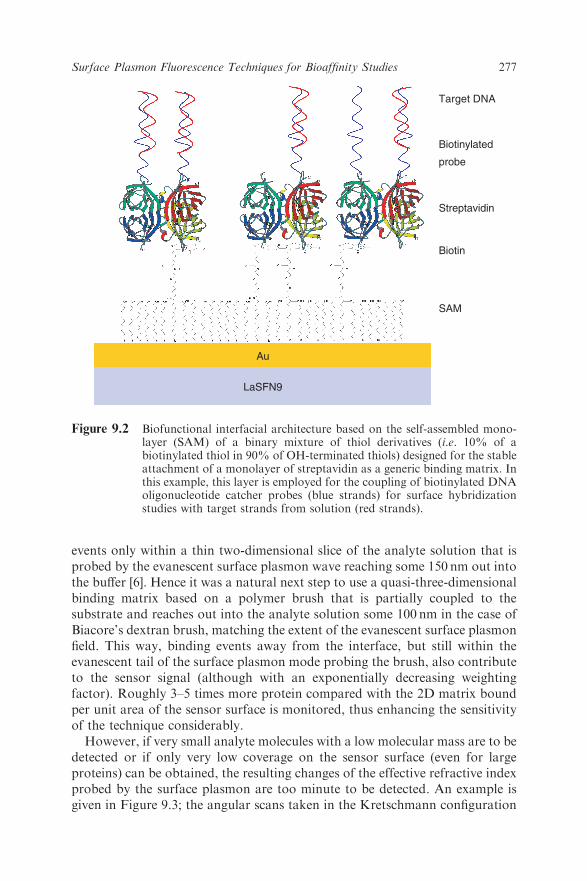
detected or if only very low coverage on the sensor surface (even for largeproteins) can be obtained, the resulting changes of the effective refractive indexprobed by the surface plasmon are too minute to be detected. An example isgiven in Figure 9.3; the angular scans taken in the Kretschmann configuration
LaSFN9
Au
SAM
Biotin
Streptavidin
Biotinylated
probe
Target DNA
Figure 9.2 Biofunctional interfacial architecture based on the self-assembled mono-layer (SAM) of a binary mixture of thiol derivatives (i.e. 10% of abiotinylated thiol in 90% of OH-terminated thiols) designed for the stableattachment of a monolayer of streptavidin as a generic binding matrix. Inthis example, this layer is employed for the coupling of biotinylated DNAoligonucleotide catcher probes (blue strands) for surface hybridizationstudies with target strands from solution (red strands).
277Surface Plasmon Fluorescence Techniques for Bioaffinity Studies
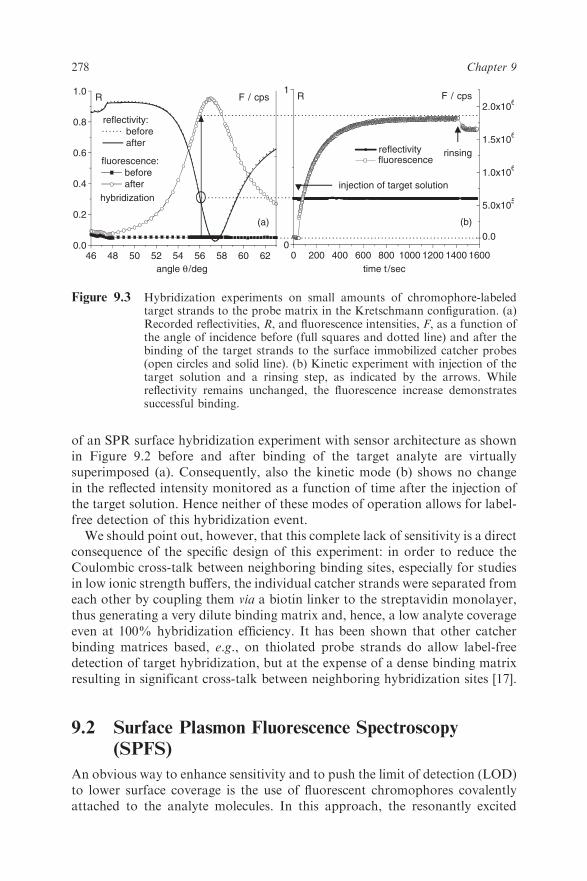
of an SPR surface hybridization experiment with sensor architecture as shownin Figure 9.2 before and after binding of the target analyte are virtuallysuperimposed (a). Consequently, also the kinetic mode (b) shows no changein the reflected intensity monitored as a function of time after the injection ofthe target solution. Hence neither of these modes of operation allows for label-free detection of this hybridization event.We should point out, however, that this complete lack of sensitivity is a direct
consequence of the specific design of this experiment: in order to reduce theCoulombic cross-talk between neighboring binding sites, especially for studiesin low ionic strength buffers, the individual catcher strands were separated fromeach other by coupling them via a biotin linker to the streptavidin monolayer,thus generating a very dilute binding matrix and, hence, a low analyte coverageeven at 100% hybridization efficiency. It has been shown that other catcherbinding matrices based, e.g., on thiolated probe strands do allow label-freedetection of target hybridization, but at the expense of a dense binding matrixresulting in significant cross-talk between neighboring hybridization sites [17].
9.2 Surface Plasmon Fluorescence Spectroscopy
(SPFS)
An obvious way to enhance sensitivity and to push the limit of detection (LOD)to lower surface coverage is the use of fluorescent chromophores covalentlyattached to the analyte molecules. In this approach, the resonantly excited
46 48 50 52 54 56 58 60 620.0
0.2
0.4
0.6
0.8
1.0R F / cps
reflectivity: before after
angle θ/deg
hybridization
fluorescence: before after
0 200 400 600 800 1000 1200 1400 16000
1R
time t /sec
reflectivity
0.0
5.0x10⁵
1.0x10⁶
1.5x10⁶
2.0x10⁶F / cps
fluorescence
(a) (b)
rinsing
injection of target solution
Figure 9.3 Hybridization experiments on small amounts of chromophore-labeledtarget strands to the probe matrix in the Kretschmann configuration. (a)Recorded reflectivities, R, and fluorescence intensities, F, as a function ofthe angle of incidence before (full squares and dotted line) and after thebinding of the target strands to the surface immobilized catcher probes(open circles and solid line). (b) Kinetic experiment with injection of thetarget solution and a rinsing step, as indicated by the arrows. Whilereflectivity remains unchanged, the fluorescence increase demonstratessuccessful binding.
278 Chapter 9
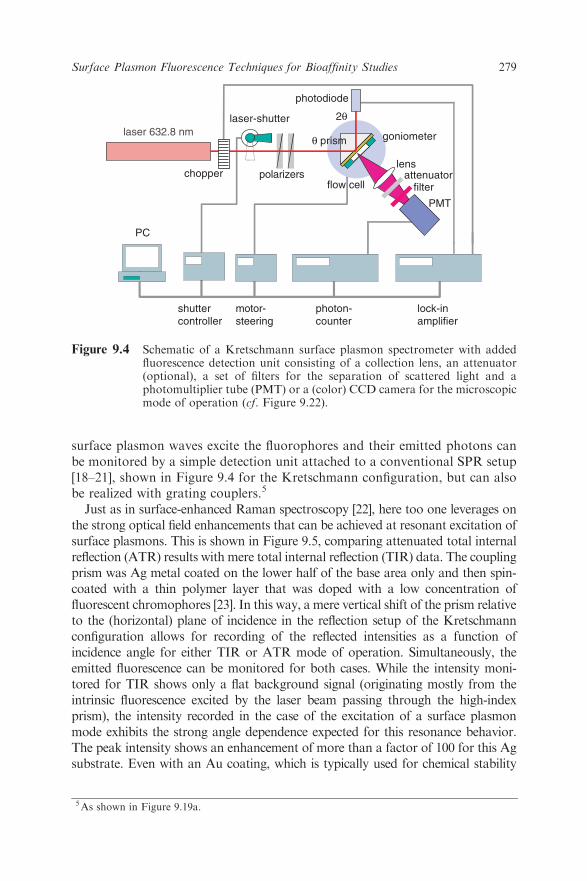
surface plasmon waves excite the fluorophores and their emitted photons canbe monitored by a simple detection unit attached to a conventional SPR setup[18–21], shown in Figure 9.4 for the Kretschmann configuration, but can alsobe realized with grating couplers.5
Just as in surface-enhanced Raman spectroscopy [22], here too one leverages onthe strong optical field enhancements that can be achieved at resonant excitation ofsurface plasmons. This is shown in Figure 9.5, comparing attenuated total internalreflection (ATR) results with mere total internal reflection (TIR) data. The couplingprism was Ag metal coated on the lower half of the base area only and then spin-coated with a thin polymer layer that was doped with a low concentration offluorescent chromophores [23]. In this way, a mere vertical shift of the prism relativeto the (horizontal) plane of incidence in the reflection setup of the Kretschmannconfiguration allows for recording of the reflected intensities as a function ofincidence angle for either TIR or ATR mode of operation. Simultaneously, theemitted fluorescence can be monitored for both cases. While the intensity moni-tored for TIR shows only a flat background signal (originating mostly from theintrinsic fluorescence excited by the laser beam passing through the high-indexprism), the intensity recorded in the case of the excitation of a surface plasmonmode exhibits the strong angle dependence expected for this resonance behavior.The peak intensity shows an enhancement of more than a factor of 100 for this Agsubstrate. Even with an Au coating, which is typically used for chemical stability
laser 632.8 nm
polarizers
photodiode
flow cell filter
2θ
goniometer
lock-inamplifier
photon-counter
motor-steering
PC
chopper
laser-shutter
rlens
shuttercontroller
θ prism
attenuator
PMT
Figure 9.4 Schematic of a Kretschmann surface plasmon spectrometer with addedfluorescence detection unit consisting of a collection lens, an attenuator(optional), a set of filters for the separation of scattered light and aphotomultiplier tube (PMT) or a (color) CCD camera for the microscopicmode of operation (cf. Figure 9.22).
5As shown in Figure 9.19a.
279Surface Plasmon Fluorescence Techniques for Bioaffinity Studies

reasons when using aqueous buffer solutions in biosensor studies, the enhancementcan account for more than an order of magnitude.The slight angular displacement between the minimum angle in the reflec-
tivity scan and the fluorescence intensity peak position is a consequence of theresonant excitation of the surface plasmon waves interfering with the directlyreflected laser beam: the re-radiated and out-coupled plasmon light destruc-tively interferes with the plane wave of the laser reflected at the prism/metalinterface provided their relative phase shift corresponds to p or 1801. For thesurface plasmon, being a damped oscillator, this phase shift relative to thereflected laser is reached just slightly above the angle for maximum excitationstrength at resonance. Strictly, the fluorescence gives the correct angularposition of the maximum field intensity upon excitation of the surface plasmon.The intensity profile normal to the metal/dielectric interface at the correct
resonance angle decays exponentially in both directions into the metal as well asinto the dielectric phase. This is shown in Figure 9.6a calculated for a multilayerconfiguration consisting of a high-index glass prism (LaSFN9, n¼ 1.85 atl¼ 633nm)/50nm Au/water). The intensity distribution normal to the interface
20 25 30 35 40
0.0
0.2
0.4
0.6
0.8
1.0
θc
reflectivity R
angle θ/deg
SPS Ag
TIR Glass
0
2x10⁵
4x10⁵
6x10⁵
8x10⁵
1x10⁶
fluore
scence
/cps
SPFS Ag
TIRF Glass
Figure 9.5 Comparison of the reflectivities in the (attenuated) total reflection mode ofexcitation of a surface plasmon wave in an angular scan at a Ag/(thin)polymer film/air interface (filled circles) with just total internal reflection ata glass/polymer/air interface (open circles). Given are also the fluorescenceintensities recorded as a function of time for the two modes of operation[dashed line, total internal reflection fluorescence (TIRF); solid line, sur-face plasmon fluorescence spectroscopy (SPFS)]. The polymer film wasdoped with Cy5, a commonly used fluorophore that can be excited atl¼ 633 nm.
280 Chapter 9
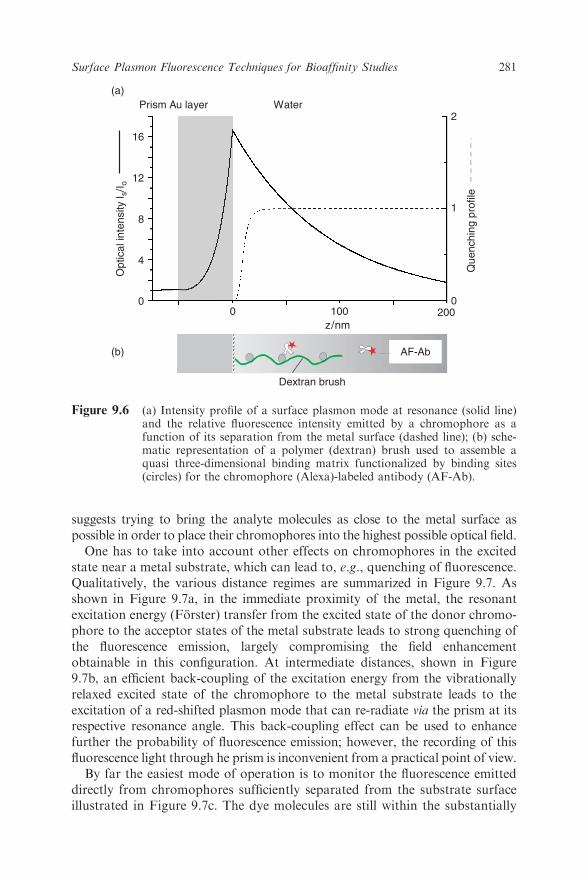
suggests trying to bring the analyte molecules as close to the metal surface aspossible in order to place their chromophores into the highest possible optical field.One has to take into account other effects on chromophores in the excited
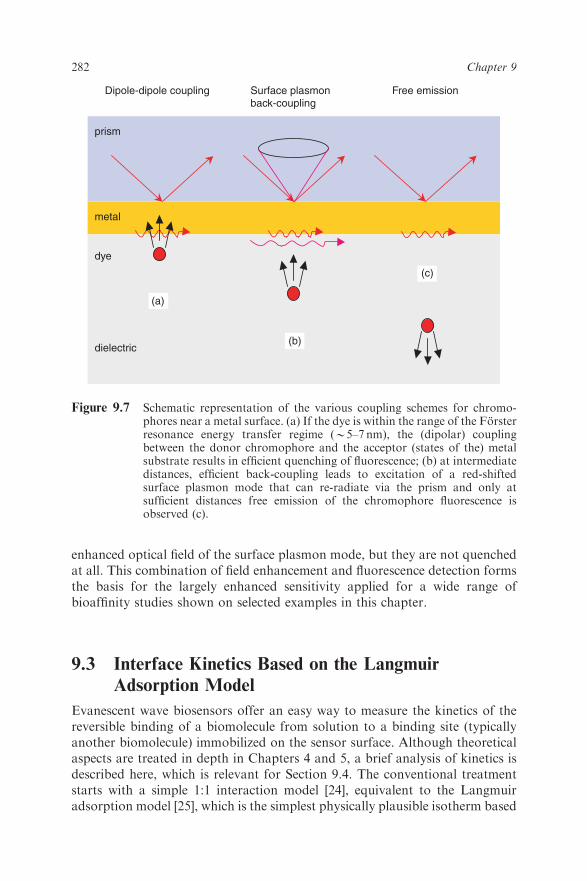
state near a metal substrate, which can lead to, e.g., quenching of fluorescence.Qualitatively, the various distance regimes are summarized in Figure 9.7. Asshown in Figure 9.7a, in the immediate proximity of the metal, the resonantexcitation energy (Forster) transfer from the excited state of the donor chromo-phore to the acceptor states of the metal substrate leads to strong quenching ofthe fluorescence emission, largely compromising the field enhancementobtainable in this configuration. At intermediate distances, shown in Figure9.7b, an efficient back-coupling of the excitation energy from the vibrationallyrelaxed excited state of the chromophore to the metal substrate leads to theexcitation of a red-shifted plasmon mode that can re-radiate via the prism at itsrespective resonance angle. This back-coupling effect can be used to enhancefurther the probability of fluorescence emission; however, the recording of thisfluorescence light through he prism is inconvenient from a practical point of view.By far the easiest mode of operation is to monitor the fluorescence emitted
directly from chromophores sufficiently separated from the substrate surfaceillustrated in Figure 9.7c. The dye molecules are still within the substantially
Prism Au layer Water
Dextran brush
Opt
ical
inte
nsity
I s/I
o
00
0
1
2
100 200
4
8
12
16
(a)
(b)
Que
nchi
ng p
rofil
e
AF-Ab
z/nm
Figure 9.6 (a) Intensity profile of a surface plasmon mode at resonance (solid line)and the relative fluorescence intensity emitted by a chromophore as afunction of its separation from the metal surface (dashed line); (b) sche-matic representation of a polymer (dextran) brush used to assemble aquasi three-dimensional binding matrix functionalized by binding sites(circles) for the chromophore (Alexa)-labeled antibody (AF-Ab).
281Surface Plasmon Fluorescence Techniques for Bioaffinity Studies
enhanced optical field of the surface plasmon mode, but they are not quenchedat all. This combination of field enhancement and fluorescence detection formsthe basis for the largely enhanced sensitivity applied for a wide range ofbioaffinity studies shown on selected examples in this chapter.
9.3 Interface Kinetics Based on the Langmuir
Adsorption Model
Evanescent wave biosensors offer an easy way to measure the kinetics of thereversible binding of a biomolecule from solution to a binding site (typicallyanother biomolecule) immobilized on the sensor surface. Although theoreticalaspects are treated in depth in Chapters 4 and 5, a brief analysis of kinetics isdescribed here, which is relevant for Section 9.4. The conventional treatmentstarts with a simple 1:1 interaction model [24], equivalent to the Langmuiradsorption model [25], which is the simplest physically plausible isotherm based
Dipole-dipole coupling Surface plasmonback-coupling
Free emission
prism
metal
dye
dielectric
(a)
(b)
(c)
Figure 9.7 Schematic representation of the various coupling schemes for chromo-phores near a metal surface. (a) If the dye is within the range of the Forsterresonance energy transfer regime (B5–7 nm), the (dipolar) couplingbetween the donor chromophore and the acceptor (states of the) metalsubstrate results in efficient quenching of fluorescence; (b) at intermediatedistances, efficient back-coupling leads to excitation of a red-shiftedsurface plasmon mode that can re-radiate via the prism and only atsufficient distances free emission of the chromophore fluorescence isobserved (c).
282 Chapter 9

on three assumptions:
� the adsorption cannot proceed beyond monolayer coverage;� all sites are equivalent and the surface is uniform;� the ability of a molecule to adsorb to a given site is independent of the
degree of occupation of neighboring sites.
If these conditions are met, the dynamic equilibrium is given by
Aþ B Ðkon
koffAB ð9:1Þ
assuming that A is the molecule binding from solution (analyte) and B is thespecies immobilized on the sensor surface (ligand). The forward and reversereaction rates are described by the adsorption (association) rate constant konand the desorption (dissociation) rate constant koff, respectively. The associa-tion process results in the formation of the complex [AB] and is described by
d AB½ �dt
¼ kon A½ � B½ � ð9:2Þ
and the dissociation rate of the complex [AB] is given by
� d AB½ �dt
¼ koff AB½ � ð9:3Þ
Once a dynamic equilibrium is established, the rates of both processes areequal, i.e.
kon A½ � B½ � ¼ koff AB½ � ð9:4Þ
Hence the equilibrium constants can be expressed by the rate constantsaccording to
Ka ¼AB½ �A½ � B½ � ¼
kon
koffð9:5Þ
and
Kd ¼ A½ � B½ �AB½ � ¼ koff
konð9:6Þ
where Ka and Kd are the affinity constant and the dissociation constant,respectively. This formalism is mathematically identical with that of the treat-ment of the interaction in the homogeneous phase. However, at the solid–liquidinterface the transport (diffusion and convection) of A from the bulk solutionto the interface must be taken into account (cf. Chapter 5).
283Surface Plasmon Fluorescence Techniques for Bioaffinity Studies

9.3.1 Mass Transport-controlled Kinetics
If the surface concentration of B (ligand) is very large and the mass transportrate km is small compared with the association rate constant kon, i.e.km{ kon[B], the interaction is controlled by the mass transport rate. Thenthe complex formation rate is solely dependent on the bulk concentration ofanalyte A and the binding signal increases linearly with time:
d AB½ �dt
¼ km Abulk½ � ð9:7Þ
This can be used for the concentration analysis of analyte A, since the slopeof the initial stage of the binding curve is proportional to the analyte concen-tration. Theoretically, the linear range of the dose-response curve has nolimitation at the lower concentration side. If the reaction rate is fully mass-transport limited, the sensor surface acts like an infinite sink and [Asurface]¼ 0.In this case, km for all practical situations can be described by [26]
km ¼ 0:98ðD=hÞ23ðv=bxÞ
13 ð9:8Þ
where D is the diffusion coefficient, h and b are the height and the width of theflow cell, respectively, v is the volumetric flow rate and x is the distance from theflow cell entrance.
9.3.2 Interaction-controlled Kinetics
If the mass transport rate is much larger than the association rate constant or ifthe surface concentration of the immobilized species is low, i.e. kmc kon[B],then [Asurface]¼ [Abulk] and the binding rate can be expressed as
d AB½ �dt
¼ kon A½ � B½ � � koff AB½ � ð9:9Þ
The surface concentration of the free binding site, [B], is the difference betweenthe concentration of the complex at saturation, [ABmax], and the currentcomplex concentration, [AB]:
B½ � ¼ ABmax½ � � AB½ � ð9:10Þ
Combining eqs. (9.9) and (9.10) and considering that the response R scaleslinearly with the complex concentration [AB], one obtains
dR
dt¼ konc0ðRmax � RÞ � koffR ð9:11Þ
284 Chapter 9
where c0 is the concentration of the analyte and Rmax is the saturation signal atsufficiently high analyte concentration. The solution of eq. (9.11) yields
R ¼ konc0Rmax
konc0 þ koff½1� e� konc0þkoffð Þt� ¼ R0½1� e�ðkonc0þkoff Þt� ð9:12Þ
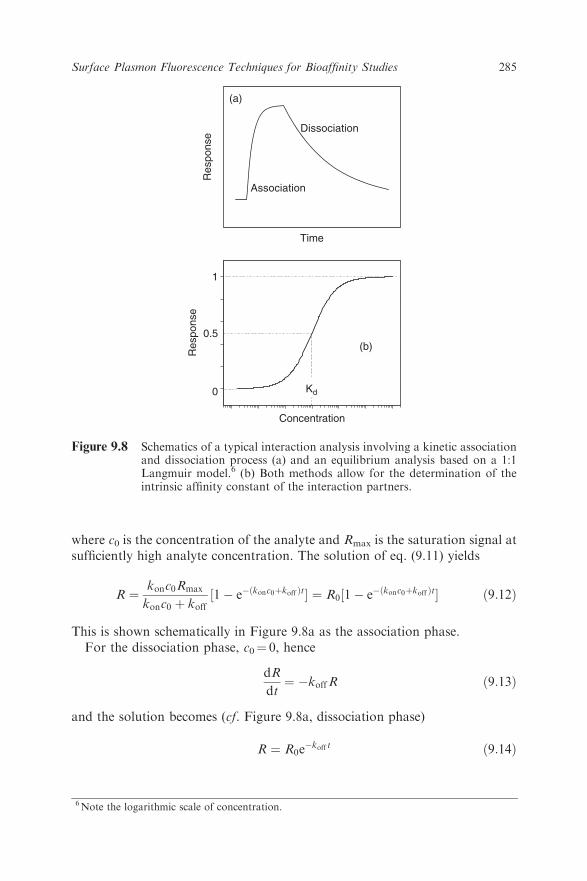
This is shown schematically in Figure 9.8a as the association phase.For the dissociation phase, c0¼ 0, hence
dR
dt¼ �koffR ð9:13Þ
and the solution becomes (cf. Figure 9.8a, dissociation phase)
R ¼ R0e�koff t ð9:14Þ
Res
pons
eR
espo
nse
0
1
0.5
Concentration
Time
Association
Dissociation
Kd
(a)
(b)
Figure 9.8 Schematics of a typical interaction analysis involving a kinetic associationand dissociation process (a) and an equilibrium analysis based on a 1:1Langmuir model.6 (b) Both methods allow for the determination of theintrinsic affinity constant of the interaction partners.
6Note the logarithmic scale of concentration.
285Surface Plasmon Fluorescence Techniques for Bioaffinity Studies

Equations (9.12) and (9.13) can be used to give kon and koff from a single setof association/dissociation experiments using non-linear curve fitting.
9.3.3 Equilibrium Analysis
Once a dynamic equilibrium has been reached, the net effect of the associationand dissociation process is zero, i.e.
dR
dt¼ konc0 Rmax � Req
� �� koffReq ¼ 0 ð9:15Þ
where Req is the equilibrium response at a given analyte concentration c0.Therefore, the equilibrium signal reflects the affinity constant Ka and dissoci-ation constant Kd of the interaction couple.This can be converted to a format which resembles the 1:1 Langmuir
isotherm:
Req ¼ c0KARmax
c0KA þ 1
¼ c0Rmax
c0 þ Kd
ð9:16Þ
The isotherm is an S-shaped curve if using logarithmic axis for the concentra-tion, as shown in Figures 9.8b and 9.14. On the application of an analyteconcentration of c0¼Kd, Req is half of the saturation response Rmax.
9.4 Applications of the Kinetic Model
Although this pseudo-first-order kinetic model has been used very successfullyin qualitative studies (such as demonstration of interactions between biomol-ecules), the determination of the kinetic rate constants of binding is oftencomplicated by the fact that most binding curves deviate from the singleexponential time course expected for a simple pseudo-first-order reaction.Apart from the experimental causes (e.g. the sample depletion, noise, drift,impurity), major concerns for the deviation are focused on mass transport/rebinding effects, multivalent interactions/avidity effects, heterogeneity in theimmobilized ligands/matrix effects and complex binding mechanisms.On improving the experimental design (e.g. by using high flow rates and low
surface capacities) and applying advanced analysis algorithms (e.g. the GlobalAnalysis [27], fitting association and dissociation phase data for a series ofconcentrations simultaneously), the contribution of most of these effects can beminimized or even corrected [28].
9.4.1 Surface Hybridization Reactions of Oligonucleotides
The first set of examples that we discuss concern hybridization studies betweensurface-attached catcher probe oligonucleotides and chromophore-labeled
286 Chapter 9

targets from solution. From among the feasible experimental schemes [29], afew typical ones are summarized in Figure 9.9. The most direct approach isgiven in (a): the sensor surface is functionalized by a single-stranded DNAoligonucleotide catcher probe with a base sequence specific for a target strandfrom solution which carries the fluorophore. Upon binding, the chromophoresare placed in the resonantly enhanced evanescent field of the surface plasmonmode and emit strong fluorescence light. The number of emitted photons isdirectly related to the number of bound target strands. This scheme will bediscussed in detail below.An alternative strategy is presented in Figure 9.9b with the corresponding
experimental results given in Figure 9.10. In this case, the probe strand at thesensor surface carries the chromophore which emits fluorescence light at a levelthat reflects the compromise between the evanescent character of the excitationfield and the quenching profile for energy transfer, as discussed above. Uponthe binding of the target analyte, the resulting double strand stiffens and thusstretches, thereby pushing the chromophore at the end of the probe strandfurther away from the (quenching) sensor metal surface. The result is a netincrease in the fluorescence intensity because the (slight) decrease in the opticalexcitation is by far overcompensated by the increase in emission intensity owingto the reduced quenching upon the growth in chromophore–metal distance.This principle for the recording of a hybridization reaction combines the best of
Figure 9.9 Various detection schemes for hybridization reactions between surface-attached catcher probes and oligonucleotide targets from solution: (a) thetargets carry the chromophores that emit fluorescence photons; (b) thecatchers are labeled with a fluorophore which – upon hybridization – areplaced further away from the substrate surface; (c) the probes are labeledwith donor and the targets with acceptor dyes, leading upon hybridizationto efficient energy transfer.
287Surface Plasmon Fluorescence Techniques for Bioaffinity Studies
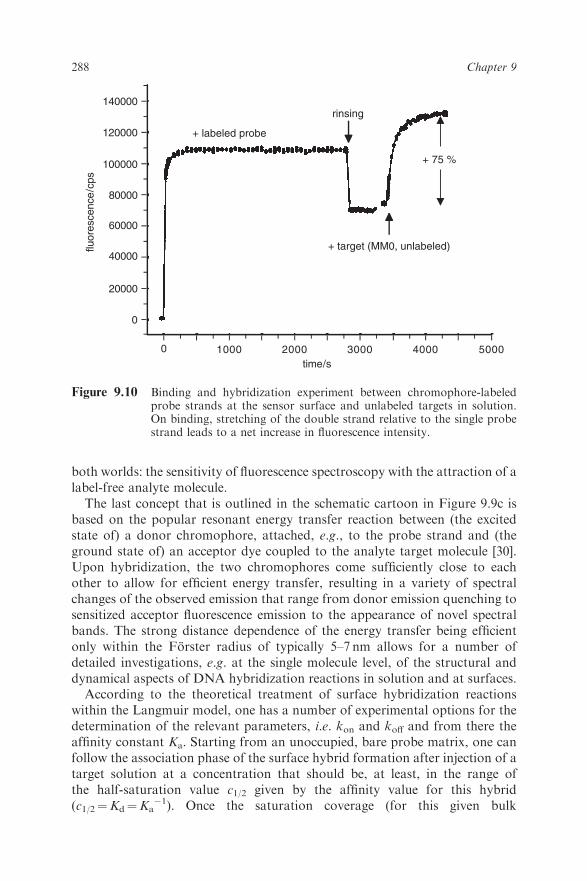
both worlds: the sensitivity of fluorescence spectroscopy with the attraction of alabel-free analyte molecule.The last concept that is outlined in the schematic cartoon in Figure 9.9c is
based on the popular resonant energy transfer reaction between (the excitedstate of) a donor chromophore, attached, e.g., to the probe strand and (theground state of) an acceptor dye coupled to the analyte target molecule [30].Upon hybridization, the two chromophores come sufficiently close to eachother to allow for efficient energy transfer, resulting in a variety of spectralchanges of the observed emission that range from donor emission quenching tosensitized acceptor fluorescence emission to the appearance of novel spectralbands. The strong distance dependence of the energy transfer being efficientonly within the Forster radius of typically 5–7 nm allows for a number ofdetailed investigations, e.g. at the single molecule level, of the structural anddynamical aspects of DNA hybridization reactions in solution and at surfaces.According to the theoretical treatment of surface hybridization reactions
within the Langmuir model, one has a number of experimental options for thedetermination of the relevant parameters, i.e. kon and koff and from there theaffinity constant Ka. Starting from an unoccupied, bare probe matrix, one canfollow the association phase of the surface hybrid formation after injection of atarget solution at a concentration that should be, at least, in the range ofthe half-saturation value c1/2 given by the affinity value for this hybrid(c1/2¼Kd¼Ka
�1). Once the saturation coverage (for this given bulk
0 1000
0
2000 3000 4000 5000
20000
40000
60000
80000
100000
120000
140000
time/s
fluor
esce
nce
/cps
+ labeled probe
rinsing
+ target (MM0, unlabeled)
+ 75 %
Figure 9.10 Binding and hybridization experiment between chromophore-labeledprobe strands at the sensor surface and unlabeled targets in solution.On binding, stretching of the double strand relative to the single probestrand leads to a net increase in fluorescence intensity.
288 Chapter 9
concentration) is reached, one can record the dissociation process by contin-uously rinsing the flow cell with pure buffer solution, thus triggering thedissociation of the hybrids and the free target strands being washed out.If one measures these association and dissociation phases systematically at
different concentrations of the injected target solution but for a very limitedtime only (e.g. for 10min), and with regeneration steps between such that eachtime association starts from a bare probe, one can derive reliable values for konand koff because they will be averaged over the concentration range investi-gated. This global analysis allows one, in particular, to check whether thedissociation rate constant, koff, is concentration (and coverage) independent aspredicted by the Langmuir model, and it shows whether the associationprocess, indeed, speeds up linearly with increasing bulk concentration c0.Finally, by monitoring equilibrium coverage as a function of c0, e.g. byrecording angular fluorescence scans after a plateau has been reached in theassociation phase, one can perform titration experiments which yield theaffinity constant directly (cf. Figure 9.8b). By comparing the various param-eters determined by the different techniques, one can check for internal con-sistency of the prediction of the Langmuir model and, can test its applicabilityto surface hybridization reactions.The application of kinetic SPFS measurements for the quantification of
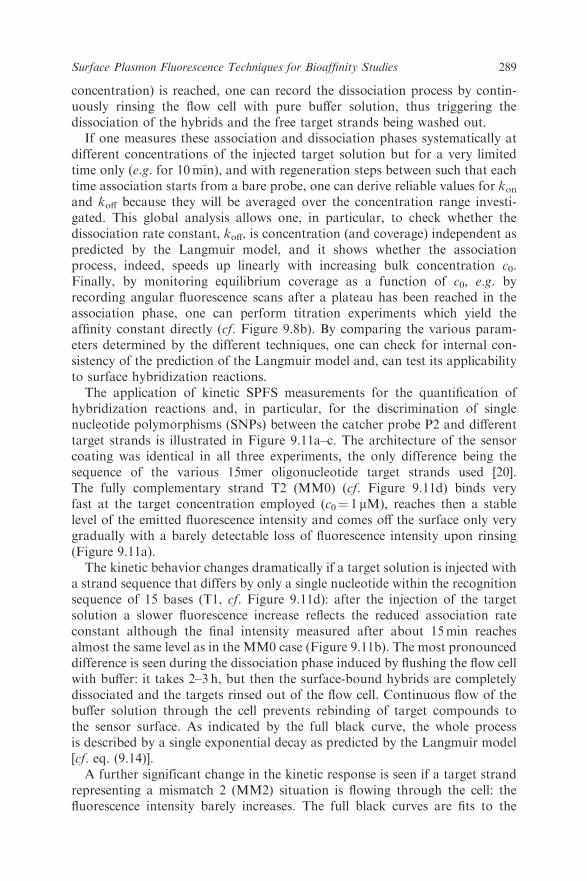
hybridization reactions and, in particular, for the discrimination of singlenucleotide polymorphisms (SNPs) between the catcher probe P2 and differenttarget strands is illustrated in Figure 9.11a–c. The architecture of the sensorcoating was identical in all three experiments, the only difference being thesequence of the various 15mer oligonucleotide target strands used [20].The fully complementary strand T2 (MM0) (cf. Figure 9.11d) binds veryfast at the target concentration employed (c0¼ 1 mM), reaches then a stablelevel of the emitted fluorescence intensity and comes off the surface only verygradually with a barely detectable loss of fluorescence intensity upon rinsing(Figure 9.11a).The kinetic behavior changes dramatically if a target solution is injected with
a strand sequence that differs by only a single nucleotide within the recognitionsequence of 15 bases (T1, cf. Figure 9.11d): after the injection of the targetsolution a slower fluorescence increase reflects the reduced association rateconstant although the final intensity measured after about 15min reachesalmost the same level as in the MM0 case (Figure 9.11b). The most pronounceddifference is seen during the dissociation phase induced by flushing the flow cellwith buffer: it takes 2–3 h, but then the surface-bound hybrids are completelydissociated and the targets rinsed out of the flow cell. Continuous flow of thebuffer solution through the cell prevents rebinding of target compounds tothe sensor surface. As indicated by the full black curve, the whole processis described by a single exponential decay as predicted by the Langmuir model[cf. eq. (9.14)].A further significant change in the kinetic response is seen if a target strand
representing a mismatch 2 (MM2) situation is flowing through the cell: thefluorescence intensity barely increases. The full black curves are fits to the
289Surface Plasmon Fluorescence Techniques for Bioaffinity Studies
1.5 x 10⁶
1.0 x 10⁶
5.0 x 10⁵
0.0
1.5 x10⁶
1.0 x10⁶
0.0
1.5 x 10⁶
1.0 x 10⁶
5.0 x 10⁵
5.0 x 10⁵
0.0
10000 2000 3000 4000 5000 6000 7000
0 150005000 10000
0 1000 2000 3000 4000 5000
Time / sec
Time / sec
Time / sec
I fl/c
psI fl
/cps
I fl/c
ps
P2/T2: MM 0
P2/T1: MM 1
P2/T3: MM 2
(a)
(b)
(c)
(d) Probes:
DNA-P2: 5′-biotin-T15-TGT ACA TCA CAA CTA-3′
PNA-P2: biotin- TGT ACA TCA CAA CTA-NH2
Targets:
T1: 3′-ACA TGC AGT GTT GAT - cy5 - 5′T2: 3′-ACATGT AGT GTT GAT - cy5 - 5′T3:
3′-ACA TGC ACT GTT GAT - cy5 - 5′
6OO
ONH
O
NH2
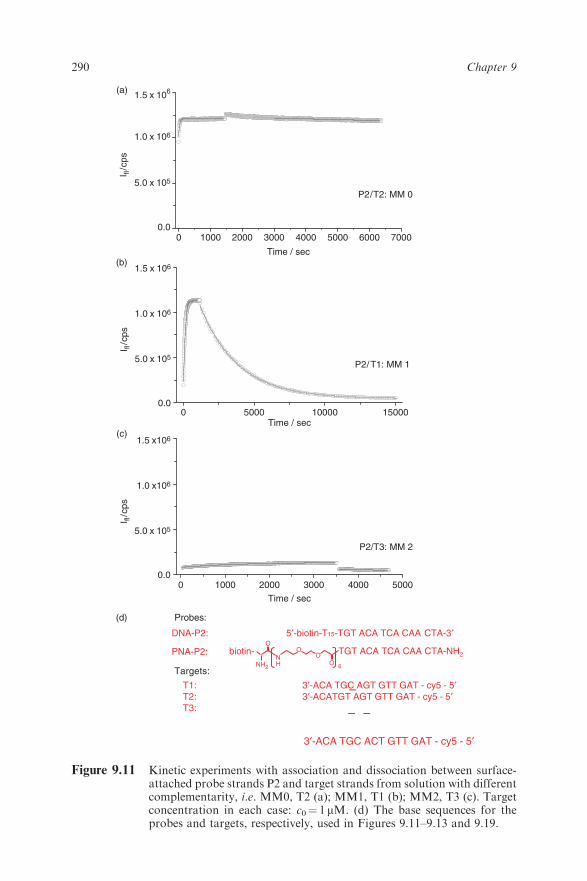
Figure 9.11 Kinetic experiments with association and dissociation between surface-attached probe strands P2 and target strands from solution with differentcomplementarity, i.e. MM0, T2 (a); MM1, T1 (b); MM2, T3 (c). Targetconcentration in each case: c0¼ 1mM. (d) The base sequences for theprobes and targets, respectively, used in Figures 9.11–9.13 and 9.19.
290 Chapter 9
experimental data based on the Langmuir model with rate constants summa-rized in Table 9.1.A global analysis with the P2/T2 system cannot yield reliable kon values
because the dissociation is so slow, as shown in Figure 9.11a, that no mean-ingful fit to the nearly flat intensity curve (measured typically for a few minutesonly) would be obtained. However, upon the introduction of a single mismatchin the base sequence of the target (T1, in Figure 9.11d) the duplex is consid-erably destabilized, thus the dissociation is enhanced and the loss of fluores-cence intensity can be measured within the 10min rinsing phase of the globalanalysis. This is shown in Figure 9.12a for a probe matrix assembled frombiotinylated peptide nucleic acids (PNA-P2), the neutral mimic of the corre-sponding DNA-T2 (cf. Figure 9.11d). The recognition sequence was identicalwith the DNA P2; however, the spacer to the biotin group was a stretch of sixethylene oxide-containing units [30] instead of the 15 thymines in the case of theDNA probe strands.The rate constants ka¼ (konc0+koff) [cf. eq. (9.12)] derived for the PNA-P2–T1
hybridization is plotted in Figure 9.12b. From the slope of the linear depend-ence on the bulk concentration c0 the association rate constant is obtained askon¼ 3.1� 103M�1 s�1, slightly lower than that for the DNA-P2–T1 case (cf.Table 9.1).Upon flushing the cell with buffer and monitoring the dissociation phase, one
can determine the koff rate constant(s) as a function of coverage according toeq. (9.14). The corresponding measurements are also shown in Figure 9.12a.Note that after starting the buffer solution an instant decrease in the fluores-cence intensity can be observed, indicating the starting point of the dissociationphase. This drop originates from removal of free fluorophores (targets) in thesolution near the surface flushed out by the buffer. From the decrease in thefluorescence intensity during the rinsing process the dissociation rate constantwas determined as koff¼ 2.5� 10�4 s�1, which is the average of all valuesobtained by fitting each dissociation part of the measurement (during rinsing)using eq. (9.14). Thus, the affinity constant, Ka (Ka¼ kon/koff), is found to beKa¼ 1.2� 107M�1 for the PNA-P2–T1 MM1 hybrid, which is of the sameorder as for the DNA–DNA hybrid.For a titration experiment, a series of angular scans were taken after target
solutions of 1, 5, 10, 20, 50 and 100 nM had been injected and equilibrium foreach new bulk concentration was reached. The corresponding series of angularscans is shown in Figure 9.13a. Several features are noteworthy. (1) No
Table 9.1 Rate constants kon and koff and the affinity constant Ka¼ kon/koff,derived from the kinetic experiments shown in Figure 9.11.
Parameter T2 (MM0) T1 (MM1) T3 (MM2)
kon (M�1 s�1) 3.7� 104 8.9� 103 10koff (s�1) 7� 10�6 3.7� 10�4 7.7� 10�4
KA (M�1) 5.3� 109 2.4� 107 1.3� 104
291Surface Plasmon Fluorescence Techniques for Bioaffinity Studies
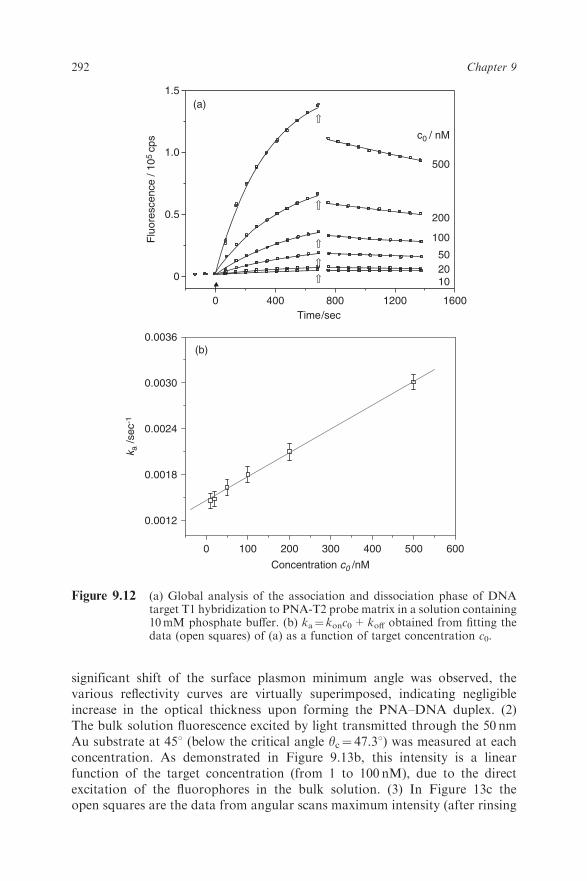
significant shift of the surface plasmon minimum angle was observed, thevarious reflectivity curves are virtually superimposed, indicating negligibleincrease in the optical thickness upon forming the PNA–DNA duplex. (2)The bulk solution fluorescence excited by light transmitted through the 50 nmAu substrate at 451 (below the critical angle yc¼ 47.31) was measured at eachconcentration. As demonstrated in Figure 9.13b, this intensity is a linearfunction of the target concentration (from 1 to 100 nM), due to the directexcitation of the fluorophores in the bulk solution. (3) In Figure 13c theopen squares are the data from angular scans maximum intensity (after rinsing
0 400 800 1200 1600Time/sec
50
100
200
500
1020
0 100 200 300 400 500 600
0.0012
0.0018
0.0024
0.0030
0.0036
k a /s
ec-1
Concentration c0 /nM
c0 / nMF
luor
esce
nce
/ 105
cps
(a)
(b)
1.5
1.0
0.5
0
Figure 9.12 (a) Global analysis of the association and dissociation phase of DNAtarget T1 hybridization to PNA-T2 probe matrix in a solution containing10mM phosphate buffer. (b) ka¼ konc0+ koff obtained from fitting thedata (open squares) of (a) as a function of target concentration c0.
292 Chapter 9

for 3 min) and the solid curve is a simulated Langmuir fit using eq. (9.16) withan affinity constant of Ka¼ 1.7� 108M�1, more than an order of magnitudelower than the affinity constant for the DNA–DNA hybrid (cf. Table 9.1).The observed behavior of binding of the targets from solution to the surface-
immobilized probe strands can be essentially understood from the Langmuirmodel. The isotherms describing the three different match/mismatch situationsin Figure 9.11 are displayed in Figure 9.14 by the three different S-shapedbinding curves (solid, dashed and dotted black curves). They are separated
0.0
5.0x10⁴
1.0x10⁵
1.5x10⁵
Flu
ores
cenc
e @
45°/
cps
Concentration c0 /nM0 20 40 60 80 1000 20 40 60 80 100
0.0
8.0x10⁴
1.6x10⁵
2.4x10⁵
Flu
ores
cenc
e @
56.
6°/c
ps
Concentration c0 /nM
100 n50 n20 n10 n5 n1 n
backgroun
c
(2
(1
45 50 55 60 65
0.0
0.2
0.4
0.6
0.8
1.0
Angle/deg
Ref
lect
ivity
R
0.0
0.8
1.6
100 nM50 nM20 nM10 nM5 nM1 nM
background
c0
(1
Kinetic Exp.Transmission Exp.
Flu
ores
cenc
e/10
5 cp
s
2.4
(a)
(b) (c)
Figure 9.13 (a) Angular scans taken after saturation was reached for T2 targetsolutions (1, 5, 10, 20, 50 and 100 nM), hybridizing to a PNA-P2 matrix,together with the background fluorescence intensity. Open squares arereflectivities. Angular fluorescence curves before (open symbols) andafter rinsing (full symbols) the flow cell with buffer following theequilibrium binding of targets from solution. (b) Fluorescence intensitymeasured at y¼ 451, (below critical angle), giving information of thebulk concentration c0. (c) Plots (open squares) of the maximum fluores-cence intensity (y¼ 56.61) taken from (a) versus target concentration c0.Solid line: fit by a Langmuir isotherm with Ka¼ 1.7� 108M�1.
293Surface Plasmon Fluorescence Techniques for Bioaffinity Studies
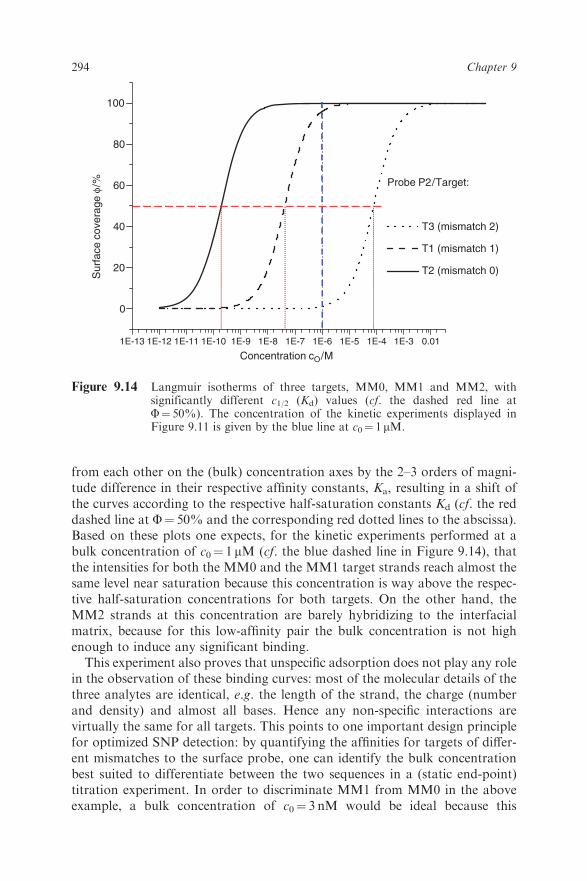
from each other on the (bulk) concentration axes by the 2–3 orders of magni-tude difference in their respective affinity constants, Ka, resulting in a shift ofthe curves according to the respective half-saturation constants Kd (cf. the reddashed line at F¼ 50% and the corresponding red dotted lines to the abscissa).Based on these plots one expects, for the kinetic experiments performed at abulk concentration of c0¼ 1 mM (cf. the blue dashed line in Figure 9.14), thatthe intensities for both the MM0 and the MM1 target strands reach almost thesame level near saturation because this concentration is way above the respec-tive half-saturation concentrations for both targets. On the other hand, theMM2 strands at this concentration are barely hybridizing to the interfacialmatrix, because for this low-affinity pair the bulk concentration is not highenough to induce any significant binding.This experiment also proves that unspecific adsorption does not play any role
in the observation of these binding curves: most of the molecular details of thethree analytes are identical, e.g. the length of the strand, the charge (numberand density) and almost all bases. Hence any non-specific interactions arevirtually the same for all targets. This points to one important design principlefor optimized SNP detection: by quantifying the affinities for targets of differ-ent mismatches to the surface probe, one can identify the bulk concentrationbest suited to differentiate between the two sequences in a (static end-point)titration experiment. In order to discriminate MM1 from MM0 in the aboveexample, a bulk concentration of c0¼ 3 nM would be ideal because this
1E-13 1E-12 1E-11 1E-10 1E-9 1E-8 1E-7 1E-6 1E-5 1E-4 1E-3 0.01
0
20
40
60
80
100
Probe P2/Target:
T3 (mismatch 2)
T1 (mismatch 1)
T2 (mismatch 0)Sur
face
cov
erag
e φ/
%
Concentration cO/M
Figure 9.14 Langmuir isotherms of three targets, MM0, MM1 and MM2, withsignificantly different c1/2 (Kd) values (cf. the dashed red line atF¼ 50%). The concentration of the kinetic experiments displayed inFigure 9.11 is given by the blue line at c0¼ 1 mM.
294 Chapter 9
concentration is right in between the c1/2 values of the two strands. The con-centration of 1 mM used in the kinetic measurements shown in Figure 9.11obviously was too high. At this concentration both targets hybridize to theextent that almost a complete monolayer is formed, and hence would giveabout the same intensity when measured with a fluorescence scanner afterbinding. Of course, in a sensor platform such as the one described here, i.e. withthe full in situ and real-time recording of the whole association and dissociationprocess by surface plasmon fluorescence spectroscopy, one could easily dis-criminate between different mismatches by the significantly different rateconstants. Already after a few minutes or even seconds of recording the earlyphase of the association process a clear discrimination of the MM0 from theMM1 targets is feasible.When dealing with extremely dilute solutions, one needs to take into account
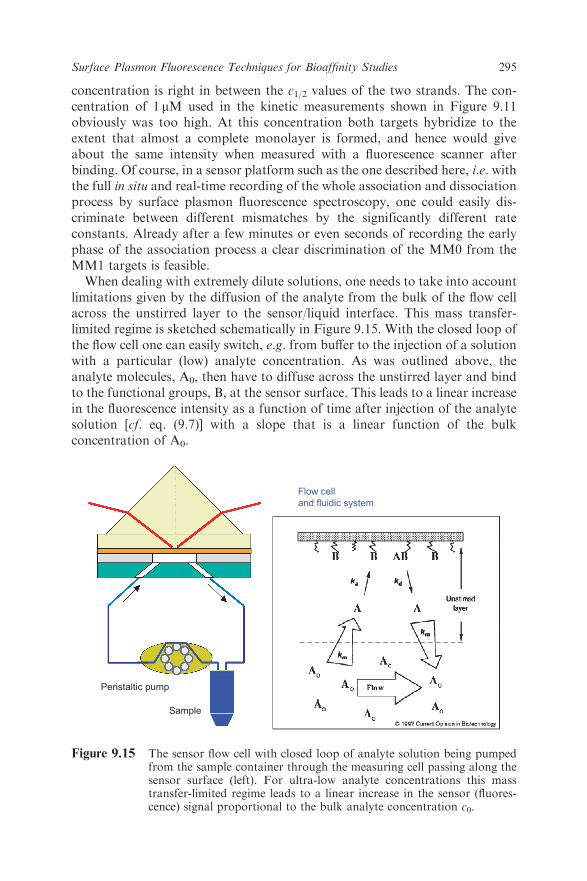
limitations given by the diffusion of the analyte from the bulk of the flow cellacross the unstirred layer to the sensor/liquid interface. This mass transfer-limited regime is sketched schematically in Figure 9.15. With the closed loop ofthe flow cell one can easily switch, e.g. from buffer to the injection of a solutionwith a particular (low) analyte concentration. As was outlined above, theanalyte molecules, A0, then have to diffuse across the unstirred layer and bindto the functional groups, B, at the sensor surface. This leads to a linear increasein the fluorescence intensity as a function of time after injection of the analytesolution [cf. eq. (9.7)] with a slope that is a linear function of the bulkconcentration of A0.
Peristaltic pump
Sample
Flow cell
and fluidic system
Figure 9.15 The sensor flow cell with closed loop of analyte solution being pumpedfrom the sample container through the measuring cell passing along thesensor surface (left). For ultra-low analyte concentrations this masstransfer-limited regime leads to a linear increase in the sensor (fluores-cence) signal proportional to the bulk analyte concentration c0.
295Surface Plasmon Fluorescence Techniques for Bioaffinity Studies
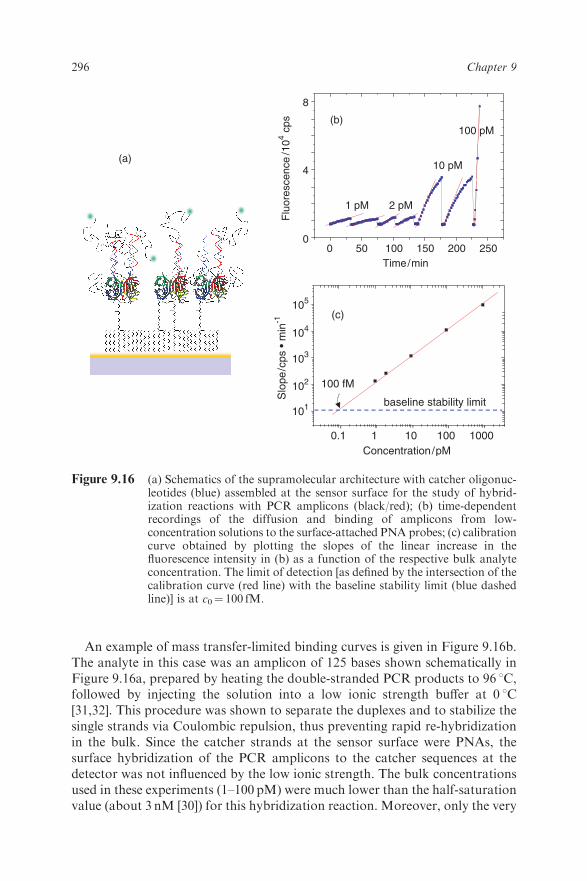
An example of mass transfer-limited binding curves is given in Figure 9.16b.The analyte in this case was an amplicon of 125 bases shown schematically inFigure 9.16a, prepared by heating the double-stranded PCR products to 96 1C,followed by injecting the solution into a low ionic strength buffer at 0 1C[31,32]. This procedure was shown to separate the duplexes and to stabilize thesingle strands via Coulombic repulsion, thus preventing rapid re-hybridizationin the bulk. Since the catcher strands at the sensor surface were PNAs, thesurface hybridization of the PCR amplicons to the catcher sequences at thedetector was not influenced by the low ionic strength. The bulk concentrationsused in these experiments (1–100 pM) were much lower than the half-saturationvalue (about 3 nM [30]) for this hybridization reaction. Moreover, only the very
0.1 1 10 100 1000
baseline stability limit
100 fM
Slo
pe/c
ps •
min
-1
Concentration/pM
0 50 100 150 200 250
10 pM
1 pM 2 pM
Flu
ores
cenc
e/1
04 cp
s
Time/min
105
104
103
102
101
100 pM
8
4
0
-- - - -
(b)
(c)
(a)
Figure 9.16 (a) Schematics of the supramolecular architecture with catcher oligonuc-leotides (blue) assembled at the sensor surface for the study of hybrid-ization reactions with PCR amplicons (black/red); (b) time-dependentrecordings of the diffusion and binding of amplicons from low-concentration solutions to the surface-attached PNA probes; (c) calibrationcurve obtained by plotting the slopes of the linear increase in thefluorescence intensity in (b) as a function of the respective bulk analyteconcentration. The limit of detection [as defined by the intersection of thecalibration curve (red line) with the baseline stability limit (blue dashedline)] is at c0¼ 100 fM.
296 Chapter 9
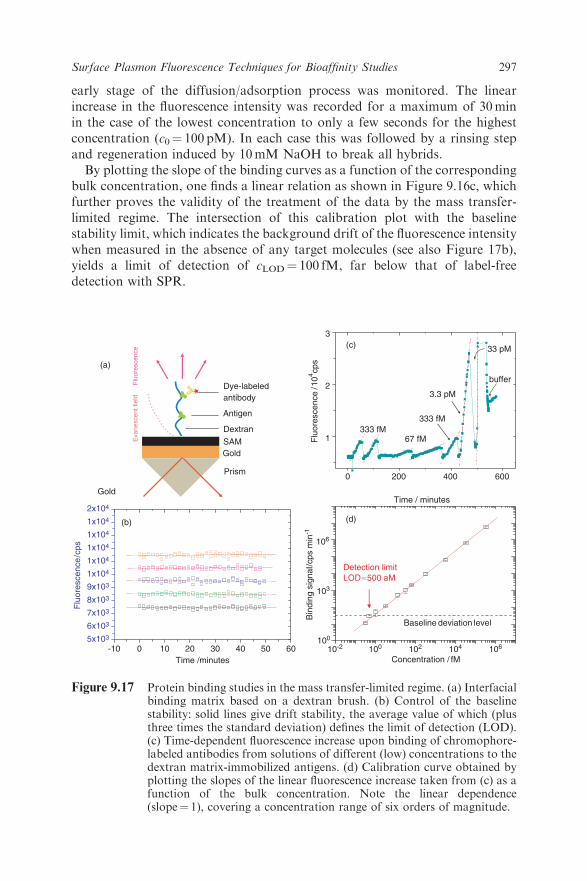
early stage of the diffusion/adsorption process was monitored. The linearincrease in the fluorescence intensity was recorded for a maximum of 30minin the case of the lowest concentration to only a few seconds for the highestconcentration (c0¼ 100 pM). In each case this was followed by a rinsing stepand regeneration induced by 10mM NaOH to break all hybrids.By plotting the slope of the binding curves as a function of the corresponding
bulk concentration, one finds a linear relation as shown in Figure 9.16c, whichfurther proves the validity of the treatment of the data by the mass transfer-limited regime. The intersection of this calibration plot with the baselinestability limit, which indicates the background drift of the fluorescence intensitywhen measured in the absence of any target molecules (see also Figure 17b),yields a limit of detection of cLOD¼ 100 fM, far below that of label-freedetection with SPR.
Eva
nesc
ent f
ield
Prism
GoldSAM
Dextran
Antigen
Dye-labeledantibody
Gold
Detection limitLOD≈500 aM
-10 0 10 20 30 40 50 605x103
6x10³
7x10³
8x10³
9x10³
1x10⁴
1x10⁴
1x10⁴
1x10⁴
1x10⁴
2x10⁴
Flu
ores
cenc
e/c
ps
Time /minutes
(a)
(b)
(c)
10-2 100 102 104 106100
103
106
Baseline deviation level
Bin
ding
sig
nal/c
ps m
in-1
Concentration / fM
(d)
0 200 400 600
1
2
3
333 fM
buffer
3.3 pM
33 pM
67 fM333 fM
Flu
ores
cenc
e/1
04 cps
Time / minutes
Flu
ores
cenc
e
Figure 9.17 Protein binding studies in the mass transfer-limited regime. (a) Interfacialbinding matrix based on a dextran brush. (b) Control of the baselinestability: solid lines give drift stability, the average value of which (plusthree times the standard deviation) defines the limit of detection (LOD).(c) Time-dependent fluorescence increase upon binding of chromophore-labeled antibodies from solutions of different (low) concentrations to thedextran matrix-immobilized antigens. (d) Calibration curve obtained byplotting the slopes of the linear fluorescence increase taken from (c) as afunction of the bulk concentration. Note the linear dependence(slope¼ 1), covering a concentration range of six orders of magnitude.
297Surface Plasmon Fluorescence Techniques for Bioaffinity Studies
9.4.2 Protein Binding Studies
All examples discussed so far were based on the recording of fluorescence fromchromophores covalently bound to the analyte molecule of interest. This doesnot constitute a major limitation for the detection of PCR amplicons becausethe use of fluorophore-labeled primers is well established. However, there mightbe other situations where the attachment of a fluorescent label is not possible orbears the risk of changing the characteristics of the interaction with affinitypartners in a significant way, e.g. when dealing with proteins. In this case one isinterested in developing detection schemes that offer the sensitivity provided byfluorescence spectroscopy, but do not require the analyte to carry the fluor-ophore directly. Competitive replacement assays, obviously, fulfill that require-ment: the analyte of interest replaces a chromophore-labeled ligand that waspreadsorbed on the binding sites at the sensor surface.Much of the optical principles for fluorescence-based detection of hybridi-
zation reactions between a surface-attached probe oligonucleotide and a targetstrand from solution applies to the study of protein binding reactions atsurfaces in very much the same way [33]. However, generally, proteins aresignificantly more delicate in their behavior and, in particular, are moresensitive to the proper control of their interfacial interaction potentials. Adirect consequence is the need for a significantly more complex interfacialarchitecture for the functionalization of sensor surfaces which allows for theattachment of ligands or other binding partners in the proper orientation,flexibility, without the loss of specificity or even the risk of partial denaturingand with the control of any unwanted non-specific binding (NSB).A number of different strategies for the attachment of binding partners for
the recognition and binding reaction with proteins from solution have beenreported. For the case of bioaffinity studies using surface plasmon fluorescencespectroscopy, the dextran brush introduced by Biacore turned out to be ideallysuited for this purpose [34]. As can also be seen in Figure 9.6, the extent of thebrush with its roughly 100 nm thickness matches very well the extent of theevanescent field of the surface plasmon. The functionalization of the brush viaits –COOH groups along each dextran chain allows for the covalent attachmentof antigens. If the antigens are recognized by the corresponding chromophore-labeled antibody, binding with high affinity from solution, strong fluorescenceemission occurs when excited by a resonant surface plasmon field. This isshown schematically in Figure 9.17a. This matrix also minimizes intensitylosses due to quenching, because most of the binding events occur sufficientlyfar away from the metal surface. Figure 9.17b shows a series of stability tests,i.e. recordings of the baseline fluorescence as a function of time without anyanalyte injected. The average value of the slope of these curves (plus three timesthe standard deviation) gives the baseline stability limit needed for the deter-mination of the limit of detection. The mass transfer-limited linear increase inthe fluorescence intensity seen after the injection of antibody solutions can besensitively monitored down to extremely low concentrations, as shown inFigure 9.17c. The plot of the slope of the intensity increase as a function of
298 Chapter 9
the bulk protein concentration again gives a straight line (Figure 9.17d),confirming the validity of the diffusion model. The intersection of the calibra-tion line with the baseline stability limit again defines the LOD of this detectionmethod and is found to be as low as cLOD¼ 500 aM (5� 10�16M), far belowLODs ever observed with SPR [21].The highest concentration used in the above measurements was 1 nM, barely
reaching the half-saturation concentration of this antibody–antigen pair withits affinity in the range of KA¼ 2� 108M�1. However, when working with a6.7 nM solution one can monitor the fluorescence signal at various stages of theantibody adsorption and correlate it with the resulting angular shift of the SPRsignal at this coverage. In this way, one can calibrate the observed fluorescenceintensity in terms of the number of proteins binding to the matrix. For the LODof 500 aM one finds that the monitored fluorescence increase corresponds to thediffusion and binding of about 10 proteins per mm2 per minute, approachingthe range of single molecule detection.All fluorescence data presented so far were based on the recording of quasi-
monochromatic fluorescence intensity by photon counting with the emittedlight passing through a narrow bandpass filter for stray light suppression.However, an alternative means of light detection, this time with the full spectralinformation of the emitted fluorescence, is given by the use of a spectrometerthat disperses the light into its spectral components. In this way, not only theexistence of an analyte can be monitored through its fluorescence emission, butalso additional processes at the sensor surface which lead to spectral changes ofthe emission can be recorded.The principle of this approach is illustrated in Figure 9.18 for a protein layer
coupled to the sensor matrix by the well-established His-tag strategy. A genericstreptavidin monolayer was introduced to couple a layer of biotinylatednitrilotriacetic acid molecules which – after activation by exposure to 500 mMNiCl2 solution – can be used to attach a monolayer of a recombinant protein/chromophore aggregate, i.e. the light-harvesting complex LHCII known fromchloroplasts, that was modified by a stretch of six histidines at the C-terminus.Figure 9.18a illustrates the final architecture, and Figure 9.18b shows the SPRprotocol of the assembly process: after binding of the Ni21 ions, the injection ofthe protein (dark arrows) leads to the formation of an oriented LHCIImonolayer of a density which is controlled by the streptavidin matrix. Afterrinsing the multilayer with pure buffer (white arrows) followed by a 0.35Msolution of EDTA, a high-affinity chelator for divalent ions, all Ni21 ions arereleased and the aggregates can be specifically disassembled between the NTAon the surface and the His-tag at the protein, which is then rinsed out. Thisprocess is fully reversible, as demonstrated by the virtually identical SPRresponses of the repeated assembly and disassembly steps.After binding the unmodified LHCII bands found for the protein in solution
can be identified also for the surface-immobilized protein layer (Figure 9.18c,red curve) in the fluorescence spectrum of wavelength-resolved SPFS. Injectingthe unmodified protein mixed with protein labeled with an acceptor dye(DY-730 from Dyomics, Jena, Germany), the blue curve in Figure 9.18c
299Surface Plasmon Fluorescence Techniques for Bioaffinity Studies
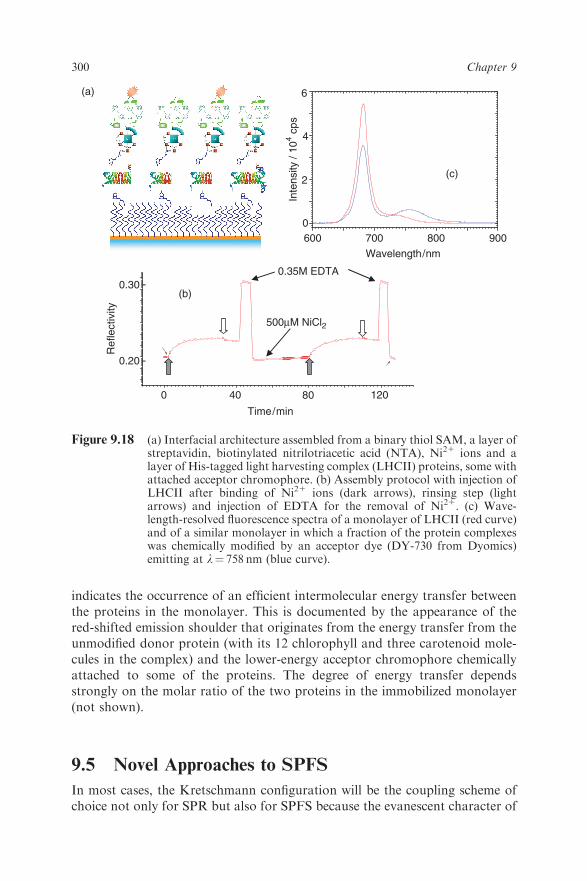
indicates the occurrence of an efficient intermolecular energy transfer betweenthe proteins in the monolayer. This is documented by the appearance of thered-shifted emission shoulder that originates from the energy transfer from theunmodified donor protein (with its 12 chlorophyll and three carotenoid mole-cules in the complex) and the lower-energy acceptor chromophore chemicallyattached to some of the proteins. The degree of energy transfer dependsstrongly on the molar ratio of the two proteins in the immobilized monolayer(not shown).
9.5 Novel Approaches to SPFS
In most cases, the Kretschmann configuration will be the coupling scheme ofchoice not only for SPR but also for SPFS because the evanescent character of
Wavelength/nm
Time/min
Ref
lect
ivity
(a)
(c)
(b)In
tens
ity /
104
cps
6
80400
4
2
0
0.20
0.30
600 700 800 900
120
0.35M EDTA
500µM NiCl2
Figure 9.18 (a) Interfacial architecture assembled from a binary thiol SAM, a layer ofstreptavidin, biotinylated nitrilotriacetic acid (NTA), Ni21 ions and alayer of His-tagged light harvesting complex (LHCII) proteins, some withattached acceptor chromophore. (b) Assembly protocol with injection ofLHCII after binding of Ni21 ions (dark arrows), rinsing step (lightarrows) and injection of EDTA for the removal of Ni21. (c) Wave-length-resolved fluorescence spectra of a monolayer of LHCII (red curve)and of a similar monolayer in which a fraction of the protein complexeswas chemically modified by an acceptor dye (DY-730 from Dyomics)emitting at l¼ 758 nm (blue curve).
300 Chapter 9

the surface wave being excited from the back of the prism allows for easyattachment of the flow cell from the front side and the recording of the resultingfluorescence emission off the base plane of the prism. However, the alternativescheme for surface plasmon excitation by laser light based on a surface gratingstructure offers a number of advantages for biosensing in general and forsurface plasmon fluorescence spectroscopy in particular. For example, the needfor a relatively high index prism for the momentum matching condition whenworking in aqueous buffer solutions can barely be met by cheap plastic prismsand requires expensive specialty glasses. Even then, relatively high angles ofincidence are needed. In the following, novel instrumental solutions are givenfor the SPFS challenge.
9.5.1 Grating Coupling for SPFS
The use of a grating coupler offers an important element of flexibility in that thechoice of the grating periodicity, L, and hence the modulus of the gratingvector, G¼ 2p/L, allows for the tuning of the angle of resonant excitation, y,for a given laser wavelength to any desired value from normal incidence toessentially y¼ 901, according to the momentum matching condition for gratingcoupling:
kpsp ¼ kphotonsinyþmG ð9:17Þ
The grating coupler is illustrated in Figure 9.19. Since the laser is incident fromthe front side, as shown in Figure 9.19a, the Au metal coating can be of anythickness provided that it remains opaque and no light is reflected from theback side (an advantage in the context of quality control for the mass produc-tion of such sensor chips). Moreover, the substrate can be made of anymaterial, e.g. a plastic chip that can be surface structured very easily and atlow cost by hot embossing with a master grating (which offers the additionaladvantage that all gratings are virtually identical in terms of their gratingconstant and amplitude, Fourier components, roughness, etc.). As in this casethe laser beam passes through the flow cell before exciting the surface plasmonwave at the sensor (grating) surface, at higher analyte concentrations, this maylead to an additional fluorescence contribution, i.e. from chromophore-labeledanalyte molecules flowing through the cell, resulting in a so-called bulk-jumpupon injection of the analyte solution. However, for very dilute concentrationsthis is of no concern.Figure 9.19b gives an example of the angular dependence of the reflectivity
and of the corresponding fluorescence for both, p- and s-polarized laserexcitation. At higher angles the reflectivity curves show the appearance ofthe �1st-order diffraction intensity, resulting in a slight decrease of the spec-ularly reflected intensity (not seen, of course, in the fluorescence intensity whichonly reflects the interfacial intensity of the surface plasmon mode). Note alsothe pronounced angular shift between the reflectivity minimum angle and theangle for maximum fluorescence intensity.
301Surface Plasmon Fluorescence Techniques for Bioaffinity Studies

A typical concentration titration experiment between surface boundDNA-P2 probes and T1 targets (MM1) in solution is given in Figure 9.19c.The interfacial architecture on the grating surface was the binary SAM/streptavidin-based matrix (shown in Figure 2) used also for the hybridizationexperiments in the Kretschmann configuration. The open squares are theexperimental fluorescence data points and the red curves are calculations basedon the Langmuir model with kon and koff parameters summarized in Table 9.2.The kon values were obtained by fitting the association phases recorded afterinjecting bulk solutions of different concentrations, while the final dissociationexperiment (at c0¼ 0 nM) with its exponential decay of the fluorescence inten-sity could be fitted by a single koff rate constant (cf. Table 9.2). Usingthe various kon values and the koff value of the dissociation experiment forthe determination of the KA values, one finds, in agreement with the Langmuir
0 50 100 150 200 250
Concentration/nM
4
3
2
1
0
2 4 6 8 10 12 14 16 18 20 22
p-light SPSs-light SPS
p-light fluorescence
s-light fluorescence
Re
fle
civ
ity R
Incident angle/deg
Flu
ore
scence
/10
6 c
ps
1.0
0.5
0
2
3
4
0
1
PMT
O-ringCover glass Au coating
substrate
flow cell
0 100 200 300 400 500 600 700
0
1x10⁵
2x10⁵
3x10⁵
4x10⁵
5x10⁵ Rinse
10 nM (without t-20)
10 nM
20 nM
50 nM
100 nM
250 nM
Flu
ore
sce
nce
/cp
s
Time/minutes
(a)
(b)
(c)
(d)
θout
θin
Figure 9.19 (a) Schematics of the excitation of surface plasmons by a grating on theback of a flow cell, with fluorescence detection through the cell. (b)Angular reflectivity (open black symbols) and fluorescence scans (closedblue symbols) in grating coupling. The Au gating was functionalized witha probe layer to which a chromophore-labeled target strand was hybrid-ized. (c) Titration of surface attached P2 probe matrix with DNA targetT1 at different concentrations. The association and dissociation rateconstants were derived from the fits to the data points (red curves) andare given in Table 9.2. (d) Langmuir isotherm constructed from thefluorescence intensities from (c) after the equilibrium coverage at eachnew concentration was reached, with data fit using KA¼ 7� 107M�1 (redcurve).
302 Chapter 9

model, that the affinity constant for the MM0 hybrid does not depend on thebulk concentration. The values obtained vary within a factor of two, wellwithin the range of accuracy achievable in these experiments.As shown in Figure 9.19d, by plotting the fluorescence intensities recorded at
the end of each association phase after injection of a new bulk solution,representing the newly established equilibrium surface coverage, one obtainsagain a Langmuir adsorption isotherm similar to that constructed from angularfluorescence scans presented for a Kretschmann experiment in Figure 9.13. Thered curve is a fit with an affinity constant of KA¼ 6.7� 107M�1. Given the factthat such an equilibrium titration experiment is a fundamentally differentapproach for the determination of affinity constants, the agreement with thekinetically determined KA values adds strong support to the application of theLangmuir model for the analysis of hybridization reactions between surface-attached oligonucleotide probes and target strands in solution. Deviations areonly seen for very long (highly charged) PCR amplicons in low ionic strengthbuffers or for high target densities on the sensor surface. These deviations arewell explained by Coulomb interactions between probes and targets andbetween neighboring hybridization sites as we are dealing with highly chargedinterfaces and relatively dense oligo-electrolyte brushes.
9.5.2 Long-range Surface Plasmons for SPFS
Before the introduction of another very promising mode of operation in SPFS,i.e. the use of long-range surface plasmons (LRSP) as the excitation lightsource, we briefly review a few basics of ‘‘normal’’ surface plasmons. Thesenon-radiative, surface-bound electromagnetic modes propagate along a (noble)metal/dielectric interface with an optical field that peaks at the interface anddecays exponentially both into the metal and into the dielectric. The classicalKretschmann configuration with a prism as the coupling element allows for therequired energy and momentum matching between the exciting (laser) photonsand the surface plasmon modes, provided that the refractive index of the prismis sufficiently high compared with the dielectric medium in contact with themetal surface. For (bio-)sensor applications with the transducer operatingtypically in water (n¼ 1.33 at l¼ 633 nm) this requires that the thin metal
Table 9.2 Rate constants, kon and koff, and the affinity constant, KA¼ kon/koff,determined from the kinetic titration experiment presented inFigure 9.19.
Concentration (nM) kon (M�1 s�1) koff (s�1) KA (M�1)
10, no Tween 3.4� 104 14� 107
20 4.7� 104 19� 107
50 2.3� 104 9.2� 107
100 2.4� 104 9.6� 107
250 2.4� 104 9.6� 107
0 2.5� 10–4
303Surface Plasmon Fluorescence Techniques for Bioaffinity Studies
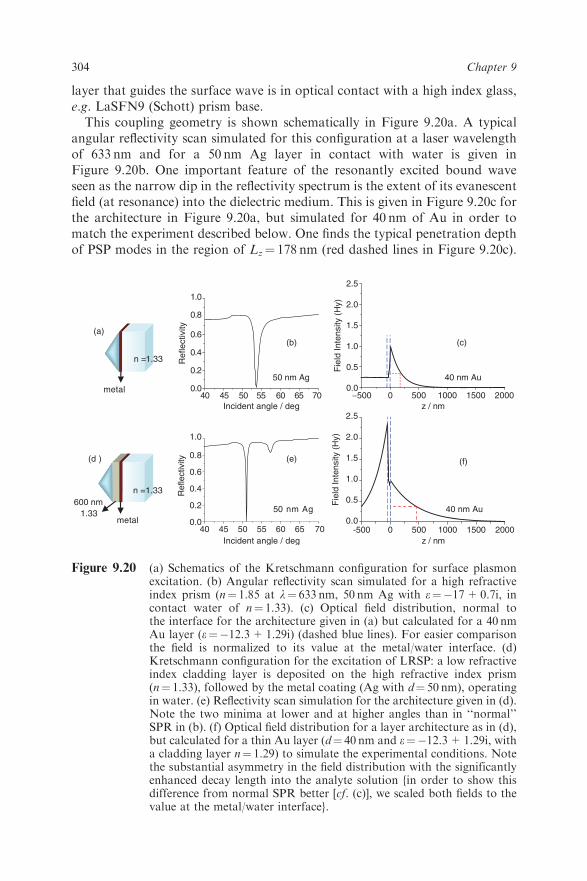
layer that guides the surface wave is in optical contact with a high index glass,e.g. LaSFN9 (Schott) prism base.This coupling geometry is shown schematically in Figure 9.20a. A typical
angular reflectivity scan simulated for this configuration at a laser wavelengthof 633 nm and for a 50 nm Ag layer in contact with water is given inFigure 9.20b. One important feature of the resonantly excited bound waveseen as the narrow dip in the reflectivity spectrum is the extent of its evanescentfield (at resonance) into the dielectric medium. This is given in Figure 9.20c forthe architecture in Figure 9.20a, but simulated for 40 nm of Au in order tomatch the experiment described below. One finds the typical penetration depthof PSP modes in the region of Lz¼ 178 nm (red dashed lines in Figure 9.20c).
metal
n =1.33
40 45 50 55 60 65 700.0
0.2
0.4
0.6
0.8
1.0
Ref
lect
ivity
-500 0 500 1000 1500 20000.0
0.5
1.0
1.5
2.0
2.5
Fie
ld In
tens
ity (
Hy)
40 45 50 55 60 65 700.0
0.2
0.4
0.6
0.8
1.0
Ref
lect
ivity (e) (f)
(c)(b)(a)
Incident angle / deg
Incident angle / deg z / nm
600 nm1.33
metal
(d )
n =1.33
−500 0 500 1000 1500 20000.0
0.5
1.0
1.5
2.0
2.5
Fie
ld In
tens
ity (
Hy)
z / nm
50 nm Ag 40 nm Au
50 nm Ag 40 nm Au
Figure 9.20 (a) Schematics of the Kretschmann configuration for surface plasmonexcitation. (b) Angular reflectivity scan simulated for a high refractiveindex prism (n¼ 1.85 at l¼ 633 nm, 50 nm Ag with e¼�17+0.7i, incontact water of n¼ 1.33). (c) Optical field distribution, normal tothe interface for the architecture given in (a) but calculated for a 40 nmAu layer (e¼�12.3+1.29i) (dashed blue lines). For easier comparisonthe field is normalized to its value at the metal/water interface. (d)Kretschmann configuration for the excitation of LRSP: a low refractiveindex cladding layer is deposited on the high refractive index prism(n¼ 1.33), followed by the metal coating (Ag with d¼ 50 nm), operatingin water. (e) Reflectivity scan simulation for the architecture given in (d).Note the two minima at lower and at higher angles than in ‘‘normal’’SPR in (b). (f) Optical field distribution for a layer architecture as in (d),but calculated for a thin Au layer (d¼ 40 nm and e¼�12.3+1.29i, witha cladding layer n¼ 1.29) to simulate the experimental conditions. Notethe substantial asymmetry in the field distribution with the significantlyenhanced decay length into the analyte solution {in order to show thisdifference from normal SPR better [cf. (c)], we scaled both fields to thevalue at the metal/water interface}.
304 Chapter 9

The evanescent character of this surface plasmon mode guarantees the surfacesensitivity and selectivity of the technique which does not suffer from bulkcontributions to the detected (fluorescence) signal, e.g. by scattering from largerobjects such as cells.If a very thin metal film is sandwiched between two dielectric media of
(nearly) identical refractive indices, nd, plasmon modes excited at the twoopposite interfaces will interact with each other provided that the metallayer is sufficiently thin (do40 nm), hence the optical fields within themetal start to overlap, establishing a transverse standing wave. This interactionlifts the dispersion degeneracy of the two identical evanescent waves andtwo new, coupled modes appear, a symmetrical and an antisymmetric wave(referring to their transverse electric field distribution) [35]. The latter hasattracted considerable interest, because its electric field across the metalfilm, responsible for the energy dissipation by the lossy metal, is largely reducedand the propagation length of the mode is considerably increased. Hencethis mode is also called long-range surface plasmon (LRSP) as opposedto the short-range surface plasmon (SRSP) mode which is subject to enhanceddissipation.A suitable way to excite LRSPR is the prism-coupled Kretschmann config-
uration given in Figure 9.20d [36,37]. In this case, a high refractive index glassprism is first coated with a low refractive index cladding layer (e.g. PTFE,nE 1.33 and a thickness of dE 600 nm), followed by the deposition of a 50 nmthin Ag layer. The simulated angular reflectivity spectrum of such a sandwichsample in water (n¼ 1.33 at l¼ 633 nm) is given in Figure 9.20e. The LRSPand SRSP modes can be seen as the sharp dip in the reflectivity spectrum atsmall angles and the much shallower and broader feature at higher angles,respectively, in roughly symmetrical angular positions relative to normal SPR(cf. Figure 9.20b and e). The magnetic field profile, Hz, of the LRSP normal tothe planes of the sandwich layers, scaled to its value at the metal/analytesolution (water) interface, is given in Figure 9.20f. For this simulation we chose40 nm gold as the metal layer and a refractive index for the PTFE cladding ofn¼ 1.29 in order to match the actual experimental conditions (see below). Theasymmetric refractive index profile of the cladding layer as substrate and wateras superstrate with their slightly different refractive index and also with theirdifferent thicknesses (500 nm vs. infinite, respectively) results in a rather asym-metric field distribution on both sides of the metal film.Reduced damping is responsible for the extended propagation of LRSPs
and also for the narrow angular resonance seen in the reflectivity spectrum inFigure 9.20e. This has triggered interest in using these modes also in opticalbiosensors for detecting thin coatings covering the metal film, e.g. by anadsorbed protein or DNA analyte layer [8]. The sharp dip in the resonancewith its angular position shifting up the binding of these biopolymers to slightlyhigher values should result in a change in reflectivity (fixed-angle mode) whichshould be substantially larger for an LRSP mode than for a classical SPR wave.However, the extension of the LRSP optical field reaching out much furtherinto the buffer solution reduces the effect of a thin adsorbed coating on the
305Surface Plasmon Fluorescence Techniques for Bioaffinity Studies

dispersion of the plasmon mode, hence the shift of the mode, Dy, is consider-ably lower than in SPR.When using LRSP in conjunction with surface-plasmon field-enhanced
fluorescence detection, the analyte molecules that carry a chromophore labeland bind from solution to a correspondingly functionalized sensor surface willbe excited by the evanescent modes of the surface plasmons with the opticalintensity of the LRSP field being significantly enhanced at the interface andextending much further out into the solution compared with the situation innormal SPR (compare the red dashed lines in Figure 9.20c and f ).The enhancement for LRSP-excited fluorescence becomes particularly obvi-
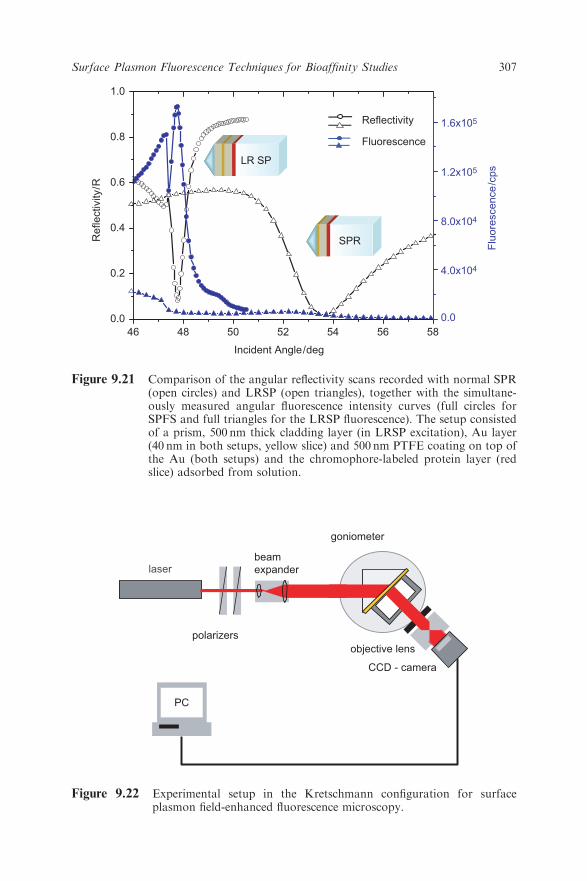
ous if one places the chromophore layer with the analyte further away from theAu surface [38]. The weaker decay of the LRSP field out into the analytesolution should be seen in the difference of fluorescence excitation by the twomodes of operation if the chromophores are placed at a certain distance awayfrom the interface. To this end, two samples were prepared, one for normalSPR and another one suited for LRSP excitation. In both cases the test analyte,i.e. the chromophore-labeled antibodies, were adsorbed on a 500 nm thickPTFE layer on top of the Au substrate in order to probe the differences in thedecay lengths of the two plasmon fields. As expected, the measured fluorescenceexcited by the normal SPR almost completely decayed to a barely detectablevalue (Figure 9.21, full triangles), whereas the fluorescence intensity ofthe identical protein layer probed by the LRSP field shows a high value(Figure 9.21, full circles): the peak intensity ratio amounts to a factor of 33.
9.5.3 Fluorescence Imaging and Color Multiplexing
As an example of the use of surface plasmon fluorescence microscopy forhybridization studies in the format of an m� n sensor array, we present dataobtained from experiments with quantum dots (QDs) as fluorescent probes.QDs are small, inorganic, semiconducting nanocrystals that possess uniqueoptical properties, the most significant being (i) their broad absorption spectraand (ii) the composition- and/or size-engineered emission properties, making itpossible to excite different QDs simultaneously with a single wavelength lightsource, but monitoring their luminescence light emitted at different wave-lengths in a color-multiplexed recording mode [39].The example for the parallel read-out of bioaffinity reactions that we
briefly describe concerns a simple 4� 1 array composed of four Au stripes(cf. Figure 9.23). With this array being oriented relative to the exciting laser beamat an angle near the SPR reflectivity minimum, corresponding to the highestsurface plasmon field enhancement and thus the highest fluorescence intensities,the various target solutions were injected into the flow cell. Upon hybridizationof the targets to the oligonucleotide catcher probe on the Au electrodes, thechromophore tags were excited by the evanescent tail of the propagating surfaceplasmon waves. The fluorescence photons emitted from the electrode array wereimaged by a color CCD camera as shown in Figure 9.22.
306 Chapter 9
laser
polarizers
PC
beam
expander
goniometer
objective lens
CCD - camera
Figure 9.22 Experimental setup in the Kretschmann configuration for surfaceplasmon field-enhanced fluorescence microscopy.
46 48 50 52 54 56 58
0.0
0.2
0.4
0.6
0.8
1.0
Incident Angle/deg
Re
fle
ctivity/R
0.0
4.0x10⁴
8.0x10⁴
1.2x10⁵
1.6x10⁵
Flu
ore
sce
nce
/cp
s
Reflectivity
Fluorescence
LR SP
SPR
Figure 9.21 Comparison of the angular reflectivity scans recorded with normal SPR(open circles) and LRSP (open triangles), together with the simultane-ously measured angular fluorescence intensity curves (full circles forSPFS and full triangles for the LRSP fluorescence). The setup consistedof a prism, 500 nm thick cladding layer (in LRSP excitation), Au layer(40 nm in both setups, yellow slice) and 500 nm PTFE coating on top ofthe Au (both setups) and the chromophore-labeled protein layer (redslice) adsorbed from solution.
307Surface Plasmon Fluorescence Techniques for Bioaffinity Studies
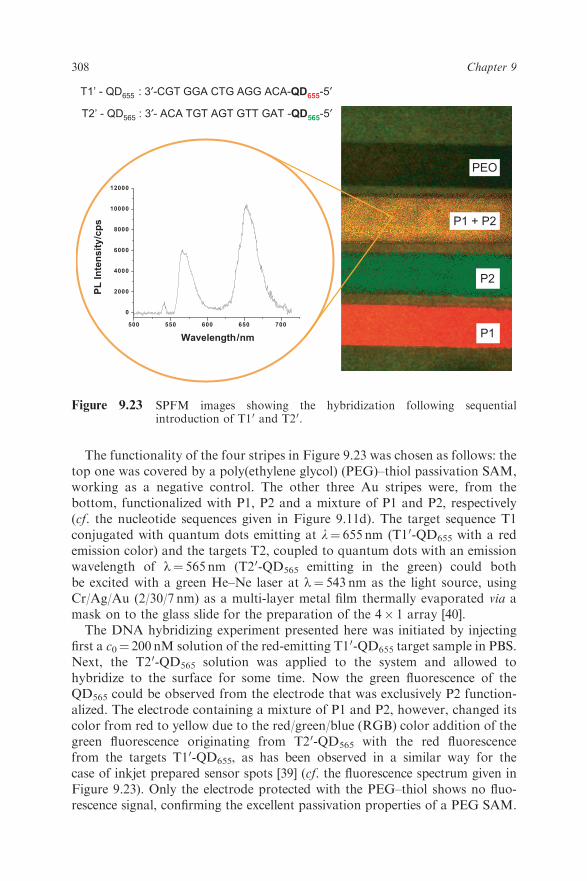
The functionality of the four stripes in Figure 9.23 was chosen as follows: thetop one was covered by a poly(ethylene glycol) (PEG)–thiol passivation SAM,working as a negative control. The other three Au stripes were, from thebottom, functionalized with P1, P2 and a mixture of P1 and P2, respectively(cf. the nucleotide sequences given in Figure 9.11d). The target sequence T1conjugated with quantum dots emitting at l¼ 655 nm (T10-QD655 with a redemission color) and the targets T2, coupled to quantum dots with an emissionwavelength of l¼ 565 nm (T20-QD565 emitting in the green) could bothbe excited with a green He–Ne laser at l¼ 543 nm as the light source, usingCr/Ag/Au (2/30/7 nm) as a multi-layer metal film thermally evaporated via amask on to the glass slide for the preparation of the 4� 1 array [40].The DNA hybridizing experiment presented here was initiated by injecting
first a c0¼ 200 nM solution of the red-emitting T10-QD655 target sample in PBS.Next, the T20-QD565 solution was applied to the system and allowed tohybridize to the surface for some time. Now the green fluorescence of theQD565 could be observed from the electrode that was exclusively P2 function-alized. The electrode containing a mixture of P1 and P2, however, changed itscolor from red to yellow due to the red/green/blue (RGB) color addition of thegreen fluorescence originating from T20-QD565 with the red fluorescencefrom the targets T10-QD655, as has been observed in a similar way for thecase of inkjet prepared sensor spots [39] (cf. the fluorescence spectrum given inFigure 9.23). Only the electrode protected with the PEG–thiol shows no fluo-rescence signal, confirming the excellent passivation properties of a PEG SAM.
PEO
P1 + P2
P2
P1500 550 600 650 700 750
0
2000
4000
6000
8000
10000
12000
PL
In
ten
sit
y/c
ps
Wavelength/nm
T1’ - QD655 : 3′-CGT GGA CTG AGG ACA-QD655-5′
T2’ - QD565 : 3′- ACA TGT AGT GTT GAT -QD565-5′
Figure 9.23 SPFM images showing the hybridization following sequentialintroduction of T10 and T20.
308 Chapter 9
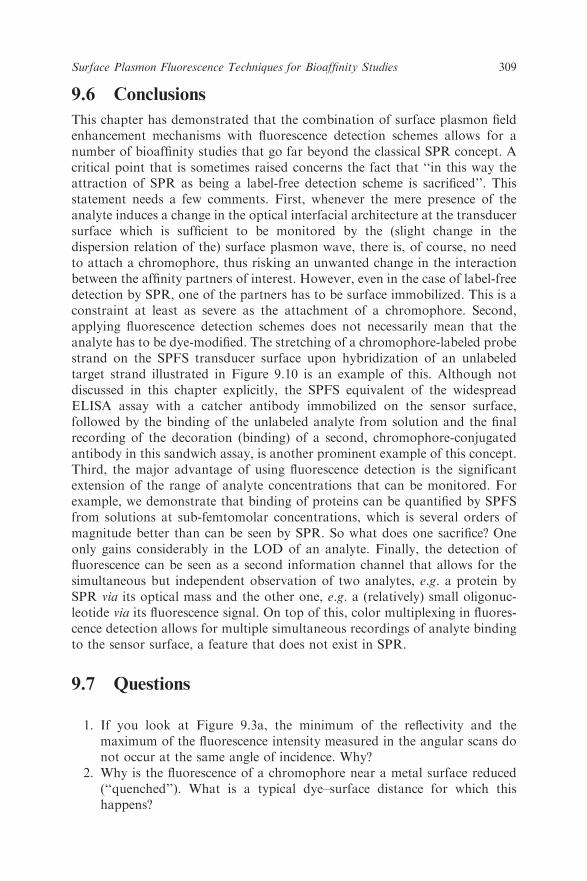
9.6 Conclusions
This chapter has demonstrated that the combination of surface plasmon fieldenhancement mechanisms with fluorescence detection schemes allows for anumber of bioaffinity studies that go far beyond the classical SPR concept. Acritical point that is sometimes raised concerns the fact that ‘‘in this way theattraction of SPR as being a label-free detection scheme is sacrificed’’. Thisstatement needs a few comments. First, whenever the mere presence of theanalyte induces a change in the optical interfacial architecture at the transducersurface which is sufficient to be monitored by the (slight change in thedispersion relation of the) surface plasmon wave, there is, of course, no needto attach a chromophore, thus risking an unwanted change in the interactionbetween the affinity partners of interest. However, even in the case of label-freedetection by SPR, one of the partners has to be surface immobilized. This is aconstraint at least as severe as the attachment of a chromophore. Second,applying fluorescence detection schemes does not necessarily mean that theanalyte has to be dye-modified. The stretching of a chromophore-labeled probestrand on the SPFS transducer surface upon hybridization of an unlabeledtarget strand illustrated in Figure 9.10 is an example of this. Although notdiscussed in this chapter explicitly, the SPFS equivalent of the widespreadELISA assay with a catcher antibody immobilized on the sensor surface,followed by the binding of the unlabeled analyte from solution and the finalrecording of the decoration (binding) of a second, chromophore-conjugatedantibody in this sandwich assay, is another prominent example of this concept.Third, the major advantage of using fluorescence detection is the significantextension of the range of analyte concentrations that can be monitored. Forexample, we demonstrate that binding of proteins can be quantified by SPFSfrom solutions at sub-femtomolar concentrations, which is several orders ofmagnitude better than can be seen by SPR. So what does one sacrifice? Oneonly gains considerably in the LOD of an analyte. Finally, the detection offluorescence can be seen as a second information channel that allows for thesimultaneous but independent observation of two analytes, e.g. a protein bySPR via its optical mass and the other one, e.g. a (relatively) small oligonuc-leotide via its fluorescence signal. On top of this, color multiplexing in fluores-cence detection allows for multiple simultaneous recordings of analyte bindingto the sensor surface, a feature that does not exist in SPR.
9.7 Questions
1. If you look at Figure 9.3a, the minimum of the reflectivity and themaximum of the fluorescence intensity measured in the angular scans donot occur at the same angle of incidence. Why?
2. Why is the fluorescence of a chromophore near a metal surface reduced(‘‘quenched’’). What is a typical dye–surface distance for which thishappens?
309Surface Plasmon Fluorescence Techniques for Bioaffinity Studies

3. Assume that the Langmuir adsorption behaviour is correct; whattype of measurements would give you the affinity constant for a bindingreaction between a surface-attached receptor and a ligand fromsolution?
4. Imagine that you study the hybridization reactions of two different targetstrands (T1 and T2, differing in their sequence by one nucleotide)from solution to surface-attached catcher probe DNA strands, withKA(T1)¼10–9 M–1 and KA(T2)¼10–7 M–1. Which concentration of thetargets would you chose to maximize mismatch discrimination?
5. What is the analogy between long-range surface plasmons and coupledpendulums?
9.8 Acknowledgements
Some of the results presented in this chapter were collected during the PhDprojects of Thorsten Liebermann, who was the first in our group to documentsurface plasmon field-enhanced fluorescence detection of hybridization reac-tions. We are grateful to Eva-Kathrin Sinner and Danfeng Yao for their helpwith PCR, to Peter E. Nielsen, Andrea Germini, Stefano Sforza, RobertoCorradini and Rosangela Marchelli for their support with PNAs and to JakubDostalek for helpful discussions concerning long-range surface plasmons.Financial support came from various projects funded by the EU (QLK1-2000-31658, ‘‘DNA-Track’’) and by the Deutsche Forschungsgemeinschaft(KN 224/13-1, 2).
References
1. T. Moses and Y.R. Shen, Phys. Rev. Lett., 1991, 67, 2003–2037.2. J.D. Swalen, J. Phys. Chem., 1979, 83, 1438–1445.3. E. Aust, S. Ito, M. Sawodny and W. Knoll, Trends Polym. Sci., 1994, 2,
313–323.4. E. Burstein, W.P. Chen, Y.J. Chen and A. Hartstein, J. Vac. Sci Technol.,
1972, 11, 1004–1019.5. H. Raether, Surface Plasmons, Springer Tracts in Modern Physics, Springer,
Berlin, 1988.6. W. Knoll, Annu. Rev. Phys. Chem., 1998, 49, 569–638.7. W. Knoll, M. Zizlsperger, T. Liebermann, S. Arnold, A. Badia, M. Liley,
D. Piscevic, F.-J. Schmitt and J. Spinke, Colloids Surf. A, 2000, 161,115–137.
8. A.W. Wark, H.J. Lee and R.M. Corn, Anal. Chem., 2005, 77, 3904.9. J. Homola, Anal. Bioanal. Chem., 2003, 377, 528.
10. B. Liedberg, C. Nylander and I. Lundstrom, Sens. Actuators, 1983, 4,299–304.
310 Chapter 9

11. S. Lofas and B. Johnsson, J. Chem. Soc., Chem. Commun., 1990,1526–1528.
12. C.E. Jordan, A.G. Frutos, A.J. Thiel and R.M. Corn, Anal. Chem., 1997,69, 4939–4947.
13. J. Spinke, M. Liley, H.J. Guder, L. Angermaier and W. Knoll, Langmuir,1993, 9, 1821–1825.
14. N. Huang, J. Voros, S.M. De Pani, M. Textor and N.D. Spencer,Langmuir, 2002, 18, 220.
15. L. Haussling, H. Ringsdorf, F.J. Schmitt and W. Knoll, Langmuir, 1991, 7,1837–1840.
16. F. Yu, D. Yao and W. Knoll, Anal. Chem., 2003, 75, 2610–2617.17. K.A. Peterlinz, R.M. Georgiadis, T.M. Herne and M. Tarlov, J. Am.
Chem. Soc., 1997, 119, 3401–3402.18. J.P. Attridge, P.B. Daniels, J.K. Deakon, G.A. Robinson and G.P.
Davidson, Biosens. Bioelectron., 1991, 6, 201–214.19. T. Liebermann and W. Knoll, Colloids Surf. A, 2000, 171, 115–130.20. T. Liebermann, W. Knoll, P. Sluka and R. Herrmann, Colloids Surf. A,
2000, 169, 337–350.21. F. Yu, B. Persson, S. Lofas and W. Knoll, J. Am. Chem. Soc., 2004, 126,
8902–8903.22. S. Ushioda and Y. Sasaki, Phys. Rev. B, 1983, 27, 1401–1404.23. W. Knoll, H. Park, E. Sinner, D. Yao and F. Yu, Surf. Sci., 2004, 570,
30–42.24. P. Schuck, Rev. Biophys. Biomol. Struct., 1997, 26, 541–566.25. P.W. Atkins and J. de Paula, Physical Chemistry, 7th edn., Oxford
University Press, 2006.26. D.G. Myszka, T.A. Morton, M.L. Doyle and I.M. Chaiken, Biophys.
Chem., 1997, 6, 127–137.27. T.A. Morton, D.G. Myszka and I.M. Chaiken, Anal. Biochem., 1995, 227,
176–185.28. C.R. MacKenzie, T. Hirama, S.J. Deng, D.R. Bundle, S.A. Narang and
N.M. Young, J. Biol. Chem., 1996, 271, 1527–1533.29. T. Neumann, M.L. Johansson, D. Kambhampati and W. Knoll, Adv.
Funct. Mater., 2002, 12, 575–586.30. H. Park, A. Germini, S. Sforza, R. Corradini, R. Marchelli and W. Knoll,
Biointerphases, 2006, 1, 113–122.31. D. Yao, J. Kim, P. Nielsen, E. Sinner and W. Knoll, Biophys. J., 2005, 88,
2745–2751.32. D. Yao, F. Yu, J. Kim, J. Scholz, P. Nielsen, E.K. Sinner and W. Knoll,
Nucleic Acids Res., 2004, 32, 177–192.33. E.K. Sinner, K. Kobayashi, T. Lehmann, T. Neumann, B. Prein, J. Ruhe,
F. Yu and W. Knoll, in Biopolymers at Interfaces, M. Malmsten, Ed., 2ndedn., Marcel Dekker, New York, 2003, pp. 583–607.
34. F. Yu, B. Persson, S. Lofas and W. Knoll, Anal. Chem., 2004, 76,6765–6770.
35. D. Sarid, Phys. Rev. Lett., 1981, 47, 1927–1930.
311Surface Plasmon Fluorescence Techniques for Bioaffinity Studies

36. D. Sarid, R.T. Deck, A.E. Craig, R.K. Hickernell, R.S. Jameson andJ. Fasano, Appl. Opt., 1982, 21, 3993–3995.
37. G.G. Nenninger, P. Tobiesoeka, J. Homola and S. Yee, Sens. Actuators B,2001, 74, 145–151.
38. A. Kasry and W. Knoll, Appl. Phys. Lett., 2006, 89, 101–106.39. R. Robelek, L. Niu, E. Schmid and W. Knoll, Anal. Chem., 2004, 15,
6160–6165.40. L. Niu and W. Knoll, Anal. Chem., 2007, 79, 2695–2707.
312 Chapter 9