Chapter 9, Service Encounter
62
CHAPTER 9 Learning Objectives Chapter Preview The Service Encounter Triad The Service Organization Contact Personnel The Customer Creating a Customer Service Orientation The Service Profit Chain Summary Key Terms and Definitions Topics for Discussion Service Benchmark: Miss Manners on Complaint Handling CHAPTER 9 The Service Encounter LEARNING OBJECTIVES After completing this chapter, you should be able to: 1. Use the service encounter triad to describe a service firm's delivery process. 2. Identify organizational features that describe the culture of a service firm. 3. Discuss the role of information technology in employee empowerment. 4. Prepare abstract questions and write situational vignettes to screen service recruits. 5. Discuss the role of the customer as coproducer. 6. Describe how elements of the service profit chain lead to revenue growth and profitability. Most services are characterized by an encounter between a service provider and a customer. Recall from Chapter 5, the Service Delivery System, that this encounter occurs above the "line of visibility" on the service blueprint. This interaction, which defines the quality of the service in the mind of the customer, has been called a "moment of truth" by Richard Normann. 1 The often brief
-
Upload
muthusamy-senthilkumaar -
Category
Documents
-
view
418 -
download
2
description
This content is uploaded purely for educational purpose not for sale
Transcript of Chapter 9, Service Encounter

CHAPTER 9
Learning Objectives
Chapter Preview
The Service Encounter Triad
The Service Organization
Contact Personnel
The Customer
Creating a Customer Service Orientation
The Service Profit Chain
Summary
Key Terms and Definitions
Topics for Discussion
Service Benchmark: Miss Manners on
Complaint Handling
Case: Amy's Ice Cream
Selected Bibliography
CHAPTER 9 SUPPLEMENT:
WORK MEASUREMENT
Time Study
CHAPTER 9
The Service Encounter
LEARNING OBJECTIVES
After completing this chapter, you should be able to:
1. Use the service encounter triad to describe a service firm's delivery process.
2. Identify organizational features that describe the culture of a service firm.
3. Discuss the role of information technology in employee empowerment.
4. Prepare abstract questions and write situational vignettes to screen service recruits.
5. Discuss the role of the customer as coproducer.
6. Describe how elements of the service profit chain lead to revenue growth and
profitability.
Most services are characterized by an encounter between a service provider and a
customer. Recall from Chapter 5, the Service Delivery System, that this encounter
occurs above the "line of visibility" on the service blueprint. This interaction, which
defines the quality of the service in the mind of the customer, has been called a
"moment of truth" by Richard Normann.1 The often brief encounter is a moment in
time when the customer is evaluating the service and forming an opinion of its
quality, A customer experiences many encounters with a variety of service providers,
and each moment of truth is an opportunity to influence the customer's perceptions of
the service quality. For example, an airline passenger experiences a series of
encounters, beginning with purchasing the ticket from a telephone reservation clerk
and continuing with baggage check-in at the airport, in-flight service, baggage claim
on arrival, and finally, the award of frequent flyer credit.
Realizing that such moments of truth are critical in achieving a reputation for
superior quality, Jan Carlzon, the CEO of Scandinavian Airlines System (SAS),
focused on these encounters in the reorganization of SAS to create a distinctive and
competitive position in terms of quality of service. According to Jan Carlzon's
Work Sampling
Sample Size
Work Methods Charts
Solved Problems
Exercises
Case: County General Hospital
参考资料
每课练习
BACK
philosophy, the organization exists to serve the front-line workers who have direct
customer contact. His revolutionary thinking stood the old organization chart on its
head, placing the customer-encounter personnel (formerly at the bottom) now at the
top of the chart. It then became everyone else's responsibility to serve those front-line
personnel who in turn served the customer. Changing the organization chart signaled
a move to refocus on satisfying the customer and managing moments of truth. It is
interesting that this implementation required dividing the company into various profit
centers down to the route level and allowing managers (now close to the customers)
the authority to make decisions on their own.2
CHAPTER PREVIEW
In this chapter, the service encounter is depicted as a triangle formed by the in-
teracting interests of the customer, service organization, and contact personnel. Each
participant in the service encounter attempts to exert control over the transaction,
leading to the need for flexibility and the empowerment of contact personnel. A
discussion of service organization culture follows, with examples of how the
founders of successful service firms established a set of values and expectations
encouraging their employees to focus on delivering exceptional service.
The activities of selecting and training contact personnel are addressed next.
Then, the many expectations and attitudes of customers are explored, as well as the
concept of the customer as coproducer. The high correlation of service quality
perceptions that are shared by contact personnel and customers leads to a discussion
of management's contribution to creating a customer service orientation among its
employees. A chapter supplement addresses the topic of work measurement.
1Richard Normann, Service Management, John Wiley & Sons, New York,
1984, p. 89. :Jan Carlzon, Moments of Truth, Ballinger, Cambridge, Mass.,
1987.
THE SERVICE ENCOUNTER TRIAD
One of the unique characteristics of services is the active participation of the cus-
tomer in the service production process. Every moment of truth involves an in-
teraction between a customer and a service provider; each has a role to play in an
environment staged by the service organization. The service encounter triad shown
in Figure 9.1 captures the relationships between the three parties in the service
encounter and suggests possible sources of conflict.
The managers of a for-profit service organization have an interest in delivering
service as efficiently as possible to protect their margins and remain competitive.
Nonprofit service organizations might substitute effectiveness for efficiency, but they
still must operate under the limits imposed by a budget. To control service delivery,
managers tend to impose rules and procedures on the contact personnel to limit their
autonomy and discretion when serving the customer. These same rules and
procedures also are intended to limit the extent of service provided for the customer
and the resulting lack of customization that might result in a dissatisfied customer.
Finally, the interaction between contact personnel and the customer has the element
of perceived control by both parties. The contact people want to control the behavior
of the customer to make their own work more manageable and less stressful; at the
same time, the customer is attempting to gain control of the service encounter to
derive the most benefit from it.
Ideally, the three parties gain much by working together to create a beneficial
service encounter. The moment of truth can be dysfunctional, however, when one
party dominates the interaction by focusing solely on his or her own control of the
encounter. The following examples illustrate the conflict that arises when each party
in turn dominates control of the encounter.
Encounter Dominated by the Service Organization
To be efficient and, perhaps, to follow a cost leadership strategy, an organization
may standardize service delivery by imposing strict operating procedures and,
thus, severely limiting the discretion of the contact personnel. Customers are pre-
sented with a few standard service options from which to choose, and personalized
service is not available. Many franchise services such as McDonald's, Jiffy Lube,
and H. & R. Block have been successful with a structural organization and
environment that dominates the service encounter. Much of their success has re-
sulted from teaching customers what not to expect from their service; however,
much of the frustration that customers experience with other institutions, labeled
pejoratively as "bureaucracies," is the result of contact personnel having no au-
tonomy to deal with individual customer's needs. Contact personnel in such or-
ganizations may sympathize with the customer but are forced to go "by the book,"
and their job satisfaction is diminished in the process.
Contact Personnel-Dominated Encounter
In general, service personnel attempt to limit the scope of the service encounter to
reduce their own stress in meeting demanding customers. When contact personnel
are placed in an autonomous position, they may perceive themselves as having a
significant degree of control over customers. The customer is expected to place
considerable trust in the contact person's judgment because of the service provider's
perceived expertise. The relationship between physician and patient best illustrates
the shortcomings of the contact personnel-dominated encounter. The patient, who is
not even referred to as a "customer," is placed in a subordinate position with no
control over the encounter. Further, an allied organization, such as a hospital in this
case, is subjected to tremendous demands placed on it by individual staff physicians
with no regard for matters of efficiency.
Customer-Dominated Encounter
The extremes of standardized and customized services represent opportunities for
customers to control the encounter. For standardized services, self-service is an
option that gives customers complete control over the limited service that is
provided. For example, at a self-service gasoline station that is equipped with a credit
card reader, the customer need not interact with anyone. The result can be very
efficient and satisfying to the customer who needs or desires very little service. For a
customized service such as legal defense in a criminal case, however, all the
organization's resources may be needed, at great cost in efficiency.
A satisfactory and effective service encounter should balance the need for control
by all three participants. The organization's need for efficiency to remain
economically viable can be satisfied when contact personnel are trained properly and
the customer's expectations and role in the delivery process are communicated
effectively. Our discussion of approaches to managing the service encounter begins

with the service organization.
THE SERVICE ORGANIZATION
The service organization establishes the environment for the service encounter. The
interaction between customer and contact personnel occurs within the context of an
organization's culture as well as its physical surroundings.
Culture
Why do you choose one service over another-Supermarket A over supermarket B,
copying service X over copying service Y, or family practitioner M over family
practitioner D? Cost, you may answer ... or ambiance or any of several other good
reasons. The bottom line, however, may be corporate culture, because the underlying
culture helps to determine the value that customers place on the service. Several
definitions of organizational culture have been proposed:
• Culture is a pattern of beliefs and expectations that is shared by the organization's
members and produces norms that powerfully shape the behavior of individuals or
groups in organizations.3
• Culture is the traditions and beliefs of an organization that distinguish it from
other organizations and infuse a certain life into the skeleton of structure.4
• Organizational culture is a system of shared orientations that hold the unit together
and give a distinctive identity.5
The founders and/or senior managers of a service organization establish, whether
purposely or unintentionally, a climate or culture that prescribes a norm of behavior
or set of values to guide employee decision making in the firm. Take, for example,
ServiceMaster, a very profitable company that provides hospitals and other
organizations with housekeeping services. Writing about ServiceMaster, Carol
Loomis discovered that the company's name embodied its value of "Service to the
Master."
Founded by a devout Baptist, the late Marion E. Wade, the company has
always described itself as driven by religious principle. The first of its
corporate objectives is "to honor God in all we do." The cafeteria wall at
ServiceMaster's suburban headquarters proclaims that "Joy cometh in the
morning," and although there are no "Cleanliness is next to Godliness" signs

around, the neatness and shine of the office project the thought.6
Choice of language is another approach to communicate values, as illustrated by the
Walt Disney Corporation. At Disney theme parks, show business terms are used
because they are in the entertainment business. Instead of Personnel there is
Casting. Employees are referred to as "cast members" to instill the appropriate
frame of mind. Cast members work either "onstage" or "backstage," but both kinds
of employees are required to "put on the show."
The examples above illustrate how an organization's values, when consistently
communicated by management, permit contact personnel to act with considerable
autonomy, because their judgment is founded on a shared set of values. These
values often are communicated by stories and legends about individual risk-taking
on behalf of the organization and its customers. Federal Express, with a motto of
"absolutely positively overnight," has many stories of extraordinary employee feats
to safeguard that service guarantee. Consider, for
3H. M. Schwartz and S. M. Davis, "Matching Corporate Culture and Business
Strategy," Organizational Dynamics, vol. 59,1981, p. 33.
4Henry Mintzberg, Minlzberg on Management: Inside Our Strange World of
Organizations, The Free Press, NewYork,1989,p.98.
5Wayne K. Hoy, C. John Tarter, and Robert B. Kottkamp, Open Schools/Healthy
Schools, Sage Publications, London, 1991, p. 5.
6Carol], Loomis, "How the Service Stars Managed to Sparkle," Fortune, June
11,1984, p. 117.
example, the pick-up driver who was faced with a collection box he was unable to
open-instead of leaving it standing on the street comer until someone could come out
to repair it, he wrestled the entire box into his vehicle so that the packages it
contained could be liberated and delivered the next day.
The organization benefits from a shared set of values, because contact personnel
are empowered to make decisions without the need for the traditional level of
supervision, which assumes that only management is vested with authority to act on
behalf of the organization.
Empowerment
For years, McDonald's has served as the model of efficient service delivery. In-
corporating the traditional mass-production philosophy of industry, McDonald's has
been successful in delivering a consistent meal to billions of customers through an
organization that could be described as "manufacturing in the field." The discretion
of contact personnel is limited by procedures and design (e.g., the trench fry scoop
that guarantees portion control). Most employees are minimum-wage teenagers, and
high turnover is the norm. The organization's structure is pyramid-shaped, with
layers of supervision from the assistant store manager, store manager, and regional
manager to corporate "consultants," to ensure consistency of service delivery across
all locations.
A new model of service organization now is emerging that has a structure best
described as an inverted T. In this organization, the layers of supervision are
drastically reduced, because contact personnel are trained, motivated, and supplied
with timely, computer-based information that enables them to manage the service
encounter at the point of delivery.
Jan Carlzon, the innovative president of SAS, is quoted as saying:
Instructions only succeed in providing employees with knowledge of their
own limitations. Information, on the other hand, provides them with a
knowledge of their opportunities and possibilities ... To free someone from
rigorous control by instructions, policies and orders, and to give that person
freedom to take responsibility for his ideas, decisions and actions, is to release
hidden resources which would otherwise remain inaccessible to both the
individual and the company ... A person who has information cannot avoid
taking responsibility-7
Perhaps it is surprising that Taco Bell has become the new service model of
employee empowerment. Other firms adopting this new model include Service-
Master, Marriott, and Dayton Hudson. Senior managers of these firms all share a
belief that people want to do good work-and will do so if given the opportunity.
Consequently, they have made the following commitments: 1) to invest in people as
much as, or more than, in machines; 2) to use technology to support contact
personnel rather than to monitor or replace them; 3) to consider the recruitment and
training of contact personnel as critical to the firm's success; and 4) to link
compensation to performance for employees at all levels. In this type of organization,
a much-reduced middle management no longer has the traditional supervisory role;
instead, middle managers become facilitators for the front-line or contact personnel.

More important, investment in computer infor-
7W. E. Sasser, jr., C. W. L. Hart, and ]. L. Heskett, The Service Management Course,
The Free Press, New York, 1991, p. 97.
mation systems is necessary to supply the front-line personnel with the ability to
resolve problems as they arise and to ensure a quality service encounter.8
Empowered contact personnel must be motivated, informed/ competent,
committed, and well-trained. Front-line personnel should exhibit the ability to take
responsibility, manage themselves, and respond to pressure from customers.
CONTACT PERSONNEL
Ideally, customer contact personnel should have personality attributes that include
flexibility, tolerance for ambiguity, an ability to monitor and change behavior on the
basis of situational cues, and empathy for customers. The last attribute (i.e., empathy
for customers) has been found to be more important than age, education, sales-related
knowledge, sales training, and intelligence.
Some individuals may find front-line service to be boring and repetitive, whereas
others see the job as providing an opportunity to meet and interact with a variety of
people. Those with the necessary interpersonal skills may gravitate toward high-
contact service jobs, but a selection process still is required to ensure high-quality
moments of truth.
Selection
No reliable tests exist to measure a person's service orientation; however, a variety of
interviewing techniques have proven to be useful. Abstract questioning, the
situational vignette, and role playing all have been used in evaluating potential front-
line employees.
Abstract Questioning
The questions asked in the abstract interview are open-ended. They provide
insights regarding an applicant's ability to relate the immediate service situation to
information collected from past experience. An example of a question that assesses
an applicant's attention to the environment would be "From your past work
experience, what type of customer was most difficult for you to deal with and why?"
To determine if an applicant actively collects information, a questioner might ask,
"What was the customer's primary complaint or negative characteristic?" Some final
questions to evaluate the applicant's interpersonal style could be "How did you
handle the customer?" and "What would be the ideal way to deal with that type of
customer?"
Abstract questioning also can be used to reveal a person's willingness to adapt.
An effective employee will take notice of details in his or her personal life as well as
on the job. People who consider the events around them and can describe their
significance usually are able to learn more as well as faster.
Because of their nature and preparation for the interview, some applicants will be
better able than others to talk extensively about their past experiences. Careful
listening and probing by the interviewer for the substance of an answer to an
abstract question will lessen the possibility of being deceived with
8L. A. Schlesinger and J. L. Heskett, "The Service-Driven Service Company,"
Harvard Business Review, September-October 1991, p. 72.
"puffery." Finally, there is no assurance that the ability to reflect on past events
necessarily will guarantee that such perceptiveness and flexibility will transfer to the
job.
Situational Vignette
A situational vignette interview requires the applicant to answer questions re-
garding a specific situation. For example, consider the following situational vignette:
The day after a catering service has catered a large party, a customer returns
some small cakes, claiming they were stale. Although the man is demanding a
refund, he is so soft-spoken and timid that you can hardly hear him across the
counter. You know that your business did not make those cakes, because they
don't look like your chef's work. What would you do?
Presenting a situation like this may reveal information regarding an applicant's
instincts, interpersonal capabilities, common sense, and judgment. To gain more
information about a candidate's adaptability, further questions about the situation can
be asked: "How would you handle the man if, suddenly, he were to become irate and
insistent? What steps would you take to remedy the situation?"
Situational vignettes provide an opportunity to determine whether applicants are
able to "think on their feet." An applicant with good communication skills, however,
still may not indicate clearly a genuine desire to serve customers or an empathic
nature. Again, the interviewer must pay close attention to the substance of an
applicant's response in addition to the way it is delivered.
Role Playing
Role playing is an interviewing technique that requires applicants to participate in
a simulated situation and to react as if this service environment were real. Role
playing often is used in the final phase of recruitment, and others in the organization
are asked to cooperate by posing as "actors" for the situation.
Role playing provides a way for an interviewer to observe an applicant under
stress. Interviewers using this technique may probe and change the situation as the
session progresses. This method allows for more realistic responses than either the
abstract questioning or situational vignette interviews; applicants are required to use
their own words and react to the immediate situation instead of describing them.
Although role playing provides an excellent opportunity to observe a candidate's
strengths and weaknesses in a realistic customer encounter, direct comparison of
applicants is difficult. Role playing does require careful scripting, and the "actors"
need to rehearse their roles before the interview.
Training
Most training manuals and employee handbooks for customer-contact personnel are
devoted to explaining the technical skills that are needed to perform the jobs. For
example, they often detail explicitly how to fill out guest reports, use cash registers,
dress properly, and enforce safety requirements, but customer interaction skills are
dismissed with a simple comment to be pleasant and smile.
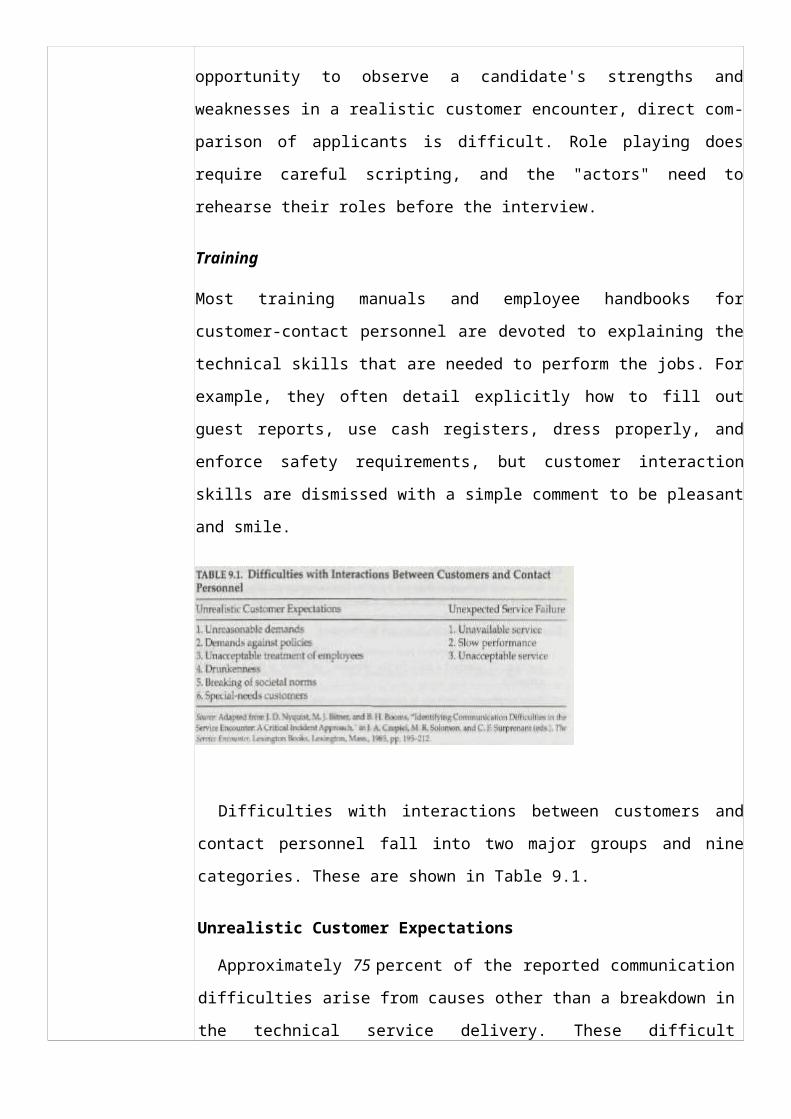
Difficulties with interactions between customers and contact personnel fall into
two major groups and nine categories. These are shown in Table 9.1.
Unrealistic Customer Expectations
Approximately 75 percent of the reported communication difficulties arise from

causes other than a breakdown in the technical service delivery. These difficult
encounters involve customers with unrealistic expectations that cannot be met by
the service delivery system. Examples include passengers who bring oversize
luggage aboard an airplane or diners who snap fingers and yell at servers.
Unrealistic customer expectations can be broken down into six categories:
1. Unreasonable demands. Services that the firm cannot offer, or customer de
mands that require inappropriate time and attention (e.g., "I want to carry all my
luggage on board," or "Please sit with me; I'm afraid of flying").
2. Demands against policies. Requests that are impossible to fulfill because of
safety regulations, laws, or company policies (e.g., "We've been waiting an hour
for takeoff, and I must have my smoke," or "Our party of ten wants separate
checks for the meal").
3. Unacceptable treatment of employees. Mistreatment of employees with verbal or
physical abuse (e.g., "You idiot! Where is my drink?" or a diner pinching a
waitress).
4. Drunkenness. Intoxicated customer requiring special attention (e.g., "Bring me
another drink!" or an intoxicated passenger who requires assistance to get off the
plane).
5. Breaking of societal norms. Customers breaking societal norms in general (e.g.,
"We can't sleep because of the loud TV in the next apartment," or guests
swimming nude in the pool).
6. Special-needs customers. Special attention to customers with psychological,
medical, or language difficulties (e.g., "My wife is hemorrhaging," or "Wieviel
kostet das?").
Unexpected Service Failure
A failure in the service delivery system places a communication burden on the
contact personnel. Service failures, however, provide a unique opportunity for
contact personnel to demonstrate innovation and flexibility in their recovery. Three
categories of service failures can be identified:
1. Unavailable service. Services that normally are available or expected are lacking
(e.g., "I reserved a table by the window," or "Why is the ATM out of order?").
2. Slow performance. Service is unusually slow, creating excessive customer,
waiting (e.g., "Why hasn't our plane arrived?" or "We've been here for an hour,
and no one has taken our order").

3. Unacceptable service. Service does not meet acceptable standards (e.g., "My seat
doesn't recline," or "Eeegads, there's a hair in my soup!").
Unavoidable communication difficulties with customers require contact per-
sonnel whose training and interpersonal skills can prevent a bad situation from
becoming worse. Programs can be developed to train contact personnel to use
prescribed responses in given situations. For example, when faced with unreasonable
demands-as illustrated above for category 1 difficulties-the server can appeal to the
customer's sense of fairness by pointing out that the needs of other customers would
be jeopardized. Actual scripts also can be developed and rehearsed for each
anticipated situation. For example, in response to "I want to carry all my luggage on
board," the employee need only say, "I'm very sorry, but federal safety regulations
permit a passenger only two carry-on pieces small enough to be stored under the seat
or overhead. May I check your larger pieces all the way to your final destination?"
Another approach involves general training in communication skills. This
approach should help contact personnel to anticipate the types of exchanges they
might encounter, expand their repertoire of possible responses, and develop decision
rules for choosing appropriate responses to a given situation. Role playing can
provide an ideal setting for gaining this communication experience. Contact
personnel who are well trained will be able to control the service encounter in a
professional manner, and the results will be increased satisfaction for the customer
and decreased stress and frustration for the provider.
THE CUSTOMER
Every purchase is an event of some importance for the customer, whereas the same
transaction usually is routine for the service provider. The emotional involvement
that is associated with the routine purchase of gasoline at a self-serve station or an
overnight stay at a budget hotel is minor, but consider the very personal and dramatic
roles played by a customer taking an exotic vacation or seeking medical treatment.
Unfortunately, it is very difficult for the bored contact personnel, who see hundreds
of customers a week, to maintain a corresponding level of emotional commitment.
Expectations and Attitudes
Service customers are motivated to look for a service much as they would for a
product; similarly, their expectations govern their shopping attitudes. Gregory Stone
developed a now-famous topology in which shopping-goods customers were
classified into four groups.9 The definitions that follow have been modified for the
service customer:
1. The economizing customer. This customer wants to maximize the value obtained
for his or her expenditures of time, effort, and money. He or she is a demanding
and sometimes fickle customer who looks for value that will test the competitive
strength of the service firm in the market. Loss of these cus tomers serves as an
early warning of potential competitive threats.
2. The ethical customer. This customer feels a moral obligation to patronize socially
responsible firms. Service firms that have developed a reputation for community
service can create such a loyal customer base; for example, the Ronald McDonald
House program for the families of hospitalized children has helped the image of
McDonald's in just this way.
3. The personalizing customer. This customer wants interpersonal gratification, such
as recognition and conversation, from the service experience. Greeting customers
on a first-name basis always has been a staple of the neighbor hood family
restaurant, but computerized customer files can generate a similar personalized
experience when used skillfully by front-line personnel in many other businesses.
4. The convenience customer. This customer has no interest in shopping for the
service; convenience is the secret to attracting him or her. Convenience cus
tomers often are willing to pay extra for personalized or hassle-free service; for
example, supermarkets that provide home delivery may appeal to these customers.
The attitude of customers regarding their need to control the service encounter
was the subject of a study investigating customers' decision-making processes when
they were confronted with the choice between a self-service option and the traditional
full-service approach.10 Customers who were interviewed appeared to be using the
following dimensions in their selection: 1) amount of time involved, 2) customer's
control of the situation, 3) efficiency of the process, 4) amount of human contact
involved, 5) risk involved, 6) amount of effort involved, and 7) customer's need to
depend on others.
It is not surprising that customers who were interested in the self-service option
found the second dimension (i.e., customer's control of the situation) to be the most
important factor in choosing that option. The study was conducted over a variety of
services, ranging from banks and gas stations to hotels and airlines.
9Gregory P. Stone, "City Shoppers and Urban Identification: Observations on the
Social Psychology of City Life," American journal of Sociology, July 1954, pp. 36-43.
10John E. G. Bateson, "The Self-Service Consumer: Empirical Findings," in L. Berry,
L Shostack, and G. Upah (eds.), Marketing of Services, American Marketing
Association, Chicago, 1983, pp. 76-83.
Services competing on a cost leadership strategy can make use of this finding by
engaging the customer as a coproducer to reduce costs.
The Customer as Coproducer11
In the service encounter, both the provider and the customer have roles to play in
transacting the service. Society has defined specific tasks for service customers to
perform, such as the procedure required for cashing checks at a bank. Diners in some
restaurants may assume a variety of productive roles, such as assembling their meals
and carrying them to the table in a cafeteria, serving themselves at a salad bar, or
busing their own tables. In each case, the customer has learned a set of behaviors that
is appropriate for the situation. The customer is participating in the service delivery
as a partial employee with a role to play and is following a script that is defined by
societal norms or implied by the particular design of the service offered.
Customers possess a variety of scripts that are learned for use in different service
encounters, Following the appropriate script allows both the customer and service
provider to predict the behavior of each other as they play out their respective roles.
Thus, each participant expects some element of perceived control in the service
encounter. Difficulties can arise, however, when new technology requiring a new or
redefined script is introduced into the service encounter.
Customer resistance to new forms of service transactions-such as the introduction
of Universal Product Codes in supermarkets, which removed the need for item
pricing, and automated teller machines (ATMs) in banking, which eliminated the
need for human interaction-may be explained by the need to learn a radically new
script. What once was a "mindless" routine service encounter now requires some
effort to learn a new role. For example, when ATMs were first introduced, a sample
machine was placed in the bank lobby so that customers could practice their new
role.
Teaching customers a new role can be facilitated if the transition becomes a
logical modification of past behavior. Public acceptance of the Windows operating
system for PCs can be attributed to the fact that all applications share the same
interface; thus, only one script must be learned.
CREATING A CUSTOMER SERVICE ORIENTATION12
A study of 23 branch banks revealed a high correlation between customers and
employees' perceptions of service quality. Each dot in Figure 9.2 represents data from
a different branch bank. Employees were asked: "How do you think the customers of
your bank view the general quality of the service they receive in your branch?"
Customers were asked: "Describe the general quality of the ser-
11 Adapted from M. R. Solomon, C. F. Surprenant, J. A. Czepiel, and E. G. Gutman,
"A Role Theory Perspective on Dyadic Interactions: The Service Encounter," Journal
of Marketing, vol. 49, Winter 1985, pp. 99-111.12Adapted from Benjamin Schneider, "The Service Organization: Climate Is Crucial,"
Organizational Dynamics, Autumn 1980, pp. 52-65.
vice received in your branch." Both groups graded service on the same six-point
scale.
Further analysis showed that customers perceived better service in branches where
employees reported the following:
1. There is a more enthusiastic service emphasis.
2. The branch manager emphasizes service as personnel perform their roles.
3. There is an active effort to retain all customer accounts, not just large-account
holders.
4. The branch is staffed with sufficient, well-trained tellers.
5. Equipment is well maintained, and supplies are plentiful.
In addition, when employees described their branch as one in which the manager
emphasized customer service, customers not only reported that service was superior
but, more specifically, that:
1. Tellers were courteous and competent.
2. Staffing levels were adequate.
3. The branch appeared to be well administered.
4. Teller turnover was low.
5. The staff had positive work attitudes.
From this study, it appears that when employees perceive a strong service
orientation, customers report superior service. Creating a customer service ori-
entation results in superior service practices and procedures that are observable by
customers and, further, seem to fit employee views of the appropriate style for
dealing with customers. Thus, even though employees and customers view service
from different perspectives, their perceptions of organizational effectiveness are
positively related.
A lesson for management also is suggested. The way management relates to the
contact personnel (or internal customers) is reflected in how the external customers
are treated.
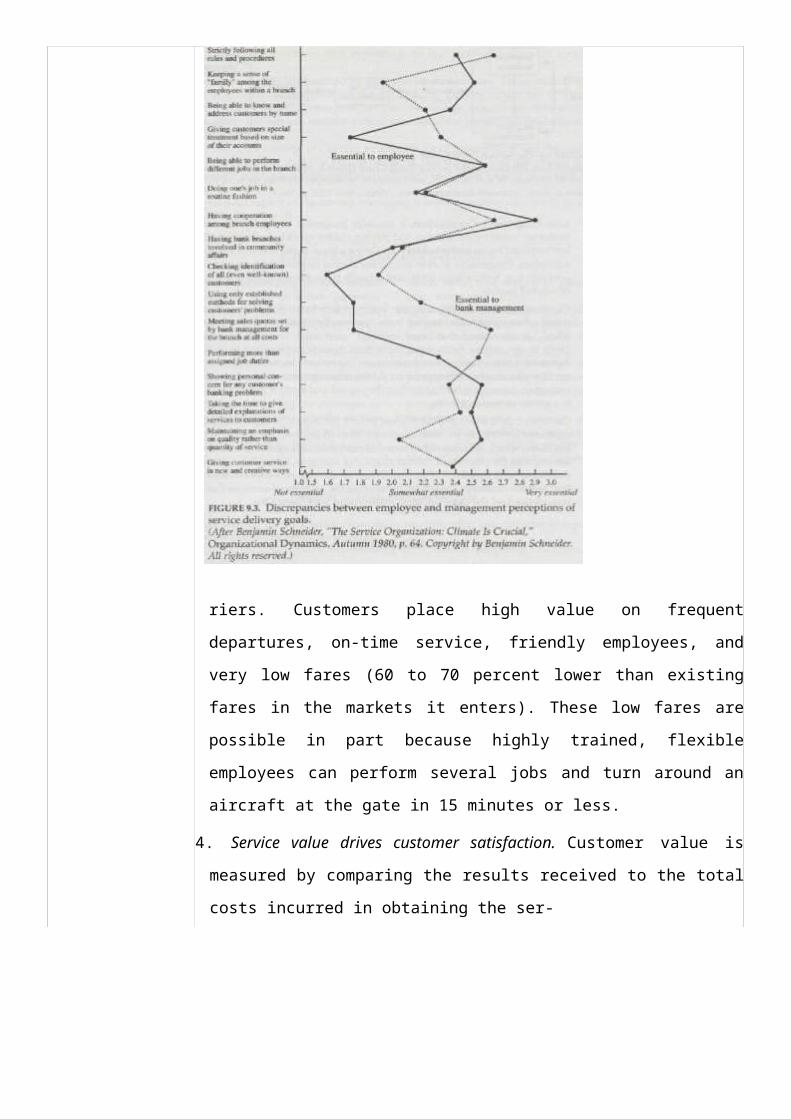
As shown in Figure 9.3, however, some discrepancies between employee and
management perceptions of service goals also were evident in this same study. This
lack of congruence between employees and management eventually affects customer
perceptions of service quality, because management emphasis in a service
organization cannot be hidden from those who are served.
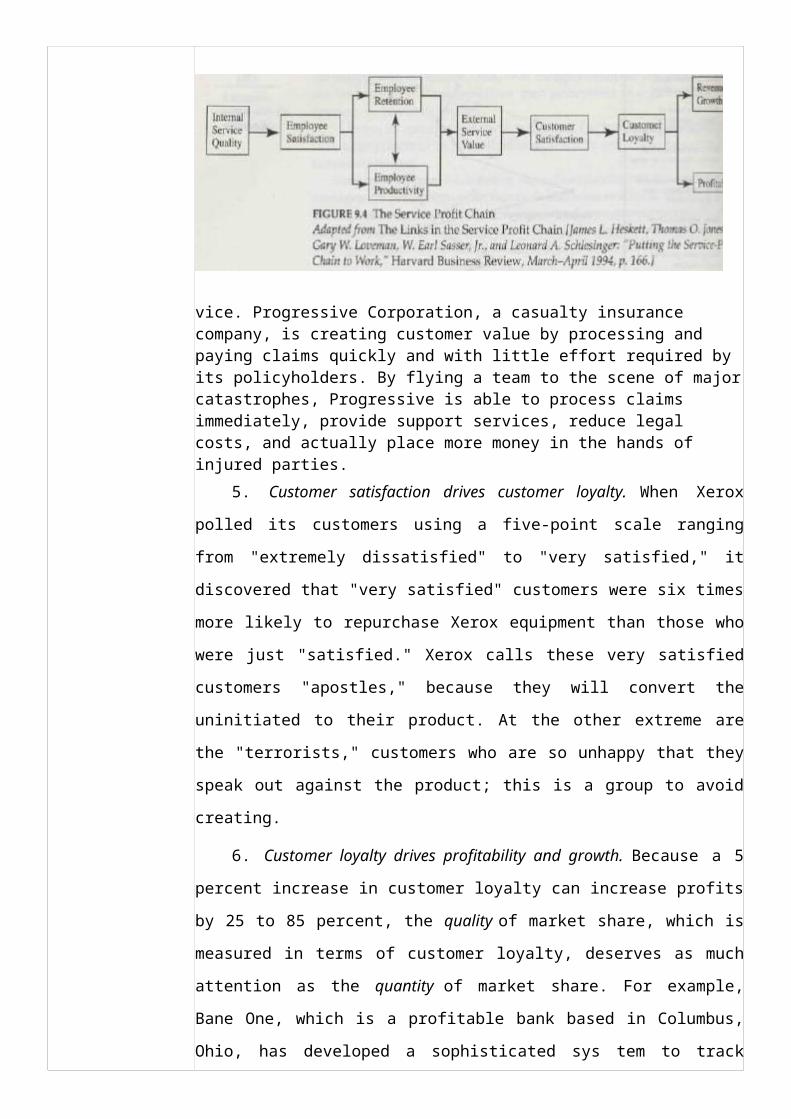
THE SERVICE PROFIT CHAIN13
The service profit chain proposes a series of relationships linking profitability,
customer loyalty, and employee satisfaction, retention, and productivity. As Figure
9.4 shows, profitability and revenue growth are derived from loyal customers, and
loyal customers result from satisfaction, which is influenced by the perceived value
of the service. Service value is created by satisfied, committed, and productive
employees, and employee satisfaction is generated by investing in information
technology, training, and a policy of employee empowerment.
1. Internal quality drives employee satisfaction. Internal quality describes the en
vironment in which employees work, and it includes employee selection and
development, rewards and recognition, access to information to serve the
customer, workplace technology, and job design. For example, at USAA, a
financial services company serving military officers, telephone service rep-
resentatives are supported by a sophisticated information system that puts
complete customer information files on their monitor when a customer gives them
a membership number. The facility is located in suburban San Antonio on acres
of property and resembles a small college campus. Using 75 classrooms, state-of-
the-art job-related training is an expected part of every one's work experience.
2. Employee satisfaction drives retention and productivity. In most service jobs, the
real cost of employee turnover is loss of productivity and decreased customer
satisfaction. In personalized service firms, low employee turnover is linked
closely to high customer satisfaction. For example, the cost of losing a valued
broker at a securities firm is measured by the loss of commissions during the time
his or her replacement is building relationships with customers. Employee
satisfaction also can contribute to productivity. Southwest Airlines has
consistently been the most profitable airline in part because of its high rate of
employee retention, with turnover of less than 5 percent per year—the lowest in
the industry.
3. Employee retention and productivity drives service value. At Southwest Airlines,
customer perceptions of value are very high even though the airline does not
assign seats, offer meals, or integrate its reservation system with other car-
l3Adapted from J. L. Heskett, T. O. Jones, G. W. Loveman, W. E. Sasser, Jr., and L A.
Schlesinger, "Putting the Service-Profit Chain to Work," Harvard Business Review,
March-April 1994, pp. 164-174.
riers. Customers place high value on frequent departures, on-time service, friendly
employees, and very low fares (60 to 70 percent lower than existing fares in the
markets it enters). These low fares are possible in part because highly trained,
flexible employees can perform several jobs and turn around an aircraft at the gate
in 15 minutes or less.
4. Service value drives customer satisfaction. Customer value is measured by com-
paring the results received to the total costs incurred in obtaining the ser-
vice. Progressive Corporation, a casualty insurance company, is creating customer

value by processing and paying claims quickly and with little effort required by its policyholders. By flying a team to the scene of major catastrophes, Progressive is able to process claims immediately, provide support services, reduce legal costs, and actually place more money in the hands of injured parties.
5. Customer satisfaction drives customer loyalty. When Xerox polled its
customers using a five-point scale ranging from "extremely dissatisfied" to "very sat-
isfied," it discovered that "very satisfied" customers were six times more likely to
repurchase Xerox equipment than those who were just "satisfied." Xerox calls these
very satisfied customers "apostles," because they will convert the uninitiated to their
product. At the other extreme are the "terrorists," customers who are so unhappy that
they speak out against the product; this is a group to avoid creating.
6. Customer loyalty drives profitability and growth. Because a 5 percent
increase in customer loyalty can increase profits by 25 to 85 percent, the quality of
market share, which is measured in terms of customer loyalty, deserves as much
attention as the quantity of market share. For example, Bane One, which is a
profitable bank based in Columbus, Ohio, has developed a sophisticated sys tem to
track customer loyalty by measuring the number of services that cus tomers use and
the depth of their relationship with Bane One.
SUMMARY
The service encounter is viewed as a triad, with the customer and contact per-
sonnel both exercising control over the service process in an environment that is
defined by the service organization. The importance of flexibility in meeting cus-
tomer needs has resulted in many service organizations empowering their contact
personnel to exercise more autonomy.
Giving employees more discretion requires a selection process that identifies
applicants with the potential for adaptability in their interpersonal behaviors.
Communication difficulties with customers will arise even in the best of cir-
cumstances, however. Unrealistic customer expectations and unexpected service
failures must be dealt with by the contact personnel as they arise. Training to
anticipate possible situations and developing "scripts" to respond to problems are
two important measures that contribute to the professionalism of service providers.
Customers can be classified by their service expectations. Those with a need for
control are candidates for self-service options. Viewing customers as coproducers
returns us to the concept of "scripts." In this case, customers follow scripts to
facilitate the service, and the scripts provide some behavioral predictability in the
encounter.
Finally, the concept of creating a customer service orientation was discussed with
reference to a study of branch banks. In this study, it was discovered that customers
and contact personnel share similar views of the quality of service delivered.
Another aspect of the service encounter is service quality, which will be explored
in Chapter 10.
KEY TERMS AND DEFINITIONS
Abstract questioning an open-ended question used to screen potential employees by
revealing a candidate's ability to adapt and use interpersonal skills.
Culture the shared beliefs and values of an organization that guide employee
decision making and behavior in the firm.
Coproducer viewing the customer as a productive resource in the service delivery
process, which requires roles to play (e.g., busing his or her lunch table) and scripts
to follow (e.g., using an ATM).
Empowerment providing contact personnel with the training and information to
make decisions for the firm without close supervision.
Service encounter triad a triangle depicting the balance of goals among the service
organization, contact personnel, and customer.
Situational vignette a service encounter situation that can test a candidate's ability to
"think on her or his feet" and to use good judgment.
TOPICS FOR DISCUSSION
1. How does the historical image of service as servitude affect today's customer
expectations and service employee behavior?
2. What are the organizational and marketing implications of considering a customer
as a "partial employee"?
3. Comment on the different dynamics of one-on-one service and group service in
regard to perceived control of the service encounter.
4. How does use of a "service script" relate to service quality?
5. the roles played by customers are determined by cultural norms, how can services
be exported?
CASE: AMY'S ICE CREAM4
Amy's Ice Cream is a business that was founded in Austin, Texas, and has expanded
to several other Texas cities. When asked about the driving force behind it, Phil Clay,
the production manager, explained that "while the product is of excellent quality and
does come in some unique flavors, ultimately ice cream is ice cream. One can just as
easily go to Swensen's or the Marble Slab to get great ice cream. Service is what dif-
ferentiates Amy's from other ice cream stores and keeps customers coming back

again and again." And indeed, the service at Amy's is unique.
Amy Miller, the owner and founder, got her start in the ice cream business when
she worked for Steve's Ice Cream in Boston, a store whose gimmick was mashing
toppings into ice cream. She recalls how Harvard and M.I.T. graduates would work
at the store-obviously for reasons other than the great salary and fringe benefits. She
quickly realized that this was a business that instantly made its customers happy.
Working in an ice cream store was a "feel-good" occupation, which lured such bright
workers who could easily make much more money working almost anywhere else.
When she opened the first Amy's Ice Cream in October 1984, she had two
philosophies: one that an employee should enjoy what he or she does, and another
that the service as well as the ice cream should make the customer smile. These
philosophies have provided the foundation for a business that more than one decade
later is firmly established and thriving.
In the beginning, theater majors and artists often were hired as servers, because the
idea of enjoying what they were doing was just as appealing to them as making
money. These outgoing and creative employees were very skilled at projecting their
colorful personalities across the counter. They joked and interacted with customers
while filling their orders. Customers were drawn to the fun and variety of the service,
which might be described as "ice cream theater," and once drawn, the customers
returned again and again for repeat performances.
How does Amy's recruit employees who are up to "performing"? Originally, the
employment application form was rather casual, simply handwritten and
mimeographed. Mr. Clay recalls, however, that one day he was out of forms when a
very large man asked for a copy. The man became somewhat belligerent at being
told none was available, so Mr. Clay whipped
14prepared by Bridgett Gagne, Sandhya Shardanand, and Laura Urquidi under the
supervision of Professor James A. Fitzsimmons.
out a paper bag-the only writing surface under the counter-and offered it as an
"alternate" form. The applicant was satisfied and carried away his form to complete!
When Mr. Clay relayed this story to Amy, she said the paper bag would work just
fine, and it became the new "official" application form. In fact, it has proven to be a
very good indicator of whether an applicant is willing and able to express herself or
himself both easily and creatively. A person who uses the bag just to write down the
usual biographical information (i.e., name, address, Social Security number, and so

on) probably will not be as entertaining a scooper as one who makes it into a puppet
or hot air balloon. Getting "the sack" at Amy's takes on a whole new meaning.
Applicants who pass the sack test are then interviewed.
New employees go through an on-the-job training process. One part of this training
concerns ice cream procedures so that servers can deliver a consistent product. The
other part teaches them to express themselves from behind the counter, which
includes recognizing which customers enjoy the revelry and which just want to be
left alone, as well as how far the kidding can be taken with different customers. In
general, employees are free to interact theatrically with those customers who want to
do so.
Amy's operates on an approximate three-percent profit margin. Consequently, the
servers are minimum-wage, and about 80 percent of them are part-time workers who
receive no additional benefits. In fact, most managers make less than $15,000 per
year, and there is a $30,000 cap for all employees-including Amy. In view of the low
remuneration, how is Amy's Ice Cream always able to recruit the high-quality help
that translates into satisfied customers?
Well, they do get Amy's Ice Cream T-shirts at cost and all the ice cream they can
eat! Perhaps the major reason, however, is that Amy's is freedom-oriented rather than
rules-oriented. The only "uniform'' an employee must wear is an apron, whose
primary function is to project a sense of continuity behind the counter. A hat also is
de rigueur, but the employee is free to choose any hat as long as it effectively
restrains the hair. In addition, the employee may wear any clothing that suits his or
her mood that day as long as it is not soiled, political, or excessively revealing.
Employees can bring their own music, keeping in mind their type of clientele, to
play in their stores. For example, an Amy's located in a downtown nightspot district
draws a young, exuberant crowd that would appreciate lively music, whereas an
Amy’s located in an upscale shopping mall attracts a clientele whose musical tastes
might be a bit more quiet.
The design of each store and the artwork displayed there tend to be colorful and
eclectic, but again, the employees are free to make contributions. Amy's employs a
local artist to decorate all stores; still, the individual managers have considerable say
in what they feel is desirable for their own location. Often, the artwork is an

exhibition of local artists' efforts.
Everyone does everything that needs to be done in the store. If the floor needs to be
cleaned, the manager is just as likely to do it as a scooper. There is a very strong
sense of teamwork and camaraderie. Employee meetings are usually held at 1 am,
after the last Amy's Ice Cream has closed for the night. Door prizes are offered to
encourage attendance.
Apparently, it is a lifestyle choice to work for Amy's. These employees are people
who do not want a "real job” in which they would have to wear certain clothes, work
certain hours, and not have nearly as much fun. Obviously, money is not the major
motivation, and it may be that the lack of big money is one of the unifying forces
among employees.
Amy's Ice Cream has created what is definitely a "nonmainstream environment,"
which many feel is responsible for the legions of happy customers who keep the
business merrily dipping along.
Questions
1. Describe the service organization culture at Amy's Ice Cream.
2. What are the personality attributes of the employees who are sought by Amy's
Ice Cream?
3. Design a personnel selection procedure for Amy's Ice Cream using abstract
questioning, a situational vignette, and/or role playing.
SELECTED BIBLIOGRAPHY
Albrecht, Karl: "Achieving Excellence in Service," Training and Development
journal, vol. 39, no. 12, December 1985, pp. 64-67.
Bateson, J.: "Perceived Control and the Service Encounter," in J. A. Czepiel, M. R.
Solomon, and C. F. Surprenant (eds.), The Service Encounter, Lexington Books,
Lexington, Mass.,
1985, pp. 76-83. Berry, L. L: "The Employee as Customer," journal of Retailing
Banking, vol. 3, no. 1, March 1981, pp. 33-40.
Bitner, Mary Jo: "Evaluating Service Encounters: The Effects of Physical
Surroundings and Employee Responses," Journal of Marketing, vol. 54, no. 2, April
1990, pp. 69-82.
------ B. H. Booms, and L. A. Mohr: "Critical Service Encounters: The Employee's
Viewpoint," Journal of Marketing, vol. 58, October 1994, pp. 95-106.
Bitran, Gabriel R., and Johannes Hoech: "The Humanization of Service: Respect at
the Moment of Truth," Sloan Management Review, vol. 31, no. 2, Winter 1990, pp.
89-96
Bowen, D. E., and E. L. Lawler: "Empowering Service Employees," Sloan
Management Review, Summer 1995, pp. 73-84.
Carlzon, Jan; Moments of Truth, Ballinger, Cambridge, Mass., 1987. Chase, R. B.:
"The 10 Commandments of Service System Management," Interfaces, vol. 15, no. 3,
May-June 1985, pp. 68-72.
Gronroos, Christian: Service Management and Marketing, Lexington Books,
Lexington, Mass., 1990.
Heskett, J. L.: "People and the Service Culture," Managing in the Service Economy,
Harvard Business School Press, Boston, 1986, pp. 117-134.
------, T. O. Jones, G. W. Loveman, W. E. Sasser, Jr., and L. A. Schlesinger: "Putting
the Service-Profit Chain to Work," Harvard Business Review, March-April 1994,
pp, 164-174.
Hollander, S. C; "A Historical Perspective on the Service Encounter," in J. A.
Czepiel,M. R. Solomon, and C. F, Surprenant (eds.), The Service Encounter,
Lexington Books, Lexington, Mass., 1985, pp. 49-65.
Kelly, J., J. Donnelly, and S. Skinner: "Customer Participation in Service Production
and Delivery," Journal of Retailing, vol. 66, no. 3,1990, pp. 315-335.
Jones, T. 0., and W. E. Sasser, Jr.: "Why Satisfied Customers Defect," Harvard
Business Review, November-December 1995, pp. 88-99.
Mill, R. C: "Managing the Service Encounter," The Cornell H.R.A. Quarterly,
February 1986, pp. 39-46,
Mills, P. K., R. B. Chase, and N. Margulies: "Motivating the Client/Employee
System as a Service Production Strategy," Academy of Management Review, vol.
8, no. 2,1983, pp. 301-310.
Nyquist, J. D., M. J. Bitner, and B. H. Booms: "Identifying Communication
Difficulties in the Service Encounter: A Critical Incident Approach," in J. A.
Czepiel, M. R. Solomon, and C. F. Surprenant (eds.), The Service Encounter,
Lexington Books, Lexington, Mass., 1985, pp. 195-212.
Schlesinger, Leonard A.: "Enfranchisement of Service Workers," California
Management Review, Summer 1991, pp. 83-101.
------ : "Breaking the Cycle of Failure in Services," Sloan Management Review,
Spring 1991, pp. 17-28.
,------and J. L. Heskett: "The Service-Driven Service Company," Harvard Business
Review, September-October 1991, pp. 71-81.
Schneider, Benjamin, and Daniel Schechter: "Development of a Personnel Selection
System for Service Jobs," in S. W. Brown, E. Gummesson, B. Edvardsson, and B.
Gustafson (eds.), Service Quality: Multidisciplinary and Multinational
Perspectives, Lexington Books, Lexington, Mass., 1991, pp. 217-235.
------ , and D. E. Bowen: Winning the Service Game, Harvard Business School Press,
Boston, 1995.
Shiffler, R. E., and R. W. Coye: "Monitoring Employee Performance in Service
Operations," International Journal of Operations and Production Management,
vol. 8, no. 2,1988, pp. 5-13.
Solomon, M. R.: "Packaging the Service Provider," The Service Industries Journal,
vol. 5, no. 1,1985, pp. 65-72.
------ , C. F. Surprenant, J. A. Czepiel, and E. G. Gutman: "A Role Theory
Perspective on Dyadic Interactions: The Service Encounter," Journal of Marketing,
vol. 49, Winter 1985, pp. 99-111.
Walker, J. A.: "Service Encounter Satisfaction: Conceptualized," Journal of Services
Marketing, vol. 9, no. 1,1995, pp. 5-14.
Wehrenberg, Stephen B.: "Front-line Interpersonal Skills a Must in Today's Service
Economy," Personnel Journal, vol. 66, no. 1, January 1987, pp. 115-118.
Chapter 9 Supplement: Work Measurement

Time Study
This technique of work measurement known as time study is used to develop
standards of performance. Management can use these standard times for many
purposes, such as to determine staffing needs, allocate tasks to jobs, develop standard
costs, evaluate employee performance, and establish wage payment plans. {Recall
the standard times attached to critical operations on the service blueprint.)
Time study involves identifying and measuring the individual work dements of
repetitive jobs. These repetitive jobs also are called work cycles. For example,
consider the responsibilities of the person who serves salads at your local cafeteria. A
particular work cycle for this server might include the elements of retrieving a dish,
filling the dish, adding a dressing, and handing the dish to the diner.
Measurements are made with a stopwatch, and the time when each element is
completed is recorded on an observation sheet such as that shown in Table 9.2. The
variability of the element times and the level of confidence or accuracy that is desired
provide a statistical basis for determining the number of cycles to observe.
Our example worksheet contains a record of the observations of a server who
wraps silverware into napkins and repeats the sequence, or cycle, ten times. Each
column represents one finished place setting. The stopwatch is started as the server
begins positioning the napkin. The first reading (R), in hundredths of a minute on the
watch, is noted when the server reaches for the silverware. The second reading is
made after the last piece of silverware is placed on the napkin, and the third reading
is noted after the napkin is rolled around the silverware. The final reading for cycle 1
is made after the rolled napkin is placed in a box. In our example, the actual readings
for elements 1 through 4 in cycle 1 are noted at 3, 8,15, and 23 one-hundredths of a
minute, respectively, after the stopwatch is started. After the server is timed through
nine more repetitions of the work cycle, each elapsed time (T) is calculated. For
example, the time the server took between the end of the first element and the end of
the second element in cycle 1 is 8 - 3 = 5 one-hundredths of a minute, which is
written in the chart as 0.05.
The next step in using the time study sheet is to find the sum of the elapsed times
for each element across all the cycles and then calculate the average time for each
element. These average times provide information for this particular server, but if he
or she is significantly faster or slower than an average server, management would not
want to base decisions on such times. Therefore, the values are adjusted by means of
a performance rating to reflect what reasonably may be expected of an "average"
worker.
A performance rating represents a subjective judgment by the person who is
conducting the time study. Expert analysts are trained to estimate efficiency rates by
viewing films of people working at different rates. For example, a poor worker
might work at what the analyst would consider to be 90 percent of normal, and the
average time would be adjusted downward by a factor of 0.9. A very fast worker
might be rated at 110 percent of normal, and the average time would be adjusted
upward by a factor of 1.10. The adjusted times are called normal element times and
are derived according to the following formula:
Similar calculations are made to obtain normal times for the remaining elements.
It should be noted, however, that because of their subjective nature, performance
ratings as used in the example above can be a source of contention.
The sympathetic reader already may recognize the need to qualify the normal
element times just calculated. The server cannot be expected to fold silverware into
napkins in a robot-like manner for 8 solid hours during a working day. Allowances
must be made for breaks, personal needs, and perhaps other interruptions such as
obtaining more napkins and sil-
verware. These allowances are figured as a percentage of the job time (i.e., a 10-
percent allowance would translate into 6 minutes every working hour). The resulting
adjusted times, known as the standard element times, and their sum, known as the
standard cycle time, are calculated according to the following formulas:

We complete our example time study sheet by adding the normal element times
to obtain a normal cycle time of 0.294. This result is adjusted by an allowance of 10
percent, or 0.10, to yield a standard cycle time of 0.327. Note that the sample time
study sheet has a space to record any foreign elements observed (e.g., setting aside a
dirty fork). These random occurrences are not included explicitly in the work cycle,
but they are accounted for in selecting the allowance when deriving standard times.
The standard cycle time now can be used by management to assign a server
sufficient time to prepare enough folded silverware and napkins for the next
mealtime.
Work Sampling
Time studies are used to determine how long it takes to complete a task; work
sampling is used to determine how people allocate their time among various types
of activities. Suppose we are interested in the proportion of time an employee
spends at various activities that occur randomly during the workday. Tallying
observations of worker activity that are noted at random times during the day would
lead to our desired proportions.
Consider, for example, a server at a Red Lobster restaurant This server must
take drink and food orders, serve drinks, dish up and serve salads, grind fresh
pepper on the salads, serve biscuits, serve entrees, take dessert orders, serve
desserts, and present the check as well as clear away dirty dishes and refill drinks as
required throughout. Obviously, there is much variation in the server's duties: one
diner may require information on how particular foods are prepared before the order
can be taken; another may drink his or her water as fast as the glass is filled, some
may eat quickly and require little attention beyond the basic service, and still others
may request much extra service.
To study worker activity that is as complex and seemingly random as we have

just described, we can use the work sampling method, which is concerned with the
proportion of time that a worker is engaged in different activities rather than with the
actual time that is spent performing an activity. This technique is most useful in the
design and redesign of contact personnel jobs because of the nonprogrammer nature
of direct customer contact activities.
As described by Sheryl E. Kimes and Stephen A. Mutkoski, work sampling
involves seven steps.15
1. Define the activities. Divide the work into as few categories as possible that do
not overlap.
2. Design the observation form. The form should be designed with ease of use and
ease of future analysis in mind.
3. Determine the length of the study. The study must be long enough to provide a
random sample of activities.
4. Test the form. Try the form in actual practice to see if the categories are well
defined and if it is easy to use and accurate. Does the test application suggest any
changes that should be made in the definition of the categories or the design of the
form?
5. Determine the sample size and observation pattern. Common statistical methods
can be used to select the size of the sample to study and an observation schedule.
In general, the larger the sample size, the more accurate and representative the
sample will be. A formula can be used to determine how many observations must
be made to achieve the desired level of confidence or accuracy, and a schedule for
making those observations must be devised. Details of the statistical methods in
volved are described later in this supplement in the section called "Sample Size."
I5S. E. Kimes and S. A. Mutkoski, "Customer Contact in Restaurants: An Application
of Work Sampling," The Cornell HRA Quarterly, May 1991, pp. 82-88.
6. Conduct the study. Observers must be trained to use the form properly. Kimes and
Mutkoski also point out the importance of considering the effect the study can
have on the behavior of those who are being observed, and they suggest two ap-
proaches to mediate any adverse effect on the subjects: to inform and assure them
that they are not being evaluated, and to make very discreet, unobtrusive
observations without informing them. In addition, data for the first day or two
could be discarded to allow the workers to feel more at ease with the data

collection process.
7. Analyze the data. Again, common statistical methods can be used to calculate the
information required by management. In simplest terms, it is necessary only to
total the number of observations in each category and calculate the percentage of
time spent on that activity.
Kimes and Mutkoski describe an application of work sampling in a study of servers
working in two different types of restaurants: family and "mid-scale." The major
difference between these two restaurant types for the purposes of their study is in the
nature and amount of customer-server interaction: they hypothesized that the
emphasis in the family restaurants "would be on efficiency with an eye toward
increasing table turnover, while in a mid-scale restaurant, the emphasis would be
more on guest service with the idea of increasing 'add-on' sales and guest
satisfaction."
Above all, their sampling plan needed to provide "a good random representative
sample" of servers' activities. Therefore, they selected six different family restaurants
and six different mid-scale restaurants and conducted their studies during the peak
lunch and dinner times. They observed two servers at each restaurant for at least 11/2
hours.
For this study, the servers' activities were divided into the following eight
categories:
1. Guest contact. Any interaction with the customer.
2. Walk-contact. Walking without carrying anything.
3. Walk-full Walking while carrying food, beverages, or dirty dishes.
4. Bus. Clearing a vacated table.
5. Prepare. Preparing food and beverages before service.
6. Can't see. Server is out of sight.
7. Check. Delivering or processing the check.
8. Rest. Server's break time.
These categories were listed on the form shown in Table 9.3, which was to be used
by the student observers who visited each restaurant anonymously to minimize any
effect they might have on the subjects. Observations were recorded at 1-minute

intervals: one server was checked on the minute, and the other server was checked on
the half minute. Because observations made at such regular intervals are not random,
the researchers compensated by drawing a random sample of the student observations
at each restaurant for their final analysis,
Kimes and Mutkoski suggest ways that management can use the information
from their study. If servers are spending more or less time with customers than
desired, perhaps the jobs can be redesigned to increase or decrease the customer
contact time. If servers are spending too much time on busing tables, perhaps more
bus help could be employed. If servers are off the floor too much, perhaps a type of
"front-waiter, back-waiter" system would be helpful.
Sample Size
Consider the following situation: The nursing supervisor at a major hospital must
make up a new work schedule for her staff and needs information on which to base
her decisions. Therefore, she is interested in determining the actual proportion of
time that nurses (RNs) spend in direct patient care. She believes the RNs spend
approximately 20 percent of their time in direct patient care but wants to conduct a
work sampling study to validate her estimate. For this study, she wants to be 95
percent confident that the resulting estimate will be within 5 percent of the true
proportion.
Given the desired confidence level defined above, we can calculate the size of the
sample that would be required for the study. The size of the sample (or the number
of observations) depends on both an estimate of the proportion of time spent in a
particular activity and the accuracy that is desired. The formula for calculating the
sample size is:
In actual practice, an estimate of the proportion of time spent on a particular activity
(P) can be made by conducting small initial studies or by assigning a conservative
value of 50 percent, or 0.5 (which will guarantee that the sample size is large enough
to achieve the desired level of confidence). A third way of estimating P is to make a
reasonable assumption based on experience, as the supervisor did in our hospital ex-
ample above when she set P equal to 0.2 (i.e., 20 percent). For this example, = 0.05,
and Z = 1.96 (for a two-tailed 0.95 confidence level as found in the end-of-book
Appendix table "Areas of a Standard Normal Distribution"). Substituting these values
in equation (4) yields:
The supervisor now needs to construct a schedule of random observations made
over a period of time that is long enough to ensure adequate representation of all
activities. For this example, assume that the study will be conducted for 20 weekdays.
This means that 13 observations per day (246/20 = 12.3) are required. These
observations should be made at random times during each workday, and the hour and
minute for each observation can be determined using a random-number table.
Work Methods Charts
The flow of work activities and the interactions between customers and workers can
be represented graphically. The most commonly used graphical tools are worker-
customer charts and activity charts.
Worker-Customer Charts
When the server's work cycle time is shorter than that required by the supply of
customers, the interaction can be shown on a time scale. The resulting worker-
customer chart can be used to schedule work activities so that one employee can
serve more than one customer at a time.
Figure 9.5 shows a worker-customer chart for a bank in which one drive-in teller
serves two lanes. We simplify this example by using average times and ignoring
randomness. On the average, a customer takes 15 seconds to approach the service
area, 48 seconds to be served, and 9 seconds to depart. Note that the customer's
average cycle time is 72 seconds, but the teller's average cycle time is 48 seconds.
You also can see that while the teller is occupied with the first customer, a second
customer has entered the system and is waiting for service in the second lane.
Activity Charts
The worker-customer chart described above is a useful tool in simple situations, but a
situation involving multiple servers and many customers may benefit from use of a
more complex graphical depiction called an activity chart. An activity chart also uses
a time scale, as shown in Figure 9.6. In this example, two tellers at a drive-in bank
are located in a single station. The bank has three lanes, one served directly from the
teller station window and the other two from pneumatic tubes that transfer materials
to and from the teller station. The average service time at each position is 48 seconds
per customer. Each customer requires an average of 15 seconds to enter the service
area and an average of 9 seconds to depart. We can see from this chart that the
system is operating efficiently; that is, the system quickly adapts to avoid waiting by
customers and idle time for tellers. Also, note that we have created a two-server
queuing system with a single waiting line in spite of the physical need for multiple
lanes. (For a discussion of queuing systems, see Chapter 11.)
1. Time Study

Problem Statement
A discount tire dealer is interested in determining the optimal staffing level for his
mechanics during busy hours to avoid excessive customer waiting. Using a
stopwatch during one afternoon, he observed a mechanic taking an average of 18
minutes to spin balance and mount four tires on a car. He judged that this
experienced mechanic had a proficiency rating of about 110 percent. What is the
normal time for this activity? If the allowance for fatigue and personal time is 15
percent, what should the standard time for this activity be? For planning purposes,
how many cars can one mechanic service per hour?
Solution
Using equation (1), we calculate the normal time as:
Therefore, the number of cars a mechanic can service in one hour = 60/23.3 = 2.5
cars per hour.
2. Work Sampling
Problem Statement
The discount tire owner is concerned about the excessive waiting of customers and
wants to determine the percentage of time that his mechanics are idle. He wants an
estimate within a 5 percent degree of accuracy at a 95-percent confidence level.
Solution
A work sampling study over a 10-day period is suggested. Because no estimate of
the percentage idle time is given, we will use 0.5 to guarantee a conservative sample
size, which is calculated using equation (4):
EXERCISES
9.1. We want to estimate the proportion of time when a car wash facility is unused.
It is known that the facility is busy for at least 80 percent of the day, and a study
is con ducted for 1 week. If we need an estimate within 5 percent at a 90-percent
confidence level, how many observations are required each day?
9.2. If a team of workers takes 14 minutes on average to wash and hand wipe a
typical, car, how many cars per hour can be serviced if an allowance of 10
percent is allowed for fatigue and personal needs?
9.3. One of the cleaning staff at the Last Resort Motel was observed making beds at
an average rate of 8 minutes per bed. The proficiency rating of the staff person is
estimated to be 90 percent.
a. What is the normal time for this task?
b. If the allowance for fatigue and personal needs is 10 percent, what is the
standard
time for this task?
9.4. A restaurant manager has noticed that tables are not cleared fast enough and
diners are kept waiting during the busy lunch period. To justify hiring a part-time
person to clear tables, she has decided to conduct a time study to determine how
many tables one person can clear per hour. After observing tables being cleared
for 1 week, an average of 3 minutes per table has been observed.
a. What is the normal time for clearing a table if the proficiency rating of the
person observed was 85 percent?
b. If the allowance for fatigue and personal needs is 10 percent, what is the
expected number of tables that can be cleared per hour?
9.5. A check-out line at a supermarket consists of two activities in sequence, one
per formed by a cashier and the other by a grocery packer. The cashier was
observed taking 4 minutes on average to process a shopper, whereas the packer
was able to finish bagging the groceries in 3 minutes. The proficiency ratings of
the cashier and packer are estimated to be 80 percent and 90 percent,
respectively.

a. What is the normal time for the check-out process?
b. If the allowance for fatigue and personal needs is 15 percent, how many
shoppers can be processed per hour?
9.6. The cleaning staff at the Last Resort Motel has complained of being overworked.
Man agement has decided to conduct a work sampling study to verify its
contention that the staff is busy only about 60 percent of the time. The study
should yield an estimate of idle time with a 5 percent degree of accuracy at a 95-
percent confidence level.
a. How many random observations should be made?
b. b.Explain how you would select each observation time during a typical 8-hour day
(the study will be conducted for 10 days).
9.7 . The telephone company is considering taking public telephones out of service if
their utilization rate is less than 20 percent. A 10-day work sampling study is
conducted. The estimate of utilization should be within a 5 percent degree of
accuracy at a 95- percent confidence level.
a. How many random observations should be made per day?
b. If the telephone is located in a restaurant, explain how you could enlist a wait-
person to conduct the study using a fixed observation interval of 15 minutes.
9.8. One station attendant serves a full-service gas station that has a total of three
pumps. On the average, a car takes 10 seconds to pull up to a pump; the attendant
takes 15 seconds to find out customer needs and to begin pumping gas. It takes 40
seconds for the gas to be pumped (the attendant is free during this time), and cleaning
the windshield takes 15 seconds. Finally, it takes 30 seconds to replace the nozzle on
the pump and for payment to be made. Customers enter the station every 60 seconds
(de termini tic). Assume a customer goes to an empty pump if available or to any
pump otherwise. Draw a worker-customer chart for a five-minute observation of this
scenario.
CASE: COUNTY GENERAL HOSPITAL16
County General is a large public hospital serving a major metropolitan area in the

growing Sunbelt region of the United States. A significant portion of the hospital's
budget is consumed by labor costs, and the total number of employees can be broken
down as follows:
Administrative and management 18
Professional
MDs 67
RNs 145
LVNs 196
Support 368
Total 794
The hospital's top management has been concerned for some time that the labor
costs for professional staff, particularly the registered nurses, have
i6Prepared by James Vance under the supervision of Professor James A.
Fitzsimmons.
not been kept under control as closely as the annual operating plan envisioned at its
inception. In attempting to see how the nursing staff could be utilized better,
management has decided to undertake a work sampling study of the registered nurses
to see what proportions of their time actually are spent on various tasks.
In designing the study, management established eight general categories of
activities for defining the registered nurse's typical workday: 1) direct patient care, 2)
indirect patient care (i.e., preparation of medicine, equipment, and so on), 3)
paperwork, 4) communication and teaching, 5) escorting and errands, 6)
housekeeping, 7) travel, and 8) nonproductive (i.e., idle time, mealtime, and so on).
Observers who perform the actual sampling will be given lists of specific duties
that would define each category and also would ensure that the study has a high
degree of consistency in the allocation of a nurse's daily duties to the correct
categories. On the basis of a pilot study, County General's management estimates that
the proportions of time spent in each of the above categories are 15, 12,10,40,5,3, 5,
and 10 percent, respectively. The study will be conducted during a 14-day period
from each of three work shifts, and management wants to ensure that the estimates
come within 2 percent of the true proportions with a 98-percent confidence level.
Questions
1. How many observations will be required to en sure that all categories have
enough data collected to meet the established parameters for accuracy? Assume there
is a normal distribution.
2. The study was accomplished as designed, and the hospital management team
was given the follow ing summary data:
Category % of Time Category % of Time
1 13.8 5 3.1
2 12.3 6 4.5
3 11.9 7 3.1
4 39.7 8 11.6
On the basis of your knowledge of hospital functions and the general goal of
providing a high level of service to patients, suggest at least one or two strategies
management might apply to utilize better the time of the registered nursing staff.
Describe the effects that your strategies might have on the time requirements for
other staff groups and on the general level of health care in County General.