CHAPteR 9 otHeR PoPULAtIon CHARACteRIstICs: nUPtIALIty And ...
8
48 CHAPTER 9 OTHER POPULATION CHARACTERISTICS: NUPTIALITY AND DISABILITY Nuptiality Figure 9.1 shows the distribution of household population 12 years old and over by marital status. More than half of this population (55.4%) was married, with 29.5 percent legally married and 25.8 percent living in a common-law union or live-in status. Almost two-fiſths were never married and some 3 percent were widowed and 1.8 percent were either divorced or separated. Over three-quarters of widowed persons were women; this is attributed to the difference in the age of spouses at the time of marriage (women tended to be younger than their spouses) and a higher life expectancy at birth for women compared to men. e percentage of widowed women increased with age as they tended to remarry less frequently upon divorce or the death of a spouse. Figure 9.1: Population 12 years old and over by marital status, RMI: 2011 Table 9.1 presents the percentage of the never married population by age and sex. In every age group, a higher percentage of males were never married than females, supporting the general observation that men marry later than women. In the 15–19 age group, over 95 percent of males and 88.9 percent of females in the Marshall Islands were never married. e percentage of the never married population declined significantly with age. In the 40–44 age group, less than 10 percent of males and females were never married. e percentage of the never married population further dropped to 5.2 percent in the 50–54 age group, with more males (6.4%) remaining single than females (3.8%). Never Married 39.9% Legally Married 29.5% Commonlaw/ Livein 25.8% Divorced/ Separated 1.8% Widowed 2.9% 49
Transcript of CHAPteR 9 otHeR PoPULAtIon CHARACteRIstICs: nUPtIALIty And ...

48
CHAPteR 9 otHeR PoPULAtIon CHARACteRIstICs:
nUPtIALIty And dIsAbILIty
nuptiality
Figure 9.1 shows the distribution of household population 12 years old and over by marital status. More than half of this population (55.4%) was married, with 29.5 percent legally married and 25.8 percent living in a common-law union or live-in status. Almost two-fifths were never married and some 3 percent were widowed and 1.8 percent were either divorced or separated. Over three-quarters of widowed persons were women; this is attributed to the difference in the age of spouses at the time of marriage (women tended to be younger than their spouses) and a higher life expectancy at birth for women compared to men. The percentage of widowed women increased with age as they tended to remarry less frequently upon divorce or the death of a spouse.
figure 9.1: Population 12 years old and over by marital status, RMI: 2011
Table 9.1 presents the percentage of the never married population by age and sex. In every age group, a higher percentage of males were never married than females, supporting the general observation that men marry later than women. In the 15–19 age group, over 95 percent of males and 88.9 percent of females in the Marshall Islands were never married. The percentage of the never married population declined significantly with age. In the 40–44 age group, less than 10 percent of males and females were never married. The percentage of the never married population further dropped to 5.2 percent in the 50–54 age group, with more males (6.4%) remaining single than females (3.8%).
Never Married 39.9%
Legally Married 29.5%
Common-‐law/ Live-‐in 25.8%
Divorced/ Separated
1.8%
Widowed 2.9%
49

49
Table 9.1 also shows the singulate mean age at marriage (SMAM) for males and females. SMAM is an indirect estimate of the average number of years spent in the never married state by those who marry before age 50. The basic data required for estimating SMAM are: (a) the population aged 15–54 classified by five-year age groups and sex; and (b) the never married population aged 15–54 classified by five-year age groups and sex. The proportion never married is calculated for each five-year age group and sex.
table 9.1 Percent never married, by age and sex, and singulate mean ageat marriage (sMAM) by sex, RMI: 2011
Percentage never married
Age group total Male female
15–19 92.1 95.2 88.9
20–24 57.5 66.3 48.2
25–29 31.4 35.5 27.5
30–34 18.6 20.2 16.9
35–39 13.6 15.6 11.5
40–44 9.4 9.9 8.9
45–49 7.6 9.4 5.6
50–54 5.2 6.4 3.8
55–59 5.7 6.4 5.0
60–64 5.1 5.8 4.3
65–69 5.6 6.0 5.0
70–74 4.4 5.3 3.4
75 and older 2.1 3.5 1.1
SMAM 24.9 25.7 24.2
The methodology for estimating SMAM is described in Manual X: Indirect Techniques for Demographic Estimation (United Nations, New York, 1983, pp. 225–229). One of the underlying assumptions of this method is that no first marriages occur after age 50 or before age 15.
50

50
Figure 9.2 shows that SMAM increased from 24.1 years in 1999 to 24.9 years in 2011 – an increase of 0.8 years. During the intercensal period, SMAM for males increased by 0.5 years, from 25.2 to 25.7 years, and for females by 1.2 years, from 23 to 24.2 years
figure 9.2: singulate mean age at marriage (sMAM) by sex, RMI: 1999 and 2011
1999
2011 20
21
22
23
24
25
26
Total Males
Females
24.1
25.2
23.0
24.9 25.7
24.2
SMAM (years)
As expected, SMAM is slightly higher in urban areas (25 years) than in rural areas (24.5 years). The urban-rural difference in age at marriage is somewhat wider among females (24.3 years in urban areas and 23.6 years in rural areas) than among males (25.8 years in urban areas and 25.5 years in rural areas). Irrespective of whether they live in urban or rural areas, males tend to marry at an older age than females.
figure 9.3: singulate mean age at marriage (sMAM) by urban-rural residence and sex, RMI: 2011
Rural
Urban 20
21
22
23
24
25
26
Total Males
Females
24.5 25.5
23.6
25.0 25.8
24.3
SMAM (years)
51
51
disability
The 2011 census of the Marshall Islands collected information from the household population on whether any disabilities prevented the completion of daily activities. Those reporting a disability were asked further questions on the types of disability, namely in relation to (a) seeing, even wearing glasses; (b) hearing, even with the use of a hearing aid; (c) walking, climbing steps or using their arms; and (d) remembering or concentrating.
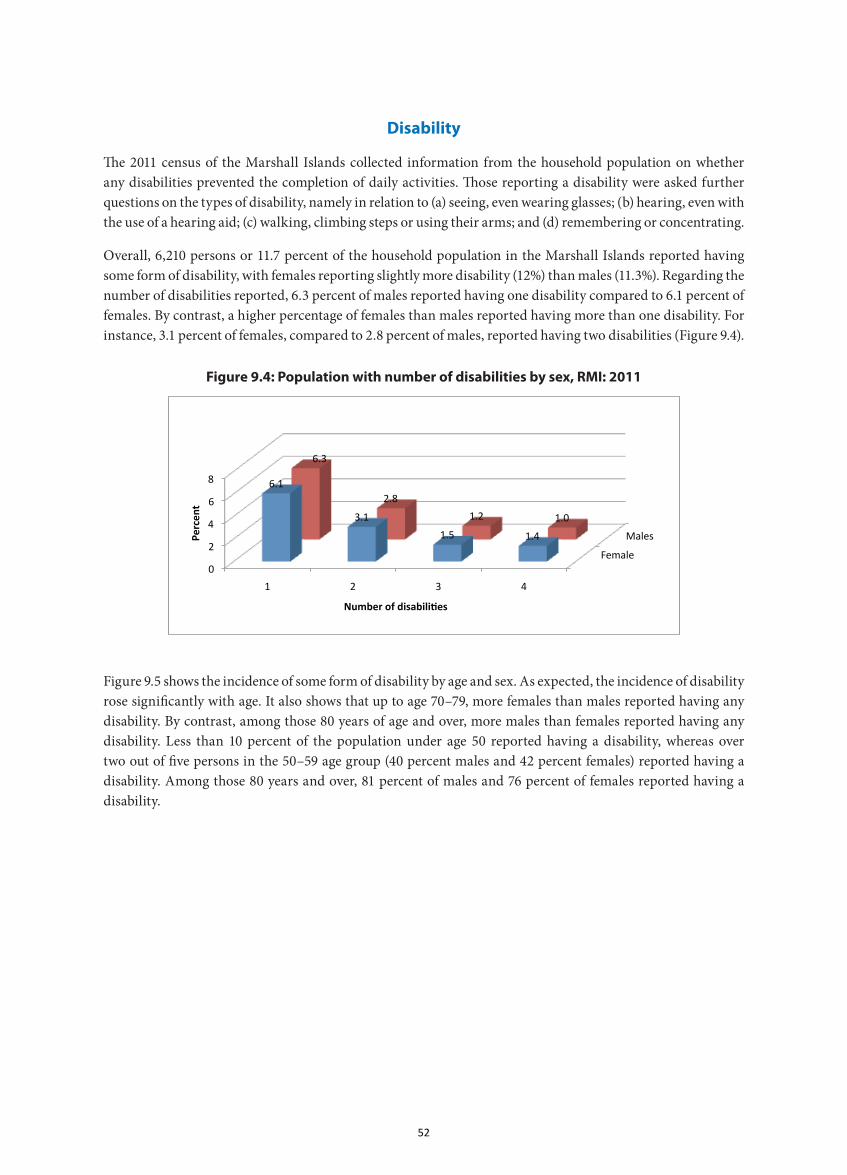
Overall, 6,210 persons or 11.7 percent of the household population in the Marshall Islands reported having some form of disability, with females reporting slightly more disability (12%) than males (11.3%). Regarding the number of disabilities reported, 6.3 percent of males reported having one disability compared to 6.1 percent of females. By contrast, a higher percentage of females than males reported having more than one disability. For instance, 3.1 percent of females, compared to 2.8 percent of males, reported having two disabilities (Figure 9.4).
figure 9.4: Population with number of disabilities by sex, RMI: 2011
Females
Males
0
2
4
6
8
1 2 3 4
6.1
3.1
1.5 1.4
6.3
2.8
1.2 1.0
Percen
t
Number of disabili3es
Figure 9.5 shows the incidence of some form of disability by age and sex. As expected, the incidence of disability rose significantly with age. It also shows that up to age 70–79, more females than males reported having any disability. By contrast, among those 80 years of age and over, more males than females reported having any disability. Less than 10 percent of the population under age 50 reported having a disability, whereas over two out of five persons in the 50–59 age group (40 percent males and 42 percent females) reported having a disability. Among those 80 years and over, 81 percent of males and 76 percent of females reported having a disability.
52

52
figure 9.5: Population with any disability by age and sex, RMI: 2011
Males
Females 0
20
40
60
80
100
Under 50 50–59
60–69 70–79
80 and over
7.1 39.9
54.6 64.2 81.1
7.8
42.0 57.1 68.4 75.9
Percen
t
Persons with disability were categorized by type as shown in Figures 9.6(a) to 9.6(d). The 2011 census revealed that, overall, 7.6 percent of the population were reported as having a seeing disability, even wearing glasses; 4.1 percent of the population had a hearing disability, even with the use of a hearing aid; 4.9 percent had a walking disability or difficulties in climbing steps or using their arms; and 5.7 percent had a disability relating to memory or concentration.
As shown in Figure 9.6(a), more females than males in every age group reported a seeing disability. Seeing disability increased sharply with age, affecting 3 out 10 persons in the 50–59 age group but more than half the population 80 years and over.
figure 9.6(a): Population with seeing disability by sex, RMI: 2011
Males
Females 0 10 20 30 40 50 60
Under 50 50–59 60–69
70–79 80 and over
3.3 29.2 35.0
43.3 54.7
4.2
32.6 38.8 43.5
57.5
Percen
t
53
53
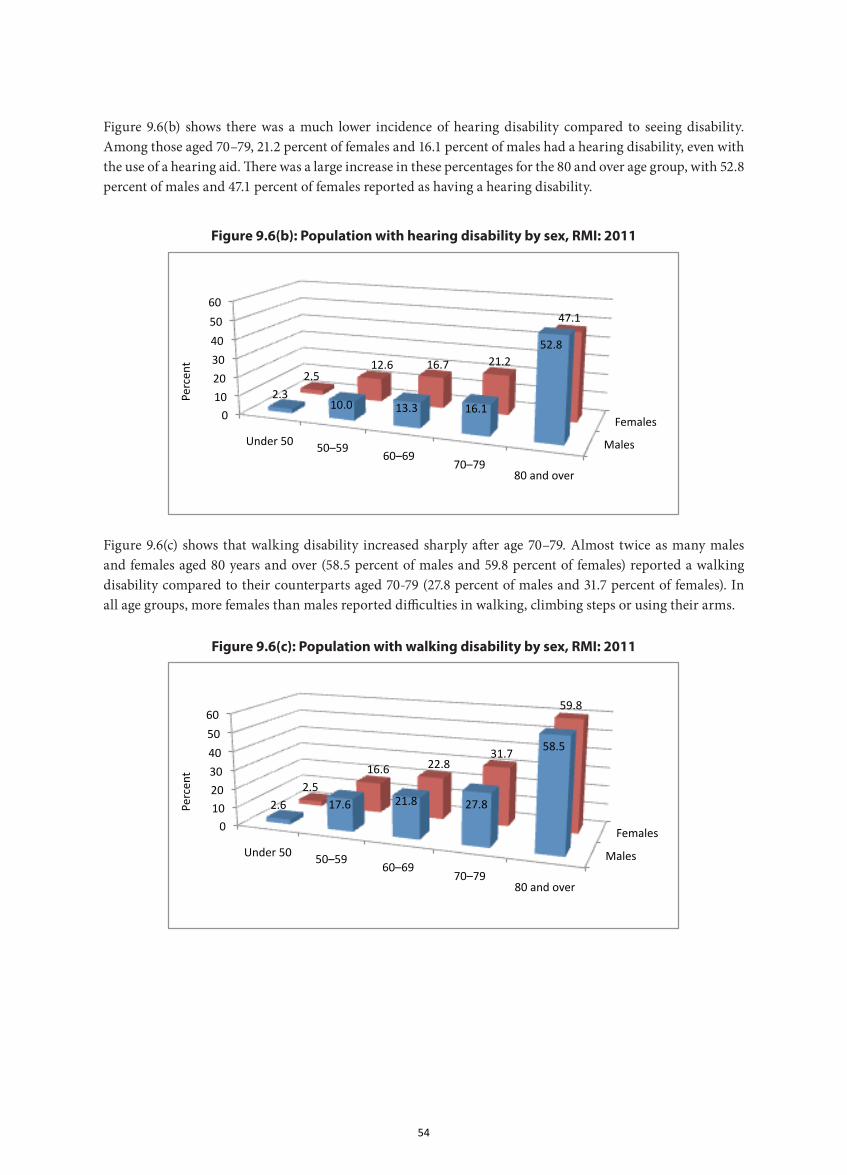
Figure 9.6(b) shows there was a much lower incidence of hearing disability compared to seeing disability. Among those aged 70–79, 21.2 percent of females and 16.1 percent of males had a hearing disability, even with the use of a hearing aid. There was a large increase in these percentages for the 80 and over age group, with 52.8 percent of males and 47.1 percent of females reported as having a hearing disability.
figure 9.6(b): Population with hearing disability by sex, RMI: 2011
Males
Females 0
10
20
30
40
50
60
Under 50 50–59 60–69
70–79 80 and over
2.3 10.0 13.3 16.1
52.8
2.5 12.6 16.7 21.2
47.1
Percen
t
Figure 9.6(c) shows that walking disability increased sharply after age 70–79. Almost twice as many males and females aged 80 years and over (58.5 percent of males and 59.8 percent of females) reported a walking disability compared to their counterparts aged 70-79 (27.8 percent of males and 31.7 percent of females). In all age groups, more females than males reported difficulties in walking, climbing steps or using their arms.
figure 9.6(c): Population with walking disability by sex, RMI: 2011
Males
Females 0 10
20
30
40
50
60
Under 50 50–59 60–69
70–79 80 and over
2.6 17.6 21.8 27.8
58.5
2.5 16.6 22.8
31.7
59.8
Percen
t
54

54
As with hearing and walking disabilities, memory disability (remembering or concentrating) also rose sharply after age 70–79. Some 56 pecent of females and 47.2 percent of males aged 80 years and over had a memory disability in comparison with 24.9 percent of males and 37.8 percent of females in the 70–79 age group. Unlike other types of disability, gender difference is much more prominent with respect to memory disability. For example, memory disability is 39 percent higher among females than males in the 60–69 age group and over 50 percent higher among females than males in the 70–79 age group.
figure 9.6(d): Population with memory disability by sex, RMI: 2011
Males
Females 0 10 20 30 40 50 60
Under 50 50–59 60–69
70–79 80 and over
3.1 13.8 20.0 24.9
47.2 3.7
17.4 27.7
37.8
56.3
Percen
t
55
(THIS PAGE WAS INTENTIONALLY LEFT BLANK)
56