Chapter 9
62
333 C H A P T E R 9 ADVANCED SYSTEMS 9.1 Introduction For decades the response to the ever-growing need for electric generation capacity was to build a new steam power plant, one not very different from the last. Today the energy conversion engineer is faced with a variety of issues and e merging technologies and a changing social and technological climate in which a diversity of approaches is likely to be accepted. This chapter intends to i ndentify some of these concerns and opportunities. No claim of completeness is made. No chapter, or book for that matter, could thoroughly cover this domain. The reader is referred to the bibliography at the end of the chapter as a starting point for continued study. A few characteristics of importance in new power initiatives are: low capital and operating costs, ability to operate with a variety of fuels and with high tolerance to fuel variability, short construction time, low emission of pollutants, marketable or at least inert and easily disposable waste products, and high efficiency, maintainability, financeability, and reliability. Increasingly, the n ew initiative may take the form of repowering the the old plant so as to increase efficiency, meet pollution standards, and minimize the financial impact of meeting new power demands. The improvement of the eff iciency of power plants using conventional cycles is usually evolutionary in nature, by virtue of h igh temperature limitations and advances in materials. Hence, only gradual improvements in efficiency can be expected. On the other hand, si gnificant improvements i n efficiency can sometimes be obtained by combining conventional cycles in appropriate ways. Such power plants are referred to as combined-cycle plants. This chapter will examine the characteristics of several combined-cycle plants. It is evident from the study of the Rankine and Brayton cycles, and in fact all heat engines, that the rejection of large amounts of thermal energy to the surroundings accompanies the production of useful power. This heat rejection can be reduced by improving the thermal ef ficiency of the cy cle but cannot be eliminated. If this energy is not to be wasted, it is logical to seek applications where both power and rejected heat may be u tilized. Power plants that produce mechanical or electrical power and utilize “waste heat” for industrial processes are called cogeneration plants. Several examples of cogeneration are considered in this chapter. District heating and other possible applications of waste heat are also discussed. Another key problem facing the en ergy conversion engineer is the anticipated scarcity, in a few decades, of fuels such as natural gas and oil, relative to the vast resources of coal available in the United States and elsewhere. Perhaps future power plants should utilize this coal and nuclear energy to save the natural gas and
-
Upload
faisal-naeem -
Category
Documents
-
view
87 -
download
0
Transcript of Chapter 9

5/13/2018 Chapter 9 - slidepdf.com
http://slidepdf.com/reader/full/chapter-9-55a753ec3aecd 1/62
333
C H A P T E R 9
ADVANCED SYSTEMS
9.1 Introduction
For decades the response to the ever-growing need for electric generation capacitywas to build a new steam power plant, one not very different from the last. Todaythe energy conversion engineer is faced with a variety of issues and emergingtechnologies and a changing social and technological climate in which a diversityof approaches is likely to be accepted. This chapter intends to indentify some of these concerns and opportunities. No claim of completeness is made. No chapter,
or book for that matter, could thoroughly cover this domain. The reader is referredto the bibliography at the end of the chapter as a starting point for continued study.A few characteristics of importance in new power initiatives are: low capital
and operating costs, ability to operate with a variety of fuels and with hightolerance to fuel variability, short construction time, low emission of pollutants,marketable or at least inert and easily disposable waste products, and highefficiency, maintainability, financeability, and reliability. Increasingly, the newinitiative may take the form of repowering the the old plant so as to increaseefficiency, meet pollution standards, and minimize the financial impact of meetingnew power demands.
The improvement of the efficiency of power plants using conventional cyclesis usually evolutionary in nature, by virtue of high temperature limitations andadvances in materials. Hence, only gradual improvements in efficiency can beexpected. On the other hand, significant improvements in efficiency cansometimes be obtained by combining conventional cycles in appropriate ways.Such power plants are referred to as combined-cycle plants. This chapter willexamine the characteristics of several combined-cycle plants.
It is evident from the study of the Rankine and Brayton cycles, and in fact allheat engines, that the rejection of large amounts of thermal energy to thesurroundings accompanies the production of useful power. This heat rejection can be reduced by improving the thermal efficiency of the cycle but cannot beeliminated. If this energy is not to be wasted, it is logical to seek applicationswhere both power and rejected heat may be utilized. Power plants that producemechanical or electrical power and utilize “waste heat” for industrial processes arecalled cogeneration plants. Several examples of cogeneration are considered inthis chapter. District heating and other possible applications of waste heat are alsodiscussed.
Another key problem facing the energy conversion engineer is the anticipatedscarcity, in a few decades, of fuels such as natural gas and oil, relative to the vastresources of coal available in the United States and elsewhere. Perhaps future power plants should utilize this coal and nuclear energy to save the natural gas and

5/13/2018 Chapter 9 - slidepdf.com
http://slidepdf.com/reader/full/chapter-9-55a753ec3aecd 2/62
334
petroleum for industrial feedstocks and other more critical future needs. On theother hand, serious problems exist with respect to utilization of these resources. Nuclear power, an important alternative, replete with problems, is considered in
the next chapter. Much of the readily available coal has unacceptably high sulfur,which significantly degrades the environment when released from power plantstacks in untreated combustion products. The well-known problem of acid rain has been attributed to emissions from coal-burning power plants. Thus the search for technology to utilize medium- and high-sulfur coal and to reduce levels of pollutant emissions of all types is an important area for research and development.
In this chapter advanced technologies that may contribute solutions to theseand other crucial problems are considered. Some recent U.S. Department of Energy efforts in these areas may be found in Reference 66.
9.2 Combined-Cycle Power
One of the unfavorable characteristics of the gas turbine is that the exhaust gasissuing from the turbine is at high temperature, thereby wasting much energy andcreating a local hazard. One solution to this problem was considered in Chapter 5:the addition of an exhaust gas heat exchanger to preheat the combustion air. Theresulting regenerative cycle was found to be much more efficient than thecorresponding simple cycle and to produce a lower exhaust gas temperature.
An alternative approach to dealing with the high gas turbine exhausttemperature is to provide a separate bottoming cycle to convert some of the energyof the turbine exhaust into additional power. Let’s consider the use of a Rankinecycle that uses gas turbine exhaust as its energy source. It is clear that, if theRankine cycle does not interfere with the operation of the gas turbine, thecombined cycle will produce additional power and will have a higher efficiencythan the gas turbine alone. Even if more heat is required for the Rankine bottoming cycle to produce additional work, the overall combined efficiency willincrease if the additional work is large enough and supplemental heat smallenough.
A combined gas turbine–Rankine cycle can be implemented in several ways.One method makes use of the fact that the exhaust of gas turbines usually has ahigh residual oxygen content because of the high air-fuel ratio required to limit theturbine inlet temperature when burning conventional fossil fuels. This hot,oxygen-rich exhaust gas can be used instead of air as the oxidizer in a steamgenerator as shown in Figure 9.1. For a moderate expenditure of additional naturalgas in the furnace the resulting combustion products can provide heat for a high-temperature steam cycle with conventional steam plant technology.
The Horseshoe Lake combined-cycle plant was designed in this way to yieldadditional power and high efficiency when operating in the combined mode, and tooperate with the gas turbine alone or with the steam turbine alone by direct-firing

5/13/2018 Chapter 9 - slidepdf.com
http://slidepdf.com/reader/full/chapter-9-55a753ec3aecd 3/62
335
of the steam generator with fuel and air. The plant, about ten miles east of
Oklahoma City, was the first its kind, first producing power in 1963. It wasdesigned for a net output of 200 MW and a net heat rate of 9350 Btu/kW-hr. The plant cross-section and photos of the turbines are seen in Figures 9.2–9.4. Note theevaporative cooler to reduce the temperature and to increase the density of the air entering the gas turbine compressor. This reduces compressor work and increasesinlet mass flow rate. Twenty years of successful operating experience with theHorseshoe Lake plant and information on similar German plants is documented inreference 46.
An open-cycle gas turbine also may be linked to a steam cycle through whatmay be considered a gas turbine exhaust heat exchanger containing an economizer,a boiler, and perhaps a superheater. This device, called a heat-recovery steam generator (HRSG), may be used to create and superheat steam as in a conven-tional steam cycle. A flow diagram for such a cycle is shown in Figure 9.5,together with a T-s diagram for the steam bottoming cycle. Gas turbine exhaustgas cools as it superheats, boils, and then warms liquid water in counterflow as it passes through the HRSG.

5/13/2018 Chapter 9 - slidepdf.com
http://slidepdf.com/reader/full/chapter-9-55a753ec3aecd 4/62
336

5/13/2018 Chapter 9 - slidepdf.com
http://slidepdf.com/reader/full/chapter-9-55a753ec3aecd 5/62
337
Combined-Cycle Analysis
Assuming a constant heat capacity for the gas turbine combustion gas, we may
compare gas temperatures with adjacent HRSG local water temperatures on the T-s diagram, Figure 9.5, by applying the steady-flow First Law of Thermodynamicsto appropriate sections of the HRSG:
ms(h12 – h11) = mgC pg(T 6 – T 7) = ms A1 [Btu/hr | kJ/hr] (9.1)
ms(h13 – h12) = mgC pg(T 5 – T 6) = ms A2 [Btu/hr | kJ/hr] (9.2)
ms(h8 – h13) = mgC pg(T 4 – T 5) = ms A3 [Btu/hr | kJ/hr] (9.3)
where ms and mg are the mass flow rates for the steam and gas turbine cycles,
respectively, and the Ai (i = 1, 2, 3) are the areas on the T-s diagram representingheat transfer per unit mass of steam. By adding the three equations, we obtain thesame equation as would result from application of the steady-flow First Law of Thermodynamics to the entire HRSG:
ms(h8 – h11) = mgC pg(T 4 – T 7)= ms ( A1 + A2 + A3) [Btu/hr | kJ/hr] (9.4)
Thus the enthalpy rise of the steam in the HRSG is controlled by the ratio of massflow rates and the hot-gas temperature drop. Expressing gas temperature in theHRSG in terms of steam enthalpy allows us to condense these equations into
T = T 7 + (ms /mgC pg)(h – h11) [R | K] (9.5)
It is evident that the gas temperature is linearly proportional to the water enthalpyon a T-h diagram, as shown in Figure 9.6. The abscissa may be viewed as thecumulative heat transfer per unit mass of water, which is in turn proportional to theexhaust gas heat transfer.
The temperature difference T6 – T12, known as the pinchpoint temperature
difference, is at a critical location in the heat recovery steam generator, because itoccurs at the point of minimum temperature difference between the two fluids. Itshould exceed some minimum design value (about 30°F) for all operatingconditions of the system to make effective use of all of the HRSG heat transfer surface. Smaller temperature differences would substantially increase the heattransfer surface area needed, while significantly larger values would necessitatereducing the boiling temperature and would adversely affect the combined-cyclethermal efficiency.

5/13/2018 Chapter 9 - slidepdf.com
http://slidepdf.com/reader/full/chapter-9-55a753ec3aecd 6/62
338
EXAMPLE 9.1
Let us examine several possible Rankine bottoming cycles for the gas turbineconsidered earlier in Example 5.1. There a gas turbine with a compressor pressureratio of 6 and a turbine inlet temperature of 1860°R was analyzed. The turbineexhaust temperature was found to be 1273°R, or 813°F. With 813°F as the HRSGgas entrance temperature, select the steam turbine throttle temperature as 700°Fand consider Rankine cycles with a range of boiling temperatures, a condensingtemperature of 100°F, and a pinchpoint temperature difference of at least 30°F.Determine a cycle with a satisfactory boiling temperature, and compare it with

5/13/2018 Chapter 9 - slidepdf.com
http://slidepdf.com/reader/full/chapter-9-55a753ec3aecd 7/62
339
other cycles in the family. Take the HRSG gas exit temperature as 350°F to avoidcondensation.
SolutionThe spreadsheet in Table 9.1 follows the notation of Figures 9.5 and 9.6. It
tabulates three combined-cycle cases in which the boiling temperatures, T 12 = T 13,were selected as 300°, 400°, and 500°F. These temperatures, together with thethrottle and condensing temperatures and the turbine efficiency, determine theRankine-cycle thermodynamic conditions (neglecting pump work). Equation (9.5)relates the HRSG enthalpy changes to the corresponding gas temperatures. Thuswith a mass ratio Rmass given by (h8 – h11)/(T 4 – T 7), the pinchpoint temperature T 6for Case 2 is
T 6 = T 7 + (ms /mgC pg)(h12 – h11) = T 7 + (h12 – h11)/ Rmass
= 350 + (375.1 – 68)/2.82 = 350 + 108.9 = 459°F

5/13/2018 Chapter 9 - slidepdf.com
http://slidepdf.com/reader/full/chapter-9-55a753ec3aecd 8/62
340
and the pinchpoint temperature difference is
T 6 – T 12 = 459 – 400 = 59°F
Again, by Equation (9.5),
T 5 = 350 + (1201 – 68)/2.82 = 350 + 401.8 = 752°F
With temperatures and enthalpies determined, work, heat, and efficiencyvalues may be determined as usual, observing carefully the distinction betweensteam-mass and gas-mass references. It is seen that Case 2 has a satisfactory pinchpoint temperature difference and a combined-cycle efficiency of 39%, whichis significantly greater than that of the gas turbine cycle (25%) and Rankine-cycle(29%) operating separately. The temperature distributions for this case are shownin Figure 9.7. __________________________________________________________________

5/13/2018 Chapter 9 - slidepdf.com
http://slidepdf.com/reader/full/chapter-9-55a753ec3aecd 9/62
341
More than one gas turbine could be used in conjunction with a single steamturbine by using a larger HRSG and multiple gas turbine exhaust ducts.Alternatively, each gas turbine may have its own HRSG, with all HRSGsthermally coupled to the steam turbine through feedwater and steam line headers.
An HRSG may be designed to burn additional fuel at its inlet using oxygenremaining in the gas turbine combustion gas to raise the temperature the HRSGgas and provide higher heat transfer to the water. Such a design is called a fired
HRSG, and its use is usually referred to as supplemental firing .Figure 9.8 shows large heat-recovery steam generators built for a nominal 450-
MW combined-cycle plant in Texas utilizing three 100-MW gas turbines and one140-MW steam turbine.
The Comanche power station, located near Lawton, Oklahoma, is an exampleof a combined-cycle facility that employs HRSGs. Two Westinghouse simple-cycle natural-gas-fired gas turbines, as diagramed in Figure 9.9, drive 85-MWelectrical generators and exhaust into separate HRSGs designed for supplementalfiring. Steam at 1200 psia and 950°F produced by the HRSGs is supplied to onenonreheat, single-extraction (not shown) steam turbine that drives a 120-MWelectrical generator.
The Comanche unit, first operated in 1974 (ref. 10) was upgraded in 1986 (ref.11), resulting in a measured plant heat rate of 8508 Btu/kW-hr (40.1% thermalefficiency), with a gas turbine inlet temperature of 1993°F, an HRSG gas inlet

5/13/2018 Chapter 9 - slidepdf.com
http://slidepdf.com/reader/full/chapter-9-55a753ec3aecd 10/62
342
temperature of 1200°F, and supplemental firing. In 1986, the plan was indentified by the Utility Data Institute as the most efficient steam-electric generating stationin the United States, with an average net plant heat rate of 8821 Btu/kW-hr (thermal efficiency of 38.7%).
High-temperature combined-cycle plants are now achieving thermalefficiencies exceeeding 50%. A combined-cycle heat rate for a United Technol-ogies Turbo Power FT8 gas turbine is said to operate at a gross plant heat rate of 6815 Btu/kW-hr (50.1%) based on lower heating value (ref. 51). Reference 50indicates that the Pegus Unit 12 combined-cycle cogeneration plant in the Netherlands produces 223.3 MW at maximum electrical output, with a netelectrical yield of 51.74% based on lower heating value. According to reference67, “Both GE and Siemens Westinghouse turbines will be able to break the 60 per cent efficiency barrier in combined-cycle operation, and a 3 to 6 per cent reductionin CO2 emissions should be possible because of the increased efficiency.”

5/13/2018 Chapter 9 - slidepdf.com
http://slidepdf.com/reader/full/chapter-9-55a753ec3aecd 11/62
343
9.3 Integrated Gasification Combined-Cycle (IGCC) Power Plants
The Cool Water IGCC Plant
One approach to the problem of clean coal utilization lies in the technologyexemplified by the Cool Water integrated gasification combined cycle (IGCC) power plant located near Barstow, California. This plant, which went intooperation in 1984, demonstrated the capability of producing power for the

5/13/2018 Chapter 9 - slidepdf.com
http://slidepdf.com/reader/full/chapter-9-55a753ec3aecd 12/62
344
Southern California Edison System with very low levels of pollutants by using both low-sulfur and medium-sulfur coals. The Cool Water demonstration plantshown in Figure 9.10 (named after the ranch on which it is located) utilized a coalgasification technique known as the Texaco process. The medium-heating-valuesynthetic gas called syngas produced by the process has about one-third theheating value of natural gas, about 265 Btu per standard cubic foot on a dry basis.
As it is produced, the syngas is first cooled, then treated to remove pollutants,and finally burned to drive turbine generators, as seen in Figure 9.11. The initialcooling in the syngas coolers produces saturated steam,which is later superheated by gas turbine exhaust gas in an HRSG, to power a steam turbine (path A in thediagram). The syngas emerging from the coolers (path B) is processed to remove particulates and sulfur and to control oxides of nitrogen, and is then burned in thegas turbine to produce additional power. The high-temperature gas turbine exhaust(path C) then passes through the heat-recovery steam generator, adding energy tothe steam before it passes to the steam turbine. Thus the gasifier flows and thesteam turbine and gas turbine flows interact, hence the name “integratedgasification combined cycle,” IGCC.
The Texaco process requires oxygen of at least 95% purity to gasify the coal inthe gasifier. The Cool Water plant thus has a small, independently owned oxygen plant (seen surrounding the single tower left of center in figure 9.10) that separates

5/13/2018 Chapter 9 - slidepdf.com
http://slidepdf.com/reader/full/chapter-9-55a753ec3aecd 13/62
345
oxygen from air to feed the gasifier. The Cool Water plant produces oxygen of 99.5% purity in order to produce argon as a by-product (as mentioned earlier, the process otherwise requires only 95% purity). Nitrogen is also a by-product.Oxygen is produced continually for gasifier use, but oxygen is also stored so thatthe IGCC plant can continue to operate if the oxygen plant is shut down.
A coal slurry, a mixture of nominally 60% coal and 40% water produced in awet grinding process, is introduced with oxygen into the Texaco gasifier (Figure9.11), where partial combustion of the coal takes place at about 600 psig and2500°F. The gasifier yields a mixture of mainly carbon dioxide, carbon monoxide,and hydrogen gases, with sulfur primarily in the form of hydrogen sulfide. Arelatively inert slag containing most of the mineral matter of the coal passes fromthe gasifier into a pool of water in the bottom of the radiant cooler. The slag istaken out periodically through a lockhopper process. The seal at the bottom of theradiant cooler is maintained by the water that is recycled.
The syngas, after cooling in the radiant and convective coolers, passes througha carbon scrubber, where a water spray removes most of the particulates andfurther cools the gas. After additional cooling to ambient temperature, the gasflows to a sulfur-removal unit, where a solvent removes the hydrogen sulfide andtherefore most of the sulfur from the stream. The relatively particle-free andsulfur-free gas is then saturated with moisture to control the formation of oxides of nitrogen (NOx) during combustion in the gas turbine. The water-quenching processsuppresses NOx formation by reducing the gas combustion temperature, and it alsoincreases the turbine power output by adding to the mass flow in the gas turbinecombustor. Combustion gases from the gas turbine then pass through the heat

5/13/2018 Chapter 9 - slidepdf.com
http://slidepdf.com/reader/full/chapter-9-55a753ec3aecd 14/62
346
recovery steam generator, where they produce additional steam as they drop intemperature to about 400°F. The combustion products leaving the plant areremarkably pollutant free. Performance of the Cool Water Station is summarized
in Table 9.2 below.
Table 9.2 Cool Water IGCC Station Nominal Performance
Gas turbine electric generator power 65 MW
Steam turbine electric generator power +55 MW
Gross power 120 MW
Air-separation oxygen plant –17 MW
Internal plant consumption – 7 MW
Net power 96 MW
Design heat rate 11,510 Btu/kW-hr
Observed heat rate 10,950 Btu/kW-hr
Source: Reference 3.
The operators of the Cool Water station have demonstrated values of critical pollutants well below current environmental limits for both permit and regulatorylimits and New Source Performance Standards (NSPS), as indicated in Table 9.3.The Cool Water plant has operated successfully with Utah run-of-mine coal with0.4% sulfur, Illinois #6 coal with 3.1% sulfur, and Pittsburg #8 coal with 2.9%
sulfur. The sulfur removal process in the plant yields about 99.6% pure elementalsulfur, which can be sold for the production of sulfuric acid and fertilizers. Theslag produced by the gasifier is considered nonhazardous and suitable for the production of road-making materials or cement.
Table 9.3 Emissions from the Cool Water Station HRSG (lb/million Btu)
High Sulfur Coal SO2
Low Sulfur Coal SO2
NOx CO ParticulateMatter
Permit and regulatory limit 0.16 0.033 0.13 0.07 0.01
Utah coal – 0.018 0.07 0.004 0.001
Illinois #6 0.068 – 0.094 0.004 0.009
Pittsburgh #8 0.122 – 0.066 <0.002 0.009
Federal NSPS 0.6 0.24 0.6 – 0.03
Source: Reference 3
The net effect of the plant then is to generate power efficiently by utilizingwidely available coals with sulfur content up to 3.5% in an environmentally sound

5/13/2018 Chapter 9 - slidepdf.com
http://slidepdf.com/reader/full/chapter-9-55a753ec3aecd 15/62
347
way while producing nonhazardous waste that offers the possibility of constructiveuse.
It should be understood that the Cool Water plant was built as a demonstration
plant to prove a technology on a large but not a full scale. Engineering studies based on the Cool Water operating experience (ref. 4) have indicated that a 360-MW full-scale IGCC plant using Illinois #6 coal could be built with a net heat rateof 9000 Btu/kW-hr at a capital cost of $1530/kW and with operating andmaintenance costs of 2.3 cents/kW-hr (or 5.2 cents/kW-hr, which includes all fixedcharges) (ref. 3). These costs are competitive with those for conventional newcoal-burning power plants using flue gas desulfurization.
An important feature of the IGCC plant concept is the attractiveness of phased construction. A conventional coal-burning steam power plant must be constructedas a unit and takes a relatively long time to erect. On the other hand, one or moregas turbines of a planned IGCC plant may be quickly put into service using natural
gas as a fuel. Additional gas and steam turbines may be added later to transformthe plant into a combined-cycle plant, with coal gasifiers and an oxygen plantadded still later at a third stage. Because the units may be paid for as they are built, phased construction offers significant financial benefits as well as ordely growth.
Significant materials problems have been overcome in the Texaco and CoolWater plant technology. The inside of the gasifier requires refractory materials towithstand the severely corrosive high-temperature environment. Cool Water experience (ref . 5) indicates that 10,000–14,000 hours of refractory life isattainable. This implies that gasifier overhaul will be required at least every twoyears. Additional problems with cooler tube-wall materials, coal slurry pumps, and piping; and other severe material operating environments offer challenges for materials research to improve IGCC operation.
Several of the references expand on the idea of cogeneration– polygeneration – by pointing out that, based on the Cool Water technology today, a single facilitywhose only major requirements are air, water, and coal can simultaneously produce electricity, steam, sulfur, inert slag for road construction, oxygen,nitrogen, hydrogen, carbon monoxide, carbon dioxide, argon, methanol, other chemical products, and even syngas.
The Dow Gasification Process
Another coal gasification process combined-cycle system (CGCC), developed byDow Chemical Co., operates in Plaquemine, Louisiana. Like the IGCC system,the Dow process reacts a coal slurry with oxygen to produce syngas, from whichmost of the sulfur is removed for by-product use. The raw syngas from thegasifier produces steam in an HRSG, is cooled, passes through pollutant removalequipment, and is burned in gas turbines. Reference 47 indicates that “of the newcoal-based technologies, the CGCC system has the highest efficiency and thelowest emission of environmental pollutants.” The 161-MW plant, built in theremarkable time of twenty-one months, was completed in 1987. The referenceindicates for CGCC plants a net heat rate based on lower heating value of 8670

5/13/2018 Chapter 9 - slidepdf.com
http://slidepdf.com/reader/full/chapter-9-55a753ec3aecd 16/62
348
Btu/kW-hr (39.4%) and a total capital cost of $1201/kW, based on 1988 dollars.Additional information on combined-cycle coal gasification systems is givenreferences 58, 59, and 65. Tampa Electric’s 250-MW IGCC Polk Power Station
began commercial operation in 1996. A website (ref. 65) indicates that the stationis 10-12% more efficient than conventional coal-fired plants.Three dimensionalviews may be seen at the website.
9.4 Combustion in Fluidized Beds
The need to develop environmentally sound methods for utilizing a variety of coals, industrial and municipal wastes, and other solids as fuels has stimulatedresearch in a variety of areas. Another prominent and promising technologyapplicable to these goals is fluidized bed combustion (FBC). Atmosphericfluidized bed combustors (AFBCs) operate near atmospheric pressure; pressurized
fluidized combustors (PFBCS) are enclosed in a pressure vessel and operate at a pressure of about 12 atmospheres.As the name suggests, a principal unique feature of this technology is that
combustion takes place in a bed of solid particles supported in vigorous, turbulentmotion on an upwardly directed stream of air. The bed may consist of acombination of particles of fuel, sand, ash, waste materials, limestone, and other compounds, depending on the function and design of the fluidized bed combustor.The key point is that these materials mingle and react in continually changingorientations, providing ample opportunity for intimate contact of fuel and oxidizer and for removal of combustion products, while supported on the fluidizing air stream. The name bubbling bed is sometimes used to decribe this action.
It has been found that horizontal water tubes located within the fluidized bed,in crossflow to the upward air stream, experience very high heat transfer coefficients in comparison with those in normal furnace convective and radiativeenvironments. It is even more important that fluidized beds containing coal andlimestone produce combustion gases with both low sulfur content and lowconcentrations of oxides of nitrogen.
Limestone reacts with sulfur in the coal to produce particles of calcium sulfatethat are removed as bed materials are renewed. More specifically, the limestone,CaCO3, reacts to form CO2 and lime, CaO:
CaCO3 => CaO + CO2
and the CaO reacts with the sulfate vapors:
H2SO4 + CaO => CaSO4 + H2O.
The calcium sulfate forms as a solid that becomes a bed material, and the water vapor passes off as a component of the flue gas.

5/13/2018 Chapter 9 - slidepdf.com
http://slidepdf.com/reader/full/chapter-9-55a753ec3aecd 17/62
349
Oxides of nitrogen (NOx) produced by the FBC are maintained at low values, because bed and gas temperatures are well below those at which NOx forms inconventional combustors. The bed temperature is determined primarily by the ratesof air and fuel supplied. Normally, FBC bed temperatures are about 1550°F,compared with conventional furnace temperatures in the neighborhood of 3000°F.The reactivity of nitrogen is low at 1500°F, and chemical equilibrium calculationsand laboratory observations show that the nitrogen in flue gas is almost entirely inits normal, diatomic form.
The combustion of coal or other solids occurs largely at the interface betweenthe solid and the surrounding oxidizing gases. The rate at which the solid burnsdepends on the rate at which oxygen is brought to the solid interface and on therate at which combustion products are removed, as well as on the rate of chemicalreaction at the interface itself. The vigorous relative motion of the bed particlesand the intervening air flow provide an excellent mechanism for delivery of oxygen to and the transport of combustion products from the interface.
Normally, FBC occurs with enough excess air, in the primary supporting air

5/13/2018 Chapter 9 - slidepdf.com
http://slidepdf.com/reader/full/chapter-9-55a753ec3aecd 18/62
350
stream and possibly in a secondary over-fire air flow, that combustion is virtuallycomplete. Flyash and other airborne particles are removed by centrifugalseparators and baghouse filters. Solids from the separators may be reinjected into
the bed to further ensure almost complete burnup of carbon.The circulating fluidized bed (CFB) combustor (refs. 26 and 30) is one inwhich smaller solid bed materials are carried upward by the combustion air/gasstream. A return passage transports the unburnt and inert particles and part of thecombustion gas back to the main furnace, allowing the remaining flue gas to passto the heat-recovery area, as seen in Figure 9.12. The solid bed materials continueto burn as they circulate, thus maintaining an approximately uniform temperatureof about 1550°F throughout the furnace. As a result, there is a long residence timefor particles of the furnace to complete their reactions. A mechanical cycloneseparator built into the furnace helps to separate the particles from the exiting fluegas. As a result, reinjection of the unburnt carbon makes possible very high
combustion efficiencies.According to reference 26, CFB designs achieve higher combustion efficiency,reduced NOx emissions, minimum CO formation, and reduced limestoneutilization in capturing SO2 when compared with bubbling fluidized bedcombustors. Much continues to be learned about problems and opportunitiesinherent in fluidized bed combustion as more units come into use. In a December 1998 work (ref. 65), the U.S. Department of Energy (DOE) proposed a 379-MWe, pressurized circulating fluidized bed combustor combined-cycle plant with a netefficiency of 47%.
9.5 Energy Storage
It has been observed that there is no existing means of storing electrical power on alarge scale. As a consequence, power generation varies from instant to instant, tosatisfy the immediate demands of consumers. Utility generation capacity musttherefore be great enough to satisfy the peak demand, or the utility must purchase power at a premium from other utilities to make up its generation deficit.
Demand varies from place to place, seasonally, daily, and hourly. For instance, the loads of utilities in the southern United States are usually greatestduring hot summer days, when air conditioning and industrial demands coincide.As a result, southern utilities may have excess capacity at night and in the winter.It were possible to generate a full capacity during off-peak hours and store theenergy in excess of demand, the utilities could operate with installed capacity below the demand peak and operate more units as base-load plants close to their high-efficiency design points.
5/13/2018 Chapter 9 - slidepdf.com
http://slidepdf.com/reader/full/chapter-9-55a753ec3aecd 19/62
351
Pumped Storage
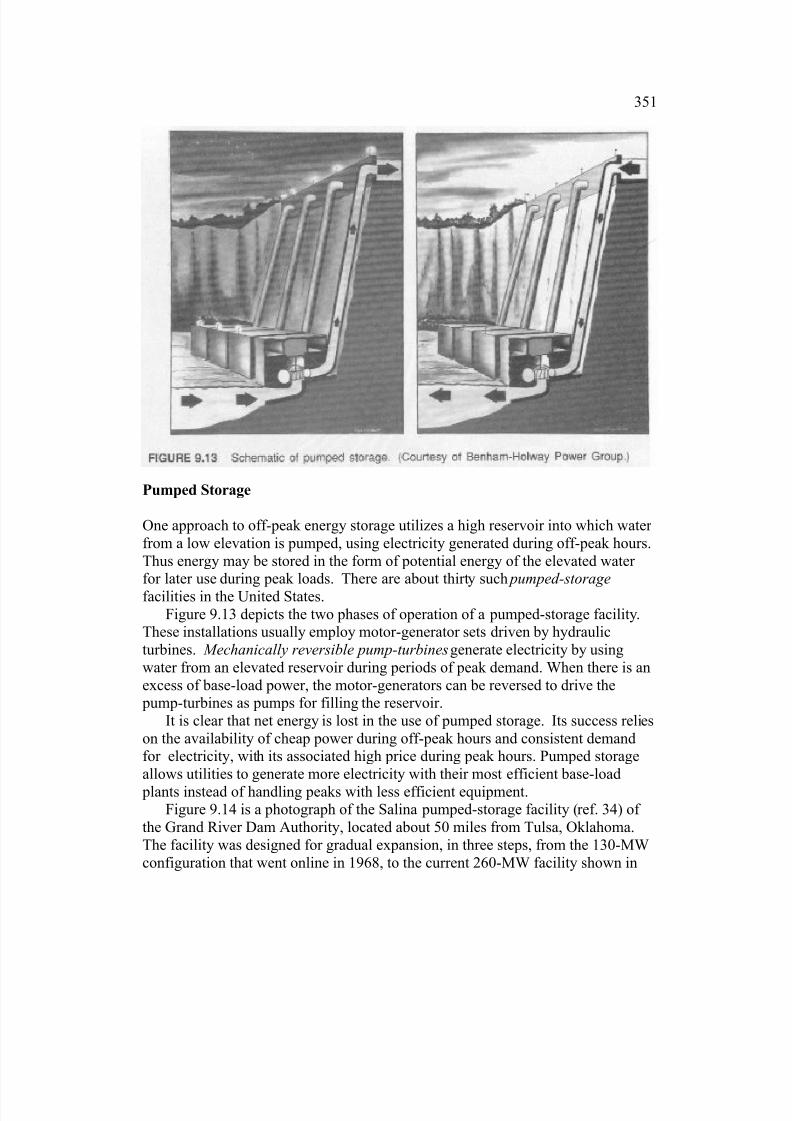
One approach to off-peak energy storage utilizes a high reservoir into which water from a low elevation is pumped, using electricity generated during off-peak hours.Thus energy may be stored in the form of potential energy of the elevated water for later use during peak loads. There are about thirty such pumped-storage
facilities in the United States.Figure 9.13 depicts the two phases of operation of a pumped-storage facility.
These installations usually employ motor-generator sets driven by hydraulicturbines. Mechanically reversible pump-turbines generate electricity by usingwater from an elevated reservoir during periods of peak demand. When there is anexcess of base-load power, the motor-generators can be reversed to drive the pump-turbines as pumps for filling the reservoir.
It is clear that net energy is lost in the use of pumped storage. Its success relieson the availability of cheap power during off-peak hours and consistent demandfor electricity, with its associated high price during peak hours. Pumped storageallows utilities to generate more electricity with their most efficient base-load plants instead of handling peaks with less efficient equipment.
Figure 9.14 is a photograph of the Salina pumped-storage facility (ref. 34) of the Grand River Dam Authority, located about 50 miles from Tulsa, Oklahoma.The facility was designed for gradual expansion, in three steps, from the 130-MWconfiguration that went online in 1968, to the current 260-MW facility shown in

5/13/2018 Chapter 9 - slidepdf.com
http://slidepdf.com/reader/full/chapter-9-55a753ec3aecd 20/62
352
the figure, to a 520-MW final modification. The eventual completion of the project will require the development of an additional upper reservoir as well asconstruction of six additional penstocks and the installation of their hydroelectric pump-turbine motor-generator sets. The present plant is capable of producing power at full-rated load for eight hours a day or at part load for twelve hours a day.The reservoir is 251 feet above the lower lake. The penstocks are 14 feet indiameter and 720 feet long.
Reference 36 identifies an early pumped-storage facility named Rocky River at New Milford, Conn., which was in operation in 1928. The limited number of highhead surface sites for such facilities, the high capital cost of building a dam, andthe large land area impacted by these facilities make the future use of pumpedstorage questionable. Reference 37, however, predicted continued growth in pumped storage capacity. One possibility that would support such growth is tohave the upper pool at ground level and to use underground mines for the lower pool (ref. 38). Another is the development of low head facilities.

5/13/2018 Chapter 9 - slidepdf.com
http://slidepdf.com/reader/full/chapter-9-55a753ec3aecd 21/62
353
Compressed-Air Energy Storage
A relatively new approach to energy storage is compressed-air energy storage
(CAES), which employs underground caverns for storage of air under pressure(refs. 25 and 49). Air is compressed into the cavern using off-peak power and later is released to oxidize fuel in a gas turbine combustor to generate electrical power during hours of peak demand. The first CAES plant, a 290-MW unit, firstoperated at Huntorf, West Germany, in 1978. A second CAES plant located inMcIntosh, Ala, with phased construction of two 110-MW units, first went on-linein May, 1991 (ref. 64).
CAES plants are located in the vicinity of underground caverns. The cavernsmay be natural or may be created and/or enlarged by solution-mining of under-ground salt domes. In solution-mining, water is pumped into a salt formation, thewater dissolves salt locally, enlarging the cavern, and the resulting brine is pumpedto the surface, where the salt is driven from the solution and the water reused.
Figure 9.15 shows a schematic of the McIntosh plant. During off-peak hours amotor-generator, powered by electricity produced elsewhere in the utility systemand with turbine-expander clutch disengaged, drives the compressor set that packsair into the salt cavern. Later, air is allowed to escape from the cavern to oxidizefuel at the high cavern pressure, forming combustion gas to pass through the gasturbines (expanders) that drive the motor-generator in the generation mode with

5/13/2018 Chapter 9 - slidepdf.com
http://slidepdf.com/reader/full/chapter-9-55a753ec3aecd 22/62
354
the compressor clutch disengaged. The generator thus is able to return electricity tothe utility system during periods of peak demand.
The CAES plant is essentially a gas turbine in which the compression process
is decoupled from the power delivery process. During daily cyclical operation, themass of air supplied to the cavern at night is utilized during the day. Since thecharging period may be different than the utilization period, the average mass ratesof storage and delivery may differ. The McIntosh plant is designed for twenty-sixhours of storage capacity and therefore does not operate on a strict daily cycle butrather on a weekly cycle that takes advantage of less expensive weekend power.
The presence of the recuperator in the McIntosh plant, the first in use in aCAES facility, provides regeneration, which, as discussed in Chapter 5,substantially reduces gas turbine fuel consumption and thus improves plantefficiency. Regeneration may also be accomplished by absorption and storage of the heat of compression of the air in an aftercooling, high heat capacity heat
exchanger such as a pebble bed recuperator. The stored energy is later returned tothe air discharged from the cavern as it flows to the turbines.The success of a CAES plant, like that of pumped storage, depends on the
availability of cheap, off-peak power. The objective is to drive the compressor train during these periods so that high-priced power may be produced later in periods of high demand. It should be noted that the compression process is notonly decoupled mechanically from the power delivery process, but the compress-ion process may take place over a longer period of time than the period of CAES power production. This allows the use of smaller compressors than would beneeded for a conventional peaking gas turbine. According to reference 25, theHuntorf plant compresses for 4 hours, and the McIntosh plant for 1.7 hours, for each hour of power production. CAES may become a more viable option in theUnited States than surface pumped storage because of the existence of more potential sites and lower land surface area requirements for CAES.
9.6 District Heating and Cooling and Cogeneration
Comfort heating and cooling in homes, businesses, and industry consumes largequantities of energy. Much of this low-temperature-energy use is accomplished bythe direct or indirect burning of fossil fuels and high temperature. Electricalresistance heating, especially, and heat pumps may be included in this because theelectricity they consume is produced largely from high-temperature sources. Many believe that these are inappropriate uses of fossil fuels, in a conservation sense, because of the unnecessary loss of the availability of high-temperature energy todo work. It is simply a reflection of the desirability of using high temperatureswhere needed and low-temperature sources for low-temperature functions. For instance, it is no revelation that some of the obligatory heat rejection by modernheat engines is at a high enough temperature to supply energy for comfort heatingand cooling.

5/13/2018 Chapter 9 - slidepdf.com
http://slidepdf.com/reader/full/chapter-9-55a753ec3aecd 23/62
355
District heating , the provision of heat to a populated area by a nearby centralheating plant, has been in use for one hundred years or more. More recently theaddition of cooling to such plants has become widespread. Now, colleges and
universities frequently have such a facility. Shopping malls and blocks of businessdistricts in many cities also take advantage of the economic benefits provided by acentral plant. This is usually accomplished through the use of boilers that producehot water or steam for heating, and by vapor compression or steam-drivenabsorption refrigeration machines that produce chilled water for cooling. Water,steam, or brine is usually used to deliver the energy to the user.
In municipal facilities, the steam, water, or brine is metered and circulated ininsulated pipes under the streets to air-handling units and other point-of-usedevices in the customers’ buildings, and thence to return pipes that bring the fluid back to the central plant or, in single-pipe one-way systems, to sewer mains.
Until recently, most of the district heating facilities the United States did not
find significant advantage in producing electrical power and using the waste heatfor district heating, cooling, or industrial process energy. With Europe’s morelimited energy resources, combined heat and power (CHP), or cogeneration, thesynergistic generation of electric power and heat, found more extensive use therethan in United States following the Second World War. In fact, a number of steamturbines and closed-cycle gas turbines burning a variety fuels were developed for simultaneous electric power generation and district heating or industrialcogeneration purposes (refs. 12 and 15–20). These activities are closely related tototal energy systems, which seek to utilize natural gas for other purposes whilegenerating electricity (ref. 17). In the United States this term has been used in the past for the promotion of natural-gas-burning systems that provided heating,cooling, and electricity for shopping malls, colleges, and similar customers.
Some of the possible cogeneration steams include:
1. Steam turbine power with condenser heat rejection for low-temperature processes, facility heating, or district heating.
2. Steam turbine power with steam extraction or use of a back-pressure turbinefor process or district heating use.
3. Steam turbine power with exhaust steam or steam extraction heat transfer toabsorption refrigeration system generators for chilling processes or districtcooling in summer.
4. Closed-cycle gas turbine power with coolers (intercoolers and pre-coolers)used for district heating.
5. Closed-cycle gas turbine power with coolers used with absorptionrefrigeration system for chilling processes or district cooling in summer.

5/13/2018 Chapter 9 - slidepdf.com
http://slidepdf.com/reader/full/chapter-9-55a753ec3aecd 24/62
356
6. Open-cycle gas turbine power with exhaust heat recovery for process use or district heating.
7. Diesel or gas reciprocating engine power with water-jacket cooling, oilcooler, and/or exhaust gas heat recovery used for process or district heating.
A measure of the efficiency of energy utilization in a cogeneration plant is theenergy utilization factor , EUF, which is the sum of the net work, w, and the usefulheat produced, qu, divided by the energy supplied to achieve the combined heatand work, qin, (ref. 18):
EUF = (w + qu )/qin [dl] (9.6)
Care should be taken when considering the EUF and the thermal efficiency of
a plant. The EUF is not restricted by the Carnot efficiency and can thereforeapproach 100%. For instance, when there is no useful heat transfer, the EUF is the plant thermal efficiency. At the other extreme, when no power is produced the plant can utilize almost all the energy supplied by the fuel for useful heat; andtherefore the EUF could approach 100%. Thus the EUF is a measure of the extentof productive use of the energy source, with no consideration for work–useful heat proportions. An EUF in excess of 80 percent is possible for a CHP plant.
Other efficiencies for CHP plants may be defined. For instance, a weightingfactor might be used in the numerator of the EUF to attempt to give appropriateweight to both heat and work. For example, since conventional power plantsconvert heat to work with about 33% efficiency, one might define a special EUF*as (w + 0.33q
u)/q
infor comparison with thermal efficiencies. While such factors
may be useful in evaluating the design of a plant, they should be applied with care.Reference 18 discusses alternative definitions more fully.
9.7 Electricity Generation and Legislation
Historically, the electric power industry in the United States developed byrecognizing the economic advantages of scale of large central plants that usedextensive power transmission and distribution systems, following the lead of thegreat governmental hydroelectric power projects. They also recognized theenhanced growth potential inherent in the society’s becoming “totally electric.”The productive disposition of condensor rejected heat had no place as a revenue producer in this scheme, for the important reasons that it would reduce plantefficiency and power output and could not reach across the miles as power transmission lines could. Individual consumers as well as industry happilyaccepted this approach to the electrification of America, as electricity pricesdropped decade after decade. Natural-gas and fuel oil companies were also thereto satisfy the vast needs for heat.
More recently, energy-consuming industries came to recognize the possibilitiesof simultaneous power and heat generation to satisfy their energy requirements. At

5/13/2018 Chapter 9 - slidepdf.com
http://slidepdf.com/reader/full/chapter-9-55a753ec3aecd 25/62
357
the same time, a consciousness grew that there are limits to the world’s energyresources and that a more thoughtful stewardship of them would be prudent, whenit is economically attractive. However, in the early 1970s the OPEC oil embargo
brought these notions into clearer focus, and federal legislation in 1978 broughtcogeneration to everyone’s attention with the enactment of PURPA, the Public
Utility Regulatory Policies Act (ref. 14).PURPA, a part of the National Energy Act, was intended to bring competition
into the electric power generation business and to increase the nationaleffectiveness of energy utilization by making cogeneration more economicallyattractive. It required that utilities purchase power from qualified cogenerators at areasonable price, created tax incentives for developers, and established the Federal Energy Regulatory Commission, FERC, to regulate and administer the activity.Prospective cogenerators must apply to the FERC for certification as a qualified
facility, QF. The FERC, however, left the deliberation of what constitutes a fair
price to state public utility commissions. As a result, industrial cogenerationthrives in some states and is virtually nonexistent and others. PURPA requiresutilities to buy electricity from QFs at the marginal cost of new generation, that is,the cost of electricity generated by new power plant if it were built, the so-calledavoided cost .
The growth of cogeneration, state and national actions to change the regulatorystructure of the electric utility industry, the difficulties of acquiring capital for large, long-term projects and other uncertainties are significantly changing theoutlook and structure of the utility industry (ref. 21). Utilities now appear to belooking toward incremental and modular growth and the avoidance of long-termcommitment, which is reflected in their reluctance or inability to undertake theconstruction of large, capital-intensive base-load plants. Legislative changes in the1990's and beyond are bringing substantial deregulation to the industry, openaccess to power transmission systems, and the introduction of merchant plants
created to offer electricity to the highest bidder in the new free-enterprise climate(ref. 66).
9.8 Steam-Injected Gas Turbines
Water injection has been used for many years for brief augmentation of the thrustof jet engines. More recently, liquid water injection and steam injection have beenused to control the formation of NO
x
in gas turbines. Injection of water or steaminto the combustion chamber reduces the combustion temperature, which in turnsuppresses the formation of NOx caused by high temperature. Power output ismaintained or increased because the injection increases both the turbine mass flowand the energy extraction by the turbine. The latter is possible because the heatcapacity of steam is almost twice that of normal combustion products. Thus theenthalpy change of steam for a given temperature drop is about double that of air or combustion gas. If water is injected as a liquid, additional energy must beextracted from the combustion gas to vaporize the water.

5/13/2018 Chapter 9 - slidepdf.com
http://slidepdf.com/reader/full/chapter-9-55a753ec3aecd 26/62
358
As a consequence of these considerations, an important cogeneration technol-ogy is emerging. The steam-injected gas turbine, STIGTM* or SIGT, uses the gasturbine exhaust flow through an HRSG to produce steam that is partially or entirely injected into the gas turbine combustion chamber and possibly thecompressor and/or turbine, as indicated in Figure 9.16, resulting in augmented gasturbine power output. Reduced steam requirements for process use in an industrialcogeneration plant may be used to increase electrical power generation, which inturn may be sold to a local utility under PURPA if it is not needed for other on-siteuses.
References 13, 22, 23, and 31 show increased power output, increased thermalefficiency, and reduced NOx as benefits of steam injection. Table 9.4, for example,lists performance measurements of the effects of steam injection into twoindustrial gas turbines. The table shows that as the cogeneration process steam percentage is reduced and the steam flow to the gas turbine increases accordingly,substantial increases in power output and thermal efficiency are consistentlyattained. Thus the steam-injected gas turbine holds considerable promise for cogeneration and process applications.
A cross-section of the General Electric LM 5000 gas turbine without steaminjection is shown in Figure 9.17; a photo of the same is presented in Figure 9.18.The LM 5000 is a compact, high-performance, aeroderivative gas turbine intendedfor marine and industrial applications. It is derived from the CF6 family of high- bypass-ratio turbofan engines but burns either distillates or natural gas fuels. TheLM 5000 has a dual-rotor gas generator and a three-stage power turbine. Themanufacturer quotes a power output of 46,200 shaft horsepower (34,451 kW) anda heat rate of 9160 Btu/kW-hr at a power turbine speed of 3600 rpm for the LM5000 without STIG. ____________________ *STIG is a trademark of General Electric Co., U.S.A.

5/13/2018 Chapter 9 - slidepdf.com
http://slidepdf.com/reader/full/chapter-9-55a753ec3aecd 27/62
359
Table 9.4 Performance of Steam-Injected Gas Turbines with Unfired HRSG
Cogeneration Steam
Percentage
Power Output (kW) Thermal Efficiency
Allison 501-KH
100% 3500 0.24
50% 4750 0.30
0% 6000 0.35
General Electric LM5000
100% 33000 0.33 (0.36)
50% 40000 0.36 (0.38)0% 47000 0.38 (0.42)
Adapted from reference 22. Data in parentheses from references 56 and 57.

5/13/2018 Chapter 9 - slidepdf.com
http://slidepdf.com/reader/full/chapter-9-55a753ec3aecd 28/62
360

5/13/2018 Chapter 9 - slidepdf.com
http://slidepdf.com/reader/full/chapter-9-55a753ec3aecd 29/62
361
A schematic of the LM 5000 STIG configuration is shown in Figure 9.19; a photoof the same is presented in Figure 9.20. The steam manifolds and injection linesmay be seen in both figures. Table 9.4 shows the performance of this configur-ation without supplemental firing of the HRSG. With full STIG and supplementalfiring, the power output increases to 72,100 shaft horsepower (53,765 kW) and aheat rate of 7580 Btu/kW-hr (or a thermal efficiency of 45%) is attained.

5/13/2018 Chapter 9 - slidepdf.com
http://slidepdf.com/reader/full/chapter-9-55a753ec3aecd 30/62
362
Figure 9.21 shows the average steam generation capability of the engine exhaustwith an unfired HRSG having a 30°F pinchpoint temperature difference. It is seenthat, as expected, higher steam flow rates are obtained with reduced steam temp-erature and pressure for given HRSG exhaust and turbine exhaust temperatures.
A study the economic advantages of steam-injected gas turbines for utility userelative to the combined-cycle power plant (ref. 33) has shown combined cycles to be superior in unit sizes above 50 MW. However, utilities are becomingincreasingly interested in plants of 50 MW or less because of their small size andquick availability.
Intercooled Steam-Injected Gas Turbines
A modification of the steam-injected gas turbine is ISTIG, or, intercooled STIG, inwhich steam is injected into compressor bleed air for turbine cooling, together withsteam injection into the combustor and into one or more turbine stages (ref. 22).The enhanced blade cooling allows increased turbine inlet temperature and further power and efficiency increases. The reference predicts efficiencies for ISTIGturbines better than for existing combined cycles and comparable to advancedcombined cycles. Thus STIG and ISTIG show great promise for cogenerationapplications and are likely to find their way into future power generation plans.
Steam-Injected Gas Turbine Analysis
The influence of steam injection into the combustor can be analyzed with a modelthat accounts for the major effects on the engine performance: the added mass and

5/13/2018 Chapter 9 - slidepdf.com
http://slidepdf.com/reader/full/chapter-9-55a753ec3aecd 31/62
363

5/13/2018 Chapter 9 - slidepdf.com
http://slidepdf.com/reader/full/chapter-9-55a753ec3aecd 32/62
364
heat capacity of steam in the turbine flow. The model assumes the following:
+Downstream steam injection has no effect on the compressor.
+The properties of steam may be represented by constant values of the heatcapacity C ps: 1.86 kJ/kg-K and 0.444 Btu / lbm -R.
+The heat capacity of the mixture of combustion gas and steam may be repre-sented by a temperature-independent mass-weighted heat capacity given by
C pm = C pg + (ms /ma )C ps [Btu/lbm-R | kJ/kg-K]
where ms /ma is the steam-air mass ratio. Here, as before, the mass of fuel isneglected with respect to the mass of air.
+The isentropic exponent of the mixture, k m , remains the isentropic exponentof combustion gas with no water injection, k m = k g = 4/3.
+The fuel control system maintains the turbine inlet temperature at a constantvalue, irrespective of steam injection rate.
EXAMPLE 9.2
Consider the injection of steam in the combustion chamber of the single-shaft gasturbine studied in Example 5.1. Five pounds of steam are injected for everyhundred pounds of compressor discharge air. The fuel flow rate is adjusted tomaintain the turbine inlet temperature at a constant 1400°F. Compare the power output for a compressor flow rate of 100 lbm /s, the thermal efficiency, the work ratio, and the fuel-air ratio with like parameters for the machine with no injection.Assume that the steam injected is saturated at the combustor pressure level and isheated by the turbine exhaust from pressurized feedwater at 70°F in a heat-recovery steam generator as shown in Figure 9.22.
SolutionTable 9.5 presents the spreadsheet solution as well as the no-injection
reference solution, which is repeated there for convenience.The algorithm is based on the assumptions just enumerated and uses the HRSG
analysis techniques discussed in section 9.2 in connection with the combined-cyclesteam generator study. Steam conditions entering the combustor are obtained fromthe saturated-vapor tables, assuming constant pressure mixing at the known com- bustor pressure level; feed water conditions are for saturated liquid water at 70°F.

5/13/2018 Chapter 9 - slidepdf.com
http://slidepdf.com/reader/full/chapter-9-55a753ec3aecd 33/62
365

5/13/2018 Chapter 9 - slidepdf.com
http://slidepdf.com/reader/full/chapter-9-55a753ec3aecd 34/62
366
A 3-point increase in thermal efficiency and a substantial increase in power output due to steam injection are evident.
The steam generator easily provides the required steam mass with a large pinchpoint temperature difference. This indicates that the turbine exhaust gas iscapable of producing a still larger steam fraction with a smaller pinchpointtemperature difference while maintaining acceptable exhaust gas temperature withrespect to the exhaust gas dew point. __________________________________________________________________
By expanding the spreadsheet, with mass rate as a parameter, we present theinfluences of increased steam mass rate on performance and on steam generator steam-air temperature differences in Figures 9.23 and 9.24, respectively. Thefigures indicate that steam-air mass ratios up to about 0.18 are possible with thisconfiguration and that substantial performance benefits are the result.

5/13/2018 Chapter 9 - slidepdf.com
http://slidepdf.com/reader/full/chapter-9-55a753ec3aecd 35/62
367

5/13/2018 Chapter 9 - slidepdf.com
http://slidepdf.com/reader/full/chapter-9-55a753ec3aecd 36/62
368
9.9 Resource Recovery
The disposal of municipal and industrial solid waste has become a nationalconcern with significant energy conversion aspects. It has been estimated that50% of sanitary landfills that are convenient or accessible to urban areas would befully utilized in the 1990s and that satisfactory new sites will be progressivelymore difficult to find. This has led to the rapid growth of the resource recoveryindustry.
Resource recovery deals with the environmentally sound disposal of municipaland industrial waste. It starts, at one extreme, with garbage landfills andincineration and extends to the ultimate conversion of components of waste totheir useful constituent elements, with recovery of available energy in the process.Vigorous activity in this area is producing a variety of approaches to the problem.Many of the solutions focus on the development of a central waste disposal facilitythat receives and prepares waste for efficient landfill disposal. This sectionconsiders a modern facility that reduces the volume of about 1125 tons per day of solid waste by over 90% by burning, to produce steam for industrial use and togenerate electricity when steam is not needed.

5/13/2018 Chapter 9 - slidepdf.com
http://slidepdf.com/reader/full/chapter-9-55a753ec3aecd 37/62
369
Figure 9.25 shows a modern facility designed to serve the waste disposal needsof almost 500,000 Tulsa-area residents. The plant is similar in many respects tothe power plant steam generators discussed earlier. Major exceptions are themodifications required to deal with the unique problems of handling municipalsolid waste (MSW). The right foreground of Figure 9.25 shows where wastehaulers’ trucks are weighed on outside scales and enter the facility’s tipping floor.Large noncombustible materials and other refuse that cannot be burned in thefacility, such as steel bars and tires, are left outside the plant by the hauler for separate disposal. The trucks dump the MSW in or near a large refuge storage pitadjacent to the tipping floor and leave from the opposite side of the tipping floor from which they entered.
Haulers are held responsible for the waste that they deliver, although overheadcrane operators who feed refuse to the three boilers also attempt to sort the refuse,to help achieve uniform heat release in the furnace and to keep large, noncombust-ible, hazardous, and otherwise inappropriate materials from entering the furnaces.
Figure 9.26 shows how refuse handled by cranes is hoisted from the holding pitand lowered through near-vertical feed chutes (4) to inclined reciprocating-gratefurnaces (5). There, rugged hydraulically operated rams meter the flow of refuseas they push it onto the grates. The combination of underfire air from a forced-draft fan (6) and vertically reciprocating grates keeps the refuse in continuousmotion. Overfire air assures 98% burnup of combustible materials. Supply air for the forced-draft fans is drawn from the tipping-floor enclosure (1), to retain odorswithin the plant.
At the end of the grate, a variable-speed ash discharge roller controls the rateof discharge and hence the depth of the ash bed at the end the grate. The ash falls

5/13/2018 Chapter 9 - slidepdf.com
http://slidepdf.com/reader/full/chapter-9-55a753ec3aecd 38/62
370
from the roller into a water-bath ash discharger that cools the residue. The water also seals the bottom of the furnace, which is slightly below atmospheric pressure.The cooling ash residue is pushed by a ram out of the water bath, up an inclined
surface, and into a compartment where water is allowed to drain off and evaporatefrom the residue for fifteen minutes. The ash residue then falls to a conveyor,where it is transported to the ash house. There, salvageable metals are separatedand recycled. The remaining ash is then trucked to a sanitary landfill. The plantachieves about a 90% reduction in refuse volume delivered to the landfill.
In the furnaces, the combustion gas from the burning MSW on the grates heatsthe water in the welded-membrane water walls of the furnaces and the varioussteam generator tube banks (8-12). Each of the steam generators produces 88,500lbm/hr of steam at 680 psia and 700°F. The entire steam production passes in a 12-inch underground steam line to a refinery about a mile away, for process use. Infigure 9.25, the refinery process plant utilizing the steam is located just beyond the
tank farm in the upper left. A steam turbine and generator set rated at 16 MW isavailable for electrical generation as an alternative to refinery use of steam production. The electricity may be used on site or sold to the local electric utility.
After leaving the economizer (12), combustion gas passes into an electrostatic precipitator (14), where most of the fly ash remaining from the numerous passesthrough the boiler is collected. The precipitators have automatic rapping systemsthat free the collected particles, allowing them to drop into flyash hoppers to betransported to the residue conveyor. Induced-draft fans (16) transport the cleanedcombustion gas from the precipitators to the stacks.
Tulsa’s Walter B. Hall Resource Recovery Facility, described here, is anenvironmentally sound example of an increasing number of facilities operating or under construction. These facilities typically are externally neat and are suited for operation in industrial and some commercial locations. Massive reductions inwaste volumes are achieved in these facilities, with the possibility of generatingsteam for process use, district heating, and steam turbine generation of electricity.In resource recovery facilities of differing design, fluidized bed combustors might be employed, and the released refuse heat might instead be used in connectionwith closed-cycle gas turbines or other heat-driven devices.
9.10 Polytropic Efficiency
To this point the performance of turbomachinery has been represented byisentropic efficiencies. In comparisons of turbomachines with differing pressureratios, the use of the isentropic efficiency gives an undeserved advantage to somemachines over others with different pressure ratios. Another approach toefficiency, called the small-stage efficiency or polytropic efficiency, is consideredhere as an alternative and, under certain circumstances, a more consistent way of representing the quality of turbine and compressor performance.

5/13/2018 Chapter 9 - slidepdf.com
http://slidepdf.com/reader/full/chapter-9-55a753ec3aecd 39/62
371
Axial compressors and turbines consist of alternating rows of stationary, or stator, blades and rotating, or rotor , blades, with the rotor rows firmly attached toa rotating shaft. In a turbine, the stationary blades act as nozzles to increase flowvelocity, and the rotor blades downstream turn and decelerate (change themomentum of) the flow. The reaction to the momentum change is a force with alarge component in the direction of blade rotation. This blade force deliverstorque and power about the rotor axis. The combination of the stator row and arotor row is called a stage.
Instead of thinking in terms of efficiency for the entire machine, we focus our attention on the efficiency of a single turbine stage. The efficiency of a stage may be defined in terms analogous to the definition of the isentropic efficiency.Consider the T-s diagram of Figure 9.27, which shows the temperature drop of acalorically perfect gas in a stage of a multistage turbine. We assume here that allstages have identical pressure ratios. In the notation of the figure, the turbineisentropic efficiency is given by (T 1 – T 2)/(T 1 – T 2i), and by analogy the stage
isentropic efficiency is *T/ *T i.The expansion process in the turbine may be thought of as a stairstep sequence
of expansions through individual small stages, each having its own efficiency. Afew such steps are indicated in the figure. It should be observed that, in eachsuccessive stage, the isentropic temperature drop *T i moves to the right on thediagram and therefore is larger than the corresponding drop between the same pressure levels on the expansion line from 1 to 2i; i.e., *T i > *T s. Thus theirreversibility of the expansions through earlier stages results in a sum of stageisentropic temperature drops greater than the overall isentropic temperature dropand hence greater work-producing capability for successive stages.

5/13/2018 Chapter 9 - slidepdf.com
http://slidepdf.com/reader/full/chapter-9-55a753ec3aecd 40/62
372
Let us now imagine the turbine as comprised of an infinite number of stageswith infinitesimal pressure drops of equal efficiency. Thus the *T s become dT sand the small-stage efficiency becomes
s = dT/dT i [dl] (9.7)
The isentropic relation for a calorically perfect gas, Equation (1.19), may bewritten in the form T/p (k – 1)/k = a constant. Using differentiation by parts yields
dT i – [(k – 1)/k ]Tp – 1dp = 0
which combined with Equation (9.7), gives
dT /T = [ s (k – 1)/k ] p
– 1
dp [dl] (9.8a)
If it is assumed that the stage efficiency is constant, integration of Equation(9.8a) between the turbine inlet and exit states gives
T 1/T 2 = ( p1/ p2) s (k– 1)/k [dl] (9.8b)
Thus the requirement that all stages have equal efficiency yields a temperature pressure relationship of the same form as Equation (1.19), except for the exponent.Such relationships, of the form T 1/T 2 = ( p1/ p2)
(n – 1)/n are called polytropic. For example, the isentropic Equation (1.19) is polytropic with n = k . Because the useof constant small-stage efficiency yields a pressure-temperature relation of polytropic form, s is often called the polytropic efficiency. The exponent for theturbine expansion with constant stage efficiency is then given by
(n – 1)/n = s(k –1)/k [dl] (9.9)
If the polytropic efficiency is unity, n becomes k , and Equations (9.8) become theusual isentropic relation. Values of s less than 1 reduce the turbine temperatureratio, T 1/T 2, for a given turbine pressure ratio, p1/ p2, below the isentropic value inqualitatively the same way that decreasing turbine isentropic efficiency does. Asimilar statement applies to turbine work.
The turbine isentropic efficiency, t
, can be expressed in terms of the polytropic efficiency by substitution in the isentropic efficiency definition:
t = (T 2/T 1 – 1)/(T 2i /T 1 – 1)
= (1/r s(k –1)/k – 1)/ (1/r (k –1)/k – 1) [dl] (9.10)

5/13/2018 Chapter 9 - slidepdf.com
http://slidepdf.com/reader/full/chapter-9-55a753ec3aecd 41/62
373
where r is the turbine pressure ratio, p1/ p2.If we define a compressor polytropic efficiency as a small-stage isentropic
efficiency, a similar analysis yields relations analogous to Equations (9.8) – (9.10):
T 2/T 1 = ( p2/ p1)(k– 1)/(k s) [dl] (9.11)
(n – 1)/n = (k –1)/(k s) [dl] (9.12)
c = (r (k –1)/k – 1)/ (r (k –1)/(k s) – 1) [dl] (9.13)
where c
and r are the compressor isentropic efficiency and pressure ratio,respectively. Figure 9.28 shows isentropic efficiencies for both compressors andturbines as functions of pressure ratio for two values of polytropic efficiencies.Applying L’Hospital’s rule to Equations (9.10) and (9.13), we can show that theisentropic efficiency of both turbines and compressors approaches the polytropicefficiency in the limit as the pressure ratio approaches 1. This fact is evident in thefigure, and it is apparent that as pressure ratio increases, isentropic efficienciesincrease for turbines and decrease for compressors for fixed values of the polytropic efficiencies.

5/13/2018 Chapter 9 - slidepdf.com
http://slidepdf.com/reader/full/chapter-9-55a753ec3aecd 42/62
374
The polytropic efficiencies may be regarded as measures of the internal qualityof turbomachines, that is, superior internal blade passage design. For example, for two turbines having the same internal aerothermodynamic quality, Figure 9.28
indicates that a machine with a high pressure ratio will have a higher overallisentropic efficiency than one with a low pressure ratio.As another example, the compressor curves imply that, in a comparison of two
compressors having the same isentropic efficiency, the one with the higher pressure ratio has a superior aerothermodynamic quality. This suggests that parametric studies involving varying compressor pressure ratio should use aconstant value of polytropic efficiency rather than constant isentropic efficiency torepresent comparable compressor quality.
9.11 Turbofan Engines
The turbofan engine, ducted fan, or fanjet, discussed briefly in Chapter 5, is thedominant gas turbine engine in commercial aircraft and is extensively employed inmilitary aircraft is well. Its primary feature is a large fan that accelerates a largemass of unheated air in an annular duct surrounding the central core engine, as inFigures 9.29 and 9.30, which show, respectively, a cutaway diagram and a photo-graph of the General Electric CF6-80C2 high-bypass-ratio engine. The large fandiameter produces a large jet exhaust consisting of a cylindrical wake of hotcombustion gas surrounded by an annular flow of slower-moving warm air.
The bypass ratio, B, is the ratio of the mass flow rate through the outer cooler duct, mc, to the flow rate of the hot core engine, mh:
B = mc/m
h[dl] (9.14)
Bypass ratios range from 0 for the pure turbojet engine studied in Chapter 5 tovalues in the neighborhood of 10. The bypass ratio is a design parameter that is primarily determined by the mission of the aircraft. High-bypass-ratio engines aredesirable for long-range commercial aircraft because of their excellent fueleconomy. The CF6-80C2 engine has a bypass ratio of 5.05 and a total airflow of 1769 lbm/s (802 kg/s).
The bypass air may have its own nozzle, separate from the core engine as inthe CF6 engine, or the core and bypass flows may be mixed in a specially designednozzle. The mixing nozzle helps to reduce jet noise by transferring momentumfrom the fast-moving core gas to the slower-moving bypass air, thereby reducingthe wake shear noise source. The mixing process, however, involves a thrust-loss penalty.

5/13/2018 Chapter 9 - slidepdf.com
http://slidepdf.com/reader/full/chapter-9-55a753ec3aecd 43/62
375

5/13/2018 Chapter 9 - slidepdf.com
http://slidepdf.com/reader/full/chapter-9-55a753ec3aecd 44/62
376
Figure 9.31 presents some of the nomenclature and notation that will be usedin discussing the turbofan engine. For the configuration shown in the figure, thefan pressurizes the compressor inlet air as well as delivering the power needed toaccelerate the bypass air through its nozzle downstream. While other fan configur-ations are possible, this frequently used arrangement is the only one analyzed here.
In addition to the bypass ratio, a second important design parameter is the fan
pressure ratio, the ratio of the stagnation pressure downstream to that upstream of the fan:
FPR = po2/ po1 [dl] (9.15)
The fan pressure ratio, together with the bypass ratio, determines the power transferred between the hot core engine and the bypass flow. For a given coreengine configuration, higher bypass ratios and fan pressure ratios cause more power to be extracted from the turbine and passed to the bypass air by the fan. This produces higher bypass duct thrust. However, as more power is extracted from thecore flow, the core nozzle velocity and core engine thrust are reduced. Thedetermination of the design values of these parameters therefore involves acomplex tradeoff with numerous other design factors.
The combination of a compressor and a turbine joined by a shaft is sometimesreferred to as a spool. High-pressure-ratio engines are frequently arranged in atwin-spool or even a three-spool configuration. In a twin-spool engine, a high- pressure turbine drives a high-pressure compressor with a hollow shaft, and a low- pressure turbine delivers power to a low-pressure compressor and/or a fan bymeans of a shaft that turns inside of the high-pressure-spool shaft. The turbofanconfiguration in Figure 9.31 has the low-pressure turbine driving both the fan and

5/13/2018 Chapter 9 - slidepdf.com
http://slidepdf.com/reader/full/chapter-9-55a753ec3aecd 45/62
377
the low-pressure compressor, as does the PW 4000 fanjet shown in Figure 5.24. Inanother arrangement, the low pressure turbine powers the fan only, and the entirecompressor is driven by the high-pressure turbine. Regardless of engine layout, the
objective of the fanjet is to accelerate a large mass of air and thereby increase the propulsive efficiency of the engine.Let us now consider the analysis of the turbofan configuration shown in Figure
9.31. The following parameters are assumed to be specified:
+ Ambient conditions at a specified altitude and flight speed or Mach number, pa, t a, ca, or M a
+ Inlet stagnation-pressure recovery, IPR
+ High-pressure-turbine inlet stagnation temperature, T o5
+ Fan pressure ratio, FPR = po2/ po1
+ Bypass ratio, B
+ Low-pressure-compressor pressure ratio, LPCPR = po3/ po2
+ High-pressure-compressor pressure ratio, HPCPR = po4/ po3
+ Low- and high-pressure compressor efficiencies, LPC, HPC
+ Low- and high-pressure turbine efficiencies, LPT
, HPT
+ Fan efficiency, F (defined analogous to compressor efficiency)
The inlet is assumed adiabatic, the nozzles are assumed to be isentropic, and allmechanical efficencies are taken to be unity.
The calculation procedure parallels that of the turbojet analysis of Chapter 5.Free-stream stagnation conditions are determined from the ambient conditions andflight speed or Mach number. For an adiabatic inlet, the stagnation temperature atthe fan face, T o1, is the same as the free-stream value, T oa, and the fan face stag-nation pressure, po1, is given by the product of the inlet stagnation-pressurerecovery and the free-stream stagnation pressure: p
o1
= IPR ( poa
.The conditions immediately downstream of the fan, assumed to be the same for
both hot and cold paths, are given by
po2 = po1(FPR [lbf /in2 | kPa] (9.16)
and
T o2 = T o1 + T o1[FPR (k – 1)/k – 1]/ F [R | K] (9.17)

5/13/2018 Chapter 9 - slidepdf.com
http://slidepdf.com/reader/full/chapter-9-55a753ec3aecd 46/62
378
The pressurized flow in the bypass duct then accelerates from po2 and T o2 throughthe convergent nozzle to a high velocity c9 with static pressure p9, contributingm9(c9 – ca) + A9( p9 – pa) to the engine thrust. Here, p9 = pa if the nozzle pressure
ratio, po2/ p9, is less than or equal to the critical pressure ratio; otherwise it is equalto the critical pressure ratio.The stagnation conditions downstream of both low- and high-pressure
compressors are determined in the same way as for the fan. For instance, for thelow-pressure compressor,
po3 = po2(LPCPR [lbf /in2 | kPa] (9.18)
and
T o3 = T o2 + T o2[LPCPR (k – 1)/k – 1]/ LPC [R | K] (9.19)
Similarly, for the high-pressure compressor,
po4 = po3(HPCPR [lbf /in2 | kPa] (9.20)
and
T o4 = T o3 + T o3[HPCPR (k – 1)/k – 1]/ HPC [R | K] (9.21)
Neglecting combustor pressure losses, the high-pressure-turbine inlet pressure is po5 = po4 and the known turbine inlet temperature is T o5. Recognizing that, apartfrom assumed-small frictional losses, the power delivered by the high-pressureturbine is delivered to the high-pressure compressor; the steady-flow form of theFirst Law of Thermodynamics applied to the high-pressure spool yields thestagnation temperature upstream of the low-pressure turbine:
m8C pa(T o4 – T o3 ) = m8C pg(T o5 – T o6)
T o6 = T o5 – (C pa /C pg)(T o4 – T o3 ) [R | K] (9.22)
The turbine isentropic efficiency definition then gives the isentropic dischargetemperature, T o6s, which in turn yields the high-pressure-turbine pressure ratio.
A similar procedure for the low-pressure turbine spool results in the energyrate balance:
(m9 + m8)C pa(T o2 – T o1) + m8C pa(T o3 – T o2) = m8C pg(T o6 – T o7) [Btu/hr | kW]
which, after dividing by m8C pa and using the bypass ratio equation, yields
(B + 1)(T o2 – T o1) + (T o3 – T o2) = (C pg / C pa)(T o6 – T o7) [R | K]

5/13/2018 Chapter 9 - slidepdf.com
http://slidepdf.com/reader/full/chapter-9-55a753ec3aecd 47/62
379
This equation may be solved for the nozzle entrance stagnation temperature:
T o7 = T o6 – (C pa /C pg)[(B + 1)(T o2 – T o1) + (T o3 – T o2 )] [R | K] (9.23)
The turbine pressure ratio follows from the application of the isentropic turbineefficiency definition and the isentropic temperature-pressure relation, as in theearlier high-pressure-turbine analysis.
Alternatively, polytropic efficiencies may be used in the solutions. This is donefor the fan and compressors by replacing Equations (9.16) to (9.21) by their polytropic equivalents:
po2 = po1(FPR [lbf /in2 | kPa] (9.24)
T o2 = T o1 + T o1[FPR (n – 1)/n – 1] [R | K] (9.25)
po3 = po2(LPCPR [lbf /in2
| kPa] (9.26)
T o3 = T o2 + T o2[LPCPR (n – 1)/n – 1] [R | K] (9.27)
po4 = po3(HPCPR [lbf /in2 | kPa] (9.28)
T o4 = T o3 + T o3[HPCPR (n – 1)/n – 1] [R | K] (9.29)
where (n – 1)/n is given by Equation (9.12) for the appropriate compressor poltytropic efficiency.
Equations (9.22) and (9.23) are still applicable for the analysis of the turbines.
However, polytropic equations, using exponents given by Equation (9.9):
n /(n – 1) = k /(k – 1) s
where s is the appropriate turbine polytropic efficiency, are required to determinethe turbine pressure ratios, namely
po6/ po5 = (T o6/T o5)n/(n – 1) [dl] (9.30)
and
po7/ po6 = (T o7/T o6)
n/(n – 1)
[dl] (9.31)
Once po7 and T o7 are known, the core nozzle may be treated in the same way as theturbojet nozzle in Chapter 5. The engine thrust is then the sum of the thrusts produced by the core and bypass flows.

5/13/2018 Chapter 9 - slidepdf.com
http://slidepdf.com/reader/full/chapter-9-55a753ec3aecd 48/62
380
EXAMPLE 9.3
A turbofan engine has a fan and a low-pressure compressor driven by the low- pressure turbine, as shown in Figure 9.31. It operates at a flight velocity of 200 m/sat 12,000 meters altitude, where the ambient temperature and pressure are 216.65K and 0.1933 bar, respectively. The overall pressure ratio the engine is 19, and thefan and low-pressure-compressor pressure ratios are 1.65 in 2.5, respectively. Thefan, compressors, and turbines have 90% polytropic efficiencies. Assume anisentropic inlet and separate isentropic convergent nozzles, a fuel heating value of 43,000 kJ/kg, and a combustor total pressure loss of 6.5%.
Determine the core engine and bypass duct exit velocities, the engine thrustspecific fuel consumption, thrust, and specific thrust for an engine with an inlet air flow of 100 kg/s and a bypass ratio of 3.0. Determine whether the nozzles arechoked.
Solution
Table 9.6 tabulates, in spreadsheet format, the design data for the example andsystematically calculates the engine parameters. After computing the fan and LP-turbine exit total pressures, the nozzles may be checked for choking at the throats.The applied pressure ratios are compared with the critical pressure ratios for cold bypass air (k = 1.4) and for hot gas (k = 4/3), respectively. Branching in thecomputation required by the presence or absence of choking is easily handled bythe @IF function of popular spreadsheets, which allows a conditional selection between specified alternatives, as discussed previously in connection withExample 5.6.
TABLE 9.6 Spreadsheet Solution to Example 9.3
AEROTHERMODYNAMIC ANALYSIS OF A FANJET
Ca 200 m/s Flight velocity
Ta 216.65 K Ambient temperature
Pa 0.1933 Bar Ambient pressure
Fuel HV 43000 kJ/kg Heating value
Cpa 1.005 kJ/kg Air heat capacityCpa/Cpg 0.8754 Air/gas heat capacity ratioOPR 19.0000 Overall pressure ratio
FPR 1.6500 Fan pressure ratio
LPCPR 2.5000 Low pressure compressor pressure ratioHPCPR 4.6100 HPCPR = OPR/[(FPR)(LPCPR)]B 3.0000 Bypass Ratio
mair 100 kg/s Inlet total mass flow rate
cpeta 0.9 Compressor and fan polytropic efficiencies(n-1)/n l comp 0.3175 (n-1)/n = (k-1)/[k+cpeta] (for fan & comp.)

5/13/2018 Chapter 9 - slidepdf.com
http://slidepdf.com/reader/full/chapter-9-55a753ec3aecd 49/62
381
tpeta 0.9 Turbine polytropic efficiencyn/(n-1) l turbine 4.4400 Turbine polytropic factor, k/[(k-1)+tpeta](dp/p) l combust 0.065 Combustor fractional pressure dropTo5 1027 C High pressure turbine inlet temperature
To5 1300 K To5 (K) = To5 (C) + 273To1=Toa 236.550 K Toa=Ta+Ca^2/(2+Cpa*1000)Poa = Po1 0.263 Bar Po1 = Poa = Pa+(Toa/Ta)^3.5Po2 0.434 Bar Po2=FPR+Po1
Po3 1.085 Bar Po3=(LPCPR)Po2
Po4 4.995 Bar Po4=Po3(HPCPR)
Po5 4.671 Bar Po5=Po4+[1 - (dp/p)] | combustTo2 277.31 K To2=To1+FPR^[(n-1)/n] I comp
To3 370.93 K To3=To2+(LPCPR)^[(n-1)/n] | compTo4 602.39 K To4=To3+HPCPR^[(n-1)/n] | compTo6 1097.38 K To6=To5-(Cpa/Cpg)+(To4-To3)To7 872.68 K To7=To6-(Cpa/Cpg)[(B+1)(To2-To1)+(To3-To2)]Po6 2.199 Bar Po6=Po5+(To6/To5)^[n/(n-1)] | turbine
Po7 0.795 Bar Po7=Po6+(To7/To6)^[n/{n-1)] | turbinePo7/Pc8 1.8530 Crit. press. ratio: Po7/Pc8=[(4/3+1)/2]^4Po7/Pa 4.1100 Core flow is choked
Po2/Pc9 1.8930 Crit. Press. ratio: Po2/Pc9=[(7/5+1)/2]^3.5Po2/Pa 2.2440 Bypass flow is choked
T8 748.02 K IF (Po7/Pc8) < (Po7/Pa) THEN T8=2+To7/(4/3+1)ELSE T8=To7/(Po7/Pa)^0.25
C8 535.02 m/s IF (Po7/Pc8)<(Po7/Pa) THEN C8=(287+T8+4/3)^0.5ELSE C8 = [(To7-T8)+2000+Cpg)]^0.5
P8 0.429 Bar IF Pc8>Pa THEN P8=Po7/(Po7/Pc8) ELSE P8=PaRho8 0.200 kg/m^3 Rho8=100+P8/(0.287*T8)
A8/m8 0.0094 m^2-s/kg A8/m8 = 1 / (C8+Rho8)
T9 231.09 K IF Pc9>Pa THEN T9=2To2/(7/5+1)
ELSE T9=To2/(Po2/Pa)^(1/3.5)C9 304.72 m/s IF Pc9>Pa THEN C9=(287+T8+7/5)^0.5
ELSE C=[(To2-T9)+2000+Cpa]^0.5P9 0.229 Bar IF Pc9>Pa THEN P9=Po2/(Po2/Pc9) ELSE P9=Parho9 0.346 kg/m^3 Rho9=100+P9/(0.287+T9)
A9/m9 0.009 m^2-s/kg A9/m9=1 / (C9+Rho9)
Specific Thrust, ST 242.9 N-s/kg ST = C8+C9+B-Ca+(B+1)+[(P8-Pa)+(A8/m8)+(P9-Pa)+(A9/m9)+B]+10^5/(B+1)
Thrust 24294.4 N Total engine thrust= mair(specific thrust)f/a 0.0186 f/a=Cpg(To5-To4)/HV
mfuel 0.466 kg/s Fuel flow rate=mair +(f/a)/(B+1)TSFC 0.000019 kg/N-s TSFC=(f/a)/[spec. thrust)(B+1)]TSFC' 0.069 kg/N-hr TSFC'=3600+TSFC
ST | core m 971.8 N-s/kg ST based on m8 = (B+1)+ST
The specific thrust is presented in two forms, one based on the total mass flowrate to the engine and the other based on the mass flow rate to the core engine. Theformer, ST, allows easy comparison with engines of comparable frontal area,while the latter, ST | core m, is useful in showing the thrust increase due to adding

5/13/2018 Chapter 9 - slidepdf.com
http://slidepdf.com/reader/full/chapter-9-55a753ec3aecd 50/62
382
a fan to a given core engine. Both definitions reduce to the common turbojetdefinition for B = 0, but deviate progressively with increasing bypass ratio. __________________________________________________________________
It is of interest to compare the performance of a turbofan and twin-spool turbojetin flight at the same altitude and velocity based on our computations. This is easilyaccomplished with the spreadsheet of Table 9.6 by setting FPR = 1.0 and B = 0 for the turbojet engine. Table 9.7 shows some of the parameters resulting from thiscomparison.
Table 9.7 Turbofan–Turbojet Comparison
Turbofan Turbojet
Core jet velocity, m/s 535.02 566.88
Bypass jet velocity, m/s 304.72 ---------
Thrust, N 24,294.4 67,745
Specific thrust based on total mass, N-s/kg 242.9 677.5
Specific thrust based on core mass, N-s/kg 971.8 677.5
Fuel mass flow rate, kg/s 0.466 1.862
TSFC, kg/N-hr 0.069 0.099
It is evident that the extraction of power to drive the fan reduces the core jetvelocity. The lower jet velocities substantially reduce the turbofan engine thrustfor the same size inlet and total engine mass flow rate. Thus the high-bypass-ratioturbofan is less likely to be used for military applications requiring high speed andtherefore high thrust per unit of frontal area. This is reflected in the specific thrust based on total engine mass flow. On the other hand, the specific thrust based oncore mass flow shows that a significant increase in thrust can be achieved byadding a fan to an existing turbojet design. The major advantage of the fanjet isshown in the fuel flow rate and TSFC comparisons, where the superior fueleconomy of the fanjet appears.
The success of the turbofan or ducted-fan engine has made it clear that further
advances in jet engine fuel economy are possible with higher bypass ratios. Thelarge-diameter cowlings necessary for drastic increases in turbofan bypass ratio,however, appear impractical. Still, advances in propeller technology now makeflight at high subsonic Mach numbers possible with gas-turbine-driven unductedfans.

5/13/2018 Chapter 9 - slidepdf.com
http://slidepdf.com/reader/full/chapter-9-55a753ec3aecd 51/62
383
Figures 9.32 and 9.33 show a UDF®* engine featuring contrarotating fansinstalled in an engine nacelle. A twin-spool gas generator upstream of the fanssupplies combustion gas to the cantilevered fan section. In this design the forwardfan blades are coupled directly to the outer fan-turbine blades, as shown in Figure9.34, and rotate clockwise. The free-wheeling aft fan section, which includes the _________ * UDF® is a registered trademark of General Electric Co., U.S.A..

5/13/2018 Chapter 9 - slidepdf.com
http://slidepdf.com/reader/full/chapter-9-55a753ec3aecd 52/62
384
inner fan-turbine blades, rear fairing, and tailcone assembly, is cantilevered at therear of the engine and rotates counterclockwise.
With unducted-fan engines, very high bypass ratios are possible. The UDFengine, with an overall pressure ratio of approximately 42 at top of climb, hasdemonstrated substantial SFC reductions over modern turbo fans, approximately20% lower than the best of the current turbofan engines. In-cabin noise, originally
expected to be a problem with unducted fans, was very low–equal to or less thanthat of today’s turbofan-powered aircraft (ref. 55).
Despite the attractiveness of the unducted fan concept, it appears that in thenext decade large transport aircraft will use ducted fans that incorporate moremodest increases in bypass ratio together with increases in overall pressure ratiofor improved performance. Reference 63, for example, anticipated the family of 75,000 to 95,000 pounds-thrust turbofans coming into use around 1995. They wereexpected to have a bypass ratio of 9 and overall pressure ratio about 45 to give a9% improvement in SFC over then-existing engines. The reference anticipated thatthe engines would have a low speed, low pressure ratio fan for low noise. The fanswere expected to be made of composite materials to save about 25% weight over
competing metal fans.
Bibliography and References
1. Curran, Paul F., "Clean Power at Cool Water," Mechanical Engineering , Vol.109, No. 8 (August 1987): 68-71.
2. Grover, Ralph W., et al.; "Preliminary Environmental Monitoring Results for The Cool Water Coal Gasification Program." Proceedings of the EPRI SixthAnnual Conference on Coal Gasification, Palo Alto, Calif., October 15–16, 1986.
3. Watts, Donald H., Dinkel, Paul W., and McDaniel, John E., "Cool Water IGCCPerformance to Date and its Future in the Electric Utility Industry," U.S. UtilitySymposium, Palm Springs, Calif., October 1987. 4. Gluckman, Michael J., et al., "A Reconciliation of the Cool Water IGCC PlantPerformance and Cost Data with Equivalent Projections for a Mature 360-MWCommercial IGCC Facility." Cool Water Gasification Program, October 1987.
5. Fahrion, M. E., "Materials Development Experience at Cool Water CoalGasification Plant." Cool Water Coal Gasification Program, October 1987.
6. Anon., "Boilers and Auxiliary Equipment," Power , June 1988: 91–229.
7. Ehrlich, Shelton, "Fluidized-Combustion Boiler Technology–1988 Update."Missouri Valley Electric Association Engineering Conference, Kansas City, Mo.,March 1988.
8. Ehrlich, Shelton, "Fluidized Combustion: Is It Achieving Its Promise?" ElectricPower Research Institute, Palo Alto, Calif.

5/13/2018 Chapter 9 - slidepdf.com
http://slidepdf.com/reader/full/chapter-9-55a753ec3aecd 53/62
385
9. Pollak, Robert, “Status of First U.S. CAES Plant,” EPRI Journal , December 1988: 49–52.
10. Allison, P. R., and Berman, P. A., “PACE 260 at Comanche, the First TwoYears.” ASME Gas Turbine Conference, ASME Paper 76-GT-109, 1976.
11. Anon., “Upgraded Combined Cycle Will Save Over $6 Million per Year inFuel,” Gas Turbine World , May–June 1968: 13–18.
12. Bammert, K. and Groschup, G., “Status Report on Closed-Cycle Gas Turbinesin the Federal Republic of Germany.” ASME Gas Turbine Conference, ASME paper 76-GT-54, 1976.
13. Williams, Robert H., and Larsen, Eric D., “Aeroderivative Gas Turbines for Stationary Power,” Annual Review of Energy, Vol. 13 (1988): 429-489.
14. Anon., “The Purpose of PURPA,” Mechanical Engineering , August 1988: 56.
15. Henneforth, James C., and Todd, Douglas M., “Cogeneration on a LargeScale,” Mechanical Engineering , August 1988: 51-53.
16. Anon., “Modular Cogeneration: A Capital Idea,” Mechanical Engineering,
August 1988: 54-57.
17. Diamant, R. M. E., Total Energy. New York: Pergamon Press, 1970.
18. Horlock, J. H., Cogeneration: Combined Heat and Power . New York:
Pergamon Press, 1987.
19. Williams, R. H., “Industrial Cogeneration,” Annual Review of Energy, Vol. 3,1978: 313-356.
20. Clarke, E. L., “Cogeneration, Efficient Energy Source,” Annual Review of
Energy, Vol. 11, 1986: 275-294.
21. Joskow, P. L., “The Evolution of Competition in the Electric Power Industry,” Annual Review of Energy, Vol. 13, 1988: 215-238.
22. Larson, E. D., and Williams, R. H., “Steam-Injected Gas Turbines,” ASME Journal of Engineering for Gas Turbines and Power , Vol. 109, January 1987: 55-63.
23. Burnham, J. B., Giuliani, M. H., and Moeller, D. J., “Development, Install-ation, and Operating Results of a Steam-Injection System (STIG) in a GeneralElectric LM 5000 Gas Generator,” ASME Journal of Engineering for Gas Turbinesand Power , Vol. 109 (July 1987): 257-262.
24. Boutacoff, David, “Pioneering CAES for Energy Storage,” EPRI Journal ,January-February 1989: 31-39.

5/13/2018 Chapter 9 - slidepdf.com
http://slidepdf.com/reader/full/chapter-9-55a753ec3aecd 54/62
386
25. Pollak, Robert, “Status of First U.S. CAES Plant,” EPRI Journal , December 1998: 49-52.
26. Anon., “The Circulating Fluidized Bed Boiler,” Heat Engineering , Foster Wheeler Corp., September-December 1986: 88-89.
27. Anon., “A Combined-Cycle Cogeneration Plant,” Heat Engineering , Foster Wheeler Corp., January-April 1986: 67-73.
28. Douglas. John, “Quickening the Pace of Clean Coal Technology,” EPRI Journal , January-February 1989: 5-15.
29. Clarke, Ed, “Cool Water Coal Gasification Program: An Update,” EPRI Journal , September 1988: 45-48.
30. Johnson, Gordon L., “Tailoring Controls to Accomodate Circulating FluidizedBed Boilers,” Power , May 1989:72-73.
31. Kolp, D. A., and Moeller, D. J., “World’s First Full STIG LM5000 Installed atSimpson Paper Company,” ASME Journal of Engineering for Gas Turbines and Power , Vol. 111 (April 1989): 200-210.
32. Scalzo, A. J., et al., “A New 150-MW High-Efficiency Heavy-DutyCombustion Turbine,” ASME Journal of Engineering for Gas Turbines and Power ,Vol. 111 (April 1989): 211-217.
33. Cohn, Art, “Steam-Injected Gas Turbines Versus Combined Cycles,” EPRI
Journal , October-November 1988: 40-43.
34. Holway, Donal K., and Moody, Joe R., Jr., “Salina Pumped Storage–Designand Operating History,” Waterpower ‘83, Proceedings of the InternationalConference on Hydropower, Vol. 2, 861-870, 1983.
35. Anon., “Pumped Storage,” Engineering Foundation Conference, AmericanSociety of Civil Engineers, 1975.
36. Barrows, H. K., Water Power Engineering. New York: McGraw-Hill, 1934.
37. Douglas, John, “Tools of the Trade for Hydro Relicensing,” EPRI Journal,
July-August 1988: 4-13.
38. Holway, Donal K., Private Communication, June 21, 1989.
39. Makansi, Jason., “Ultralow Emissions, Performance Tied to ProcessKnowhow,” Power , June 1989: 64-66.
40. Bretz, Elizabeth A., “Examine Full Impact of Injecting Steam into Gas TurbineSystems,” Power , June 1989: 53-61.

5/13/2018 Chapter 9 - slidepdf.com
http://slidepdf.com/reader/full/chapter-9-55a753ec3aecd 55/62
387
41. Brunner, Calvin R., Handbook of Hazardous Waste Incineration. Blue RidgeSummit, Pa: Tab Books, 1989.
42. Spiewak, Scott A., Cogeneration and Small Power Production Manual , 3rd ed.Lilburn, Ga.: Fairmont Press, 1991.
43. Weston, Kenneth C., “Turbofan Engine Analysis and Optimization UsingSpreadsheets,” Proceedings of the ASME Computers in Engineering Conference,August 1, 1989.
44. Cohen, H., Rogers, G. F. C., and Saravanamuttoo, H. I. H., Gas Turbine
Theory, 3rd ed. New York: Longman, 1987.
45. Wilson, David Gordon, The Design of High-Efficiency Turbomachinery and
Gas Turbines. Cambridge, Mass.: MIT Press, 1984.
46. Chenoweth, C. V., Schreiber, H., and Dolbec, A. C., “20 Years of Operation at
Horseshoe Lake Station–Oklahoma Gas and Electric Company,” Procedings of theAmerican Power Conference, Vol. 96, 1984.
47. Roll, Mark W., “The Dow Syngas Project,” Turbomachinery International ,Vol. 32, No. 1, January-February 1991: 28-32.
48. Larson, E. D., and Williams, R. H., “Biomass-Gasifier Steam-Injected GasTurbine Cogeneration,” ASME Journal of Engineering for Gas Turbines and
Power , Vol 112, April 1990: 157-163.
49. Zaugg, P., and Stys, Z. S., “Air-Storage Power Plants with Special
Consideration of USA Conditions,” Brown Boveri Review, Vol. 67 (December 1990): 723-733.
50. Kehlhofer, Rolf, Combined-Cycle Gas and Steam Turbine Power Plants.Lilburn, Ga: Fairview Press, 1991.
51. United Technologies Turbo Power and Marine Systems, Inc. FT8 Gas TurbineBrochure. 52. Goldstein, Gina, “Rechanneling the Waste Stream,” Mechanical Engineering ,Vol. 111 (August 1989): 44-50.
53. Butler, Arthur J., and Hufnagel, Karl R., “Skagit County Resource RecoveryFacility Design of a 2500-kW Waste-to-Energy Plant,” ASME ‘89–JPGC/Pwr-12,October 1989.
54. Douglas, John, “Beyond Steam,” EPRI Journal , December 1990: 4-11.
55., G.E. Aircraft Engines source, personal communication.
56. Riley, Shaun T., (manager of LM 5000 and Industrial programs, G. E. Marineand Industrial Engines & Service Div.), personal communication.

5/13/2018 Chapter 9 - slidepdf.com
http://slidepdf.com/reader/full/chapter-9-55a753ec3aecd 56/62
388
57. Riley, Shaun T., “STIG Increases Output from Aeroderivative Gas Turbines,”Modern Power Systems, June 1990: 41-47.
58. Stewart, Norman, “Shell Coal Gasification,” EPRI Journal , June 1989: 38-41. 59. Sundstrum, David G., “Status of the Dow Syngas Project: Three Years of
Experience at the World’s Largest Single Train Coal Gasification Plant,”Proceedings of the American Power Conference, Vol. 52, 1990, pp. 512-515.
60. Anon., “Gasifier Demo Heralds New Era for Gas Turbines,” Power , October 1989: S-24–S-28.
61. Anon., “Cogen System Balances Steam Cycle Demand,” Power , October 1989: S-42–S-44.
62. Ullman, Ronald R., and Duffy, Thomas J., “Integrated Material and EnergyRecovery from Municipal Solid Waste,” Proceedings of the American Power
Conference, Vol. 52, 1990, pp. 570-577.
63. Smith Jeffrey J., “ The GE90 ... When is Big’ Big Enough?” ASME TurboExpo–Land, Sea, and Air, Orlando, Fla., June 6, 1991.
64. Lamarre, Leslie, “Alabama Cooperative Generates Power from Air,” EPRIJournal, December 1991: 12-19.
65. United States Department of Energy website, www.fe.doe.gov.
66. Schroeter, Jeffrey W., “The Merchant Revolution,” Mechanical Engineering
Power , May, 2000. 67. Lane, Jon, “More Power, Fewer Players,” Mechanical Engineering Power ,May, 2000.
EXERCISES
9.1 A 10-MW gas turbine operating at the conditions in Example 5.1 exhauststhrough a process heat exchanger, with the combustion gas leaving at 200°F.What is the rate of heat transfer to the process? If the heat transfer is to liquid
water, what flow rate of water can be increased in temperature from 50°F to160°F in the heat exchanger? How many homes with an average heatingdemand of 60,000 Btu/hr could be serviced by the gas turbine in a districtheating application where there is a 20% energy loss in the system distribut-ing heat to the customers? What is the unweighted system energy utilizationfactor?
9.2 Design the combustion gas heat exchanger required in Exercise 9.1. Indicatethe type selected, the required surface area, the geometric configuration, andoverall size.

5/13/2018 Chapter 9 - slidepdf.com
http://slidepdf.com/reader/full/chapter-9-55a753ec3aecd 57/62
389
9.3 The oxygen remaining in the exhaust gas of a 5-MW gas turbine supplies theoxidizer for a process heater that burns methane completely. The gas turbineoperates at the conditions of Example 5.1. What is the nominal heat transfer rating if the heater is designed for an exit temperature of 300°F? What is therated of fuel consumption and the unweighted energy utilization factor of thiscombined heat and power system? What would the maximum heater output
be if the gas turbine were shut down and atmospheric air were supplied to theheater with the same supplemental fuel firing rate?
9.4 Compare the unweighted energy utilization factors for the simple-cycle andregenerative gas turbines of Examples 5.1 and 5.2, assuming their exhaustsserve unfired process heat exchangers with 250°F exit gas temperatures.Compare the energy utilization factors, assuming the useful heat in each isweighted by the cycle’s thermal efficiency.
9.5 The exhaust of a 2-MW gas turbine, operating at the conditions of Example5.1, transfers heat to an absorption chiller with a COP of 0.78. The exhaust
gas leaves the chiller at a temperature of 220°F. How many tons of refrigeration can be produced by the chiller? What is the unweighted EUF based on shaft power and chiller rate of cooling?
9.6 A 20-MW simple-cycle gas turbine operates with compressor inletconditions of 101 kPa and 15°C, a turbine inlet temperature of 1200°C, and acompressor pressure ratio of 12. The compressor and turbine isentropicefficiencies are 84% and 88%, respectively. The turbine exhaust flowsthrough a process heat exchanger and exits to the atmosphere at 110°C.Determine the gas turbine cycle state properties, the thermal efficiency, andthe work ratio, accounting for an 80-kPa pressure drop on the process heat
exchanger gas turbine exhaust side. What is the rate of heat transfer to the process through the heat exchanger? If the heat transfer is to liquid water,what flow rate of water can be boiled at atmospheric pressure if water entersthe heat exchanger at 30°C? How many homes with an average heatingrequirement of 20 kW can be heated in a district heating application wherethere is a 15% loss in the distribution of heat to customers? What is theunweighted system energy utilization factor?
9.7 Design the combustion gas heat exchanger required in Exercise 9.6. Indicatethe type selected, the required surface area, the geometric configuration,overall size, and the estimated pressure drops. Can you improve significant-
ly on the assumed heat exchanger pressure drop used in Example 9.6?
9.8 The exhaust of a 5-MW gas turbine supplies the oxidizer for a heater that burns methane completely. The gas turbine operates the 101 kPa and 15°Ccompressor inlet conditions and 1060K turbine inlet temperature. The enginehas compressor and turbine isentropic efficiencies of 86% and 88%, respect-ively, and a compressor pressure ratio of 10. What is the nominal heattransfer rating of the heater? What is the total rate of fuel consumption andthe unweighted energy utilization factor? Combustion gases leave the heater at 200°C.

5/13/2018 Chapter 9 - slidepdf.com
http://slidepdf.com/reader/full/chapter-9-55a753ec3aecd 58/62
390
9.9 The exhaust of a 2-MW gas turbine operating at 960°C turbine inlet temp-erature with a compressor pressure ratio of 9 transfers heat without loss tooperate an absorption chiller with a COP of 0.83. The exhaust gas leaves thechiller at a temperature of 120°C. The compressor inlet conditions are 105kPa and 25°C, and the compressor and turbine isentropic efficiencies are82% and 86%, respectively. How many tons of refrigeration can be produced
by the chiller?
9.10*Develop a spreadsheet like that in Table 9.1, and investigate the influence onthe combined-cycle efficiency of varyingeach of the following:
(a) HRSG exit temperature.(b) Steam turbine throttle temperature.(c) Gas turbine inlet temperature.(d) Compressor pressure ratio.
9.11 A closed-cycle gas turbine using air as a working fluid has an intercooler, areheater, and a recuperator. The overall pressure ratio is 6. The low-pressure
compressor has a pressure ratio of 2. Both compressors are driven by thehigh-pressure turbine. All turbomachines are 85% efficient. Compressor inlet temperatures are 80°F, and turbine inlet temperatures are 1500°F.Regenerator effectiveness is 75%.
(a) Draw T-s and flow diagrams, and label both compatibly.(b) Identify actual temperatures, in degrees Rankine, at all stations of sig-nificance.(c) If the low-pressure compressor inlet pressure is 6 atm, what are theintercooler and reheater gas pressures?(d) Calculate the total compressor work, and compare with the work for asingle compressor with 85% efficiency without intercooling.
(e) What is the gas turbine net work?(f) What is the total external heat addition?(g) How much heat is available from the precooler for district heating ?(h)What is the plant thermal efficiency?(i) What is the plant energy utilization factor if 80% of the precooler heatrejection is used for district heating?(j) If the turbines deliver 100MW of power, what is the air flow rate and(k) the rate of consumption of coal, in tons per hour (12,000 Btu/lbm
heating value and 90% combustion efficiency)?
______________________
* Exercise numbers with an asterisk involve computer usage.9.12 A closed-cycle gas turbine using air as a working fluid has an intercooler, a
reheater, and a recuperator. The overall pressure ratio is 6. The low-pressurecompressor has a pressure ratio of 2. Both compressors are driven by thehigh-pressure turbine. All turbomachines are 85% efficient. Compressor inlet temperatures are 15°C, and turbine inlet temperatures are 1000°C.Regenerator effectivenesss is 75%.
(a) Draw T-s and flow diagrams, and label both compatibly.(b) Identify actual temperatures, in degrees Kelvin, at all stations of signif-icance.

5/13/2018 Chapter 9 - slidepdf.com
http://slidepdf.com/reader/full/chapter-9-55a753ec3aecd 59/62
391
(c) If the low-pressure compressor inlet pressure is 6 atm, what are theintercooler and reheater gas pressures?(d) Calculate the total compressor work, and compare with the work for asingle compressor with 85% efficiency without intercooling.(e) What is the gas turbine net work?(f) What is the total external heat addition?
(g) How much heat is available from the precooler for district heating?(h) What is the plant thermal efficiency?(i) What is the plant energy utilization factor if 80% of the precooler heatrejection is used for district heating?( j) If the turbine delivers 100 MW of power, what is the air flow rate and(k) the rate of consumption of coal in kilograms per second (25,000 kJ/kgheating value and 90% combustion efficiency)?
9.13 Starting with the selected combined-cycle design for Example 9.1, consider amodification to the heat-recovery steam generator that allows saturated liquidwater at state 12 to be extracted for industrial process use. Assume that the
water is returned to the condenser as a saturated liquid at the condensingtemperature. Assume that process use dictates the mass flow rate extracted,with the balance of the water going as steam to the steam turbine. Calculateand tabulate the heat supplied per unit of gas turbine mass flow as a functionof the process liquid mass fraction of the total water flow entering the steamgenerator. Also calculate and plot the energy utilization factor as a functionof the process mass fraction. If the gas turbine power output is 6 MW, whatis the maximum saturated-liquid-water process heat transfer rate?
9.14* Starting with the selected combined-cycle design for Example 9.1, consider superheated steam at state 8 to be extracted for industrial process use.
Assume that the water is returned to the condenser as a saturated liquid atthe condensing temperature. Assume that process use dictates the massflow rate extracted, with the balance of the steam created going to thesteam turbine. Calculate and tabulate the process heat supplied per unit of gas turbine mass flow as a function of the process steam mass fraction of the water flow through the steam generator. Also calculate and plot theenergy utilization factor as a function of the process mass fraction. If thegas turbine power output is 6 MW, what is the maximum superheated-steam process heat transfer rate?
9.15 Extend the analysis of Table 9.1 to include supplemental firing of the HRSG,
to provide an inlet gas temperature of 1500°F and a steam turbine throttletemperature of 1000°F. Determine the influence of boiling temperature onthe pinchpoint temperature difference, and on the net work per pound of gasturbine flow; and compare the combined-cycle thermal efficiency with theefficiencies of the individual cycles. Discuss the results of the analysis.
9.16 Extend the analysis of Table 9.1, to consider a modification of the heat-recovery steam generator that allows saturated water vapor at state 13 to beextracted for industrial process use. Assume that the water is returned to thecondenser as a saturated liquid at the condensing temperature. Assume that process use of the steam has priority, with the balance of the steam going to

5/13/2018 Chapter 9 - slidepdf.com
http://slidepdf.com/reader/full/chapter-9-55a753ec3aecd 60/62
392
the steam turbine. Calculate and tabulate the process heat supplied per unit of gas turbine mass flow as a function of the process water mass fraction of thewater flow through the steam generator. Also calculate and plot the energyutilization factor as a function of the process mass fraction. It the total power output of the combined cycle is 6 MW, what is the maximum process heattransfer rate?
9.17 Extend Exercise 9.15 to consider a modification of the heat-recovery steamgenerator that allows superheated steam at state 8 to be extracted for industrial process use. Assume that the water is returned to the condenser asa saturated liquid at the condensing temperature. Assume that process use of the steam has priority, with the balance of the steam going to the steamturbine. Calculate and tabulate the process heat supplied per unit of gasturbine mass flow as a function of the process steam mass fraction of thewater flow through the steam generator for a boiling temperature of 600°F.Also calculate and plot the energy utilization factor as a function of processmass fraction. If the total power output of the combined cycle is 20 MW with
no process heat, what is the maximum process heat transfer rate?
9.18 Design an open-cycle regenerative gas turbine cogeneration system in whicha fraction of the turbine exhaust gas can bypass the heat exchanger for process use. Prepare a report stating your design criteria, defining your analysis methodology, and presenting performance data for the nominaldesign condition that you selected.
9.19 Perform the design required in Exercise 9.18, and include consideration of performance for a range of off-design process heat transfer requirements thatare lower than the design value.
9.20 A 20-MW electric motor in a simple compressed-air-storage plant drives acompressor with a pressure ratio of 10 and an efficiency of 85% for six hoursnightly. What power output can be obtained with a turbine inlet temperatureof 1600°F if the plant operates for four hours during the day at constant power output? The turbine efficiency is 90%. What is the air-fuel ratio if methane is the fuel used? What is the net generation efficiency, consideringonly the fuel consumption of the turbine? Assume a daily cycle, that cavern pressure changes are negligible, and that the heat of compression isdissipated before generation begins.
9.21* An ideal steam turbine operates with 1000°F, 2000-psia throttle, and 1-psiacondenser and produces 15 MW without extraction. When steam is extractedfor process use at 500 psia, after use it is condensed to a saturated liquid atthat pressure and throttled to the condenser. Tabulate and plot the processheating rate and the EUF as a function of extraction mass fraction.
9.22* A 25 MW steam turbine operates in 1000°F and 2000 psia with an efficiencyof 87%. Eighty percent of the condenser heat transfer is used for anindustrial process. Tabulate and plot the process heating rate and the EUF asa function of condenser pressure between 1 psia and 2 atmospheres.

5/13/2018 Chapter 9 - slidepdf.com
http://slidepdf.com/reader/full/chapter-9-55a753ec3aecd 61/62
393
9.23* Develop the equations and an algorithm for the analysis of the steam-injected gas turbine with an unfired steam generator producing superheatedsteam at the combustion chamber pressure and using methane as a fuel . Usethe JANAF tables for thermodynamic properties of steam in the gas turbine.State clearly the assumptions made. Write a computer programmingimplementing the algorithm.
9.24 Consider a compressor operating at a pressure ratio of 20 and a polytropicefficiency of 86% that compresses ambient air at 101 kPa and 15°C into acavern. Assume that heat losses from the cavern maintain the air at 15°C andconstant pressure during the filling period from midnight to 6 am daily. Thecompressor is driven by a 20 MW electric motor. What is the daily massaddition to the cavern? From 2 pm to 6 pm daily the same mass of air thatwas added to the cavern during the night is heated to 1200K and allowed toescape to the atmosphere at a constant flow rate through a turbine expander with a 90% isentropic efficiency. What is the expander power output? Whatis the daytime energy output? What is the fractional fuel consumption
reduction if a regenerator with 80% effectiveness is added to the system?
9.25 Resolve Example 9.2 for superheated steam injection at 400°, 500°, 600°,and 700°F and the combustor pressure level. Write a brief report on your findings on the influence of temperature of injected steam on STIG perform-ance.
9.26* Use the STIG spreadsheet shown in Table 9.5 to verify the performancecalculations of Figures 9.23 and 9.24.
9.27* Investigate the influence of compressor pressure ratio variation on STIG
performance for the model of Example 9.2, and prepare a memo reportingyour results.
9.28* Evaluate the separate influences of steam heat capacity and added mass onthe thermal efficiency, power output, and work ratio for the model of Example 9.2.
9.29 Consider a two-shaft gas turbine to be modified for steam injection. Thecompressor pressure ratio is 9.3, and the turbine inlet temperature is 982°C.The isentropic efficiencies of the compressor and turbines are 83% and 90%,respectively. The gas generator mechanical efficiency is 99%, and the power
turbine drives an electrical generator that has a 93% efficiency. Accountingfor a 4% pressure loss in the combustor and a fuel heating value of 43,000kJ/ kg, compare the electrical power output, specific fuel consumption,thermal efficiency, and fuel-air ratios for 0.0 and 0.05 steam-air ratios.Briefly described your selection of steam system design conditions.
9.30 It has been decided that the heat-recovery steam generator for a steam-injected gas turbine must be retubed to continue running it in the steaminjection mode. The expected cost of retubing is $230,000. Steam injection produces an additional 4000 MW-hr per year, adding two cents per kW-hr to

5/13/2018 Chapter 9 - slidepdf.com
http://slidepdf.com/reader/full/chapter-9-55a753ec3aecd 62/62
394
revenue. What is the break-even operating time to recover the cost of thismaintenance operation?
9.31 Compare the isentropic efficiencies of two compressors, each having a polytropic efficiency of 87% and pressure ratios of 6 and 18.
9.32 What is the polytropic efficiency of a turbine, with a pressure ratio 30, thathas the same isentropic efficiency as a turbine having a polytropic efficiencyof 92% at a pressure ratio of 12?
9.33* Compare the performance of a twin-spool turbofan engine with separate fanand compressor to that of a turbojet engine, both with an overall pressureratio of 30 and a turbine inlet temperature of 1300K, and designed for analtitude of 15,000m and a flight speed of 275 m/s. The bypass ratio is 6 andthe fan pressure ratio is 1.6. Assume turbine, fan, and compressor polytropicefficiencies of 90% and a combustor pressure loss of 3% of the compressor exit total pressure. Compare specific thrusts for engines built from the same
core engine. Compare, also, specific fuel consumption and jet velocities.
9.34* Build a multicase spreadsheet for the conditions of Exercise 9.33, and use itto plot specific thrust and TSFC as a function of fan pressure ratio. Use thespreadsheet to explore further the influence of varying bypass ratio for avalue of fan pressure ratio suggested by your plot. Write a memo discussing briefly the results of your study.
9.35 Develop an analysis for a turbofan engine, sometimes called an aftfanengine, in which the fan is located at the same axial station and directlyattached to a low pressure turbine dedicated to driving the fan. The high-
pressure turbine drives the compressor, and is located upstream of the fan.The compressor and fan each have their own separate inlets.
9.36 Express the work of a compressor in terms of its inlet temperature and pressure ratio using (a) the isentropic efficiency, and (b) the polytropicefficiency. Equate the relations, and solve for the compressor isentropicefficiency. Compare your result with Equation (9.13).
9.37 Express the work of a turbine in terms of its inlet temperature and pressureratio using (a) the isentropic efficiency, and (b) the polytropic efficiency.
Equate the relations, and solve for the turbine isentropic efficiency. Compareyour result with Equation (9.10).