CHAPTER 9-2 LIGHT: ADAPTATIONS FOR SHADE
30
Glime, J. M. 2017. Light: Adaptations for Shade. Chapt. 9-2. In: Glime, J. M. Bryophyte Ecology. Volume 1. Physiological Ecology. 9-2-1 Ebook sponsored by Michigan Technological University and the International Association of Bryologists. Last updated 17 July 2020 and available at <http://digitalcommons.mtu.edu/bryophyte-ecology/>. CHAPTER 9-2 LIGHT: ADAPTATIONS FOR SHADE TABLE OF CONTENTS Structural Adaptations for Light Capture ............................................................................................................ 9-2-2 Lamellae....................................................................................................................................................... 9-2-3 Surface Reflectance...................................................................................................................................... 9-2-4 Altering Wavelengths .................................................................................................................................. 9-2-4 Papillae......................................................................................................................................................... 9-2-6 Leaf Area Index ........................................................................................................................................... 9-2-9 Self-shading ...................................................................................................................................................... 9-2-10 Bryophyte Canopy ..................................................................................................................................... 9-2-10 Growth and Branching ............................................................................................................................... 9-2-11 Chlorophyll Fluorescence ................................................................................................................................. 9-2-14 Morphological Responses ................................................................................................................................. 9-2-14 Physiological Adaptations to Low Light ........................................................................................................... 9-2-16 Chlorophyll ................................................................................................................................................ 9-2-17 Other Pigments........................................................................................................................................... 9-2-19 Chloroplast Movement ............................................................................................................................... 9-2-20 Light and Storage ....................................................................................................................................... 9-2-22 Forest Gaps ....................................................................................................................................................... 9-2-23 Sunflecks ........................................................................................................................................................... 9-2-26 Litter Burial ....................................................................................................................................................... 9-2-27 The Partnership Choice ..................................................................................................................................... 9-2-27 Summary ........................................................................................................................................................... 9-2-27 Acknowledgments ............................................................................................................................................. 9-2-28 Literature Cited ................................................................................................................................................. 9-2-28
Transcript of CHAPTER 9-2 LIGHT: ADAPTATIONS FOR SHADE

Glime, J. M. 2017. Light: Adaptations for Shade. Chapt. 9-2. In: Glime, J. M. Bryophyte Ecology. Volume 1. Physiological Ecology. 9-2-1 Ebook sponsored by Michigan Technological University and the International Association of Bryologists. Last updated 17 July 2020 and available at <http://digitalcommons.mtu.edu/bryophyte-ecology/>.
CHAPTER 9-2
LIGHT: ADAPTATIONS FOR SHADE
TABLE OF CONTENTS
Structural Adaptations for Light Capture ............................................................................................................ 9-2-2 Lamellae ....................................................................................................................................................... 9-2-3 Surface Reflectance ...................................................................................................................................... 9-2-4 Altering Wavelengths .................................................................................................................................. 9-2-4 Papillae ......................................................................................................................................................... 9-2-6 Leaf Area Index ........................................................................................................................................... 9-2-9 Self-shading ...................................................................................................................................................... 9-2-10 Bryophyte Canopy ..................................................................................................................................... 9-2-10 Growth and Branching ............................................................................................................................... 9-2-11 Chlorophyll Fluorescence ................................................................................................................................. 9-2-14 Morphological Responses ................................................................................................................................. 9-2-14 Physiological Adaptations to Low Light ........................................................................................................... 9-2-16 Chlorophyll ................................................................................................................................................ 9-2-17 Other Pigments ........................................................................................................................................... 9-2-19 Chloroplast Movement ............................................................................................................................... 9-2-20 Light and Storage ....................................................................................................................................... 9-2-22 Forest Gaps ....................................................................................................................................................... 9-2-23 Sunflecks ........................................................................................................................................................... 9-2-26 Litter Burial ....................................................................................................................................................... 9-2-27 The Partnership Choice ..................................................................................................................................... 9-2-27 Summary ........................................................................................................................................................... 9-2-27 Acknowledgments ............................................................................................................................................. 9-2-28 Literature Cited ................................................................................................................................................. 9-2-28

9-2-2 Chapter 9-2: Light: Adaptations for Shade
CHAPTER 9-2
LIGHT: ADAPTATIONS FOR SHADE
Figure 1. Hemlock hardwood forest in West Virginia, showing the absence of bryophytes among the leaf litter on the forest floor but growing on exposed rocks. Photo by Janice Glime.
Structural Adaptations for Light Capture
Among my favorite posters at the meetings of the Ecological Society of America, 1993, were the several posters on light focussing by seed plants (DeLucia et al. 1996). These illustrated principles I have considered for bryophytes but been unable to test. They found that epidermal cells (lens cells) that are rounded at the surface can focus the light in the leaf. In shade leaves, these lens cells are spherical; in the sun they are elliptical. In bryophytes, some leaves have mammillose (swollen) cells that are similar to the lens cells they describe (Figure 5). The ability of these cell surfaces to focus light on the chloroplasts has not been explored, except in the case of the protonemata of Schistostega pennata (Figure 2-Figure 4), as will be discussed in Chapter 9-5 of this volume.
Figure 2. Schistostega pennata with mature plants in upper left and luminescent protonemata in lower center. Photo courtesy of Martine Lapointe.

Chapter 9-2: Light: Adaptations for Shade 9-2-3
Figure 3. Schistostega pennata protonema with light-focussing cells. Photo courtesy of Irene Bisang.
Figure 4. Schistostega pennata leafy gametophytes. Photo courtesy of Martine Lapointe.
Tracheophytes can move their leaves instead of their chloroplasts. In their study, DeLucia et al. (1996) found that further adjustments to the light reaching the chloroplasts of tracheophyte leaves were facilitated by leaf angles. In mesic woods, fewer than 10% of the leaves were angled more than 60º, whereas in xeric sites with high light intensity more than 75% of the leaves were angled. Leaf thickness also related to moisture, with 75% of taxa at the three most open sites having leaves more than 0.4 mm thick, while at more mesic sites less than 12% of the taxa reached such a thickness. High sunlight resulted in palisade tissue on both sides of the leaf.
In a different poster, DeLucia et al. (1996) noted attenuation of green light by 2.7 times and red light by 8 times in the air space at the palisade/mesophyll interface. By applying oil to fill the air spaces, they reduced reflectance and caused a decrease in fluorescence by 50%. They interpreted this to mean that reflectance in the air space caused more light to be available for absorbance by the chloroplasts. A thick palisade reduces the reflectance and therefore reduces the light reaching the spongy mesophyll. At light intensities of less than 30 µM m-2 s-1,
the air space reflectance increased the photosynthetic rate by 30-50%, with lesser increases at higher light intensities.
If we consider the bryophyte branch to act like a leaf, these principles could be tested in bryophytes. Lens-shaped leaf cells (Figure 5) could focus light on cells of overlapped leaves that are more moist because of their internal position. Such a focussing would be facilitated by the tendency for moss chloroplasts to arrange themselves around the periphery of the cell, thus leaving the center of
the cell available for focussing without increasing absorption. Can we find any correlation between the leaf or branch position of bryophytes and the light regimes under which they grow?
Figure 5. Leaf of Plagiomnium tuomikoski showing bulging (mammillose) cells that could focus light within the cell. Photo by Zen Iwatsuki, with permission.
Lamellae
Mosses like Polytrichum (Figure 6-Figure 7) and Atrichum (Figure 8-Figure 9) have a leaf structure with lamellae (Figure 7, Figure 9) similar to the structure of palisade tissue in seed plants, while the internal structure of a branch in most other bryophytes in many ways resembles the air spaces and spongy mesophyll of seed plants.
Figure 6. Polytrichum juniperinum showing leaf edges rolled over the lamellae. Photo by Janice Glime.
Figure 7. Polytrichum juniperinum leaf lamellae and rolled over edge of leaf. Photo courtesy of John Hribljan.

9-2-4 Chapter 9-2: Light: Adaptations for Shade
Figure 8. Atrichum altecristatum leaves with lamellae. Photo courtesy of Eric Schneider.
Figure 9. Cross section of leaf showing the lamellae of Atrichum selwynii. Photo from Botany Website, UBC, with permission.
Surface Reflectance
Lovelock and Robinson (2002) have found that various mosses differ in their surface reflectance properties and that the differences do not correlate with pigment concentrations, suggesting that surface shape and water content may play a role in surface reflectance. In studying the Antarctic mosses Bryum pseudotriquetrum (Figure 10), Ceratodon purpureus (Figure 11), and Schistidium antarcticum (Figure 11), Lovelock and Robinson (2002) found that the reflectance spectra were similar to those of angiosperm leaves with chlorophyll having the major influence. The mosses likewise did not differ from angiosperms in their UV reflectance, but they did differ significantly at 526, 550, and 850 nm light wavelength and seemed to have a different cold hard band – that portion of the absorbance that correlates with the formation of the chlorophyll-protein complex that protects against freezing damage. It is no surprise that Ceratodon purpureus had higher concentrations of anthocyanins (Figure 12), since it is frequently red-tinged, whereas it had lower chlorophyll concentrations than the other two species. Bryum pseudotriquetrum (Figure 10) had higher levels of UV-absorbing pigments but lower carotenoid levels than the other two taxa, but the other two taxa had higher levels of pigments associated with photoprotection from visible light. The correlation between surface reflectance and
plant pigment concentration was low, suggesting that surface structure may have played a major role in reflectance. Rehydration of dry Schistidium antarcticum resulted in a significant increase in the photosynthetic reflectance (Figure 11), but it is unclear as to the mechanism. The surface reflectance is highly influenced by the environmental conditions under which the mosses are growing and seems to be linked to water content and morphology of the individual plants and their clone.
Figure 10. Bryum pseudotriquetrum growing in Antarctica. Photo courtesy of Jan Beard.
Figure 11. Wet Schistidium antarcticum hummocks illustrating the high reflectance. Ceratodon purpureus is in the hollows. Photo courtesy of Rod Seppelt.
Figure 12. Ceratodon purpureus with anthocyanins protecting it from the high levels of UV light in the Antarctic. Photo courtesy of Rod Seppelt.
Altering Wavelengths
Light is modified as it travels through the atmosphere, losing energy and lengthening the wave lengths, thus

Chapter 9-2: Light: Adaptations for Shade 9-2-5
changing the quality of the light. This of course doesn't mean good or bad, but rather means the color composition of the light changes.
The mosses themselves also alter the light quality. They reflect the colors we see, absorb others, and transmit still others. They typically absorb blue and red light, as do tracheophytes, but they differ from tracheophytes in having a green peak that responds to the red, brown, or green coloration of various species (Bubier et al. 1997). In their study, Bubier and coworkers examined boreal forest and peatland mosses, including feather mosses (forests; Figure 13), brown mosses (rich fens; Figure 20), and Sphagnum (bogs and poor fens; Figure 14-Figure 19). They found that the mosses are typically less reflective than are tracheophytes, resulting from strong water absorption features in the range of 1.00-1.20 μm. This absorption results in reflectance peaks at ~0.85, 1.10, and 1.3 μm (NIR 1, 2, & 3). Sphagnum species have a minor absorption at 0.85 μm that is absent in all brown and feather mosses and in all tracheophytes. Furthermore, the red absorption is narrow in Sphagnum. Bubier and coworkers concluded that the overall moss reflectance in the 1.50-2.50 region is lower than that for tracheophytes because of the higher water content of moss tissue. This is further supported by the high reflectance of lichens, which typically have dry tissues.
Figure 13. Pleurozium schreberi, a feather moss from the forest floor. Photo by Sture Hermansson, with online permission.
Figure 14. Sphagnum hyaline cells & pores (SEM), a structure that may alter the light quality that is reflected and that enters the photosynthetic cells. Photo from Botany Website, UBC, with permission.
Figure 15. Sphagnum austinii, exhibiting one of the many colors in the genus Sphagnum. Photo by Des Callaghan, with permission.
Figure 16. Sphagnum balticum (brownish red) and S. cuspidatum (light green) showing two contrasting colors in the genus Sphagnum). Photo by Jan-Peter Frahm, with permission.
Figure 17. Sphagnum capillifolium, one of the red species of Sphagnum. Photo by Blanka Shaw, with permission

9-2-6 Chapter 9-2: Light: Adaptations for Shade
Figure 18. Sphagnum fuscum, one of the brown species of Sphagnum. Photo by Andres Baron Lopez, with permission.
Figure 19. Sphagnum magellanicum, one of the species that becomes red in bright light. Photo by Michael Lüth, with permission.
Figure 20. Warnstorfia exannulata, one of the brown mosses. Photo from Biopix, through Creative Commons.
Papillae
I wonder how papillae (Figure 21-Figure 28) might fit the reflectance model. I have long thought that papillae might serve to scatter the light on a dry moss while permitting transmission on a wet one. It would seem like a relatively easy thing to test with a microscope and
photometer. And does the shape of the papillae make a difference (Figure 21-Figure 28)?
Figure 21. Tortula muralis, a papillose moss of open habitats. Photo from Botany Website, UBC, with permission.
Figure 22. Tortula muralis showing leaves that look waxy due to papillae. Photo by Christophe Quintin, through Creative Commons.
Figure 23. Tortula muralis leaf cell papillae. Photo by Walter Obermayer, with permission.

Chapter 9-2: Light: Adaptations for Shade 9-2-7
Figure 24. Tortula muralis leaf CS showing papillae on both sides of the leaf. Photo from Botany Website, UBC, with permission.
Figure 25. Tortula muralis papillae (SEM). Photo from Botany Website, UBC, with permission.
Figure 26. Callicostellopsis meridensis leaf papillae (SEM). Photo by Duarte-Silva et al. 2013, through Creative Commons .
Figure 27. Hypnella pilifera leaf papillae (SEM). Photo by Duarte-Silva et al. 2013, through Creative Commons.
Figure 28. Pilotrichidium leaf papillae (SEM). Photo from Duarte-Silva et al. 2013, through Creative Commons.
The role of papillae has been controversial at best. Crandall-Stotler and Bozzola (1991) have shown that at least Andreaeobryum macrosporum (Figure 29) leaf papillae have narrow channels through which water can enter upon rehydration. It has occurred to me that these channels might also behave as fiber optics – a notion that remains to be tested.
Figure 29. Andreaeobryum macrosporum, a moss with channelled papillae. Photo from Botany Website, UBC, with permission.
Proctor (1982) explains that in concave leaves, water is held in the concavity while the convex surface remains dry.

9-2-8 Chapter 9-2: Light: Adaptations for Shade
It is this convex surface that often is exposed to light. In papillose mosses such as Thuidium (Figure 30-Figure 31) and Hedwigia (Figure 32-Figure 35), the tops of papillae tend to remain dry, even when the leaf surface is wet, giving them that waxy or dull appearance. The tiny channels, when present, could function as fiber optics, much as the fur of a polar bear, but on a much smaller scale. Hence, the light could be focussed through the papillae onto the chloroplasts while water is obstructing and altering the light entering other parts of the cell. As can be seen in Table 1, there are lots of potential light adaptations in bryophytes that remain to be tested.
Figure 30. Thuidium delicatulum, a moss of light shade. Photo by Janice Glime.
Figure 31. Thuidium delicatulum leaf showing papillae (see edges). Photo from Dale A. Zimmerman Herbarium, Western New Mexico University, with permission.
Figure 32. Hedwigia ciliata wet on upper left and dry at the edges of the clump on the right. Photo by Janice Glime.
Figure 33. Hedwigia ciliata showing overlapping leaves with white tips. Photo by Des Callaghan, with permission.
Figure 34. Leaf tip of Hedwigia ciliata showing papillae on cells. Photo by Janice Glime.
Figure 35. Hedwigia ciliata leaf cs showing papillae on both surfaces. Photo from Dale A. Zimmerman Herbarium, Western New Mexico University, with permission.

Chapter 9-2: Light: Adaptations for Shade 9-2-9
Table 1. Comparison of sun and shade leaves of bryophytes and seed plants. + = high rates or large amounts, - = low rates or small amounts, ? = unknown. [Data for seed plants (tra) from Larcher 1983, compiled from many authors, with characteristics applying to structures that don't exist in bryophytes omitted; bryophyte (bry) data based on literature presented in this volume.]
Characteristic Sun Shade Leaves Leaves bry tra bry tra
Structural features Area of leaf blade + - + + Cell number ? + ? - Chloroplast number per unit area ? + ? - Density of packing of the membrane ? - ? + systems in the chloroplasts Chemical features Dry matter + + - - Energy content of dry matter ? + ? - Water content of fresh tissue - - + + Cell-sap concentration ? + ? - Starch ? + ? - Cellulose ? - ? + Lignin ? + ? - Lipids ? + ? - Acids ? + ? - Anthocyanin, flavonoids + + - - Ash ? + ? - Ca/K ? + ? - Chlorophyll a/b + + + - Chlorophyll a (P-700) -? + +? - Photosystem II pigment complex - - + + Chlorophyll/xanthophylls ? - ? + Lutein/violaxanthin + + -? - Functional features Photosynthetic capacity - + + - Respiratory intensity ? + ? -
Leaf Area Index
The leaf area index (LAI) has been used to show structural responses of tracheophyte leaves to high vs low light conditions. This value represents the percentage of ground area covered by leaves, hence (total leaf area) / (area of ground). Likewise, bryophytes can exhibit a leaf area index that is directly proportional to the light intensity (Sluka 1983). Unfortunately, few measurements have been taken on bryophytes. Simon (1987) compared two desiccation-tolerant mosses with one more mesic species and found what she considered to be high LAI values. For Syntrichia ruralis (Figure 36), the LAI was 44, for Ceratodon purpureus (Figure 37) 129, and for the more mesic Hypnum cupressiforme (Figure 38) 103. These indeed seem to be enormous. By contrast, forest floor tracheophyte species in a montane forest had an LAI of only 3.8 (Schleppi et al. 1999); in a tropical cloud forest the LAI was only 1.6 in a gap less than 8 months old, increasing to the pre-gap level of 5.1 in three years (Lawton & Putz 1988). Larcher (1995) considered 4-6 to be optimal for herbaceous plants with horizontal leaves and 8-10 optimal for grasses. Asner et al. (2003) reviewed more than 1000 LAI studies from around the world and found that the maximum for an ecosystem was 18 with a mean of 5.2±4.1. The macroalga Fucus serratus (Figure 39) achieved its maximum productivity for an individual at LAI 8-10, while the community did best at 6-8 (Binzer & Sand-Jensen 2002). At the biome level, the LAI seems to range from 0.5 to 16, hardly making a showing against the high values measured by Simon (1987) for bryophytes.
Figure 36. Syntrichia ruralis, a species with a high leaf area index (LAI) compared to most tracheophytes, but not as high as forest bryophytes like Hypnum cupressiforme. Photo by Michael Lüth, with permission.
Figure 37. Ceratodon purpureus, a moss with a very high LAI. Photo by Jiří Kameníček (BioLib, Obázek), with permission.
Figure 38. Hypnum cupressiforme, exhibiting a high leaf area index. Photo by Michael Lüth, with permission.

9-2-10 Chapter 9-2: Light: Adaptations for Shade
Figure 39. Fucus serratus, a brown alga with a leaf area index (LAI) closer to that of tracheophytes than to bryophytes. Photo by Stemonitis, through Creative Commons.
Just why should bryophytes have such enormous LAI values? As we know from tracheophytes, leaves arranged with minimal overlap vertically will have maximal exposure to sunlight, whereas crowded leaves that overlap (having a high LAI) will cause the plant to exhibit self-shading. Furthermore, leaves that have a strong vertical orientation will have minimal direct exposure to light, thus requiring more leaves. This latter condition would seem to describe some mosses, but not the thallose or two-ranked leafy liverworts. Simon (1987) suggested that the high leaf area found in bryophytes might facilitate uptake of the high levels of CO2 found near the soil surface. Other advantages might result from the vertical growth and close packing with neighbors, with clustered apical leaves taking maximal advantage of the light. On the other hand, the entire moss branch might behave much like a single leaf of a tracheophyte, with overlapping leaves protecting the chlorophyll from UV damage and maintaining moist internal spaces. New techniques for tracheophytes using models that incorporate both LAI and a foliage clumping index indicate that both measures are needed to separate sun from shade leaves (Chen et al. 2003), and it seems that this technique might permit us to explain the high leaf area index of bryophytes, where many leaves are shaded by the upper leaves of the same plant or by overlying branches of prostrate plants.
Self-shading
Because of their three-dimensional nature, plants typically shade themselves. As a result of the high leaf area index, a moss cushion is a source of rapid light extinction due to self-shading. Using Antarctic mosses, Davey and Ellis-Evans (1996) demonstrated that irradiance decreases with increasing depth within the moss – no surprise there. Furthermore, the greatest loss of light was at wavelengths around 675 nm and less than 450 nm, in the neighborhood of those portions of the spectrum causing the greatest chlorophyll activity. Of course species differed in light attenuation, with stem orientation being the most important factor, along with stem density, leaf size, orientation, and pigment content. Light penetration increased upon drying – seemingly a maladaptive trait that would permit light to damage chlorophyll, but an expected
result for mosses that curl or fold their leaves upon drying. On the other hand, Davey and Ellis-Evans suggested that this deeper light penetration of dry mosses might permit photosynthesis to occur in the deeper layers (these most likely also being more moist) and thus make up for some of the photosynthetic loss in the drier apical parts.
Bryophyte Canopy
As we have just seen, not only do trees and other tracheophytes provide a canopy over the bryophytes, but the bryophytes themselves provide a canopy that alters the light reaching the lower parts of the plants. This canopy is structured differently and functions differently, relating to issues of scale and external transport of water and nutrients (Rice & Cornelissen 2014). Hence bryophytes demand different methodologies to truly understand their use of light and ultimate photosynthetic product.
Habitats vary in their light quality and intensity and the bryophytes further alter this light in the bryophyte canopy (Figure 40) (Tobias & Niinemets 2010). These authors set out to document bryophyte differences in chlorophyll, carotenoids, nitrogen concentrations, and photosynthetic electron transport capacity as they varied with the light profiles above and within populations of the moss Pleurozium schreberi (Figure 41). Light differences between habitats resulted in increases in chlorophyll, chlorophyll:N, and chlorophyll:carotenoids as light decreased, thus increasing the light harvesting in low light and increasing light protection in higher light. N levels in the plants were independent of light intensity. In the upper moss canopy (Figure 41) where light was at least 50-60% of the above-canopy light, changes in moss chemistry and photosynthetic output were similar to those observed in the between-habitat light gradient. However, deeper canopy layers mimicked the effects of senescence (Figure 40), with pigment and nitrogen concentrations and photosynthetic capacity decreasing with light availability. They considered the chemical and physiological variation in the moss canopy to be a balance between acclimation and senescence.
Figure 40. Pleurozium schreberi showing a canopy with an active green layer and a senescent lower layer. Photo by Janice Glime.

Chapter 9-2: Light: Adaptations for Shade 9-2-11
Figure 41. Pleurozium schreberi as seen at the top of the moss canopy, a typical species in boreal forests. Photo by Janice Glime.
In low light, the foliage is less densely aggregated and plant density is lower, permitting greater light penetration and greater light interception per unit of leaf area (Niinemets & Tobias 2014). In healthy tissues, chlorophyll increases as light levels diminish. But one of the consequences of aging in mosses is that the tissues senesce. This senescent zone is likewise deeper in the moss mat and consequently gets less light. This senescent moss zone has reduced chlorophyll content.
Canopy architecture differs among species. Species, especially of pleurocarpous mosses, that are able to branch and from new leaves from lateral buds are able to extend into areas with greater light as well as providing more opportunities for catching sunflecks (Niinemets & Tobias 2014). One advantage is that plants in high light intensity tend to have cushion growth forms that protect them from the accompanying desiccation. Those in shaded habitats often also experience the greater moisture that permits them to spread horizontally and capture more light.
Rice et al. (2014) examined the effects of drying on light relations in ten species of Sphagnum (Figure 15-Figure 19). They found that spatial variation in the rate of photosynthetic electron transport increased during drying and in high light intensities. There was a positive relationship between that rate and light intensity, but the relationship with drying was negative, and the light and moisture interacted to create the spatial variation. Within the canopy of the moss Pleurozium schreberi (Figure 41-Figure 41), the mat temperature reached a 9°C span. In the leafy liverwort Bazzania trilobata (Figure 42), the Lambert-Beer Law predicted the attenuation of light within the liverwort canopy.
Figure 42. Bazzania trilobata, illustrating overlapping branches. Photo by Jan-Peter Frahm, with permission.
Growth and Branching
Low light in plants often results in etiolation, elongated growth that often lacks accompanying weight gain, creating thin and often chlorotic plants with long internodes and small, rudimentary leaves. Such growth is seen in grass when a board or rug rests on it for a period of weeks. Bryophytes are no exception to this phenomenon, and increased elongation in incubators should not be mistaken for healthy plants if the plants become long and thin. For example, in one study Dicranum majus (Figure 43) had its greatest elongation at the lowest irradiance (20 µm m-2 s-1) (Bakken 1995).
Figure 43. Dicranum majus with capsules, a species that has the greatest elongation in low light. Photo by Michael Lüth, with permission.
Bates (1988) examined the effect of shoot spacing on growth and branch development in Rhytidiadelphus triquetrus (Figure 44). Using intermittent moisture supply and spacings of 5, 10, 20, and 50 mm between shoots, he found that main axis growth was promoted by decreased spacings. Although etiolation occurred when shoots were close together, there was no self-thinning and overall growth seemed to be optimal at or near the closest spacing tested. As a result, productivity was greatest in the most dense colonies (1000 shoots dm-2). Since growth occurs at the tip, there probably is very little effective light loss at these 5 mm spacings between plants, and water is conserved.
Figure 44. Rhytidiadelphus triquetrus. Photo by Janice Glime.

9-2-12 Chapter 9-2: Light: Adaptations for Shade
In fact, van der Hoeven and During (1997) found that when plots of three pleurocarpous mosses (Calliergonella cuspidata (Figure 45), Ctenidium molluscum (Figure 46), and Rhytidiadelphus squarrosus (Figure 47) were thinned by 50%, the original density returned rapidly, suggesting that density might be regulated by an intrinsic mechanism. Bates (1988) concluded that this dense packing is an indication of the advantage of reduced water loss in the more densely packed shoots and that this advantage outweighs the reduction in light. However, for Ctenidium molluscum, thinning to 50% caused increased growth, presumably due to increased photosynthesis, while its neighbors, Rhytidiadelphus squarrosus and Calliergonella cuspidata gained no advantage from the same thinning (van der Hoeven 1999). The differences in morphology may account for the success of C. molluscum following thinning, for it has dense, overlapping leaves, compared to the spreading leaves of R. squarrosus and large, slightly overlapping leaves of C. cuspidata. These mosses, after thinning, returned rather quickly to their original density. Like Bates (1988), Van der Hoeven and During (1997) suggested that they have an intrinsic control over their density.
Figure 45. Calliergonella cuspidata, demonstrating overlapping leaves on exposed, ascending shoots. Photo by Michael Lüth, with permission.
Figure 46. Ctenidium molluscum, demonstrating strongly overlapping leaves and branches. Photo by Michael Lüth, with permission.
Figure 47. Rhytidiadelphus squarrosus, demonstrating spreading leaves on ascending shoots. Photos by Michael Lüth, with permission.
Pedersen and coworkers (2001) tested this moisture/light trade-off using one acrocarpous (Dicranum majus, Figure 43) and two pleurocarpous (Ptilium crista-castrensis (Figure 48), Rhytidiadelphus loreus, Figure 49) mosses and a leafy liverwort (Plagiochila asplenioides, Figure 50). Using several controlled moisture and light levels, they determined that Dicranum majus and Rhytidiadelphus loreus had peak growth rates at intermediate densities where light and moisture were balanced, a relationship noted by Bergamini et al. (2001) as well. On the other hand, when the environment was either dark or humid, the effect of increased density was negative. Ptilium crista-castrensis exhibited decreased growth rates under most experimental combinations and Plagiochila asplenioides seemed to be unaffected. In all cases, it required light levels that were higher than in their natural spruce forest (Figure 53) habitat before the advantages of greater density were manifest, indicating that it is competition for light that limits optimal density, not low water availability. In a similar experiment, Scandrett and Gimingham (1989) found that Pleurozium schreberi (Figure 40-Figure 41), Hylocomium splendens (Figure 51), and Hypnum jutlandicum (Figure 52) likewise exhibited more intraspecific inhibition from crowding in low light than in high light, but yields were higher among sown fragments in low light.
Figure 48. Ptilium crista-castrensis, a species that seems to exhibit no growth rate change with changes in light and moisture levels. Photo by Janice Glime.

Chapter 9-2: Light: Adaptations for Shade 9-2-13
Figure 49. Rhytidiadelphus loreus with capsules, a species that has peak growth rates at intermediate densities where light and moisture are balanced. Photo by David Holyoak, with permission.
Figure 50. Plagiochila asplenioides, a species for which growth seems unaffected by light and moisture levels. Photo by Michael Lüth, with permission.
Figure 51. Hylocomium splendens, a species in which thinning increases branching. Photo by Michael Lüth, with permission.
One consequence of thinning seems to be increased branching (Rydgren et al. 1998; Pedersen et al. 2001). And it seems that in H. splendens (Figure 51), the increased light increases production of gametangia and subsequent sporophytes (Rydgren et al. 1998). This species had ten times as many sporophytes two years after half the bryophyte cover had been removed, compared to non-thinned plots.
Figure 52. Hypnum jutlandicum, a common gap species. Photo by Michael Lüth, with permission.
Figure 53. Picea mariana forest showing reduced light on the forest floor. Photo through Creative Commons.
We know that light is necessary to make new chlorophyll, and thus we might predict that there is a depth within a moss cushion at which the light attenuates beyond that needed for chlorophyll manufacture. Van der Hoeven, et al. (1993) found that chlorophyll concentration decreased down the shoot as light intensity decreased, but they considered that where only 50% of the shoot was green, the light intensity was too high to attribute the mortality of leaves to low light values. Skré and coworkers (1983), however, found that self-shading coincided with the transition from green to brown parts in Hylocomium splendens (Figure 51) and felt that light attenuation helped to explain the death of the green moss tissue.
Skré et al. (1983) showed (Figure 54) that in Hylocomium splendens, PAR (photosynthetically active radiation) at a depth of 3 cm in natural moss canopies is reduced to ~17%; to ~8% in Pleurozium schreberi (Figure 40-Figure 41); to ~12% in a mixed canopy of Pleurozium schreberi and Polytrichum commune (Figure 55); and to only 1% in Sphagnum subsecundum (Figure 56). Visnadi and Vital (1989) found that there were more species entangled among themselves in the indirect sunlight of the riverbank than in the river bed, where direct light was available, indicating that self-shading, and neighbor-shading, might not always be a bad thing.

9-2-14 Chapter 9-2: Light: Adaptations for Shade
Figure 54. Diminishing PAR in the moss clump. PcPs = Polytrichum commune and Pleurozium schreberi. Hs = Hylocomium splendens. Ps = Pleurozium schreberi. Ss = Sphagnum subsecundum. Figure redrawn from Skré et al. 1983.
Figure 55. Polytrichum commune, a species that is able to reduce the light available to Pleurozium schreberi. Photo by Christopher Tracey through Creative Commons, with permission.
Figure 56. Sphagnum subsecundum, a species that can reduce PAR to only 1% in 3 cm. Photo by Michael Lüth, with permission.
Chlorophyll Fluorescence
Chlorophyll fluorescence (light re-emitted by chlorophyll molecules during return from excited to non-excited states; Figure 57) is one measure of stress in leaves. This is expressed as the ratio of variable fluorescence (Fv = difference between the maximum and minimum fluorescence) to maximum fluorescence (Fm = fluorescence resulting from flashing a leaf in the dark with bright light), known as Fv/Fm. The ratio is usually about 80% efficiency; lower measures indicate stress.
Figure 57. Fontinalis antipyretica leaf showing red chlorophyll fluorescence. Photo by Janice Glime.
Rice et al. (2005) demonstrated that the Fv/Fm ratio decreased when three bryophytes [Bazzania trilobata (Figure 42), Sphagnum girgensohnii (Figure 60), Pleurozium schreberi (Figure 40-Figure 41)] were exposed to high light intensity, indicating stress. But in many bryophytes, while some leaves may be at stress levels, others may be at ideal levels. Using laser technology, Rice et al. developed a method to measure surface roughness and depth to first vertical canopy contact, thus permitting a more accurate measurement of light penetration and turbulence and providing a tool that may permit a better understanding of CO2 exchange.
Morphological Responses
It appears that, like tree leaves, bryophytes might respond structurally to differences in light levels. Dalby (1966b) compared the leaves of the tufa-forming moss Eucladium verticillatum (Figure 58-Figure 59) from deep shade with those from the open and found that those grown in deep shade had much broader leaves, not unlike the response seen in some tree species (Figure 61).
Figure 58. Eucladium verticillatum, a tufa-forming moss. Photo by Michael Lüth, with permission.

Chapter 9-2: Light: Adaptations for Shade 9-2-15
Figure 59. Eucladium verticillatum, a species that when grown in deep shade has much broader leaves. Photo by Michael Lüth, with permission.
Figure 60. Sphagnum girgensohnii, a species of peatland forests and Thuja swamps. Photo by Janice Glime.
At least some species exhibit a seasonal change in their light extinction curves that can be due to a change in leaf weight similar to that seen when tree leaves respond to high light. Calliergonella cuspidata (Figure 45), Ctenidium molluscum (Figure 46), and Rhytidiadelphus squarrosus (Figure 47) all exhibit a higher extinction coefficient in September than in December. In fact, the shoots are 1.5-2.1 times as heavy in September as in December, being so dense that the light intensity at the bottom of the plant approaches zero (van der Hoeven et al. 1993; Figure 62).
In culture, the thallose liverwort Marchantia paleacea var. diptera (Figure 63) exhibited an increase in growth rate with increasing light intensity over the range of 5.4 to 60 W m-2, whereas a significant decrease occurred at light intensities >60 W m-2. Many Sphagnum (Figure 15-Figure 19) species are high-light plants. In a growth study, weight increase of the species was greatest in unshaded conditions when the water table was low, but in shaded conditions, there was little difference with water table (Clymo 1973). However, when length was considered, plants of all Sphagnum species grew less in low water conditions, especially if they were also shaded – hardly an etiolation response.
Figure 61. Effect of light intensity on Eucladium verticillatum leaves. A and B from deep shade in Kimeridge, Dorset, England; C from open at Lyme Regis, Devon. Redrawn from Dalby 1966a.
Figure 62. Vertical profiles of light extinction (% of surface; solid line) and shoot area index (SAI, cm2/cm2; dashed line) of three mosses in September (n=3) and December (n=5). Redrawn from van der Hoeven et al. 1993.

9-2-16 Chapter 9-2: Light: Adaptations for Shade
Figure 63. Marchantia palacea var. diptera, a species that increases its growth rate with increasing light intensity. Photo by Janice Glime.
Physiological Adaptations to Low Light
Although bryophytes in general seem to be shade adapted, at least in their chlorophyll ratios, there are still differences among the species that adapt them to different habitats or give them a competitive edge. For example, Plagiomnium acutum (Figure 64) has greater capacity to absorb and use low light, giving it a greater photosynthetic assimilation efficiency than its associate Herpetineuron toccoae (Figure 65) in shady and wet habitats (Li et al 1999).
Figure 64. Plagiomnium acutum. Photo by Yingdi Liu, with permission.
Figure 65. Herpetineuron toccoae leafy plants with sporophytes. Photo with permission by Li Zhang at <www.hkflora.com>, with permission.
Buryová and Shaw (2005) affirmed that light treatments had a greater effect of growth and other characters of Philonotis fontana (Figure 66) than did water. Different populations, representing different genetic variants, exhibited different patterns of plasticity of form. Variation of leaf dimensions had a strong genetic component (20-30% of total variation), but cell dimensions (Figure 67) seemed to have little genetic variation.
Figure 66. Philonotis fontana, a species in which growth rate is affected by light intensity more than by water. Photo by Des Callaghan, with permission.
Figure 67. Philonotis fontana leaf lamina showing prorate cells. These cells have little genetic variation. Photo by Kristian Peters through Creative Commons.
But what are the characteristics that enhance photosynthesis in bryophytes? Waite and Sack (2010) examined ten Hawaiian bryophyte species and quantified 35 physiological and morphological traits. The moss species, typical of shade species, exhibited low leaf mass per area and low gas exchange rate. But their light-saturated photosynthetic rate per mass did not correlate with habitat light intensity. Instead, using canopy mass, not leaf mass, other photosynthetic parameters and morphological traits did correlate with microhabitat light characters. This relationship resulted in an inter-correlation of leaf area, cell size, cell wall thickness, and canopy density. Furthermore, structural allocations such as costa size, canopy height, and mass were linked with these modifications.

Chapter 9-2: Light: Adaptations for Shade 9-2-17
Chlorophyll
Bryophytes are C3 plants. As such, they are adapted to light capture at low light intensities. In tracheophytes, the primary adaptation to low light is to increase the antenna pigment chlorophyll b. This provides more opportunities to trap light energy reaching the leaf and to transmit it to the action site of chlorophyll a. Sluka (1983) supported the concept of increased chlorophyll concentrations at low light intensities in bryophytes by showing that total chlorophyll content of mosses is inversely proportional to light intensity. As in tracheophytes, it is chlorophyll b that increases in response to low light. Szarek (1994), working in the High Tatra Mountains of southern Poland, found that higher light intensities in the middle reaches of the stream did not have any effect on chlorophyll a concentrations of mosses compared to areas with less light.
In tracheophytes, this increase in chlorophyll b results in a lower a:b ratio. Thus, it is not surprising that bryophytes, as predominantly shade plants, typically have a low a:b ratio compared to tracheophytes. Mishler and Oliver (1991) reported a:b ratios of 1.00-2.5 for the xerophytic moss Syntrichia ruralis (Figure 36), a desiccation-tolerant moss that likewise has a higher chlorophyll concentration at low light intensities (Hamerlynck et al. 2002). Nevertheless, these a:b ratios, even for sun-grown plants, were typical of shade-adapted tracheophytes, whereas the carotenoid:chlorophyll ratio of sun plants was typical of sun-adapted tracheophytes. These acclimation responses reversed in a reciprocal transplant experiment, indicating that this species is capable of making short-term adjustments. Nevertheless, transplanted sun plants of S. ruralis did not perform as well in shade as did previously shade-grown plants. Hamerlynck et al. (2002) considered this to indicate that the sun-acclimated plants were able to maintain their photoprotective mechanisms, losing them only slowly, whereas the shaded plants were able to maintain activity longer, due to greater moisture, allowing them to adjust to changes rapidly following disturbance that exposed them to greater sunlight. This ability to adjust permits them to persist in their semi-arid grassland home.
Tuba (1987), as already discussed, has a different explanation. He suggests that these low a:b ratios are important because poikilohydric plants must depend on atmospheric moisture to regulate their internal water content and that such moisture is most typically available during periods of low light – during a storm or early morning. Since these plants are often desiccated during periods of high light levels, Tuba suggests that it is logical that their chlorophyll is adjusted to low light levels, but that having light compensation points slightly higher than those of shade-adapted tracheophytes permits bryophytes to benefit from occasional sunflecks.
It therefore comes as a surprise to find that the chlorophyll a:b ratio in many bryophytes does not decrease in response to low light, while the total chlorophyll increases. For example, in experiments on three species of the thallose liverwort Riccia, the highest chlorophyll concentrations occurred in the shade-grown Riccia discolor, and the lowest occurred in the floating aquatic species, Riccia fluitans (Figure 68), as one would expect. But surprisingly, the chlorophyll a:b ratios did not differ among the species (Patidar et al. 1986). In Sphagnum
fimbriatum (Figure 69), both chlorophyll a and chlorophyll b increased in dim light; in dim light at 25ºC, the a:b ratio increased only slightly, while at 15ºC, no such increase was observed (Koskimies-Soininen & Nyberg 1991). Similarly, Rincòn (1993) compared six species of bryophytes under seven different light conditions and found, as expected, that the total chlorophyll was highest at the lowest level of light, but that the chlorophyll a:b ratio did not differ significantly among the treatments.
Figure 68. Terrestrial form of Riccia fluitans. Photo by Michael Lüth, with permission.
Figure 69. Sphagnum fimbriatum, a species that increases both chlorophylls a and b in low light. Photo by J. K. Lindsey, with permission.
Yang and coworkers (1994) found that seventeen species of bryophytes at Yuan-Yang Lake in China had lower chlorophyll a:b ratios (mean 2.41) than the two aquatic tracheophytes sampled (mean 3.08), but that these bryophyte ratios were considerably higher than values for bryophytes reported in the literature. They considered this to be a demonstration of the ability of bryophytes to adjust their chlorophyll a:b ratio within a limited range to a higher light intensity (250 µmol m-2 s-1).
As discussed earlier in the study by Marschall and Proctor (2004), chlorophyll content seems to account for liverworts being more common in shade, with more mosses able to survive in bright, open areas. Pande and Singh 1987) found higher concentrations of both carotenoids and chlorophyll in liverworts, with the exception of Stephensoniella brevipedunculata, compared to mosses, but in this study liverworts all came from shade and mosses from open areas. Doera and Chaudhary (1991) examined
9-2-18 Chapter 9-2: Light: Adaptations for Shade
chlorophyll content of several bryophytes and found that chlorophyll a ranged 0.402 ± 0.052 to 2.002 ± 0.700 mg g-1 dry mass, with chlorophyll b ranging 0.265 ± 0.067 to 1.634 ± 0.070 mg g-1. Lowest chlorophyll concentrations were found in the moss Entodon prorepens (Figure 70) (0.667 mg g-1 dry mass) and highest in the liverwort Cyathodium tuberosum (Figure 71) (3.636 mg g-1 dry mass), consistent with the observations of Marschall and Proctor (2004). In these bryophytes, low light intensity resulted in increase in total chlorophyll content and lower chlorophyll a:b ratio. On the other hand, Antarctic populations of Ceratodon purpureus (Figure 12) can decrease chlorophyll a:b ratios in high light (Post 1990). Is it any surprise that these responses are not always the same, that they differ with species, temperature, moisture content, and light level?
Figure 70. Entodon prorepens, a species with low chlorophyll concentrations. Photo by Li Zhang, with permission.
Figure 71. Cyathodium cavernarum, a species with a high concentration of chlorophyll. Photo by M. C. Nair, through Creative Commons.
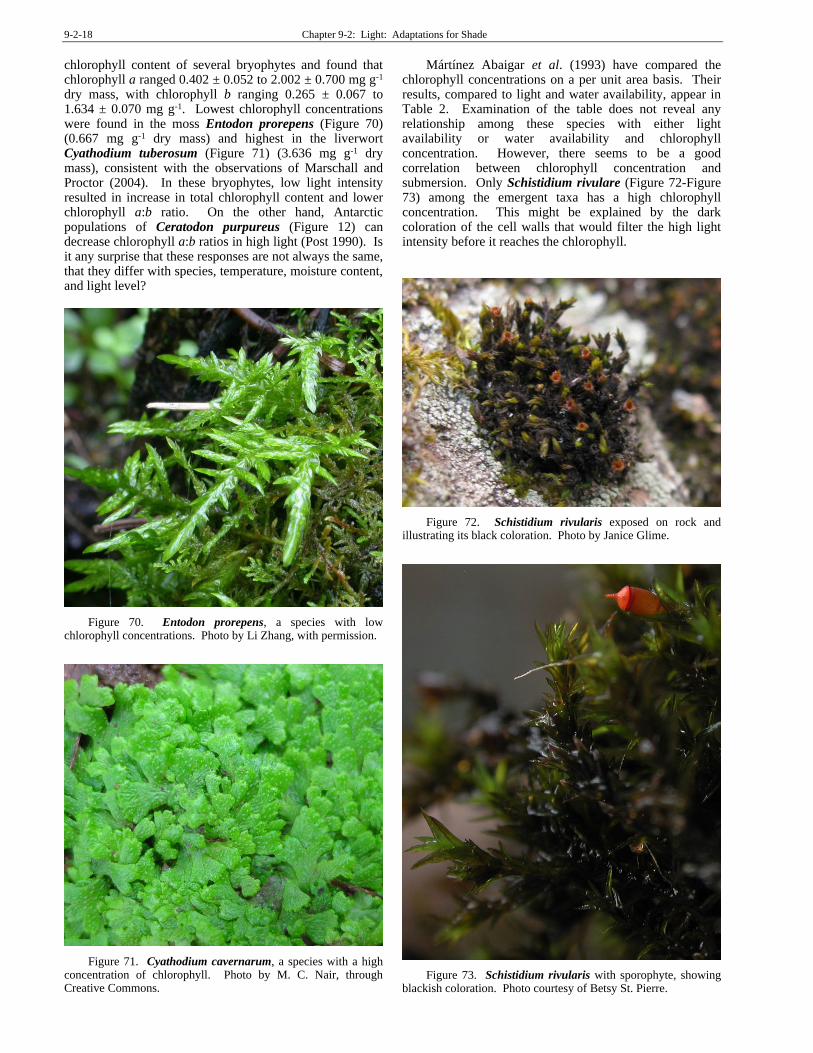
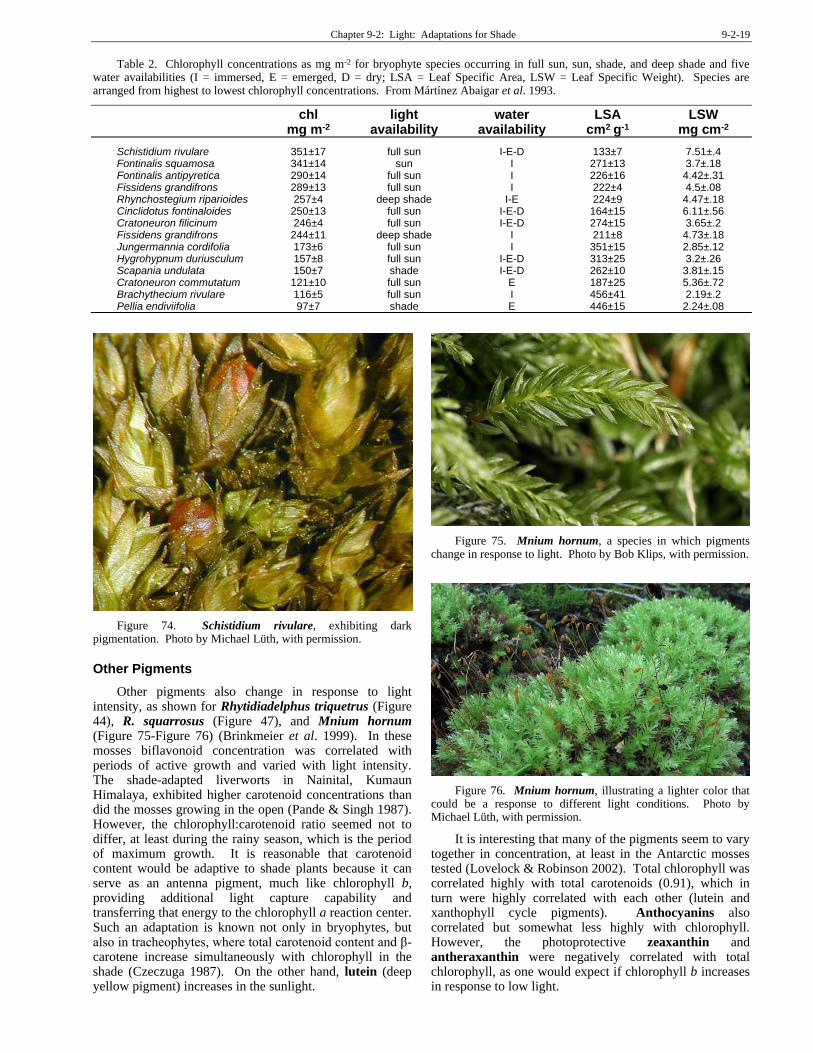
Mártínez Abaigar et al. (1993) have compared the chlorophyll concentrations on a per unit area basis. Their results, compared to light and water availability, appear in Table 2. Examination of the table does not reveal any relationship among these species with either light availability or water availability and chlorophyll concentration. However, there seems to be a good correlation between chlorophyll concentration and submersion. Only Schistidium rivulare (Figure 72-Figure 73) among the emergent taxa has a high chlorophyll concentration. This might be explained by the dark coloration of the cell walls that would filter the high light intensity before it reaches the chlorophyll.
Figure 72. Schistidium rivularis exposed on rock and illustrating its black coloration. Photo by Janice Glime.
Figure 73. Schistidium rivularis with sporophyte, showing blackish coloration. Photo courtesy of Betsy St. Pierre.
Chapter 9-2: Light: Adaptations for Shade 9-2-19
Table 2. Chlorophyll concentrations as mg m-2 for bryophyte species occurring in full sun, sun, shade, and deep shade and five water availabilities (I = immersed, E = emerged, D = dry; LSA = Leaf Specific Area, LSW = Leaf Specific Weight). Species are arranged from highest to lowest chlorophyll concentrations. From Mártínez Abaigar et al. 1993.
chl light water LSA LSW mg m-2 availability availability cm2 g-1 mg cm-2
Schistidium rivulare 351±17 full sun I-E-D 133±7 7.51±.4 Fontinalis squamosa 341±14 sun I 271±13 3.7±.18 Fontinalis antipyretica 290±14 full sun I 226±16 4.42±.31 Fissidens grandifrons 289±13 full sun I 222±4 4.5±.08 Rhynchostegium riparioides 257±4 deep shade I-E 224±9 4.47±.18 Cinclidotus fontinaloides 250±13 full sun I-E-D 164±15 6.11±.56 Cratoneuron filicinum 246±4 full sun I-E-D 274±15 3.65±.2 Fissidens grandifrons 244±11 deep shade I 211±8 4.73±.18 Jungermannia cordifolia 173±6 full sun I 351±15 2.85±.12 Hygrohypnum duriusculum 157±8 full sun I-E-D 313±25 3.2±.26 Scapania undulata 150±7 shade I-E-D 262±10 3.81±.15 Cratoneuron commutatum 121±10 full sun E 187±25 5.36±.72 Brachythecium rivulare 116±5 full sun I 456±41 2.19±.2 Pellia endiviifolia 97±7 shade E 446±15 2.24±.08
Figure 74. Schistidium rivulare, exhibiting dark pigmentation. Photo by Michael Lüth, with permission.
Other Pigments
Other pigments also change in response to light intensity, as shown for Rhytidiadelphus triquetrus (Figure 44), R. squarrosus (Figure 47), and Mnium hornum (Figure 75-Figure 76) (Brinkmeier et al. 1999). In these mosses biflavonoid concentration was correlated with periods of active growth and varied with light intensity. The shade-adapted liverworts in Nainital, Kumaun Himalaya, exhibited higher carotenoid concentrations than did the mosses growing in the open (Pande & Singh 1987). However, the chlorophyll:carotenoid ratio seemed not to differ, at least during the rainy season, which is the period of maximum growth. It is reasonable that carotenoid content would be adaptive to shade plants because it can serve as an antenna pigment, much like chlorophyll b, providing additional light capture capability and transferring that energy to the chlorophyll a reaction center. Such an adaptation is known not only in bryophytes, but also in tracheophytes, where total carotenoid content and β-carotene increase simultaneously with chlorophyll in the shade (Czeczuga 1987). On the other hand, lutein (deep yellow pigment) increases in the sunlight.
Figure 75. Mnium hornum, a species in which pigments change in response to light. Photo by Bob Klips, with permission.
Figure 76. Mnium hornum, illustrating a lighter color that could be a response to different light conditions. Photo by Michael Lüth, with permission.
It is interesting that many of the pigments seem to vary together in concentration, at least in the Antarctic mosses tested (Lovelock & Robinson 2002). Total chlorophyll was correlated highly with total carotenoids (0.91), which in turn were highly correlated with each other (lutein and xanthophyll cycle pigments). Anthocyanins also correlated but somewhat less highly with chlorophyll. However, the photoprotective zeaxanthin and antheraxanthin were negatively correlated with total chlorophyll, as one would expect if chlorophyll b increases in response to low light.

9-2-20 Chapter 9-2: Light: Adaptations for Shade
Several researchers have found that hydrated mosses, unlike tracheophytes, require only a few molecules of zeaxanthin per reaction center to dissipate light energy (Bukhov et al. 2001; Heber et al. 2005). Desiccation-dependent fluorescence quenching, however, is independent of zeaxanthin and appears to be a property of the reaction center complex of photosystem II rather than the antenna system.
Chloroplast Movement
In at least some mosses, the chloroplasts move in response to light direction. This ability of chloroplasts to orient themselves in response to direction of light, thus maximizing absorption of light energy, is known elsewhere in the plant kingdom. The green alga Mougeotia (Figure 77) has an axial chloroplast that can rotate on its axis to face the sun. Often the two ends seem to rotate independently so the chloroplast becomes twisted in the middle. The ferns Adiantum capillus-veneris (Figure 78), A. caudatum (Figure 79), A. diaphanum (Figure 80), and Pteris cretica (Figure 81) all exhibit chloroplast movement in their leaves, responding to blue light; A. capillus-veneris chloroplasts also responded to red light (Augustynowlcz & Gabrys 1999). The prothallus of the fern Dennstaedtia punctiloba (Figure 82-Figure 83), growing in lava caves, exhibits a luminescence similar to that seen in the moss Schistostega pennata (Figure 2-Figure 4) (Glime & Iwatsuki, pers. obs.). In Schistostega pennata, chloroplasts of the protonemata orient themselves to attain maximum light, as discussed in the light subchapter on cave mosses.
Figure 77. Mougeotia sp, a genus with a flat chloroplast that rotates on its axis to respond to position of incoming light. Photo by Yuuji Tsukii, with permission.
Figure 78. Adiantum capillus-veneris, a species in which leaf chloroplasts move in response to the direction and intensity of light. Photo by Tigerente, through Creative Commons.
Figure 79. Adiantum caudatum, a species in which leaf chloroplasts move in response to the direction and intensity of light. Photo by Guz Hengman, through Creative Commons.
Figure 80. Adiantum diaphanum, a species in which leaf chloroplasts move in response to the direction and intensity of light. Photo by Phil Bendle, with permission.
Figure 81. Pteris cretica, a species in which leaf chloroplasts move in response to the direction and intensity of light. Photo by Forest and Kim Starr, through Creative Commons.

Chapter 9-2: Light: Adaptations for Shade 9-2-21
Figure 82. Dennstaedtia punctilobula, a species in which the gametophyte prothallus chloroplasts move in response to the direction and intensity of light, giving them a luminescence similar to that of Schistostega pennata. Photo by John Knouse, through Creative Commons.
Figure 83. Dennstaedtia punctilobula luminescent prothalli from a lava cave in Iceland. Photo by Janice Glime.
In protonemata of the moss Physcomitrella patens (Figure 84), the direction of light, intensity, and wavelength are all important to chloroplast arrangement. When the light is perpendicular to the protonema axis the chloroplasts accumulate next to the crosswalls, but when it is parallel to the protonema axis, i.e. perpendicular to the crosswalls, there is no accumulation of chloroplasts there (Kadota et al. 2000). The response depends on the intensity, with lower intensities (red light 0.118 W m-2 or blue light 0.01-85.5 W m-2) inducing accumulation, whereas higher ones (red light > 60 W m-2 or blue light 285 W m-2) do not. These responses are mediated by phytochrome. But the protonemata of Physcomitrella patens respond not only to the direction of light (Kadota et al. 2000), but also to mechanical stimuli (Sato et al. 2003). This causes the chloroplasts to accumulate on the side of the cell where contact is made – in as little as 30 minutes! Could this be an adaptation to high light by placing the chloroplasts on the side next to the substrate and therefore on the side farthest from the light source? Such a position would provide more cytoplasm to serve as a filter from UV light and high light intensity. On the other hand, it would also permit the side toward the sun to act as a focussing lens. There is so much we don't know!
Figure 84. Physcomitrella patens plants with their protonemata on the left. Photo by Michael Lüth, with permission.
Movement of chloroplasts is a response to blue light intensity (Königer 2014). In low light, they spread out, maximizing light interception. In high light, they move to the sides of the cells in an avoidance reaction, minimizing light interception. But most mosses may be slower to react or not react at all. Physcomitrella patens (Figure 84) had no net change in light transmission under increasing blue light intensities up to one hour at 100 µmol photons m-2 s-1. The fern Adiantum capillus-veneris (Figure 78) likewise showed no accumulation response and only a slow avoidance response. The tracheophyte Arabidopsis thaliana (Figure 85), on the other hand, exhibited both strong accumulation and avoidance responses.
Figure 85. Arabidopsis thaliana, a species that exhibits both strong accumulation and avoidance responses to increasing levels of blue light. Photo by Nicole Hanley, through Creative Commons.

9-2-22 Chapter 9-2: Light: Adaptations for Shade
Light and Storage
The ultimate consequence of changing chlorophyll
concentrations and chloroplast position is an altered ability
to store photosynthate. Kobe and Silander (1993) have
shown that in four trees adapted to low light intensities,
survivorship of juveniles in low light conditions is
positively related to carbohydrate reserves and inversely
related to high-light growth. This demonstrates the
importance of storing carbohydrates as opposed to using all
of them for growth during periods of high light. Such
correlations have not been tested for bryophytes, but may
relate to storage of carbohydrates in the spring before the
canopy foliage appears for use of the developing
sporophyte during the summer and autumn. Kobe and
Silander contend that the trade-off between storage and
growth relates to survivorship in low-light habitats. Rincòn
and Grime (1989) have shown that production of biomass
is not correlated with shoot extension in five grassland
bryophytes, and that it in fact can be an inverse
relationship, with shoot extension occurring later, again
indicating the importance of storage. Could this be related
to the ability to store carbohydrates for use later in low
light when IAA may facilitate more elongation? (IAA is
inhibited by light in tracheophytes.)
In Sphagnum fimbriatum (Figure 87) low light caused
increased storage of total lipids (Koskimies-Soininen &
Nyberg 1991). However, in darkness, as one might expect,
lipid content decreased. When low light was accompanied
by a decrease in temperature, the moss stored more
palmitic, stearic, linoleic, and arachidonic acids in the
galactolipids monogalactosyl diglyceride (MGDG), i.e. the
chloroplast lipids. At the same time, oleic and α-linolenic
acids decreased. The MGDG lipids are important in cold
hardening and adjustment of plant metabolism to low
temperatures. For example, arachidonic acid has a freezing
point of -49.5oC (Gellerman et al. 1972), thus maintaining
membrane fluidity at any temperature these mosses are
likely to experience in nature. Karunen (1982) suggested
that the presence both of high quantities of angiospermous
type galactolipid fatty acids and the lowest quantities of
algal type in the aquatic moss Fontinalis (Figure 86) had
evolutionary significance in placing this as an advanced
genus, at least biochemically.
Figure 86. Fontinalis duriaei, a species with high quantities of flowering plant type galactolipid fatty acids and very low quantities of the algal type. Photo by Janice Glime.
Figure 87. Sphagnum fimbriatum. Photo by Michael Lüth, with permission.
One cannot generalize from these results, however.
When Koskimies-Soininen and Nyberg (1991) compared their results for the shade plant Sphagnum fimbriatum (Figure 87) with similar experiments on the high light species Sphagnum magellanicum (Figure 19), the responses to light and temperature were different. At low temperatures, S. fimbriatum does not increase its unsaturated glycolipids, reaching its lowest level at 10ºC, whereas S. magellanicum reaches its lowest level at 0ºC. In fact, we should expect differences among species, as these are the very things that make many species become species. For example, Li and coworkers (1999) compared photosynthesis of Plagiomnium acutum (Figure 64) and of Herpetineuron toccoae (Figure 65) under different weather conditions. Photosynthesis of P. acutum was lower on sunny days than that of H. toccoae, but on cloudy and rainy days it was higher. They determined that P. acutum has a higher CO2 assimilation efficiency in shady and wet habitats. Working with mosses on semi-arid granitic boulders, Alpert and Oechel (1987) also found that species occurring in microhabitats with lower light availability had a higher rate of net photosynthesis at low photon flux densities than did other mosses from that site, suggesting a higher chlorophyll concentration.
Based on the literature, it appears that photosynthetic rates of mosses are considerably less than those of tracheophytes. This is consistent with their slow growth rates. For example, in comparing the shade liverwort Marchantia polymorpha (Figure 88) with the sun moss Ceratodon purpureus (Figure 37), Aro and coworkers (1981) found that the plastid ultrastructures of these two bryophytes were characteristic of shade and sun plants respectively, but both exhibited the photosynthetic rates typical of shade plants. But Martin and Adamson (2001) disagree with the method of representing these determinations of photosynthetic rates in bryophytes. They found that indeed the CO2 uptake rate (i.e. photosynthetic rate) is much lower than that of tracheophytes when expressed per unit of biomass, but when they used the rate per chlorophyll concentration to compare maximum photosynthetic rates of bryophytes vs tracheophytes under the same conditions of light saturation and ambient CO2, the photosynthetic rates between bryophytes and tracheophytes did not differ (Shouldn't we expect that?)

Chapter 9-2: Light: Adaptations for Shade 9-2-23
The chlorophyll seems to behave the same way in both; it is the concentrations of chlorophyll that differ.
Figure 88. Marchantia polymorpha with archegoniophores, a shade plant with plastids characteristic of shade plants. Photo by Rudolf Macek, with permission.
Forest Gaps
Forest gaps are well known to foresters as sites where trees experience release growth, expressed in larger tree rings and greater annual production. Wayne and Bazzaz (1993) explored the relative effects of forest gaps compared to shadehouses on two species of birch [Betula populifolia (Figure 89) and B. alleghaniensis (Figure 90)] and found that leaf structure (specific leaf mass, leaf mass ratio) in shadehouses more closely resembled that of sun plants than did that of the gap-grown plants, but that gap-grown plants behaved more like sun plants in chlorophyll a:b ratios and maximum net photosynthesis.
Figure 89. Betula populifolia leaves, a forest gap species that exhibits chlorophyll a:b ratios and max net photosynthesis of sun plants when living in gaps. Photo by Richtid, through Creative Commons.
Figure 90. Betula alleghaniensis, a forest gap species that exhibits chlorophyll a:b ratios and max net photosynthesis of sun plants when living in gaps. Photo by Keith Kanoti, through Creative Commons.
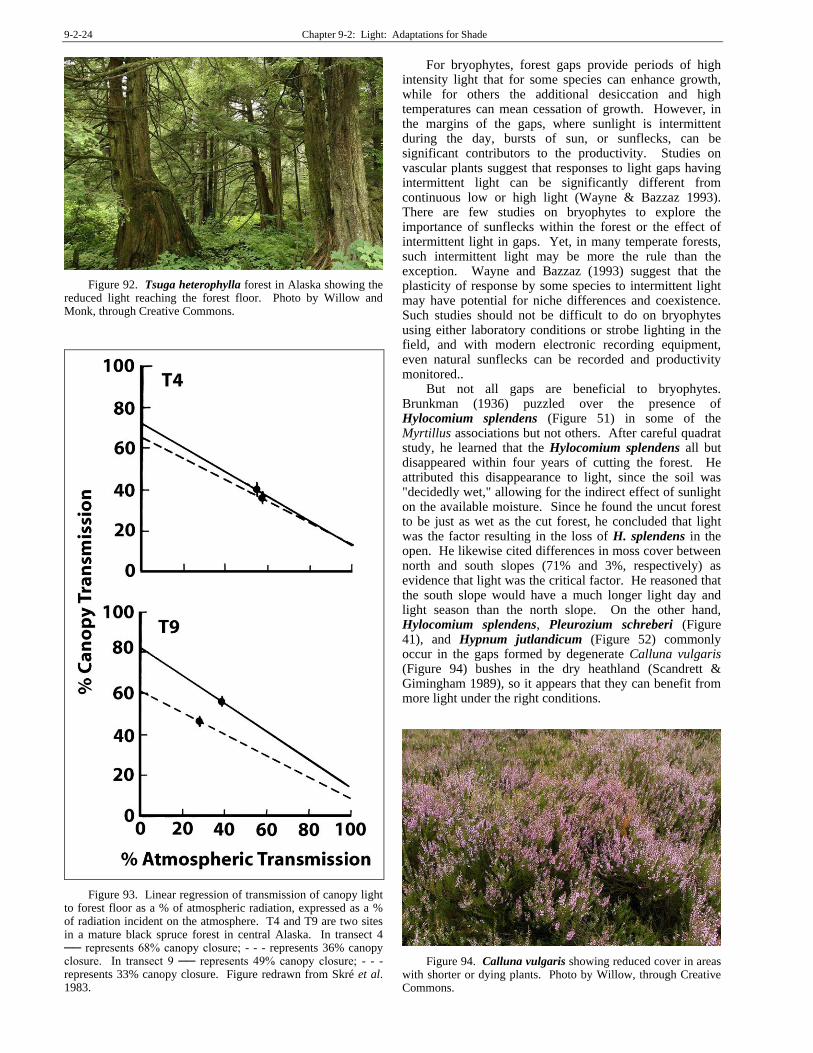
Despite their adaptations to low light, many bryophytes also benefit from the brighter spots in the forest. Even in the relatively open forest types like spruce (Figure 53), light attenuation between canopy and forest floor can be considerable (Figure 93) (Tuba & Nyilas 1980). In stands of Pseudotsuga menziesii (Figure 91) and Tsuga heterophylla (Figure 92) in Oregon, USA, bryophyte abundance increases in canopy gaps and other places with a higher irradiance within the forest (Rambo & Muir 1998).
Figure 91. Pseudotsuga menziesii & Pinus ponderosa forest showing difference in light at the top of the canopy and in lower parts of the canopy. Photo by Jsayre64, through Creative Commons.
9-2-24 Chapter 9-2: Light: Adaptations for Shade
Figure 92. Tsuga heterophylla forest in Alaska showing the reduced light reaching the forest floor. Photo by Willow and Monk, through Creative Commons.
Figure 93. Linear regression of transmission of canopy light to forest floor as a % of atmospheric radiation, expressed as a % of radiation incident on the atmosphere. T4 and T9 are two sites in a mature black spruce forest in central Alaska. In transect 4 ── represents 68% canopy closure; - - - represents 36% canopy closure. In transect 9 ── represents 49% canopy closure; - - - represents 33% canopy closure. Figure redrawn from Skré et al. 1983.
For bryophytes, forest gaps provide periods of high intensity light that for some species can enhance growth, while for others the additional desiccation and high temperatures can mean cessation of growth. However, in the margins of the gaps, where sunlight is intermittent during the day, bursts of sun, or sunflecks, can be significant contributors to the productivity. Studies on vascular plants suggest that responses to light gaps having intermittent light can be significantly different from continuous low or high light (Wayne & Bazzaz 1993). There are few studies on bryophytes to explore the importance of sunflecks within the forest or the effect of intermittent light in gaps. Yet, in many temperate forests, such intermittent light may be more the rule than the exception. Wayne and Bazzaz (1993) suggest that the plasticity of response by some species to intermittent light may have potential for niche differences and coexistence. Such studies should not be difficult to do on bryophytes using either laboratory conditions or strobe lighting in the field, and with modern electronic recording equipment, even natural sunflecks can be recorded and productivity monitored..
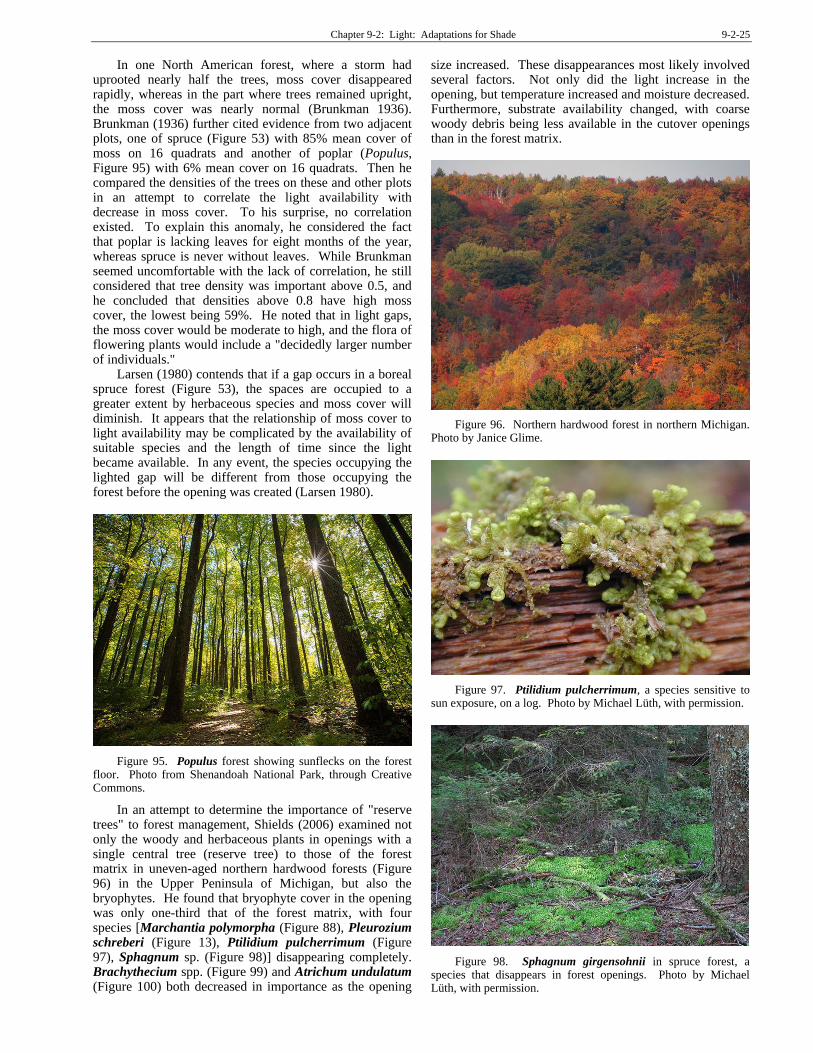
But not all gaps are beneficial to bryophytes. Brunkman (1936) puzzled over the presence of Hylocomium splendens (Figure 51) in some of the Myrtillus associations but not others. After careful quadrat study, he learned that the Hylocomium splendens all but disappeared within four years of cutting the forest. He attributed this disappearance to light, since the soil was "decidedly wet," allowing for the indirect effect of sunlight on the available moisture. Since he found the uncut forest to be just as wet as the cut forest, he concluded that light was the factor resulting in the loss of H. splendens in the open. He likewise cited differences in moss cover between north and south slopes (71% and 3%, respectively) as evidence that light was the critical factor. He reasoned that the south slope would have a much longer light day and light season than the north slope. On the other hand, Hylocomium splendens, Pleurozium schreberi (Figure 41), and Hypnum jutlandicum (Figure 52) commonly occur in the gaps formed by degenerate Calluna vulgaris (Figure 94) bushes in the dry heathland (Scandrett & Gimingham 1989), so it appears that they can benefit from more light under the right conditions.
Figure 94. Calluna vulgaris showing reduced cover in areas with shorter or dying plants. Photo by Willow, through Creative Commons.
Chapter 9-2: Light: Adaptations for Shade 9-2-25
In one North American forest, where a storm had uprooted nearly half the trees, moss cover disappeared rapidly, whereas in the part where trees remained upright, the moss cover was nearly normal (Brunkman 1936). Brunkman (1936) further cited evidence from two adjacent plots, one of spruce (Figure 53) with 85% mean cover of moss on 16 quadrats and another of poplar (Populus, Figure 95) with 6% mean cover on 16 quadrats. Then he compared the densities of the trees on these and other plots in an attempt to correlate the light availability with decrease in moss cover. To his surprise, no correlation existed. To explain this anomaly, he considered the fact that poplar is lacking leaves for eight months of the year, whereas spruce is never without leaves. While Brunkman seemed uncomfortable with the lack of correlation, he still considered that tree density was important above 0.5, and he concluded that densities above 0.8 have high moss cover, the lowest being 59%. He noted that in light gaps, the moss cover would be moderate to high, and the flora of flowering plants would include a "decidedly larger number of individuals."
Larsen (1980) contends that if a gap occurs in a boreal spruce forest (Figure 53), the spaces are occupied to a greater extent by herbaceous species and moss cover will diminish. It appears that the relationship of moss cover to light availability may be complicated by the availability of suitable species and the length of time since the light became available. In any event, the species occupying the lighted gap will be different from those occupying the forest before the opening was created (Larsen 1980).
Figure 95. Populus forest showing sunflecks on the forest floor. Photo from Shenandoah National Park, through Creative Commons.
In an attempt to determine the importance of "reserve trees" to forest management, Shields (2006) examined not only the woody and herbaceous plants in openings with a single central tree (reserve tree) to those of the forest matrix in uneven-aged northern hardwood forests (Figure 96) in the Upper Peninsula of Michigan, but also the bryophytes. He found that bryophyte cover in the opening was only one-third that of the forest matrix, with four species [Marchantia polymorpha (Figure 88), Pleurozium schreberi (Figure 13), Ptilidium pulcherrimum (Figure 97), Sphagnum sp. (Figure 98)] disappearing completely. Brachythecium spp. (Figure 99) and Atrichum undulatum (Figure 100) both decreased in importance as the opening
size increased. These disappearances most likely involved several factors. Not only did the light increase in the opening, but temperature increased and moisture decreased. Furthermore, substrate availability changed, with coarse woody debris being less available in the cutover openings than in the forest matrix.
Figure 96. Northern hardwood forest in northern Michigan. Photo by Janice Glime.
Figure 97. Ptilidium pulcherrimum, a species sensitive to sun exposure, on a log. Photo by Michael Lüth, with permission.
Figure 98. Sphagnum girgensohnii in spruce forest, a species that disappears in forest openings. Photo by Michael Lüth, with permission.

9-2-26 Chapter 9-2: Light: Adaptations for Shade
Figure 99. Brachythecium salebrosum, a species that decreases in importance in forest gaps. Photo by Michael Lüth, with permission.
Figure 100. Atrichum undulatum, a species that decreases in importance in forest gaps. Photo by Michael Lüth, with permission.
Sunflecks
Sunflecks (Figure 95; Figure 101), those tiny patches of bright light that dance about on the forest floor, have reached a new level of importance in our understanding of forest floor dynamics. Skré et al. (1983) found that up to 35% of the forest floor in a black spruce (Picea mariana, Figure 53) forest in central Alaska could experience sunflecks at the midday soil surface. These flecks usually had an intensity ~76% that of the light reaching the forest canopy and were the major source of light for bryophytes there. Such sunflecks are known to provide for photosynthesis in exposed parts of clones with the resultant photosynthate translocated to shaded parts of the connected clone internally.
For bryophytes, sunflecks have an advantage over full sunlight because of that intermittence (remember how we measure Vmax? The least disturbance of the canopy changes their position, thus striking different branches or patches of bryophytes. For a photosynthetic bryophyte leaf, this means relief from the constant bombardment of light energy on the chlorophyll molecules and prevents these low-light adapted plants from suffering from excitation damage. The light dances about from ramet to ramet as it does from leaf to leaf on the trees. Rincòn and
Grime (1989) found sunflecks to be very important for six bryophytes from a variety of habitats and referred to the ability of bryophytes to be plastic in rate and direction of shoot proliferation as a "foraging" mechanism that permitted them to exploit resources where they became available, in this case, sunflecks. Bergamini and Peintinger (2002) found a similar foraging behavior in Calliergonella cuspidata (Figure 102) and contended that pleurocarpous mosses have a morphological strategy comparable to the "spacer and branching" strategy of some stoloniferous tracheophytes. Even such upright mosses as Polytrichum are known to have interconnected ramets that translocate photosynthate to one another.
Figure 101. Hylocomium splendens in a sunfleck. Photo courtesy of Carrie Andrew.
In the heavily shaded sites of New Zealand, the hornwort Megaceros pellucidus (Figure 103) experiences a maximum photon flux density of less than 10 μmol m-2 s-1 (Watkins et al. 2011). Daylight sees only weak variation in intensity. The dense canopy provides little opportunity for sunflecks. Interestingly, hornworts from low light conditions (0.2 μmol m-2 s-1) had the same carotenoid concentrations as those from higher light conditions (6.9 μmol m-2 s-1), but the chlorophyll content of high light plants was approximately 2X that of low light plants, whereas the chlorophyll a/b ratio was the same in both low and higher light conditions. A significant difference is that in low light the hornworts exhibited an absorbance band at 340 nm that was not present in the higher light conditions.
Figure 102. Calliergonella cuspidata with lateral branching pattern that permits foraging of the sunlight. Photo by Michael Lüth, with permission.

Chapter 9-2: Light: Adaptations for Shade 9-2-27
Figure 103. Megaceros pellucidus, a species that lives in very low light levels in New Zealand forests. Photo by Scott Zona, through Creative Commons.
Litter Burial
Of course the most drastic effect of the forest canopy
on the bryophytes of the forest floor is the virtually total
loss of light caused by leaf litter (Figure 1). Although there
may be allelopathic effects from the decomposition of
leaves that leads to the release of tannins, loss of light is
ultimate death to nearly every plant. Johnsen (1959)
demonstrated the severity of litter on bryophytes by
showing that raking away litter can greatly increase both
number of species and cover of bryophytes on the forest
floor. It is the leaf litter that relegates the bryophytes to the
steep slopes, tip-up mounds, and other places where leaf
litter cannot easily accumulate.
The Partnership Choice
While many bryophytes suffer from self-shading that
prevents the lower leaves from photosynthesizing, one
species actually lives in that shaded habitat, receiving little
or no light due to the surrounding moss vegetation. This
species is the thallose liverwort Cryptothallus mirabilis
(Figure 104). Its name tells much of its story, for it is
indeed a hidden thallus, growing beneath the surface in
peat, raw humus, or moss carpets (Schofield 1985), yet
miraculously surviving in the darkness there. It is totally
lacking in chlorophyll (Potemkin 1992); even its spores
lack chlorophyll (Hill 1969). It obtains its carbon through a
fungal partnership (Malmborg 1933; Airy Shaw 1949;
Ligrone et al. 1993; Bidartondo et al. 2003), although it
may not contribute anything to the relationship. It appears
that it subsists much like the flowering Indian pipe
(Monotropa uniflora, Figure 105), actually being a third
member in a parasitic relationship with trees, including
Betula (Figure 89-Figure 90), that reach the canopy to
convert light energy into stored energy in the photosynthate
(Bidartondo et al. 2003). The photosynthate is transferred
from the tree to the fungus to the liverwort.
Figure 104. Cryptothallus mirabilis with sporophytes protruding from its peat substrate. This liverwort completely lacks chlorophyll and depends on a fungus to obtain its energy. Photo by Michael Lüth, with permission.
Figure 105. Monotropa uniflora, a hemiparasitic flowering plant that uses a fungus to connect to carbon sources. Photo by Magellan, through Creative Commons.
Summary
In general, bryophytes are adapted to low light, relative to other land plants. Bryophyte cells may act as lens cells, at least in some cases, focussing light on the chloroplasts or even on leaves beneath them. Branches may behave like leaves in scattering, focussing, and reflecting light while providing air spaces that give access to CO2. Papillae may serve to scatter light when the leaves are dry or to channel it like a fiber optic when wet. But these are all speculations.
The leaf area index (LAI) of bryophytes appears to be enormous compared to that of tracheophytes (44-129 compared to 3.8 for the forest floor taxa). Perhaps

9-2-28 Chapter 9-2: Light: Adaptations for Shade
the branch should be considered instead of the leaves of bryophytes. This same density of leaves results in considerable self-shading, with rapid light extinction within a moss cushion. Light often penetrates deeper in dry mosses, in some cases reaching a level where sufficient hydration exists for photosynthetic activity. Chlorophyll likewise diminishes with depth in a cushion, but this may be a function of age rather than light intensity, at least in some species. Dense packing of stems does not usually seem to deter vertical growth and may actually enhance it through greater conservation of water, despite the attenuation of light. On the other hand, densely overlying mosses seem to benefit from thinning that exposes underlying branches to more light. It appears that light is more important than hydration at determining optimal density.
As in tracheophytes, leaf morphology may respond to shade by such changes as broader leaves. Even leaf weight may decrease as less light becomes available. Other responses to low light are similar to those of tracheophytes, with increased chlorophyll b and antenna pigments, depressed light saturation and compensation points, and deeper green color. However, some bryophytes at least do not have a lower chlorophyll a:b ratio in low light compared to high light, as would the typical tracheophyte. Rather, bryophytes in general have a lower chlorophyll a:b ratio in all light conditions than do tracheophytes. This suggests that the bryophyte, with its chlorophyll a concentrations maintaining proportionality to chlorophyll b concentrations, would be ready for brief opportunities when bright light becomes available. Such a strategy would adapt these plants well to the forest habitat where so many are residing, permitting them to take advantage of changing positions of the sun as it filters through trees and brief bursts of light as sunflecks when angle of the sun changes or the wind changes the arrangement of the overarching canopy. These same adaptations would likewise permit mosses intertwined with grasses to one day be covered by a stem, but a few weeks later have grown past it to receive full light. Accessory antenna pigments such as carotenoids increase with chlorophyll b.
Some species have chloroplasts that move in response to direction of light, maximizing light absorption. In Physcomitrella patens, chloroplasts accumulate on the side of the protonema where contact is made, presumably giving them maximum protection from light.
Reduction in photosynthesis in low light has its price in reduced storage of photosynthate. In bryophytes, storage can occur without growth, with growth occurring later based on stored reserves. Low light can also increase storage of lipids and temperature can alter the types of lipids being stored. Such adaptations differ among species, especially between sun and shade species.
Sunflecks provide bryophytes with bursts of bright light without the damaging effects of continuous bombardment of UV light and high light intensity on shade-adapted plants. Particularly in pleurocarpous mosses, the many branches provide "foraging" opportunities that permit production of photosynthate
that can be translocated to other parts of the clone. Even the upright Polytrichum is able to translocate photosynthate from one stem to another in ramets of one connected clone.
Litterfall can completely bury bryophytes and put them in nearly total darkness. However, some bryophytes may benefit from litter in low-light conditions by forming fungal partnerships that acquire photosynthate from the surrounding leaf litter through this the fungus.
Acknowledgments
My appreciation to all the photographers who have given me permission to use their images, or who have put them in Creative Commons.
Literature Cited Alpert, P. and Oechel, W. C. 1987. Comparative patterns of net
photosynthesis in an assemblage of mosses with contrasting microdistributions. Amer. J. Bot. 74: 1787-1796.
Aro, E.-M., Niemi, H., and Valanne, N. 1981. Photosynthetic studies on two ecologically different bryophytes. In: Akoyunoglou, G. (ed.). Photosynthesis III. Structure and Molecular Organization of the Photosynthetic Apparatus. Balaban International Science Services, Philadelphia, pp. 327-335.
Asner, G. P., Scurlock, J. M., and Hicke, J. A. 2003. Global synthesis of leaf area index observations: Implications for ecological and remote sensing studies. Global Ecol. Biogeogr. 12: 191-205.
Augustynowlcz, J. and Gabrys, H. 1999. Chloroplast movements in fern leaves: Correlation of movement dynamics and environmental flexibility of the species. Plant Cell Environ. 22: 1239-1248.
Bakken, S. 1995. Effects of nitrogen supply and irradiance on growth and nitrogen status in the moss Dicranum majus from differently polluted areas. J. Bryol. 18: 707-721.
Bates, J. W. 1988. The effect of shoot spacing on the growth and branch development of the moss Rhytidiadelphus triquetrus. New Phytol. 109: 499-504.
Bergamini, A. and Peintinger, M. 2002. Effects of light and nitrogen on morphological plasticity of the moss Calliergonella cuspidata. Oikos 96: 355-363.
Bergamini, A., Pauli, D., Peintinger, M., and Schmid, B. 2001. Relationships between productivity, number of shoots and number of species in bryophytes and vascular plants. J. Ecol. 89: 920-929.
Bidartondo, M. I., Bruns, T. D., Weiss, M., Sergio, C., and Read, D. J. 2003. Specialized cheating of the ectomycorrhizal symbiosis by an epiparasitic liverwort. Proc. Royal Soc. Lond., Ser. B: Biol. Sci. 270: 835-842.
Binzer, T. and Sand-Jensen, K. 2002. Importance of structure and density of macroalgae communities (Fucus serratus) for photosynthetic production and light utilisation. Marine Ecol. Prog. Ser. 235: 53-62.
Brinkmeier, E., Hahn, H., Seeger, T., Geiger, H., and Zinsmeister, H. D. 1999. Jahreszeitliche schwankungen von flavonoidgehalten in Laubmoosen. [Seasonal variations of flavonoid concentrations in mosses.]. Biochem. Syst. Ecol. 27: 427-435.

Chapter 9-2: Light: Adaptations for Shade 9-2-29
Brunkman, A. H. 1936. Mosses in relation to Cajander theory of forest types. Forest. Chron. 12: 300-314.
Bubier, J. L., Rock, B. N., and Crill, P. M. 1997. Spectral reflectance measurements of boreal wetland and forest mosses. J. Geophys. Res. 102: 29483-29494.
Bukhov, N. G., Kopecky, J., Pfündel, E. E., Klughammer, C., and Heber, U. 2001. A few molecules of zeaxanthin per reaction centre of photosystem II permit effective thermal dissipation of light energy in photosystem II of a poikilohydric moss. Planta 212: 739-748.
Buryová, B. and Shaw, A. J. 2005. Phenotypic plasticity in Philonotis fontana (Bryopsida: Bartramiaceae). J. Bryol. 27: 13-22.
Chen, J. M., Liu, J., Leblanc, S. G., Lacaze, R., and Roujean, J.-L. 2003. Multi-angular optical remote sensing for assessing vegetation structure and carbon absorption. Remote Sens. Environ. 84: 516-525.
Clymo, R. S. 1973. The growth of Sphagnum: some effects of environment. J. Ecol. 61: 849-869.
Crandall-Stotler, B. J. and Bozzola, J. J. 1991. Ontogeny, structure and function of leaf cell papillae in the moss Andreaeobryum macrosporum. Amer. J. Bot. 78(6, suppl.): 4-5.
Czeczuga, B. 1987. Carotenoid contents in leaves grown under various light intensities. Biochem. Syst. Ecol. 15: 523-527.
Dalby, D. H. 1966a. The growth of Eucladium verticillatum in a poorly illuminated cave. Rev. Bryol. Lichénol. 34: 929-930.
Dalby, D. H. 1966b. The growth of plants under reduced light. Stud. Speleol. 1: 193-203.
Davey, M. C. and Ellis-Evans, J. C. 1996. The influence of water content on the light climate within Antarctic mosses characterized using an optical microprobe. J. Bryol. 19: 235-242.
DeLucia, E. H., Nelson, K., Vogelmann, T. C., and Smith, W. K. 1996. Contribution of intercellular reflectance to photosynthesis in shade leaves. Plant Cell Environ. 19: 159-170.
Doera, G. S. and Chaudhary, B. L. 1991. Chlorophyll content in some bryophytes. Indian Bot. Contract. 8: 95-97.
Duarte-Silva, A. G., Carvalho-Silva, M., and Câmara, P. E. A. S. 2013. Morphology and development of leaf papillae in the Pilotrichaceae. Acta Bot. Brasil.: 27: 737-742.
Gellerman, J. L., Anderson, W. H., and Schlenk, H. 1972. Highly unsaturated lipids of Mnium, Polytrichum, Marchantia, and Matteuccia. Bryologist 75: 550-557.
Hamerlynck, E. I., Csintalan, Z., Nagy, Z., Tuba, Z., Goodin, D., and Henebry, G. I. 2002. Ecophysiological consequences of contrasting microenvironments on the desiccation tolerant moss Tortula ruralis. Oecologia 131: 498-505.
Heber, U., Hedrich, R., and Shuvalov, V. A. 2005. Mechanisms of phototolerance in higher plants and poikilohydric organisms. Accessed 12 July 2005 at http://www.biozentrum.uni-wuerzburg.de/fileadmin/REPORT/BOT1/bot1004.htm.
Hill, D. J. 1969. The absence of chlorophyll in the spores of Cryptothallus mirabilis Malmb. Trans. Brit. Bryol. Soc. 5: 818-819.
Hoeven, E. C. van der. 1999. Reciprocal transplantations of three chalk grassland bryophytes in the field. Lindbergia 24: 23-28.
Hoeven, E. C. van der and During, H. J. 1997. The effect of density on size frequency distributions in chalk grassland bryophyte populations. Oikos 80: 533-539.
Hoeven, E. C. van der, Huynen, C. I. J., and During, H. J. 1993. Vertical profiles of biomass, light intercepting area and light intensity in chalk grassland mosses. J. Hattori Bot. Lab 74: 216-270.
Johnsen, T. N. Jr. 1959. Terrestrial cryptogams in a pine woodland with and without litter. Bryologist 62: 35-41.
Kadota, A., Sato, Y., and Wada, M. 2000. Intracellular chloroplast photorelocation in the moss Physcomitrella patens is mediated by phytochrome as well as by a blue-light receptor. Planta 210: 932-937.
Karunen, P. 1982. Possible evolutionary significance of galactolipid fatty acids in Bryophyta. J. Hattori Bot. Lab. 53: 255-269.
Kobe, R. K. and Silander, J. A. Jr. 1993. Carbohydrate storage as a mechanism of shade tolerance. Bull. Ecol. Soc. Amer. Program and Abstracts, Suppl. vol 74(2): 314. 78th Ann. ESA Meeting, 31 July - 4 August 1993.
Königer, M. 2014. Chloroplast movement in higher plants, ferns and bryophytes: A comparative point of view. In: Hanson, D. T. and Rice, S. K. (eds.). Photosynthesis in Bryophytes and Early Land Plants. Advances in Photosynthesis and Respiration 37: 113-130.
Koskimies-Soininen, K. and Nyberg, H. 1991. Effects of temperature and light on the glycolipids of Sphagnum fimbriatum. Phytochemistry 30: 2529-2536.
Larcher, W. 1983. Physiological Plant Ecology, corrected printing of the second printing. Springer-Verlag, New York, 303 pp.
Larcher, W. 1995. Physiological Plant Ecology. Springer, Berlin, 506 pp.
Larsen, J. A. 1980. The Boreal Ecosystem. Academic Press, New York, 500 pp.
Lawton, R. O. and Putz, F. E. 1988. Natural disturbance and gap-phase regeneration in a wind-exposed tropical cloud forest. Ecology 69: 764-777.
Li, J., Liu, Y., Cao, T., Who, Y., and Shi, J. 1999. A comparative study on ecophysiological characteristics of the two overwintering host mosses of gallaphids. Nova Hedw. 68: 233-240.
Ligrone, R., Pocock, K., and Duckett, J. G. 1993. A comparative ultrastructural study of endophytic Basidiomycetes in the parasitic achlorophyllous hepatic Cryptothallus mirabilis and the closely allied photosynthetic species pinguis (Metzgeriales). Can. J. Bot. 71: 666-679.
Lovelock, C. E. and Robinson, S. A. 2002. Surface reflectance properties of Antarctic moss and their relationship to plant species, pigment composition and photosynthetic function. Plant Cell Environ. 25: 1239-1250.
Malmborg, S. 1933. Cryptothallus nov. gen. ein saprophytisches Lebermoos. Ann. Bryol. 6: 122-123.
Marschall, M. and Proctor, M. C. 2004. Are bryophytes shade plants? Photosynthetic light responses and proportions of chlorophyll a, chlorophyll b and total carotenoids. Ann. Bot. 94: 593-603.
Martin, C. E. and Adamson, V. J. 2001. Photosynthetic capacity of mosses relative to vascular plants. J. Bryol. 23: 319-323.
Mártínez Abaigar, J., Núñez Olivera, E., and Sánchez-Díaz, M. 1993. Effects of organic pollution on transplanted aquatic bryophytes. J. Bryol. 17: 553-566.
Mishler, B. D. and Oliver, M. J. 1991. Gametophytic phenology of Tortula ruralis, a desiccation-tolerant moss, in the Organ Mountains of southern New Mexico. Bryologist 94: 143-153.
Niinemets, Ü. and Tobias, M. 2014. Scaling light harvesting from moss "leaves" to canopies. In: Hanson, D. T. and

9-2-30 Chapter 9-2: Light: Adaptations for Shade
Rice, S. K. (eds.). Photosynthesis in Bryophytes and Early Land Plants. Advances in Photosynthesis and Respiration 37: 113-130.
Pande, N. and Singh, J. S. 1987. Pigment concentration of ten bryophytes from Nainital, Kumaun Himalayas. Proc. Indian Acad. Sci. 97(1): 75-79
Patidar, K. C., Solanki, C. M., and Kaul, A. 1986. Chlorophyll concentration and a/b ratios in response to habitats in three species of Riccia. Yushania 3(4):1-4.
Pedersen, B., Hanslin, H. M., and Bakken, S. 2001. Testing for positive density-dependent performance in four bryophyte species. Ecology 82: 70-88.
Post, A. 1990. Photoprotective pigment as adaptive strategy in the Antarctic moss Ceratodon purpureus. Polar Biol. 10: 241-245.
Potemkin, A. D. 1992. The achlorophyllous mycotrophic liverwort Cryptothallus mirabilis (Aneuraceae, Hepaticae) in the neighborhood of Leningrad. Bot. Zhurn. 77(1): 78-83.
Proctor, M. C. F. 1982. Physiological ecology: Water relations, light and temperature responses, carbon balance. In: Smith, A. J. E. (ed.). Bryophyte Ecology. Chapman and Hall, London, pp. 333-381.
Rambo, T. R. and Muir, P. S. 1998. Forest floor bryophytes of Pseudotsuga menziesii-Tsuga heterophylla stands in Oregon: Influences of substrate and overstory. Bryologist 101: 116-130.
Rice, S. K. and Cornelissen, J. H. C. 2014. Best practices for measuring photosynthesis at multiple scales. In: Hanson, D. T. and Rice, S. K. (eds.). Photosynthesis in Bryophytes and Early Land Plants. Advances in Photosynthesis and Respiration 37: 79-93.
Rice, S. K., Gutman, C., and Krouglicof, N. 2005. Laser scanning reveals bryophyte canopy structure. New Phytol. 166: 695-704.
Rice, S. K., Hanson, D. T., and Portman, Z. 2014. Structural and functional analyses of bryophyte canopies. In: Hanson, D. T. and Rice, S. K. (eds.). Photosynthesis in Bryophytes and Early Land Plants. Advances in Photosynthesis and Respiration 37: 173-185.
Rincòn, E. 1993. Growth responses of six bryophyte species to different light intensities. Can. J. Bot. 71: 661-665.
Rincòn, E. and Grime, J. P. 1989. Plasticity and light interception by six bryophytes of contrasted ecology. J. Ecol. 77: 439-446.
Rydgren, K., Økland, R. H., and Økland, T. 1998. Population biology of the clonal moss Hylocomium splendens in Norwegian boreal spruce forests. 4. Effects of experimental fine-scale disturbance. Oikos 82: 5-19.
Sato, Y., Wada, M., and Kadota, A. 2003. Accumulation response of chloroplasts induced by mechanical stimulation in bryophyte cells. Planta 216: 772-777.
Scandrett, A. and Gimingham, C. H. 1989. Experimental investigation of bryophyte interactions on a dry heathland. J. Ecol. 77: 838-852.
Schleppi, P., Muller, N., Edwards, P. J., and Bucher, J. B. 1999. Three years of increased nitrogen deposition do not affect the
vegetation of a montane forest ecosystem. Phyton 39: 197-204.
Schofield, W. B. 1985. Introduction to Bryology. Macmillan Publishing Co., New York, 431 pp.
Shaw, H. K. 1949. A saprophytic liverwort. Nature (London) 164: 64.
Shields, J. M. 2006. Herbaceous layer response to green-tree retention and silvicultural opening size in managed northern hardwoods. In: Initial Effects of Group-selection Harvesting with Seed-tree Retention on Biodiversity in Northern Hardwoods. M. S. Thesis, Michigan Technological University, Houghton, pp. 39-86.
Simon, T. 1987. The leaf-area index of three moss species (Tortula ruralis, Ceratodon purpureus, and Hypnum cupressiforme). Symp. Biol. Hung. 35: 699-706.
Skré, O., Oechel, W. C., and Miller, P. M. 1983. Moss leaf water content and solar radiation at the moss surface in a mature black spruce forest in central Alaska. Can. J. Forest Resources 13: 860-868.
Sluka, Z. A. 1983. The dependence of the chlorophyll content and the leaf-area of mosses on the ecological conditions. Vestnik Moskovskogo Universiteta. Biologiya 37(3): 24-29.
Szarek, E. 1994. The effect of abiotic factors on chlorophyll a in attached algae and mosses in the Sucha Woda stream (High Tatra Mts, southern Poland). Acta Hydrobiol. 36: 309-322.
Tobias, M and Niinemets, U. 2010. Acclimation of photosynthetic characteristics of the moss Pleurozium schreberi to among-habitat and within-canopy light gradients. Plant Biol. 12: 743-754.
Tuba, Z. 1987. Light, temperature and desiccation responses of CO2-exchange in the desiccation-tolerant moss, Tortula ruralis. Symp. Biol. Hung. 35: 137-149.
Tuba, Z. and Nyilas, J. 1980. Correlation between the vertical light and photosynthetical pigment structure of a multilayer community (turkey-oak forest). Acta Bot. Acad. Sci. Hung. 26: 447-454.
Visnadi, S. R. and Vital, D. M. 1989. Briófitas rupícolas de um trecho do Rio Bethary, Iporanga, Estado de Sao Paulo. Acta Bot. Bras. 3(2): 179-183.
Waite, M. and Sack, L. 2010. How does moss photosynthesis relate to leaf and canopy structure? Trait relationships for 10 Hawaiian species of contrasting light habitats. New Phytol. 185: 156-172.
Watkins, R. L. S., Outred, H. A., Rowland, R. E., and Brown, S. C. 2011. Light environment and pigment composition of Megaceros pellucidus. Extreme Life, Biospeology and Astrobiology 3(1) ISSN 2067-6360.
Wayne, P. M. and Bazzaz, F. A. 1993. Birch seedling responses to daily time courses of light in experimental forest gaps and shadehouses. Ecology 74: 1500-1515.
Yang, C.-M., Hsu, J.-C., and Shih, C.-F. 1994. Response of chlorophyll a/b ratios in Yuan-Yang Lake bryophytes to the alteration of light intensity. Proceedings of the National Science Council, Republic of China. Part B Life Sci. 18(3): 134-137.